 Guangnian Xiao
 Wenya Cui
95% of researchers rate our articles as excellent or good
Learn more about the work of our research integrity team to safeguard the quality of each article we publish.
Find out more
ORIGINAL RESEARCH article
Front. Mar. Sci. , 22 February 2023
Sec. Marine Affairs and Policy
Volume 10 - 2023 | https://doi.org/10.3389/fmars.2023.1132174
This article is part of the Research Topic Global Vessel-Source Maritime Pollution Governance—Technical Innovation and Policy Orientation View all 14 articles
With the opening of the national carbon trading market and the coming of the post-epidemic era, the government actively promotes the carbon quota policy to fundamentally achieve carbon emission reduction. This paper corresponds the shipping cycle to the shipping market demand situation during the epidemic, incorporates the shipping cycle characteristics and government quota characteristics into a multi-stage evolutionary game model. Later, the study analyzes the equilibrium points of the game parties at each stage and finally investigates the influence of factors such as technological improvement on the strategy choice of shipping enterprises through sensitivity analysis. The study found that the government’s carbon quota policy is influenced by shipping market demand. During the peak shipping season, the government’s quota policy is binding on shipping enterprises. In the low season of shipping, the binding effect of government’s quota policy on shipping enterprises will be reduced, or even appear to be invalid. Therefore, the government should forecast the demand situation of the shipping market, gradually relax the regulation during the peak season of shipping, and strengthen the regulation before the low season of shipping. Shipping enterprises should increase the research and development of carbon emission reduction technology to reduce carbon emissions from the root to realize the sustainable development of ports and marine-related industries in the post-epidemic era.
Ports are important nodes in the cargo transportation process (Yin et al., 2021), which plays an important role in economic growth. However, the carbon emissions from ports are high. This issue has attracted widespread attention given the development needs of countries and the increasing awareness of environmental protection. In recent years, with the steady growth of port activities in China, carbon emissions from Chinese ports have increased significantly, and China must actively address the issue of carbon emission reduction (Wang et al., 2020). However, the global spread of COVID-19 has had a significant impact on the productive lives of people (Xu et al., 2021), where the negative impact on port throughput mainly includes the closure of shipping routes, transport market disruptions and increased health risks to international cargo. Given that the impact of the epidemic varies from region to region, the carbon emissions vary from region to region. According to the International Energy Agency’s World Energy Report 2020, the global energy demand declined by 3.8% and global carbon emissions declined by 5% in the first quarter of 2020 compared with 2019 (Yang et al., 2022).
Nevertheless, according to the trend and internal motivation of carbon emissions after the outbreak, a series of policies to stimulate economic recovery will affect the improvement of energy efficiency with the arrival of the post-epidemic era. Carbon emissions have the possibility of retaliatory rebound, laying a hidden danger for the port to achieve carbon emission reduction targets in the future (Li and Li, 2021). In addition, during the epidemic, ship carbon emissions increase during normal cruising conditions when ships are berthing and anchoring operations. Some ports have shore power equipment (Shi and Weng, 2021), which can replace auxiliary diesel engines with shore-supplied electricity to achieve carbon reduction from ships. However, shore power is not a fundamental solution. On the one hand, the technical standards for the construction of shore power facilities are insufficient, and power expansion is more difficult to achieve. Shore power technology is not easy to promote. On the other hand, shore power is not a zero-emissions technology; it is essentially a transfer of energy production from the ship to a grid power plant away from the port area. Carbon emissions are closely related to how the power is produced, with a 20% increase in carbon emissions for shore power generated using thermal power plants compared with ships using auxiliary power generation (Peng et al., 2019). Therefore, the marine and port-related industries are in urgent need of environmentally friendly, cost-effective concepts and practical solutions to achieve near-zero emission technologies (Misra et al., 2017).
The government has an irreplaceable role in the process of carbon reduction in port-related industries (Liu et al., 2021). Governments intervened early in the process of reducing carbon emissions. In 1992, countries signed the United Nations Framework Treaty on Climate Change. The treaty is the first international climate cooperation framework in the world that aims to reduce the economic cost of carbon emissions reductions through market-based economic instruments. In 1997, the relevant countries signed the Kyoto Protocol, which designed three flexible emission reduction mechanisms through emissions trading, joint compliance, and the clean development mechanism (He, 2016). It also lays the foundation for the development of a carbon trading system. In 2015, 195 countries signed the Paris Agreement, which avoided the problem of choosing and formulating emission reduction plans compared with the “top–down” allocation of emission reduction tasks in the Kyoto Protocol. The “bottom-up” submission of national autonomous contribution targets for greenhouse gas emission reductions is more conducive to the implementation of the treaty (Zhang, 2021). The framework of the global carbon emissions trading system has been basically completed (Rui, 2021).
The carbon emissions of the shipping industry have been a hot topic of concern for various countries. However, the issue of carbon emission reduction in the shipping industry has been excluded from the legal text of international climate negotiations. Although the International Maritime Organization has conducted lengthy negotiations with various parties on the issue of shipping emission reduction, it has been pending on what market-based emission reduction measures to adopt. Provisions were made to include the shipping industry in the carbon emissions trading system in the “Trial Measures for the Management of Carbon Emissions in Shanghai” released in 2017 (Commission SMDAR, 2017). The “Measures for the Management of Carbon Emissions Trading (Trial)” was considered and adopted by the Ministerial Meeting of the Ministry of Ecology and Environment on 25 December 2020 (China MOEAEOTPSRO, 2020) and came into effect from 1 February 2021. The document addresses the carbon reduction problems faced by the maritime and port-related industries at the source by binding shipping enterprises to their carbon emissions and encouraging them to make technological improvements.
The carbon trading system in China is still in its infancy, and the realization of double carbon goals cannot be achieved without the guidance and implementation of government policies. This paper constructs a multi-stage evolutionary model to improve the theoretical framework of carbon trading research. From a practical point of view, this paper constructs a multi-stage evolutionary model based on the existing carbon quota policy to find out the strategy choice and explores the impact of technological improvements and other factors on the design of the carbon trading mechanism. This paper also makes suggestions for the strategy choice of the game parties. It can mitigate the possible retaliatory rebound of carbon emissions in the post-epidemic era and ensure the successful achievement of the Chinese double carbon goal.
In recent years, the issue of carbon emission reduction has been widely concerned by scholars, who have conducted many studies on carbon emission reduction from various perspectives and using different theories. This paper focuses on carbon trading, evolutionary games, and the application of carbon reduction in the shipping industry. The number of studies on each topic is shown in Figure 1.
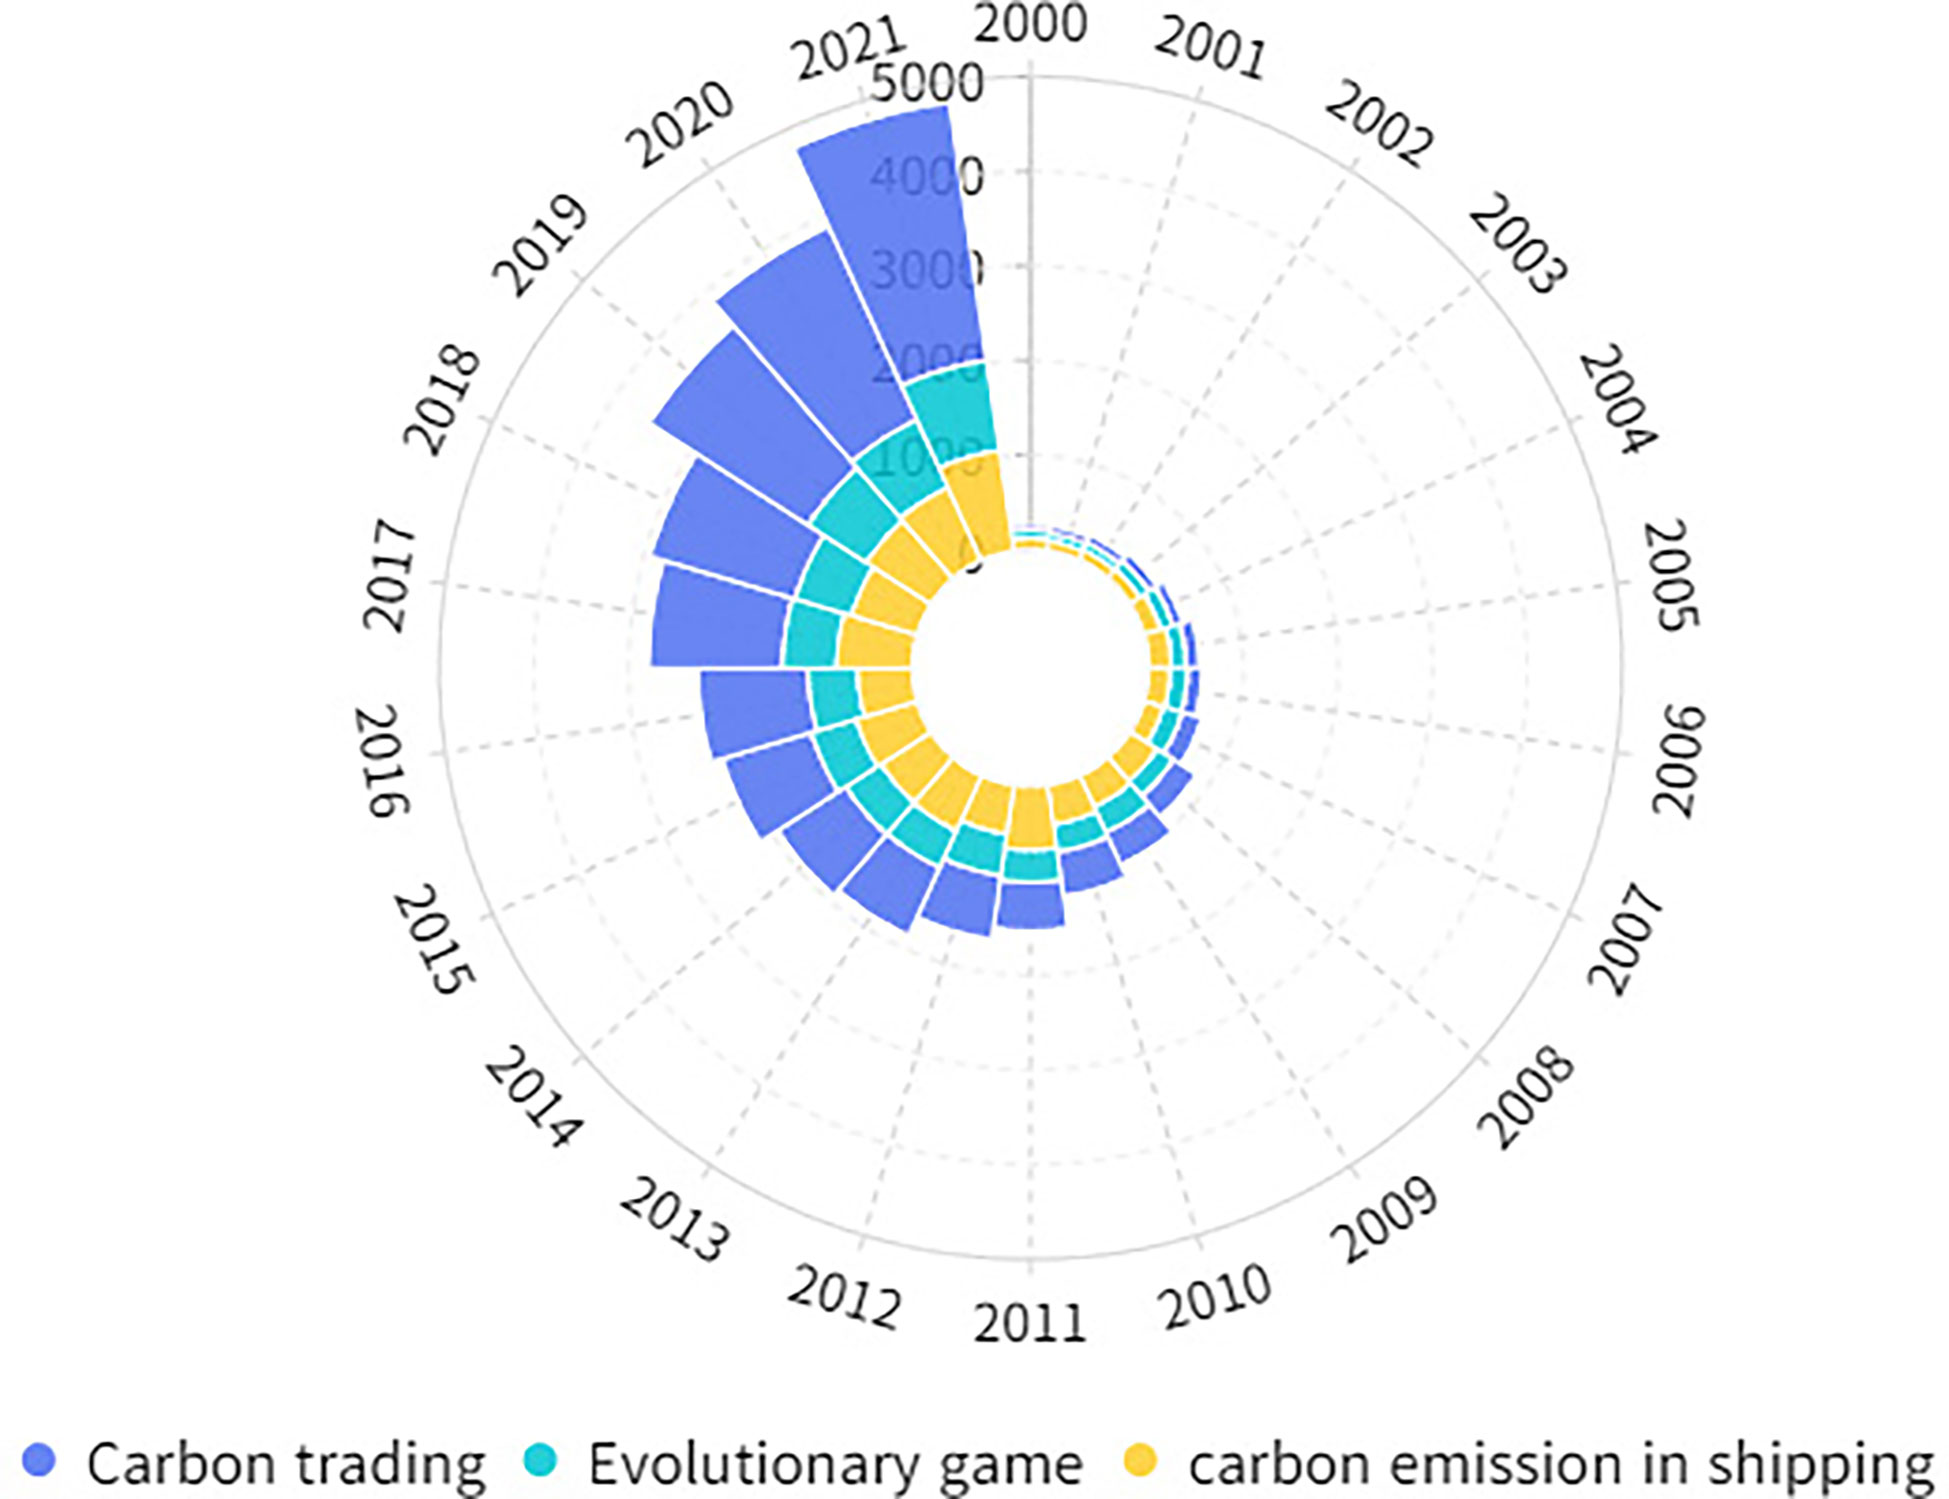
Figure 1 Statistics on the number of literatures from 2000-2021.
Carbon trading is one of the more widely used initiatives in carbon reduction measures. In the evolution of carbon trading literature, it is impossible to avoid the discussion on the issue of carbon price (Shen et al., 2020). Carbon trading price distortion, that is, the deviation of the actual trading price from the marginal abatement cost of carbon may have a serious impact on the effect of the carbon trading market (Wu, 2021). According to the China Carbon Trading Price Index, the EU carbon trading price and the AQI have a direct impact on the carbon trading price in China. At the same time, the CSI Energy Index, the Industrial Index, and the HS300 have a positive and indirect impact on the carbon trading price. In addition, the volatility of China’s carbon trading price is mainly internally driven, while the volatility of the other economic variables studied is mainly driven by the EU carbon trading price index, and the industrial index (Yin et al., 2019). The effects of coal prices, oil prices, and stock indices on carbon prices in China have also been studied using vector autoregressive models. The results show that carbon price is mainly influenced by its own historical price. Coal price and stock index have a negative impact on carbon price, while oil price has a negative impact on carbon price in the first three weeks and then has a positive impact on carbon price. In addition to the influence of carbon price, enterprise technology innovation is also conducive to improving market efficiency and carbon emission trading mechanism (Jiang et al., 2018). In the relationship between corporate innovation and carbon emission trading mechanism, high carbon trading price and high price volatility can promote corporate innovation. Therefore, carbon emission trading policy can effectively promote corporate carbon emission reduction innovation (Lv and Bai, 2021). Carbon trading mechanisms are a useful complement to carbon cap policies. Manufacturers strategically choose to trade carbon credits or invest in carbon reduction technologies when the government provides reasonable oversight (Yuan et al., 2022). A static optimal model is used to compare the clean innovation effects of carbon tax and cap-and-trade system. Both approaches can stimulate technological innovation and reduce emissions, but the effect of cap-and-trade system is more significant. However, regulators should choose appropriate emission limits and carbon trading prices to address global climate change to ensure the efficiency of the cap-and-trade system (Chen et al., 2020). From the perspective of Carbon Emissions from Land Use (CELU), the carbon emission reduction effect of carbon trading policy has some regional heterogeneity. The carbon trading policy has a significant reduction effect on the average CELU of pilot areas of at least four million tons per year (Xia et al., 2021).
The evolutionary game has been widely used in recent years. The stability of the evolutionary game model differs under two scenarios of static carbon trading price and dynamic carbon trading price, and there is a gap in the impact of government policies on the carbon trading market. When the government implements a static carbon trading price, the evolutionary game cannot achieve stability. Under the dynamic carbon trading price, the evolutionary game has an evolutionary stabilization strategy, which is an effective measure to promote carbon emission reduction (Zhang et al., 2019). Scholars have conducted extensive research on different game subjects. Some scholars have used government–enterprise and enterprise–enterprise–government as game subjects respectively. They constructed evolutionary game models based on multi-intelligence drive mechanism, evolutionary game theory and scenario simulation to prove that carbon trading behavior is influenced by the joint role of enterprises and government (Yu et al., 2022). Zhao and Zhang used the government-generator as the evolving game subject. They have simulated the evolution of the game behavior strategy using the System Dynamics (SD) model to investigate how the government controllable key factors affect the system stability. They found no evolutionary stable strategy in the government-generator game system, and the hybrid strategy of the game system has Evolutionary Stabilization Strategy (ESS) when the government implements dynamic subsidies or penalties. Both lower unit subsidies and higher unit penalties promote positive behavior of generators (Zhao and Zhang, 2018). Yuan and Zheng constructed a game model for the evolution of low-carbon technology innovation with government-firm-consumer as the game subjects. They found that the evolution process is influenced by the initial willingness of the game subjects, and the government regulation strength, innovation subsidy strength, and carbon tax rate have different effects on firms and consumers (Yuan and Zheng, 2022). Studies have also been conducted at different levels under the same subject. Zhao and Liu established a government and coal-fired power plants evolutionary game framework and constructed an evolutionary game model using the conflicting interests of game parties in the adoption of Carbon Capture and Storage (CCS). The process of evolutionary game is influenced by the initial willingness of the game parties. Strengthening government regulation and increasing the motivation of power plants to use CCS is beneficial for the system to converge to the optimal ESS (Zhao and Liu, 2019). Other scholars have established an evolutionary game model of government–manufacturer interaction based on static carbon taxes and carbon subsidies. In encouraging low-carbon manufacturing, the government imposes carbon taxes more effectively than government subsidies. Manufacturers’ behavioral strategies are mainly influenced by government policies, so the government needs to respond with dynamic strategic adjustments according to the real situation (Chen and Hu, 2018).
Carbon reduction in the shipping industry is an issue that must be faced by China’s development. Factors such as economic growth and population growth will affect carbon emissions, and China, as a developing country, needs to carry out carbon emission reduction (Chen, 2014). Academics have studied how to reduce carbon emissions in the shipping industry from several perspectives. Large differences may arise in the distribution trends of pollutant emissions for ships of different ship types and sailing conditions (Xiao et al., 2022). Chen et al. used the allometric approach to explore the potential relationship between ship size and the corresponding greenhouse gas emissions. The result showed that the implementation of the energy efficiency design index and energy efficiency operating index is generally effective (Chen et al., 2019). The reduced speed vessel scheduling method considers the combination of port vessel scheduling optimization and speed reduction, which is more effective when compared with the traditional vessel reduction method (Xia et al., 2021). Some scholars have included carbon emission factors into a multimodal irregular ship scheduling and speed optimization model and proposed a genetic simulated annealing algorithm based on variable neighborhood search. They used the model and algorithm to verify that the joint optimization of ship scheduling and speed can achieve carbon emission reduction (Fan et al., 2019). Electrifying the tire gantry crane to curb emissions can also achieve both carbon reduction and lower energy costs (Ding et al., 2021). In addition to considering the sailing speed, Gao et al. proposed a longitudinal tilt optimization method for inland sea vessels based on operational data and integrated learning. The experimental results show that the energy consumption and carbon emission of ro-ro passenger ships are reduced by 1.4641% through longitudinal tilt optimization, which is beneficial to the green and low-carbon navigation of ships (Gao et al., 2022). At the technical level, the use of methods such as automatic identification system, ship emission estimation model, and geographic information system mapping to create the ship emission scenario simulation model. The model can evaluate and improve the current ship emissions and various “what-if” scenarios in the port area to achieve carbon emission reduction (Kao et al., 2022). A cross-section of ship owners and operators was investigated by Nishatabbas. The study suggested that if the carbon emissions of ships wish to be in line with the rest of the industry in the future and follow a decarbonization path, they cannot be limited to current regulation-driven technologies, but need to improve energy efficiency and carbon reduction technologies (Rehmatulla et al., 2017). The application of alternative carbon-neutral fuels is the consensus among carbon reduction technologies. Carbon neutral fuels enable the use of effective emission control technologies that can simultaneously reduce the climate, health, and environmental burdens of shipping (Aakko-Saksa et al., 2023). Yan et al. proposed a method to calculate the annual carbon emissions of different alternative fuel ships under different freight growth prospects and power scenarios. The results show that LNG blends, LNG and methanol fuels are the most suitable choices at present (Yan et al., 2023). In addition to carbon reduction through speed adjustments and ship scheduling, the capture of carbon in the environment is also a direction of scholarly thinking. A recent International Union for Conservation of Nature Report focused on the concept of payments for the conservation of blue carbon (i.e., carbon captured by coastal ecosystems such as mangroves, seagrasses, and intertidal marshes) (Ullman et al., 2013). Blue carbon strategies have the full potential to be exploited in China. They can create ecological co-revenues of coastal protection and seaweed farming, set habitat for fish and other biota, mitigate eutrophication, hypoxia and acidification, and create good environmental revenues by capturing carbon (Wu et al., 2020). In addition to the low-carbon shipping technologies mentioned above, the application of CCS to ships is also an effective way to reduce carbon emissions from shipping (Zhou and Wang, 2014). In the post-epidemic era, reducing carbon emissions from shipping is a common expectation.
Shortcomings remain in the game study of carbon trading policy through the above literature combing analysis. Previous studies only consider the cyclical characteristics of shipping or carbon quota characteristics in the model, and few consider the model from the long-term perspective, so the game models of existing studies are mostly single-stage games. Compared with the existing literature, the innovations of this paper are mainly the following two points. On the one hand, we introduce shipping cycle and carbon quota into the game model. On the other hand, we construct a multi-stage evolutionary game model from the perspective of periodicity and long-term and analyze the strategy choice of each party in the game, which is closer to reality. The purpose of this paper is to improve the theoretical framework related to carbon trading and provide policy recommendations for relevant departments.
The core of this paper is a multi-stage evolutionary model, in which the first two stages correspond to the peak shipping season and the last stage corresponds to the low shipping season, and the model derivation is carried out in this way. Subsequently, a sensitivity analysis is conducted to observe the evolution of the strategies of both sides of the game by varying the technological improvement coefficients and the carbon revenue coefficients. Finally, a discussion is held to give relevant policy recommendations and conclusions are drawn.
The government has an irreplaceable role in achieving carbon emission reduction in shipping. The government can formulate carbon emission reduction policies for shipping enterprises, encourage shipping enterprises to research and develop energy-saving technologies, and solve the carbon emission reduction problems of ports and other related industries from the root (Fan and Lu, 2022). Reasonable government subsidies and carbon taxes can increase the motivation of relevant entities to carry out carbon reduction (Liu et al., 2020). Excessive government regulation and excessive carbon prices can be counterproductive, even fatal, to a carbon trading system (Fang et al., 2018). Therefore, government actions are classified as “high regulation” and “low regulation.” In the carbon trading market (i.e., EU ETS), the trading behavior of emitters is divided into two categories: “compliant trading” and “non-compliant trading,” depending on their positions (Wang et al., 2019). Carbon emissions trading policies can effectively promote enterprises’ carbon emission reduction innovation (Lv and Bai, 2021). Accordingly, the following assumptions are used in this research.
H1: The participants of the game are local governments (all the governments mentioned later represent local governments) and shipping enterprises. The game order of the two parties is government-shipping enterprises. All parties of the game are completely rational, and the information is completely open between the parties of the game. The government and shipping enterprises are aiming at maximizing their own revenues.
H2: The participants are faced with two strategy choices. The strategy set of government is (high regulation, low regulation). The high regulation strategy means that the local government invests human, material, and financial resources to strictly regulate the shipping enterprises. The low regulation strategy means that the local government relaxes the regulation of the shipping enterprises and intervenes less in the violations of the shipping enterprises. In high regulation, as long as the government inspects, the emission violation of shipping enterprises will be discovered, and there are no case of concealment without detection. The amount of violation of emissions will be accurately detected.
H3: The strategy set of shipping enterprises is (standardized operation, non-standardized operation). The standardized operation strategy means that the shipping enterprises comply with government regulations and actively invest in technological improvements. When carbon emissions of shipping enterprises exceed the limitation, carbon credit trading is conducted. The non-standardized operation strategy means that the shipping enterprises do not comply with the regulations of local government, do not invest in technology improvement, and refuse to buy carbon credits when the carbon emission exceeds the allowance.
H4: The government and shipping enterprises are assumed to be risk neutral. The government gives carbon credits to shipping enterprises periodically, and the government specifies the carbon emissions of shipping enterprises once a year. One year corresponds to one shipping cycle. The remaining carbon credits of shipping enterprises can be used in subsequent years, and the carbon credits of the next year will be reduced in equal amount for the false or concealed reporting part. The shipping cycle can be divided into low, recovery, peak, and recession. The theoretical basis is shown in Table 1. The peak period and recovery period are the peak shipping season, which corresponds to the shipping market demand in the post-epidemic era. The low and recession periods are the low shipping season, which corresponds to the shipping market demand during the epidemic.
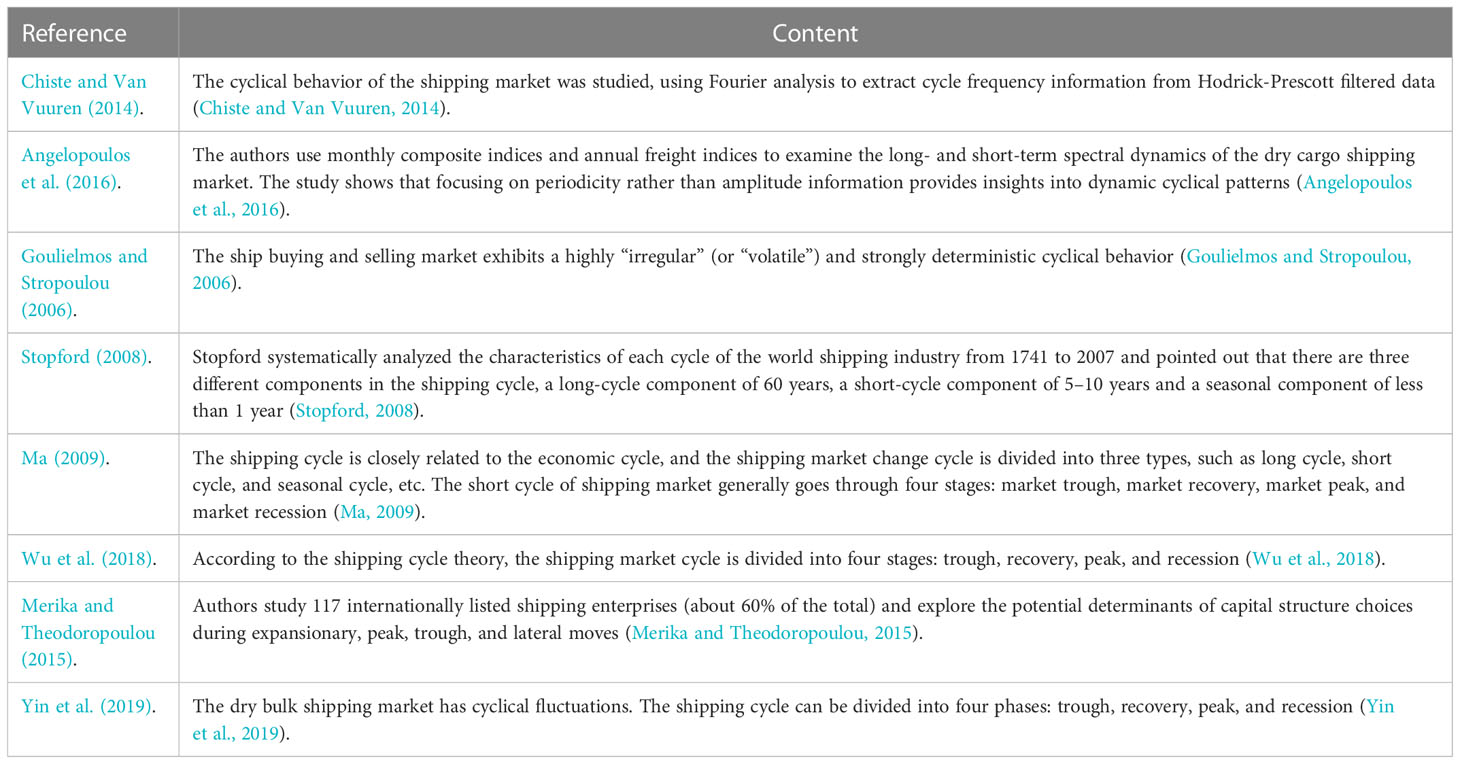
Table 1 The rationale for the shipping cycle.
The objective of each party of the game is to maximize the revenue, and the revenue parameters can influence the decision of the game parties by affecting their revenue. In the existing literature, the benefits of the government mainly involve the human, material and financial costs of government regulation, the incentives and penalties of the government to enterprises, the benefits of the government through regulation. The benefits of shipping enterprises mainly involve the costs of low carbon technology innovation investment, the initial allocation of carbon quotas, the costs of standardized operation of shipping enterprises, the costs of non-standardized operation and the carbon revenue coefficient (Zhao and Zhang, 2018; Zhang et al., 2019; Yu et al., 2022). The revenue of each party of the game is an important part of the model, and we will make assumptions about it.
When the government chooses a high regulatory strategy, the cost of investing human, material and financial resources is C1. Government incentives (or technical subsidies) for enterprises to regulate their operations are A. Penalties for shipping enterprises’ non-standardized operation are F. When choosing a low-regulation strategy, the input costs are C2 (C1 > C2). The social benefits gained by the government are G1,G2,G3,G4 . This component includes the revenue gained from controlling carbon emissions and the revenue gained from improving the government’s image, and the size of social revenue in different states is G1>G3>G2>G4 .
When shipping enterprises cooperate with the government, it makes technological improvements and operates normally in that phase, that is, the carbon revenue coefficient is e1. The technological improvement coefficient is t. When shipping enterprises do not cooperate, their carbon revenue coefficients in the next phase will be reduced to e2 under two consecutive phases of high government regulation. The cyclicality factor will reduce the constraints of government quota policies for shipping enterprises and also reduce the overall revenue (carbon emission-related revenue is the main revenue, much larger than other parts of the revenue), so the cyclicality coefficient in the third stage is k1. The cyclicality coefficient affecting the overall return is k2. When shipping enterprises choose to match the strategy, shipping enterprises invest in technology research and development costs as C3. The image revenue gained is R. When shipping enterprises choose the non-standard operation strategy, they invest 0 in technology research and development costs, and the carbon emission-related revenue of shipping enterprises is U.
We assume that the government has a high regulatory probability of P1 and a low regulatory probability of 1 – P1 in the first stage. In the second stage the high regulatory probability is P21 and the low regulatory probability is 1 - P21. In the second stage the high regulatory probability is P31, and the low regulatory probability is 1 – P31.
We assume that the probability of shipping enterprises choosing standardized operation in the first stage is P2, the probability of non-standardized operation is 1 – P2. The probability of standardized operation in the second stage is P22, and the probability of non-standardized operation is 1 – P22. The probability of standardized operation in the third stage is P32, and the probability of non-standardized operation is 1 – P32. Where P1,P2,P21,P22,P31,P32∈[0, 1] .
The shipping enterprises and the government play a three-stage evolutionary game: in stage one, the government and the shipping enterprises make strategic choices and reach a partial equilibrium. After observing the information in stage one, the government and shipping enterprises choose their respective actions in stage two, and so on in the subsequent stages. Tables 2-4 show the revenue matrices of the game parties in each stage.
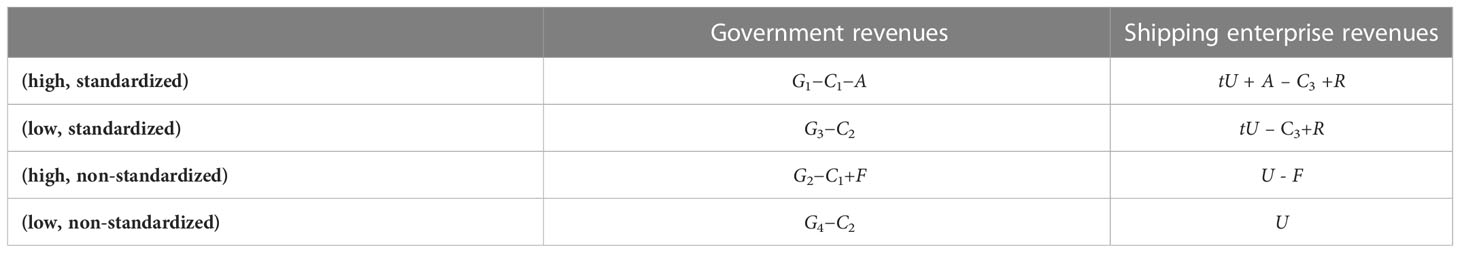
Table 2 Revenue matrix of the first stage.

Table 3 Revenue matrix of the second stage.
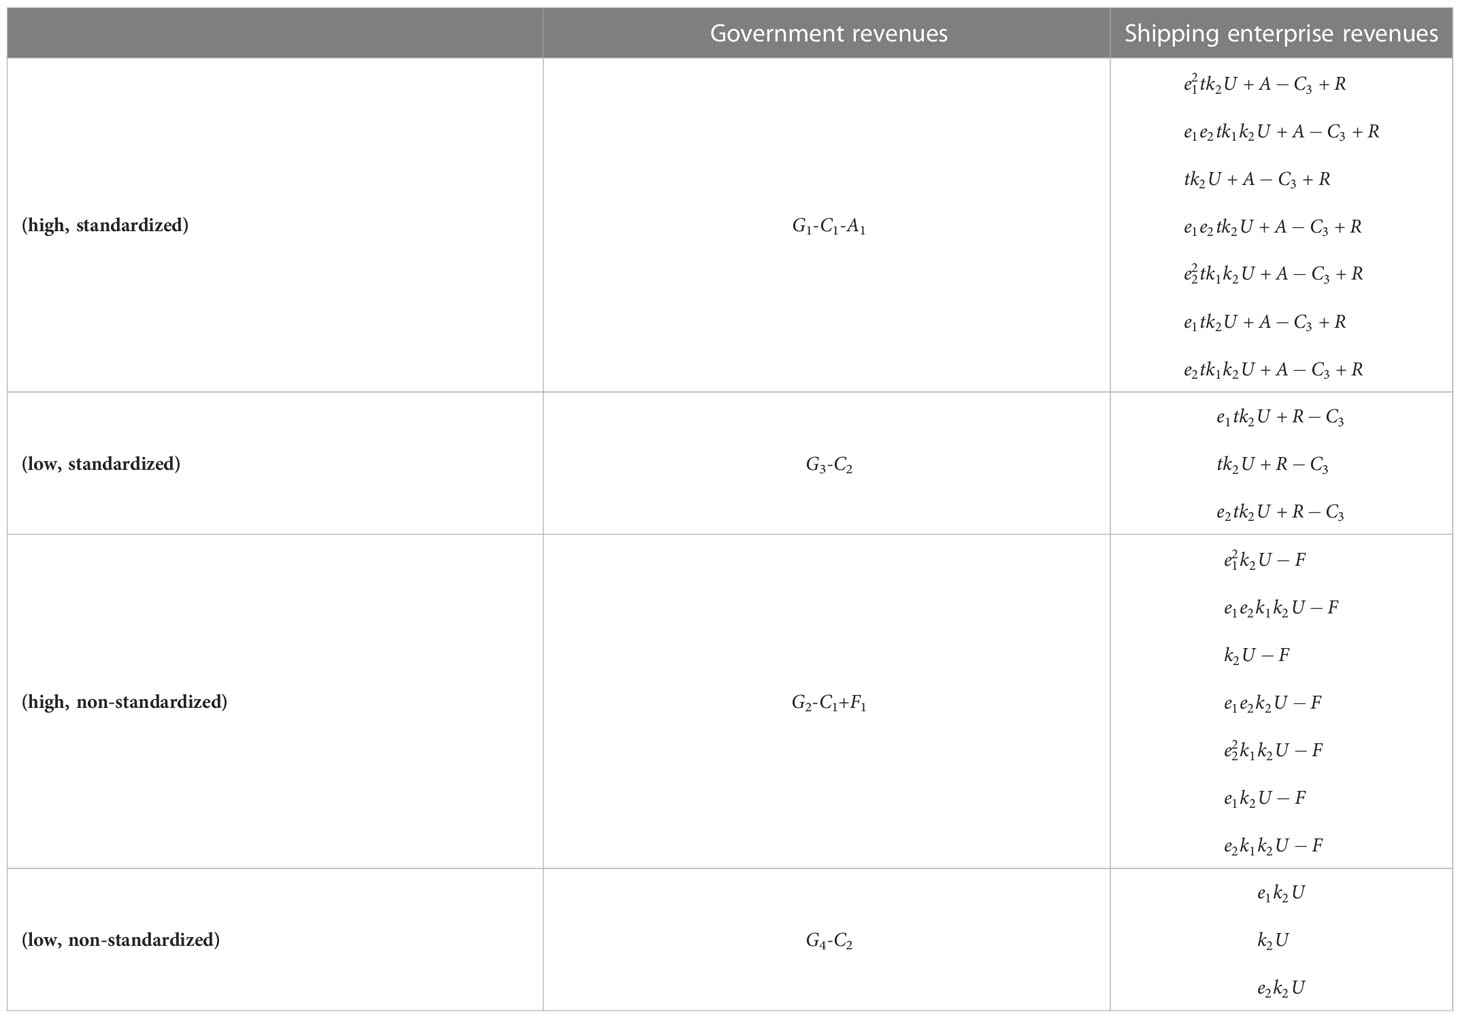
Table 4 Revenue matrix of the third stage.
(1) First stage
The first stage is the initial stage of the game, at this time, the carbon emission allowance of shipping enterprises is uniformly allocated by the government, and its carbon gain coefficient is all 1. Given that the shipping enterprises choose to regulate the operation, they will make technical improvements. Regardless of the government’s strategy choice, there are technical improvement revenues. In the subsequent stage, the carbon gain coefficient of shipping enterprises will increase or decrease with the choice of the government and shipping enterprises for the strategy, which is the key place where the government quota policy plays a role.
The high regulatory revenue to the government is
The low regulatory revenue to the government is
The standardized operation revenue of shipping enterprises is
The non-standardized operation revenue of shipping enterprises is
The expected revenue to the government is
The expected revenue of the shipping enterprise is
The replication dynamics equation for the government is
The replication dynamics equation for shipping enterprises is
According to the differential equation theorem, P1 is subject to the following conditions F(P1)=0 , .
According to F(P1) = 0, we know that .
When , we know that
According to the differential equation theorem, P2 is subject to the following conditions F(P2)=0 , According to F(P2)=0 , we know that .
According to , we know that
P2 = 0,.
According to the local stability criterion of the Jacobi matrix J, for a general two-sided evolutionary response, the equilibrium point is ESS when all the eigenvalues of the Jacobi matrix J are negative. The equilibrium point is the instability point when all the eigenvalues of the Jacobi matrix J are positive. The equilibrium point is the saddle point when one or two eigenvalues are positive. In this model, because the equilibrium solution of the two-party evolutionary game is a strict Nash equilibrium, only the above four points are considered a Jacobi matrix J. The main eigenvalues of the different equilibrium points are shown in Table 5.
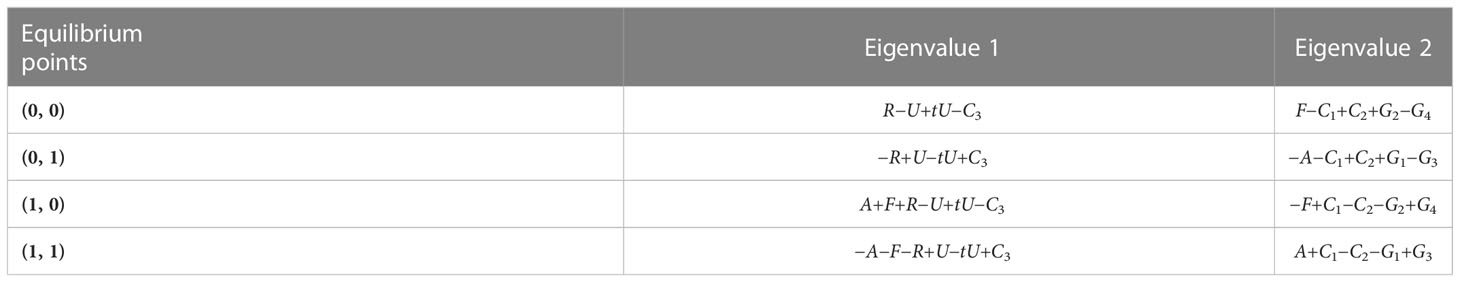
Table 5 Eigenvalues of Jacobian matrix J (first stage).
(2) Second stage
In the second stage, the carbon emission-related revenue in this stage is related to the first stage of the shipping enterprise and the government as well as the current stage strategy choice. There are 16 possibilities for the revenue of the shipping enterprise under each strategy choice (the case of the revenue not written out represents that the revenue expression is the same as the revenue expression already in the revenue matrix and is not repeatedly written. It is not repeated in the subsequent part).
The replication dynamics equation for the government is
The replication dynamics equation for shipping enterprises is
We can draw the following conclusions.
The main eigenvalues of the different equilibrium points of the second stage Jacobi matrix are shown in Table 6.
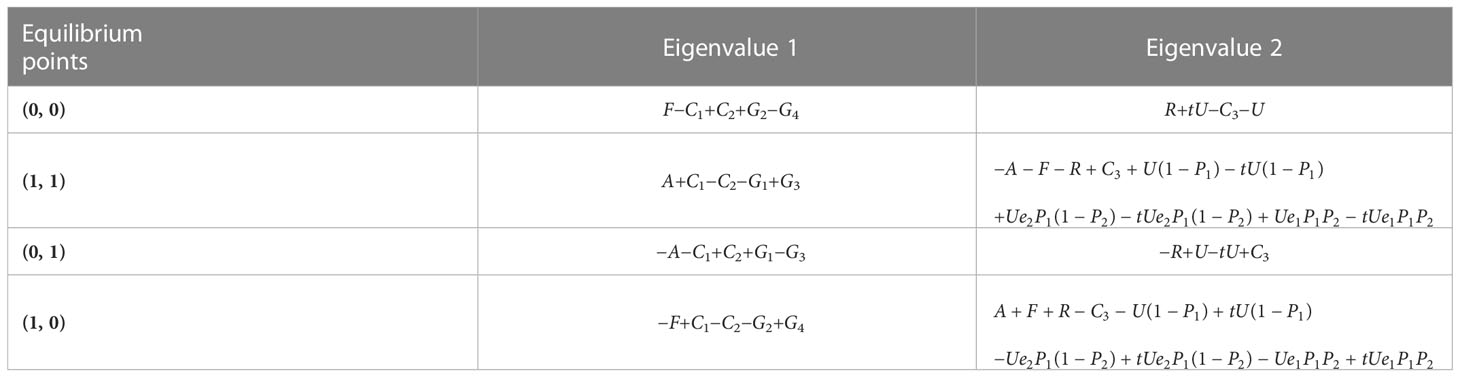
Table 6 Eigenvalues of Jacobian matrix J (second stage).
(3) Third stage
In the third stage, the carbon emission-related revenue in this stage is related to the strategy choices of shipping enterprises and the government in the previous two stages as well as the current stage. Therefore, there are 64 possible revenue scenarios for shipping enterprises under each strategy choice.
The replication dynamics equation for the government is
The replication dynamics equation for shipping enterprises is
We can draw the following conclusions.
The main eigenvalues of the different equilibrium points of the Jacobi matrix in the third stage are shown in Table 7.
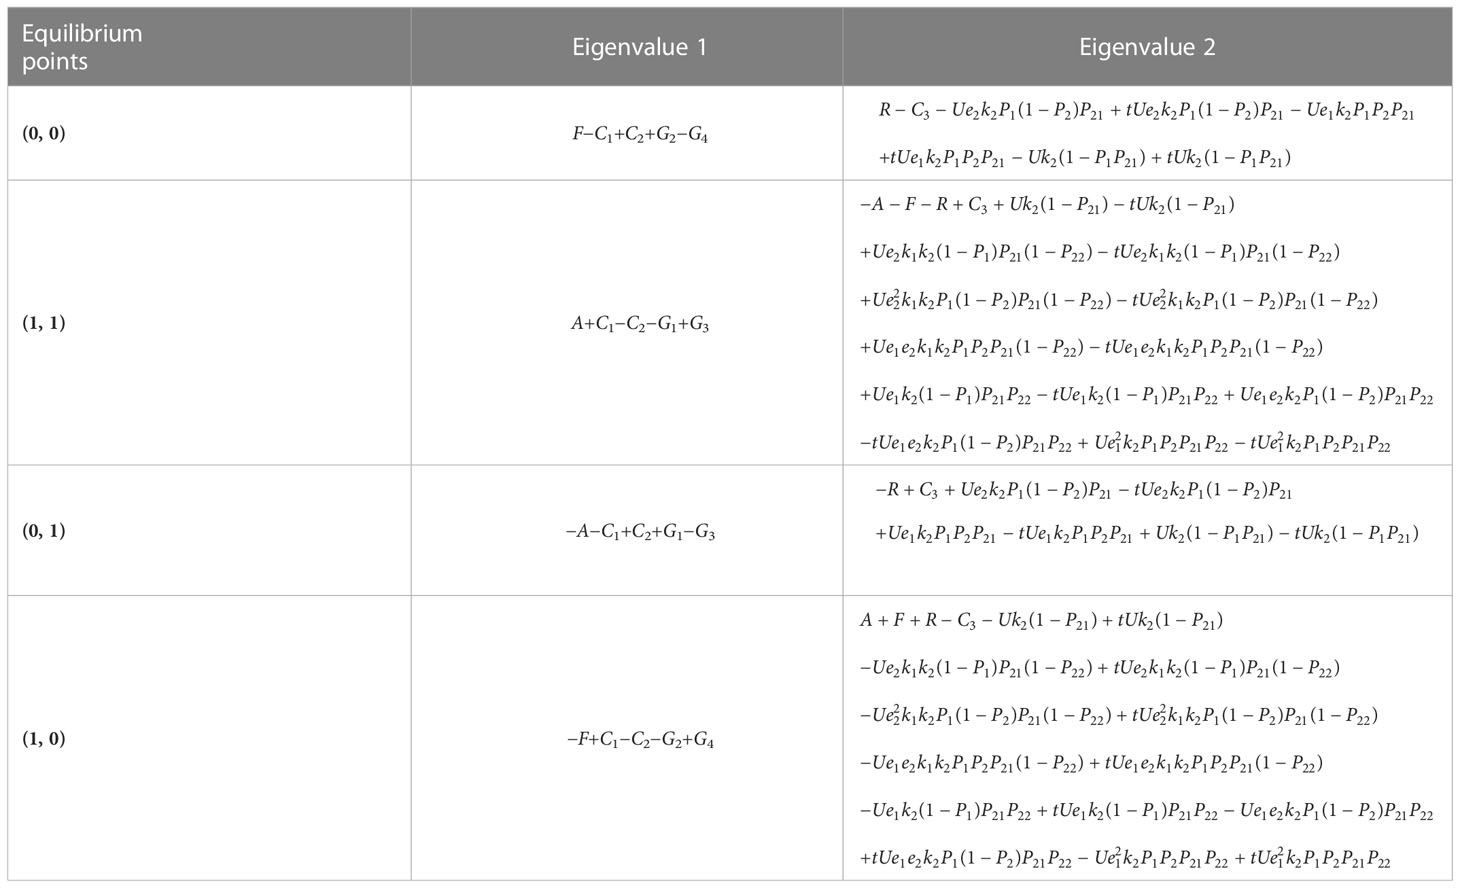
Table 7 Eigenvalues of Jacobian matrix J (third stage).
Table 7 shows that determining the stability of each point is difficult due to the numerous parameters. Thus, finding the optimal solution by mathematical methods is more difficult, and numerical simulation analysis is required.
In the numerical simulation section, we construct an SD simulation model by combining both sides of the evolutionary game. The relationship between the variables is shown in Figure 2. Specifically, the evolutionary game model describes the long-term evolutionary behavior of the government and shipping enterprises. Based on this, we use different parameter values to evaluate the strategy combinations of the two parties.
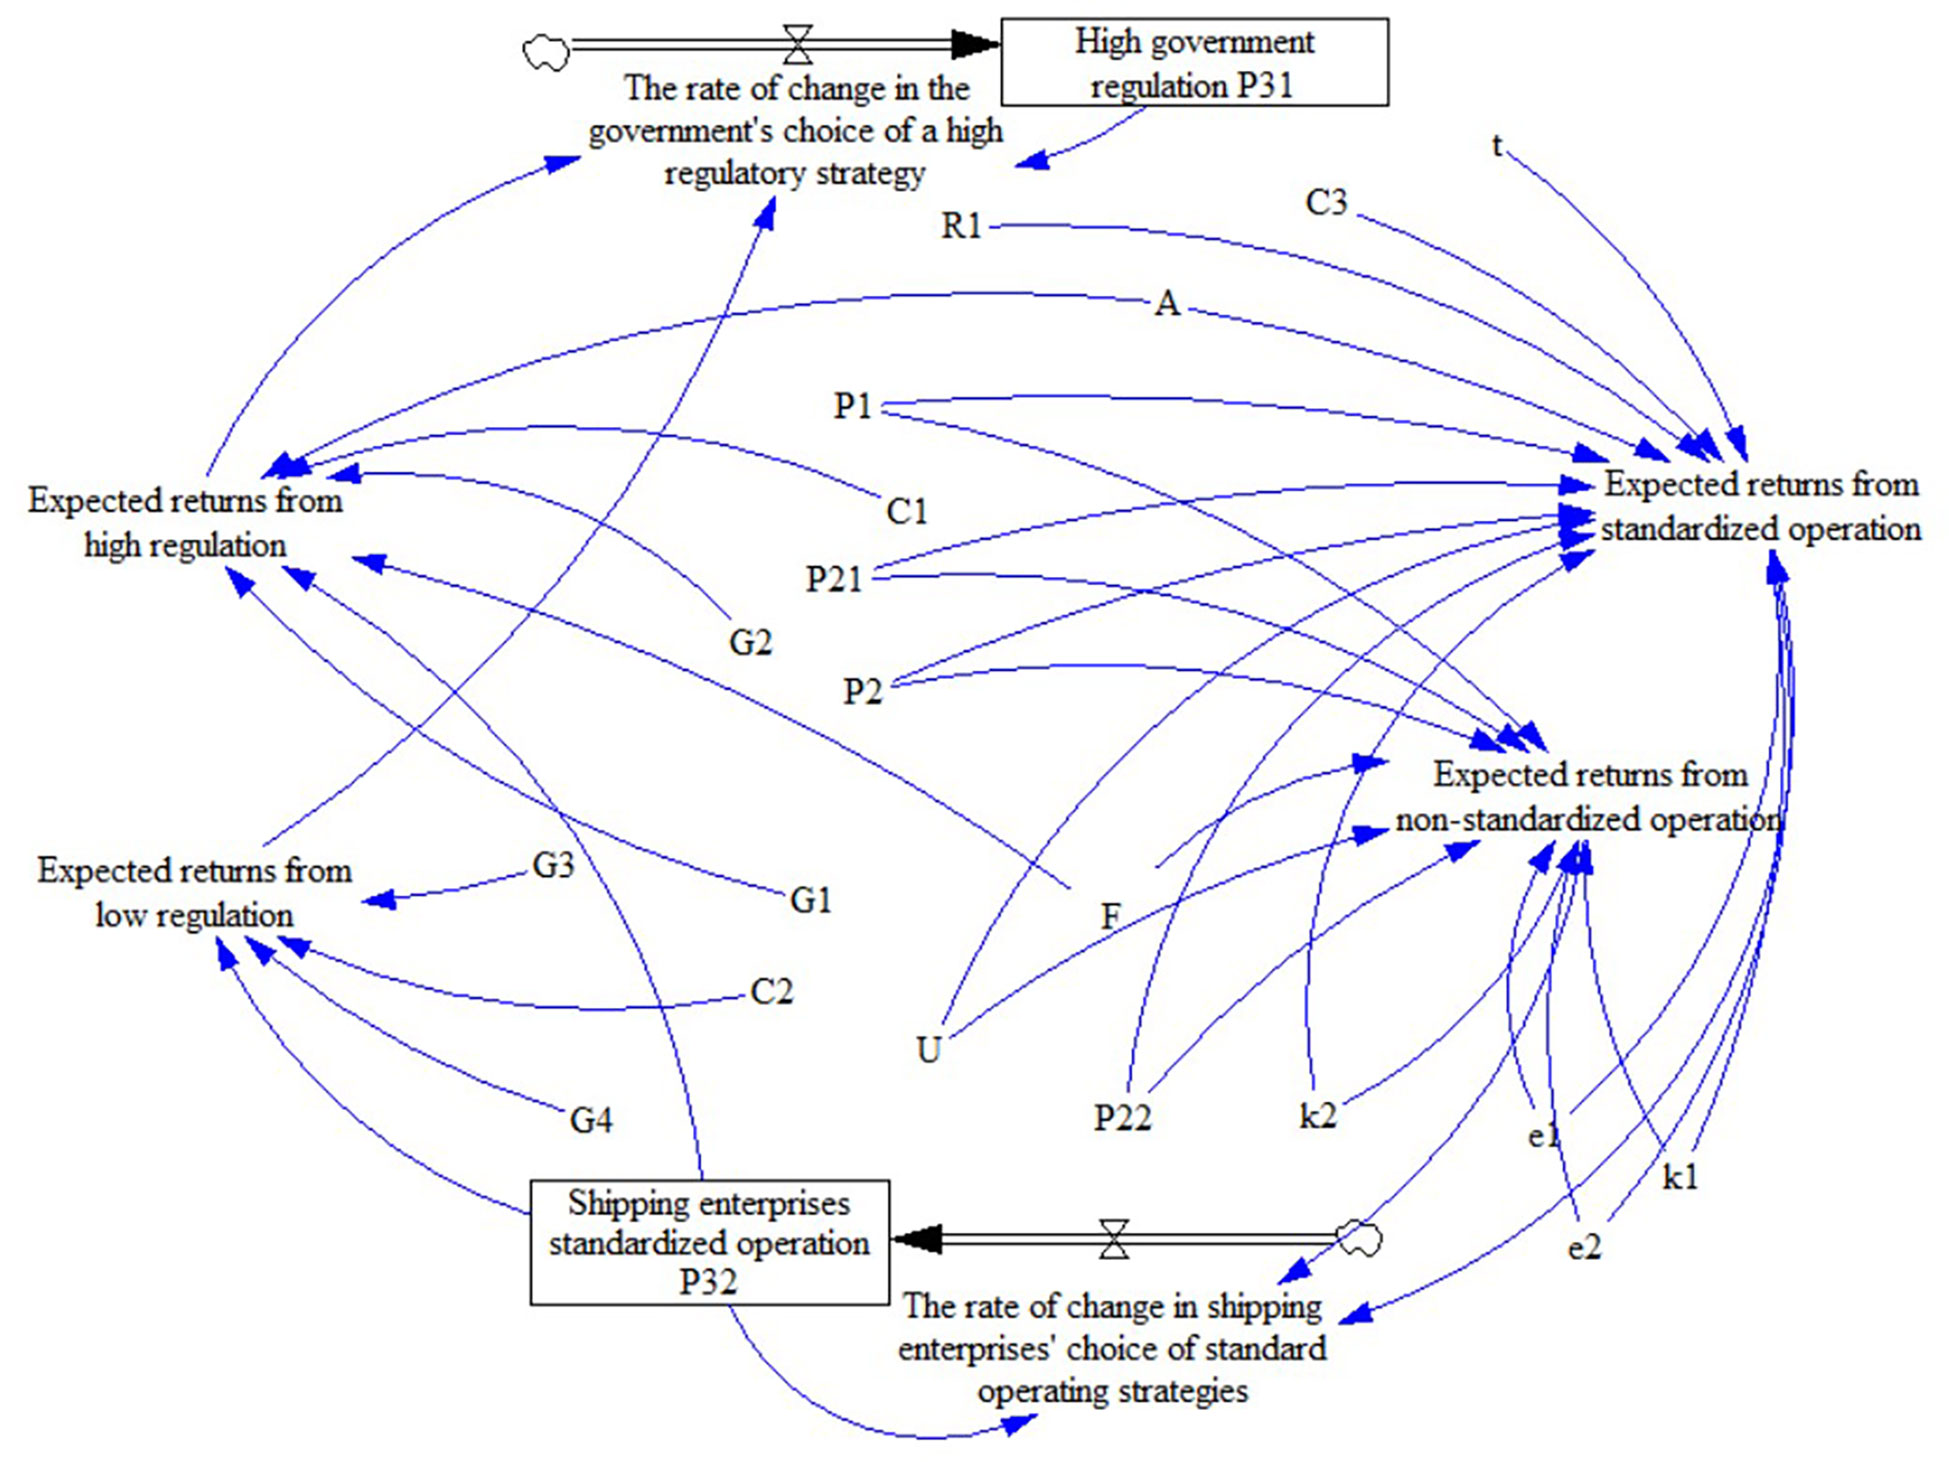
Figure 2 SD simulation models of governments and shipping enterprises.
The game model is further explored by numerical simulations using Matlab. Firstly, the effect of initial values on the choice of both sides of the game is considered. Secondly, sensitivity analysis is performed to consider the effect of parameter changes on the behavior of both sides of the game. We set up two scenarios (1, 1) and (0, 1).
(1) Scenario 1
Scenario 1 is conducted in the context of the government’s choice of a high-regulation strategy. When the government chooses high regulation, the efficiency of shipping enterprises can be maximized only through standardized operation. Firstly, we determine the relationship between some parameters through realistic situations, for example, in this model, C1 > C2, G1>G3>G2>G4 . Secondly, the relationship between the relevant parameters is constrained according to the scenario setting. For example, the scenario is simulated with high government regulation and standardized operation of shipping enterprises as the initial state, so the parameters should satisfy −A−F−R+U−tU+C3<0 and A+C1−C2−G1+G3<0 . The specific parameter values are as follows.
G1=17,G2=9,G3=14,G4=8,C1=6,C2=5,C3=5,A=1,F=3,R=2,U=25,t=1.2, e1=1.2,e2=0.8,k1=1.15,k2=0.7.
1) Evolutionary paths with different initial probabilities
The initial probabilities of both sides are randomly distributed in [0, 1], and the path evolution of the two-party response system with different initial probabilities. From Figure 3, in this parameter background, the initial probability has no effect on the final strategy choice of both sides of the game, but the higher the initial probability of both sides, the faster the game system reaches the steady state. Therefore, the government needs to regulate itself and strengthen the environmental awareness of shipping enterprises. Afterward, the policy effect of carbon quotas can be brought into play as soon as possible and the carbon emission reduction target of the shipping industry can be achieved.
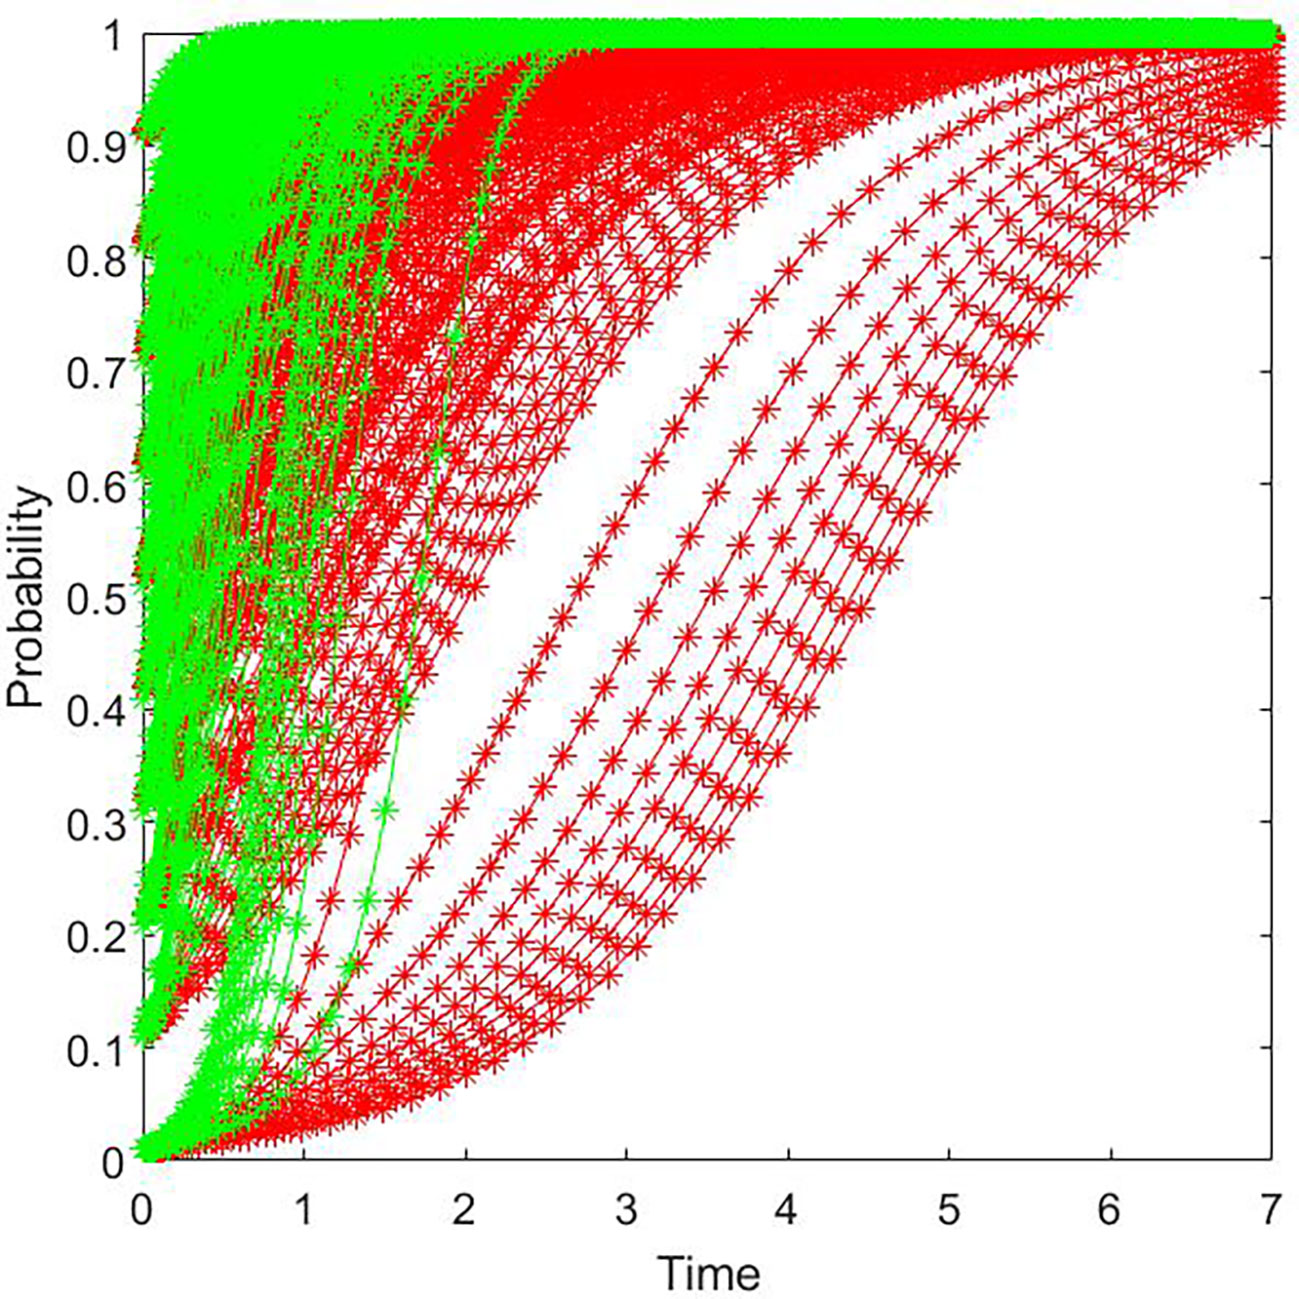
Figure 3 Evolutionary path diagram of the two-party game system with different initial probabilities (Scenario 1). (Note: The red curve represents the government and the green curve represents shipping companies).
Figure 3 shows the evolutionary results of the first stage with different initial probabilities. In this paper, the evolutionary game model is under three stages. Figure 4 show the evolution of each stage in the context of this parameter.
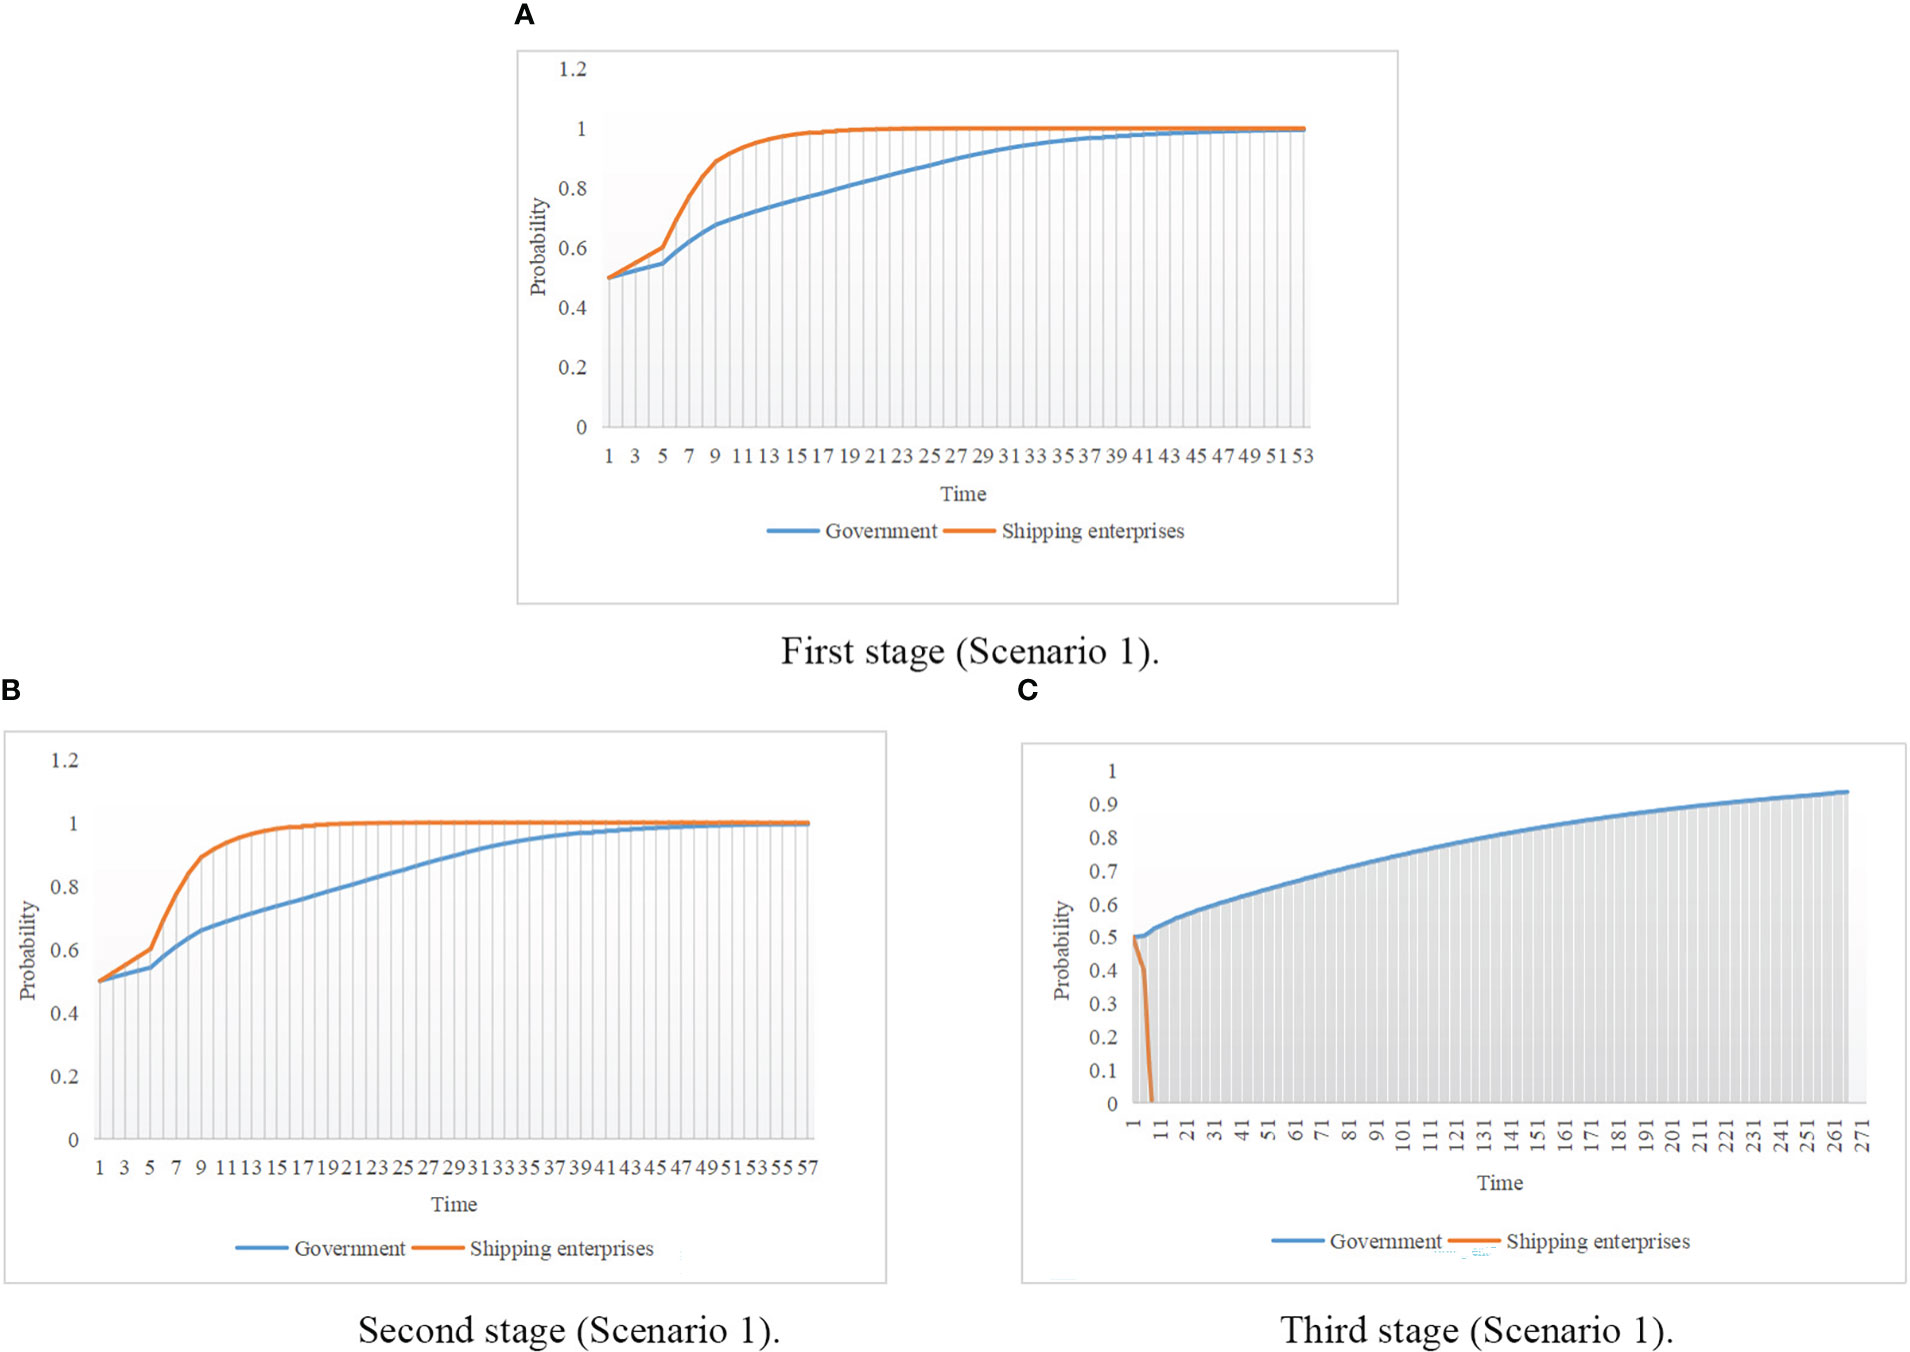
Figure 4 Evolutionary path of both sides (Scenario 1).
2) Evolutionary path of each stage
In the first stage, when the initial probability of government and shipping enterprises is 0.5, the curves of government and shipping enterprises converge to the equilibrium point (1, 1). Given that the first stage is the initial stage, no previous strategy choice affects the revenue of this stage, and the revenue of this stage is only related to the current stage.
In the second stage, the initial probability of the government and shipping enterprises is 0.5. The curves of the government and shipping enterprises also converge to the equilibrium point (1, 1) under the influence of the strategy choice in the first stage. Although Figures 4A, B look less different, the return function in the second stage is related to the strategy choice in the first stage. We substitute the final stable value P1, P2 in the first stage into the return function in the second stage and continue performing the simulation.
In the third stage, the initial probability of government and shipping enterprises is 0.5, and we add the influence of cyclical factors. In this stage, the shipping cycle changes from the peak shipping season to the low shipping season. With the government maintaining a high regulation, shipping enterprises tend to operate unregulated in this phase due to the accumulation of carbon credits in the first two stages, which also reflects the impact of parameter k1, k2. When the demand of the shipping industry decreases and the government still tends to practice high regulation, shipping enterprises tend to operate unstandardized. The impact of the value will not be discussed subsequently in the sensitivity analysis module.
(2) Scenario 2
Scenario 2 is conducted in the context of the government’s choice of a low-regulation strategy. First, C1>C2 , G1>G3>G2>G4 is determined based on the actual situation. Secondly, the scenario is simulated with the initial state of low government regulation and standardized operation of shipping enterprises, so the parameters should satisfy −R+U−tU+C3<0 and −A−C1+C2+G1−G3<0 . The specific parameter values are as follows.
G1=17,G2=9,G3=16,G4=8,C1=6,C2=5,C3=5,A=1,F=3,R=2,U=25,t=1.2,
1) Evolutionary paths with different initial probabilities
In the scenario where the initial state is (0, 1), the final evolutionary strategy of the game player remains the same for different initial probabilities. Figure 5, compared with Figure 3, shows that the strategy choice of the game player is independent of the initial probability and related to the initial state.
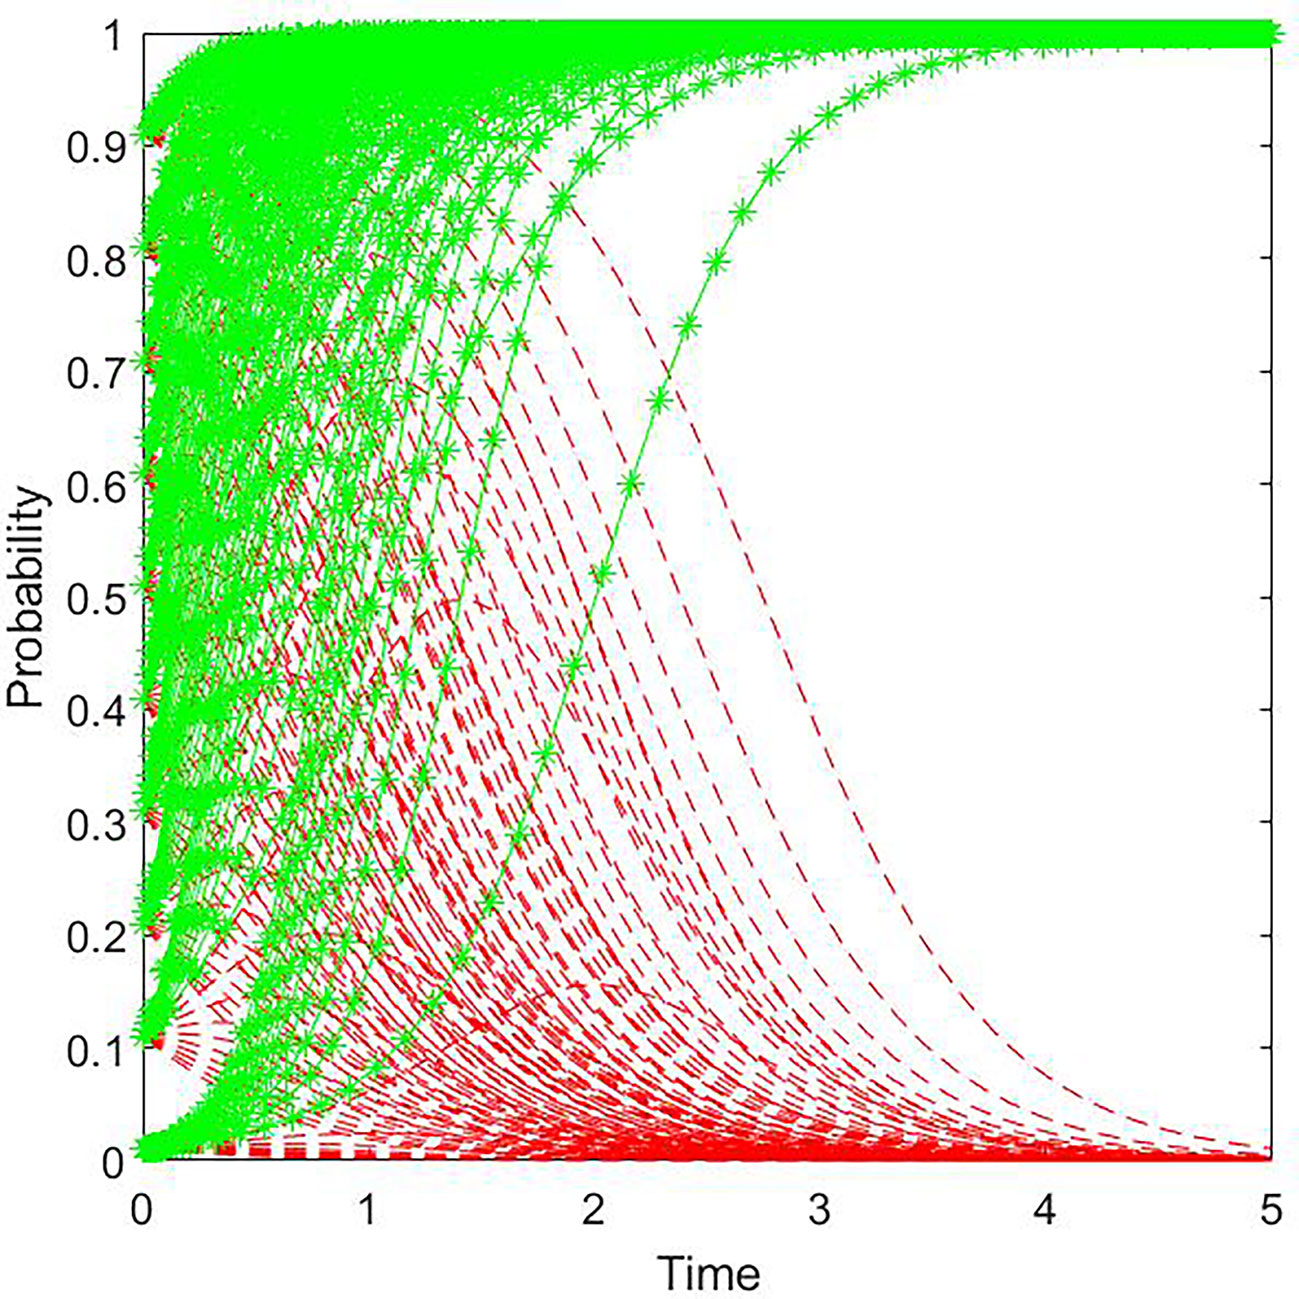
Figure 5 Evolutionary path diagram of the two-party game system with different initial probabilities (Scenario 2). (Note: The red curve represents the government and the green curve represents shipping companies).
2) Evolutionary path of each stage
Compared with Figures 4A, B, in Figures 6A, B, the final evolution of the graph is (0, 1) due to the change of the initial state. According to the model assumptions, both the first and second stage are in the peak shipping season and the government’s decision is not influenced by t. Therefore, the government has been in a low regulatory state, and the purpose of the carbon quota policy is to guide shipping enterprises to regulate their operation, which is reflected in the graph as the curve of shipping enterprises tends to 1. Also, because the graph and the graph itself are evolved under the initial scenario of (0, 1), in summary, the evolution graphs of the first and second stage are very similar.
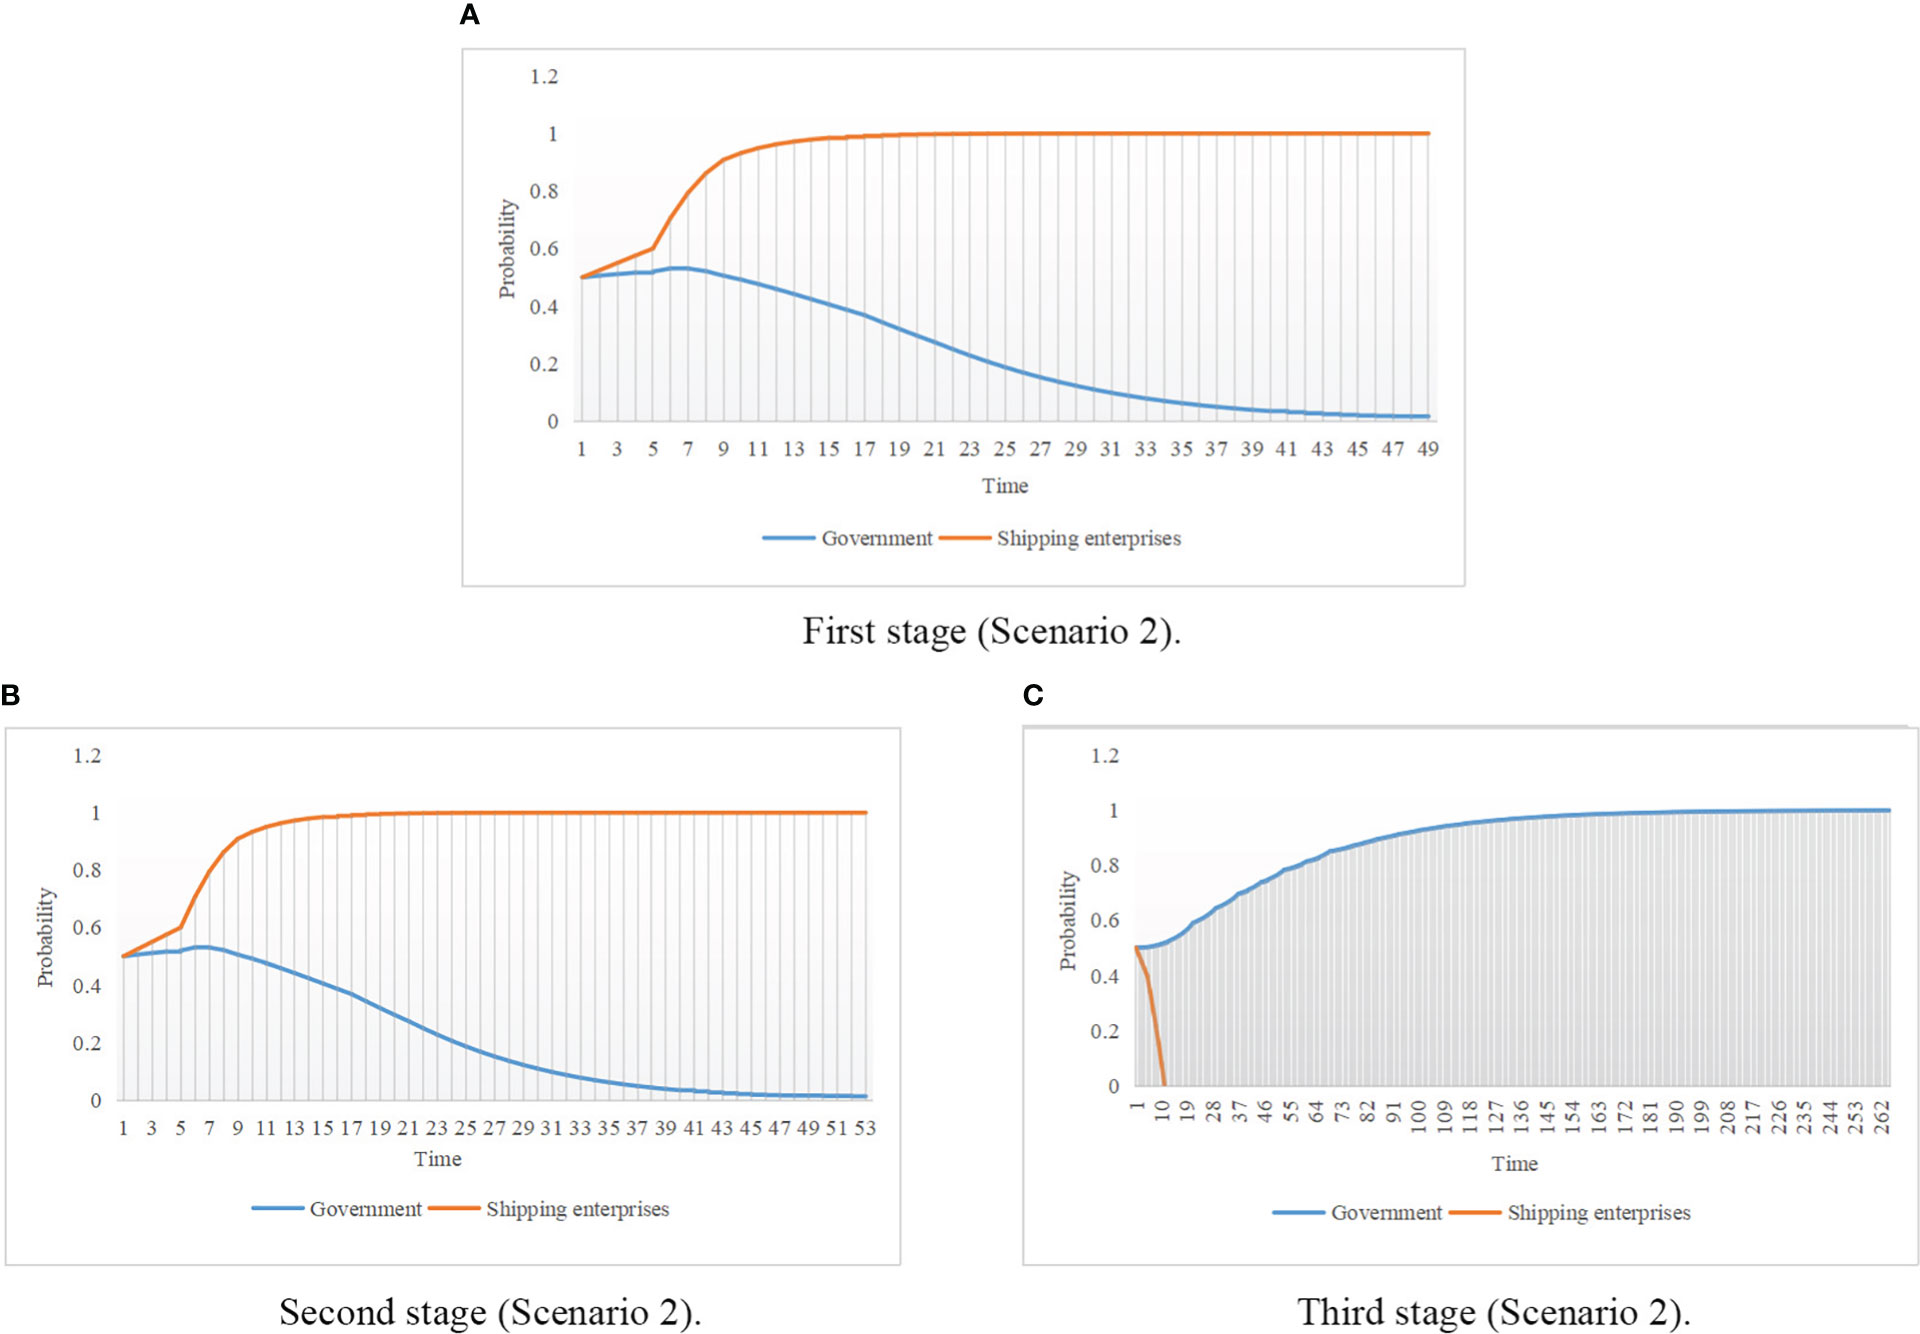
Figure 6 Evolutionary path of both sides (Scenario 2).
According to Figures 4C, 6C, it can be seen that although their numerical backgrounds are different, they all eventually tend to (1, 0) under the influence of shipping off-season, which indicates that the shipping cycle factor has a high sensitivity and the attention to shipping cyclicality should be strengthened.
Ideally, we hope that the government can adjust its own policies to achieve cooperative regulation and win–win benefits. At the same time, shipping enterprises can actively respond to the government’s call to improve carbon reduction technology and improve the inland shipping environment. Therefore, in the subsequent analysis of the results, we will pay more attention to the impact of changes in different factors on the evolutionary game equilibrium.
In scenarios (1, 1) and (0, 1), the initial state of shipping enterprises does not change. Factors such as technological improvement coefficients do not affect the government’s strategic choice, and we choose a numerical background with an initial state of (1, 1) for sensitivity analysis.
In this section, all parameters in the game model are fixed values (initial probability of 0.5 for government and shipping enterprises) except for the technological improvement coefficient t, which is 0.8, 1.2, and 1.6. The values of each fixed parameter are shown in scenario 1, and the results are shown in Figure 7.

Figure 7 Changing the evolutionary path of the technological improvement coefficient.
Given that the technological improvement coefficient is only related to the final revenue of shipping enterprises, Figure 7 represent the system evolution diagram of the shipping enterprise. In the first two stages, when the technological improvement coefficient changes from 0.8 to 1.2, the final strategy choice of shipping enterprises changes from non-standardized operation to standardized operation with higher sensitivity. When it changes from 1.2 to 1.6, the final strategy choice of shipping enterprises remains unchanged, but the larger the parameter value of t, the faster it tends to the stabilization point. In the third stage, the parameter values t take 0.8, 1.2, and 1.6, due to the influence of shipping periodicity, it eventually all tends to the non-standardized operation strategy with reduced sensitivity and t = 1.2 is the fastest tending to the unstable strategy.
The evolution results indicate that when the technological improvement coefficient is large enough, in the first two stages, shipping enterprises tend to regulate their operation. However, due to the influence of cyclicality coefficient, in the third stage, shipping enterprises will still tend to operate irregularly, reflecting the importance of the government’s dynamic regulation. By contrast, with a smaller technological improvement coefficient, shipping enterprises will tend to operate irregularly, which is not conducive to achieving the carbon emission reduction target of China.
In this section, all parameters in the game model are fixed values except for the carbon benefit coefficient e1 ( e1−1=1−e2 ), which is 1, 1.2, and 1.4. The values of each fixed parameter are shown in scenario 1 (the initial probability of the government and shipping enterprises is 0.5), and the results are shown in Figure 8.
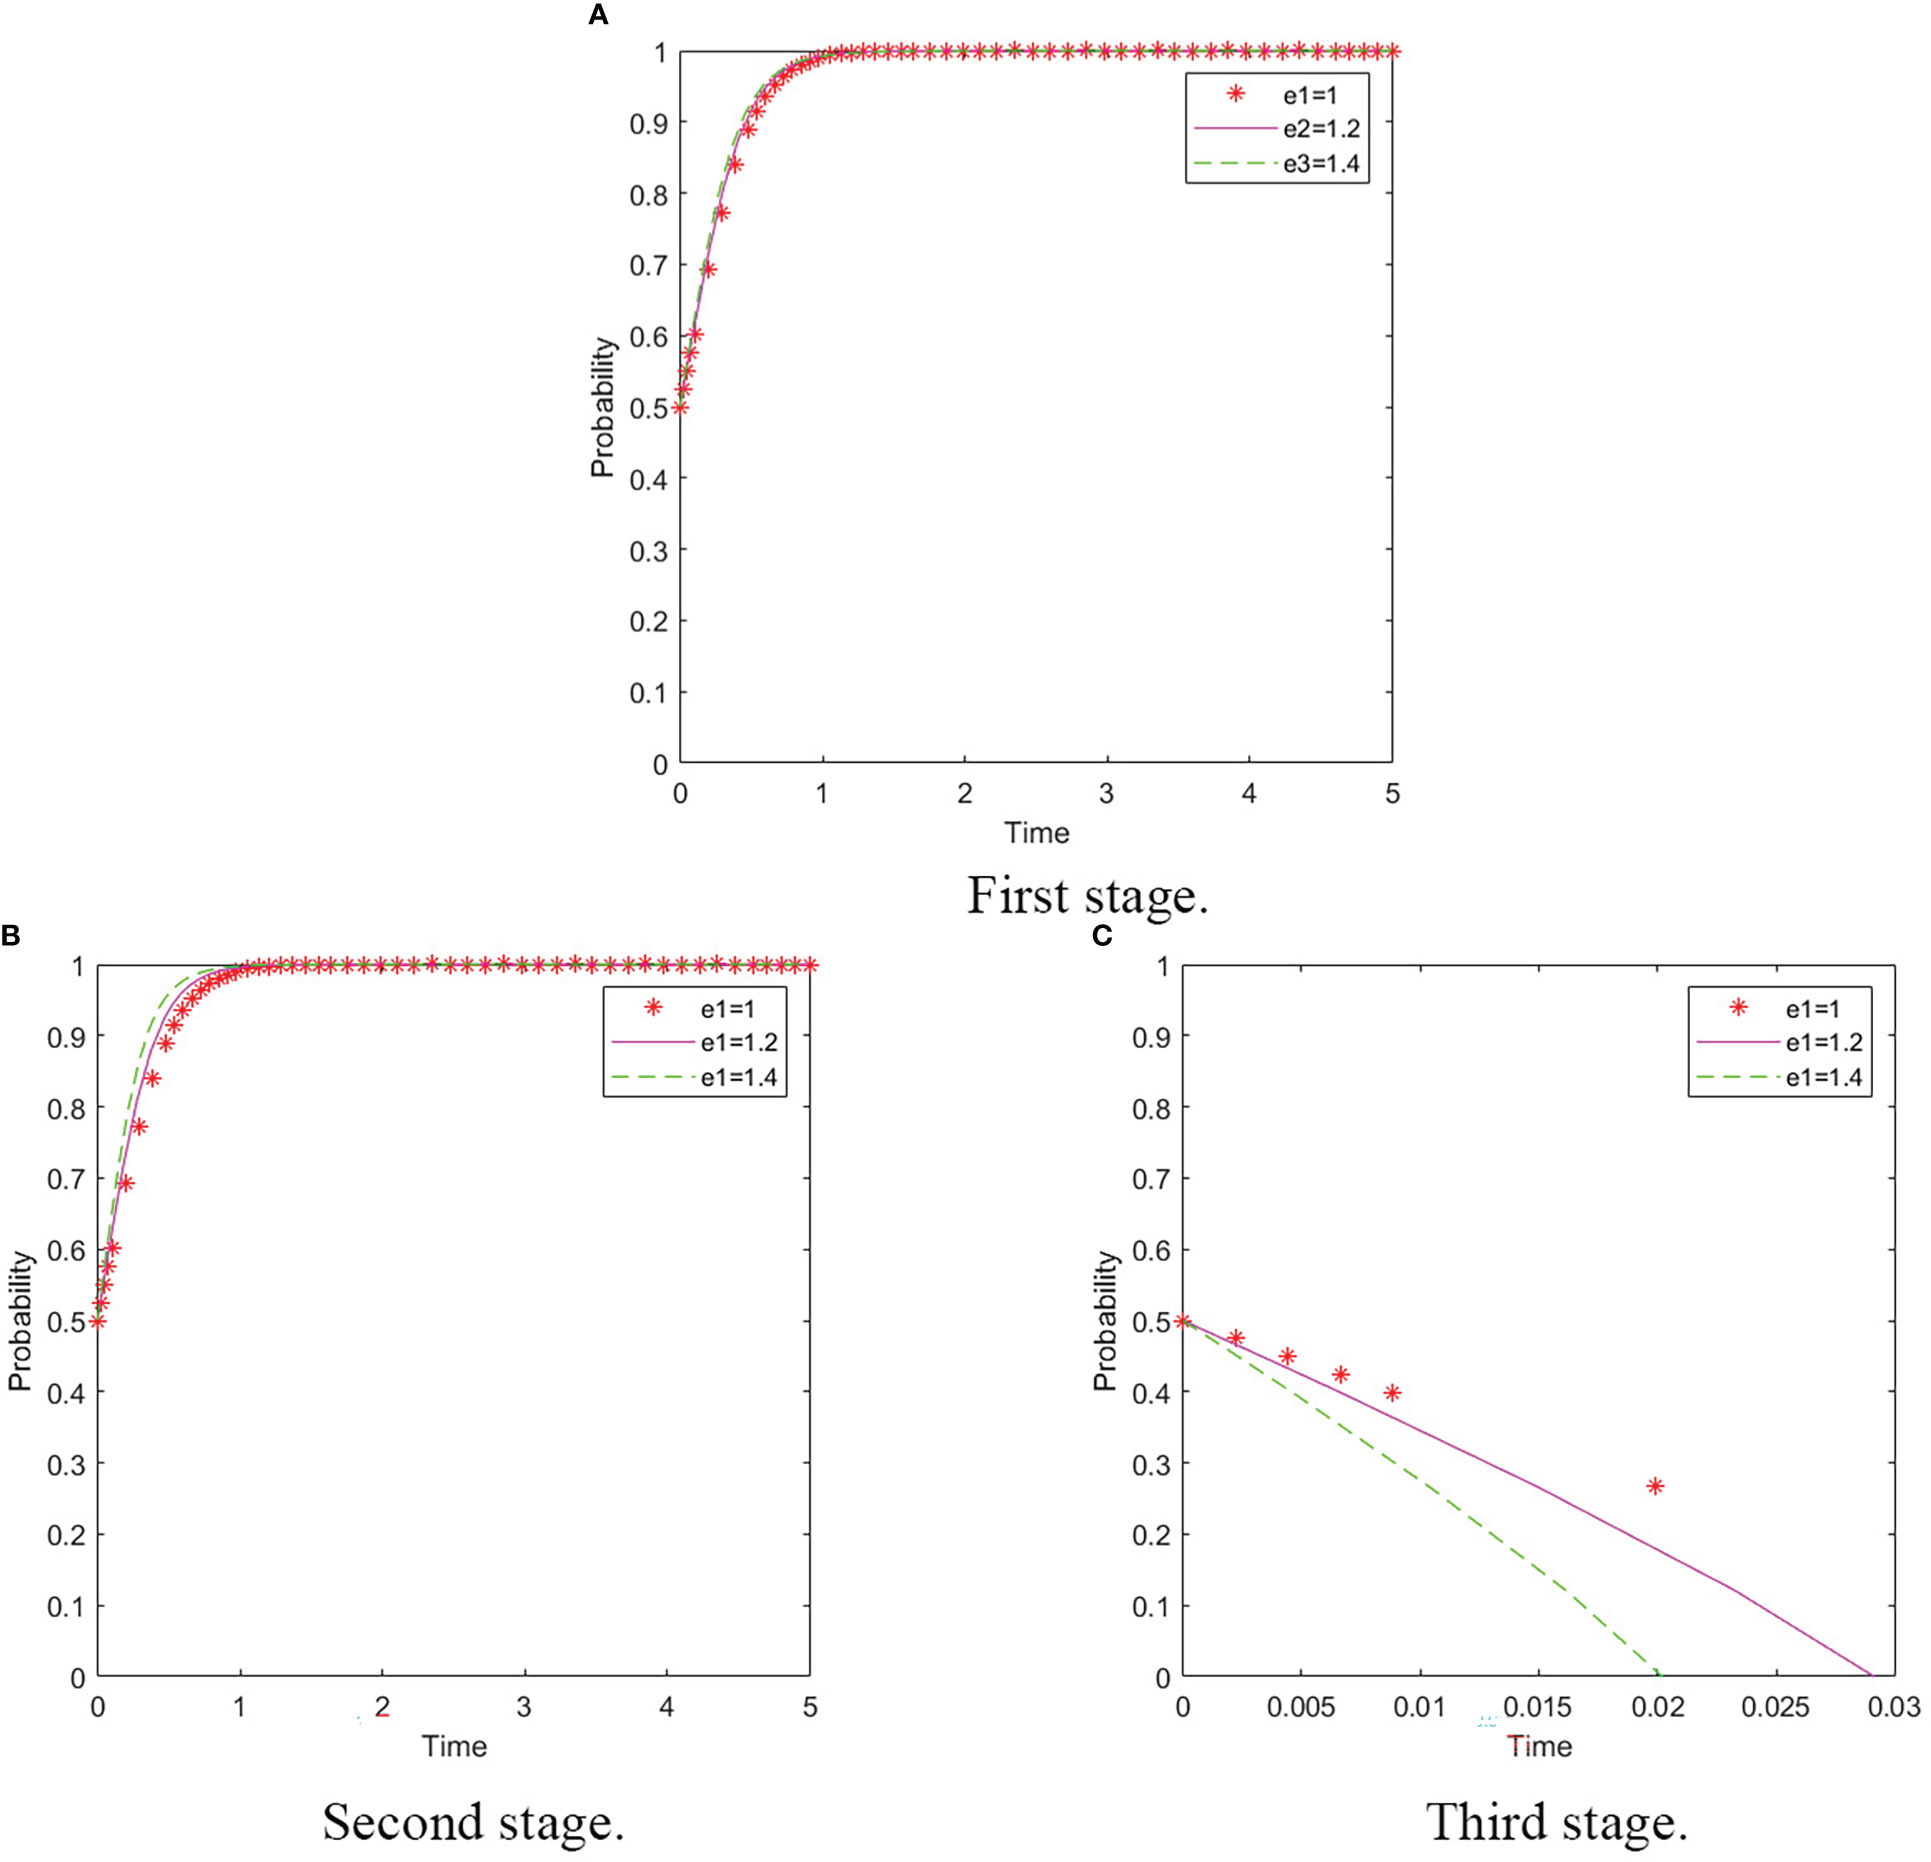
Figure 8 Changing the evolutionary path of the carbon revenue coefficient.
Given that the carbon revenue coefficient is only related to the final revenue of the shipping enterprise, the figure represents the system evolution diagram of the shipping enterprise. In the first two stages, when the technological improvement coefficient changes from 1 to 1.2 to 1.4, the final strategy choice of the shipping enterprise is a standardized operation with low sensitivity. When the parameter value of e1 is larger, its convergence to the stabilization point is faster. In the third stage, the parameter values e1 take 1, 1.2, and 1.4, due to the cyclicality of shipping, they all eventually tend to be associated with the non-standard operation strategy and the sensitivity decreases. When the parameter value of e is larger, its tendency to non-standard operation is faster.
The evolution results indicate that when the carbon revenue coefficient is large enough, shipping enterprises tend to regulate their operation in the first two stages. Nevertheless, because of the influence of cyclical factors, shipping enterprises will tend to operate irregularly in the third stage. Therefore, achieving the standardized operation of shipping enterprises can be easier by changing the carbon revenue coefficient, reflecting the effectiveness of the government carbon quota policy during the peak season of shipping.
According to the numerical background, the evolution path of the three stages is (1, 1)–(1, 1)–(1, 0). The government’s carbon quota policy can better guide the standardized operation of shipping enterprises. If the carbon quota policy remains unchanged, the government’s quota may belong to the invalid state when the market demand changes. The larger the carbon gain coefficient is, the faster the shipping enterprises’ strategy becomes a non-standardized operation.
For the government, according to , the punishment of government to shipping enterprises and the difference between social revenue under high government regulation and social revenue under low regulation have a positive effect on the probability of government choosing high regulation. The reward of the government to shipping enterprises has a negative effect on the probability of the former choosing high regulation. At the same time, the government’s strategic choice is also related to the strategic choice of shipping enterprises.
Therefore, the government should improve the laws and policies related to the carbon trading system, solicit more opinions from all sectors of society, cultivate the awareness of emission reduction among all sectors, and improve the image of the government. The government should forecast the market demand for shipping, gradually relax the regulation during the peak season of shipping, and strengthen the regulation before the arrival of the low season of shipping to realize the scientific and dynamic management of the government. The government should adopt a punishment-based strategy, supplemented by rewards, which can reduce its own regulatory cost and promote the standardized operation of shipping enterprises. At this stage, most propulsion systems of ships are fueled by heavy fuel oil or diesel, and there are fewer zero-carbon fuel-based propulsion systems such as ammonia and hydrogen. A long time is needed to improve and innovate the technology of propulsion systems, and the cost of zero-carbon fuel is also high. These limitations are difficult to accept for shipping enterprises. A Danish catalyst enterprise has predicted that the cost of environmentally friendly ammonia will keep falling. However, the cost of environmentally friendly ammonia is still high compared to fuel (Huang et al., 2021). In addition, due to the increasing technical requirements for carbon emission reduction, the cost of acquiring new ships for shipping enterprises is also increasing, which is not only a huge shock to the shipbuilding industry but also exerts economic pressure on shipping enterprises. Taking into account various factors, the government should consider subsidizing the technological research and development of shipping enterprises to promote their enthusiasm for these efforts to lay the foundation for achieving the carbon emission reduction target of China.
For shipping enterprises, the government’s reward and punishment to shipping enterprises, the image revenue of shipping enterprises, and the technological improvement coefficient have a positive effect on the probability of shipping enterprises choosing standardized operation. The technology R&D cost has a negative effect on this probability. The current strategy choice of shipping enterprises is also related to the strategy choice probability of the government and shipping enterprises in the previous stage.
Consequently, shipping enterprises should increase their research and development on carbon reduction technologies from a long-term perspective. Before the low carbon target was proposed, important shipping enterprises reduced their carbon emissions by lowering their shipping speed. However, with the continuous promotion of the carbon peak and carbon neutral targets, the previous carbon reduction methods can no longer meet the needs of the target. Shipping enterprises must look for more effective carbon reduction measures. At this stage, various measures are in place to reduce carbon emissions from ships, mainly involving energy efficiency technologies, clean fuels for ships, power plants, and CCS. The application of single or multiple energy efficiency technologies mentioned above can effectively improve the energy efficiency of ships and reduce carbon emissions. However, to cope with the medium and long-term emission reduction targets, the application of clean fuels is the fundamental solution. The main marine clean fuels with certain application experience and development potential currently include LNG, methanol, biodiesel, hydrogen, and ammonia. The development of clean fuels and the development of power units are complementary, so shipping enterprises are required to develop the best power units applicable to these clean fuels. For example, the hybrid system can choose different propulsion modes according to the different propulsion requirements of the working conditions. The hybrid system can enhance the adaptability and flexibility of the ship and reduce the carbon emission of the ship, which is currently applied to ships such as passenger ships and inland river cargo ships. The energy saving and emission reduction is about 15% compared with traditional fuel-powered ships (Society CC, 2021). In addition, shipping enterprises need to pay close attention to carbon capture, utilization, and storage technology, which will have a profound impact on the low-carbon development of the shipping industry when its application in ships is mature. Shipping enterprises should actively undertake relevant social responsibilities, regulate their own behavior, improve their enterprise image, and cultivate the low carbon awareness of staff within the shipping enterprises. They also should formulate perfect rules and regulations, regulate the operation of staff, and have complete standards to measure the effectiveness of carbon emission reduction. Shipping enterprises should contribute to carbon emission reduction in the shipping industry and marine environmental protection.
In this paper, we construct a multi-stage evolutionary game model based on the carbon quota policy and the cyclical characteristics of shipping and consider the strategic choices of government and shipping enterprises from a long-term perspective. Subsequently, we conduct a sensitivity analysis to provide guidance for government policy formulation and shipping enterprises’ behavior, which is of great significance. Our findings are as follows.
(1) In the peak season of shipping, the sensitivity of technological improvement coefficient is higher, while the sensitivity of carbon revenue coefficient is lower. The technological improvement coefficient and carbon revenue coefficient have a positive influence on the strategy choice of shipping enterprises, and the larger the value of technical gain coefficient and carbon gain coefficient, the faster they tend to stabilize.
(2) The government’s carbon quota policy is influenced by the market demand for shipping. In the peak season of shipping, the government’s quota policy is binding to shipping enterprises. With the continuation of the peak season of shipping, shipping enterprises have the tendency to regulate their operation actively to maximize revenue. In the low season of shipping, the binding effect of the government’s quota policy on shipping enterprises will be reduced, and even a state of failure will appear.
However, this paper still has many shortcomings. For example, the revenues or expenses of shipping enterprises in carbon trading are not put into the model calculation. Similarly, the precondition that the total carbon emissions should be a fixed value in each stage is not considered, which is different from the actual situation. In the future, we will integrate more revenue scenarios into the model and consider the premise that the total carbon emissions are a fixed value to bring the model closer to reality. Then, we can provide better suggestions for governments and shipping enterprises.
The original contributions presented in the study are included in the article/supplementary material. Further inquiries can be directed to the corresponding author.
GX and WC all contributed to the data collection process and the analysis of the findings. The work was planned, created, designed and all revision and data analysis were done by GX and WC. All authors contributed to the article and approved the submitted version.
This research was funded by the National Natural Science Foundation of China, grant number 52002243.
The authors declare that the research was conducted in the absence of any commercial or financial relationships that could be construed as a potential conflict of interest.
All claims expressed in this article are solely those of the authors and do not necessarily represent those of their affiliated organizations, or those of the publisher, the editors and the reviewers. Any product that may be evaluated in this article, or claim that may be made by its manufacturer, is not guaranteed or endorsed by the publisher.
Aakko-Saksa P. T., Lehtoranta K., Kuittinen N., Jarvinen A., Jalkanen J. P., Johnson K., et al. (2023). Reduction in greenhouse gas and other emissions from ship engines: current trends and future options. Prog. Energy Combust. Sci. 94, 1–26. doi: 10.1016/j.pecs.2022.101055
Angelopoulos J., Duru O., Chlomoudis C. (2016). Spectral dynamics of dry cargo shipping markets theory of long waves - fact or artifact? Int. J. Transport Econ. 43, 227–245.
Chen L. H. (2014). Study on the path choice and countermeasures of carbon emission reduction in china (Changchun, China: Jilin University).
Chen J. H., Fei Y. J., Wan Z. (2019). The relationship between the development of global maritime fleets and GHG emission from shipping. J. Environ. Manage. 242, 31–39. doi: 10.1016/j.jenvman.2019.03.136
Chen W. T., Hu Z. H. (2018). Using evolutionary game theory to study governments and manufacturers' behavioral strategies under various carbon taxes and subsidies. J. Cleaner Product. 201, 123–141. doi: 10.1016/j.jclepro.2018.08.007
Chen Y. H., Wang C., Nie P. Y., Chen Z. R. (2020). A clean innovation comparison between carbon tax and cap-and-trade system. Energy Strateg. Rev. 29, 1–6. doi: 10.1016/j.esr.2020.100483
China MOEAEOTPSRO (2020) Measures for the management of carbon emissions trading (Trial). Available at: http://www.gov.cn/zhengce/zhengceku/2021-01/06/content_5577360.htm (Accessed 2023.1.28).
Chiste C., Van Vuuren G. (2014). Investigating the cyclical behaviour of the dry bulk shipping market. Marit Policy Manage. 41, 1–19. doi: 10.1080/03088839.2013.780216
Commission SMDAR (2017) Shanghai 2017 carbon emission quota allocation plan. Available at: https://fgw.sh.gov.cn/fgw_zyjyhhjbh/20211101/9e56e70eea3b4043a1e7277ed383ec94.html (Accessed 2023.1.28).
Ding Y., Yang Y., Heilig L., Lalla-Ruiz E., Voss S. (2021). Deployment and retrofit strategy for rubber-tyred gantry cranes considering carbon emissions. Comput. Ind. Eng. 161, 1–11. doi: 10.1016/j.cie.2021.107645
Fang G. C., Tian L. X., Liu M. H., Fu M., Sun M. (2018). How to optimize the development of carbon trading in China-enlightenment from evolution rules of the EU carbon price. Appl. Energy 211, 1039–1049. doi: 10.1016/j.apenergy.2017.12.001
Fan S. H., Lu Z. I. (2022). Research on the peak carbon dioxide emission strategy of Chinese port based on carbon emission estimation. Front. Environ. Sci. 9, 789970. doi: 10.3389/fenvs.2021.789970
Fan H. M., Yu J. Q., Liu X. Z. (2019). Tramp ship routing and scheduling with speed optimization considering carbon emissions. Sustainability 11 (22), 1–19. doi: 10.3390/su11226367
Gao J. J., Chi M. L., Hu Z. H. (2022). Energy consumption optimization of inland sea ships based on operation data and ensemble learning. Math. Probl. Eng. 2022, 1–13. doi: 10.1155/2022/5448359
Goulielmos A. M., Stropoulou E. (2006). Determining the duration of cycles in the market of second-hand tanker ships, 1976-2001: Is prediction possible? Int. J. Bifurcat. Chaos 16, 2119–2127. doi: 10.1142/S0218127406015969
He S. C. (2016). The development, reformation and prospect of the EU emission trade scheme (Changchun, China: Jilin University).
Huang L. C., Zhang X. Y., Kan A. K., Lou H. J. (2021). China's shipping industry carbon emissions status, changing trends and carbon neutral measures. J. Qingdao Ocean Ship. Mariners College 42, 48–52.
Jiang Y., Lei Y. L., Yang Y. Z., Wang F. (2018). Factors affecting the pilot trading market of carbon emissions in China. Petrol. Sci. 15, 412–420. doi: 10.1007/s12182-018-0224-3
Kao S. L., Chung W. H., Chen C. W. (2022). AIS-based scenario simulation for the control and improvement of ship emissions in ports. J. Mar. Sci. Eng. 10 (2), 1–17. doi: 10.3390/jmse10020129
Li R. R., Li S. Y. (2021). Carbon emission post-coronavirus: Continual decline or rebound? Struct. Change Econ. Dyna. 57, 57–67. doi: 10.1016/j.strueco.2021.01.008
Liu Y., Xin X., Yang Z., Chen K., Li C. (2021). Liner shipping network-transaction mechanism joint design model considering carbon tax and liner alliance. Ocean Coast. Manage. 212, 1–13. doi: 10.1016/j.ocecoaman.2021.105817
Liu L. X., Zhu Y. C., Guo S. B. (2020). The evolutionary game analysis of multiple stakeholders in the low-carbon agricultural innovation diffusion. Complexity 2020, 1–12. doi: 10.1155/2020/6309545
Lv M. C., Bai M. Y. (2021). Evaluation of china's carbon emission trading policy from corporate innovation. Finan. Res. Lett. 39, 1–9. doi: 10.1016/j.frl.2020.101565
Ma S. (2009). Shipping market cycle theory and changes in today's dry bulk shipping market. Water Transport Manage. 31, 1–5.
Merika A., Theodoropoulou S. (2015). The relationship between business cycles and capital structure choice: The case of the international shipping industry. J. Econ. Asymmetries 12 (2), 92–99. doi: 10.1016/j.jeca.2015.04.001
Misra A., Panchabikesan K., Gowrishankar S. K., Ayyasamy E., Ramalingam V. (2017). GHG emission accounting and mitigation strategies to reduce the carbon footprint in conventional port activities - a case of the port of chennai. Carbon Manage. 8, 45–56. doi: 10.1080/17583004.2016.1275815
Peng Y., Li X. D., Wang W. Y., Wei Z. J., Bing X., Song X. Q. (2019). A method for determining the allocation strategy of on-shore power supply from a green container terminal perspective. Ocean Coast. Manage. 167, 158–175. doi: 10.1016/j.ocecoaman.2018.10.007
Rehmatulla N., Calleya J., Smith T. (2017). The implementation of technical energy efficiency and CO2 emission reduction measures in shipping. Ocean Eng. 139, 184–197. doi: 10.1016/j.oceaneng.2017.04.029
Rui W. (2021). The research on the influence factors of carbon emission price in China–—empirical study based on the panel quantile model (Xi'an, China: Northwest University).
Shen N., Zhao Y. Q., Deng R. M. (2020). A review of carbon trading based on an evolutionary perspective. Int. J. Climate Change Strateg. Manage. 12, 739–756. doi: 10.1108/IJCCSM-11-2019-0066
Shi K., Weng J. X. (2021). Impacts of the COVID-19 epidemic on merchant ship activity and pollution emissions in shanghai port waters. Sci. Total Environ. 790, 1–10. doi: 10.1016/j.scitotenv.2021.148198
Society CC (2021) Shipping low carbon development outlook 2021. Available at: https://www.ccs.org.cn/ccswz/articleDetail?id=202111050991394944 (Accessed 2023.1.28).
Ullman R., Bilbao-Bastida V., Grimsditch G. (2013). Including blue carbon in climate market mechanisms. Ocean Coast. Manage. 83, 15–18. doi: 10.1016/j.ocecoaman.2012.02.009
Wang J. Q., Gu F., Liu Y. P., Fan Y., Guo J. F. (2019). Bidirectional interactions between trading behaviors and carbon prices in European union emission trading scheme. J. Cleaner Product. 224, 435–443. doi: 10.1016/j.jclepro.2019.03.264
Wang L. K., Peng C., Shi W. M., Zhu M. (2020). Carbon dioxide emissions from port container distribution: Spatial characteristics and driving factors. Transport. Res. Part D: Transport Environ. 82, 1–11. doi: 10.1016/j.trd.2020.102318
Wu L. P. (2021). How can carbon trading price distortion be corrected? an empirical study from china's carbon trading pilot markets. Environ. Sci. pollut. Res. 28, 66253–66271. doi: 10.1007/s11356-021-15524-8
Wu Y. J., Yin J. B., Sheng P. (2018). The dynamics of dry bulk shipping market under the shipping cycle perspective: Market relationships and volatility. Transport. Res. Rec. 2672, 1–9. doi: 10.1177/0361198118792756
Wu J. P., Zhang H. B., Pan Y. W., Krause-Jensen D., He Z. G., Fan W., et al. (2020). Opportunities for blue carbon strategies in China. Ocean Coast. Manage. 194, 1–10. doi: 10.1016/j.ocecoaman.2020.105241
Xia Z. C., Guo Z. J., Wang W. Y., Jiang Y. (2021). Joint optimization of ship scheduling and speed reduction: A new strategy considering high transport efficiency and low carbon of ships in port. Ocean Eng. 233, 1–13. doi: 10.1016/j.oceaneng.2021.109224
Xia Q. Y., Li L., Dong J., Zhang B. (2021). Reduction effect and mechanism analysis of carbon trading policy on carbon emissions from land use. Sustainability 13 (17), 1–22. doi: 10.3390/su13179558
Xiao G., Wang T., Chen X., Zhou L. (2022). Evaluation of ship pollutant emissions in the ports of Los Angeles and long beach. J. Mar. Sci. Eng. 10, 1206. doi: 10.3390/jmse10091206
Xu L., Yang S. M., Chen J. H., Shi J. (2021). The effect of COVID-19 pandemic on port performance: Evidence from China. Ocean Coast. Manage. 209, 1–6. doi: 10.1016/j.ocecoaman.2021.105660
Yang M. Y., Chen L., Msigwa G., Tang K. H. D., Yap P. S. (2022). Implications of COVID-19 on global environmental pollution and carbon emissions with strategies for sustainability in the COVID-19 era. Sci. Total Environ. 809, 1–16. doi: 10.1016/j.scitotenv.2021.151657
Yan X. P., He Y. P., Fan A. L. (2023). Carbon footprint prediction considering the evolution of alternative fuels and cargo: A case study of Yangtze river ships. Renewable Sustain. Energy Rev. 173, 1–14. doi: 10.1016/j.rser.2022.113068
Yin Y. K., Jiang Z. H., Liu Y. Z., Yu Z. (2019). Factors affecting carbon emission trading price: Evidence from China. Emerg. Markets Finan. Trade. 55, 3433–3451. doi: 10.1080/1540496X.2019.1663166
Yin C. Z., Ke Y. D., Chen J. H., Liu M. (2021). Interrelations between sea hub ports and inland hinterlands: Perspectives of multimodal freight transport organization and low carbon emissions. Ocean Coast. Manage. 214, 1–14. doi: 10.1016/j.ocecoaman.2021.105919
Yin J. B., Wu Y. J., Lu L. J. (2019). Assessment of investment decision in the dry bulk shipping market based on real options thinking and the shipping cycle perspective. Marit Policy Manage. 46, 330–343. doi: 10.1080/03088839.2018.1520400
Yuan Y. H., Zhang B. W., Wang L., Wang L. (2022). Low-carbon strategies considering corporate environmental responsibility: Based on carbon trading and carbon reduction technology investment. Sustainability 14, 1–18. doi: 10.3390/su14116683
Yuan X. M., Zheng C. C. (2022). Evolutionary game and simulation analysis of low-carbon technology innovation with multi-agent participation. IEEE Access. 10, 11284–11295. doi: 10.1109/ACCESS.2022.3143869
Yu N., Chen J., Cheng L. (2022). Evolutionary game analysis of carbon emission reduction between government and enterprises under carbon quota trading policy. Int. J. Environ. Res. Public Health 19 (14), 1–22. doi: 10.3390/ijerph19148565
Zhang Q. F. (2021). Research of china's emission trading scheme under the goal of peak emissions (Hangzhou, China: Zhejiang University).
Zhang S. Y., Wang C. X., Yu C. (2019). The evolutionary game analysis and simulation with system dynamics of manufacturer's emissions abatement behavior under cap-and-trade regulation. Appl. Math. Comput. 355, 343–355. doi: 10.1016/j.amc.2019.02.080
Zhao T., Liu Z. X. (2019). A novel analysis of carbon capture and storage (CCS) technology adoption: An evolutionary game model between stakeholders. Energy 189, 1–12. doi: 10.1016/j.energy.2019.116352
Zhao X. G., Zhang Y. Z. (2018). The system dynamics (SD) analysis of the government and power producers' evolutionary game strategies based on carbon trading (CT) mechanism: A case of China. Sustainability 10, 1–18. doi: 10.3390/su10041150
Keywords: carbon quota, shipping cycle, government, shipping enterprises, dynamic game
Citation: Xiao G and Cui W (2023) Evolutionary game between government and shipping enterprises based on shipping cycle and carbon quota. Front. Mar. Sci. 10:1132174. doi: 10.3389/fmars.2023.1132174
Received: 26 December 2022; Accepted: 31 January 2023;
Published: 22 February 2023.
Edited by:
Jihong Chen, Shenzhen University, ChinaReviewed by:
Dongwei He, Shanghai Normal University, ChinaCopyright © 2023 Xiao and Cui. This is an open-access article distributed under the terms of the Creative Commons Attribution License (CC BY). The use, distribution or reproduction in other forums is permitted, provided the original author(s) and the copyright owner(s) are credited and that the original publication in this journal is cited, in accordance with accepted academic practice. No use, distribution or reproduction is permitted which does not comply with these terms.
*Correspondence: Guangnian Xiao, Z254aWFvQHNobXR1LmVkdS5jbg==
Disclaimer: All claims expressed in this article are solely those of the authors and do not necessarily represent those of their affiliated organizations, or those of the publisher, the editors and the reviewers. Any product that may be evaluated in this article or claim that may be made by its manufacturer is not guaranteed or endorsed by the publisher.
Research integrity at Frontiers
Learn more about the work of our research integrity team to safeguard the quality of each article we publish.