 Guangnian Xiao
 Tian Wang
 Yuhang Luo
95% of researchers rate our articles as excellent or good
Learn more about the work of our research integrity team to safeguard the quality of each article we publish.
Find out more
ORIGINAL RESEARCH article
Front. Mar. Sci. , 28 February 2023
Sec. Marine Affairs and Policy
Volume 10 - 2023 | https://doi.org/10.3389/fmars.2023.1131948
This article is part of the Research Topic Global Vessel-Source Maritime Pollution Governance—Technical Innovation and Policy Orientation View all 14 articles
The huge fuel consumption of shipping activities has a great impact on the ecological environment, port city environment, air quality, and residents’ health. This paper uses Automatic Identification System (AIS) data records and ship-related data in 2021 coastal waters of the United States to calculate pollutant emissions from ships in 30 ports of the United States in 2021. After calculating the pollutant emissions from ships at each port, the multiscale geographically weighted regression (MGWR) model is used to analyze the factors affecting the ship pollutant emissions. Geographically weighted regression (GWR) model is used to investigate the spatial heterogeneity of various factors affecting the characteristics of ship pollutant emissions at different scales. This paper mainly compares the effect of models of GWR and MGWR. MGWR may truly reveal the scale difference between different variables. While controlling the social and economic attributes, the coastline length, container throughput, and population are used to describe the spatial effects of ship pollutant emissions in the United States. The results denote that the distribution trend of ship pollutant emissions has a gap based on various ship types and ports. NOx accounts for the highest proportion of pollutant emissions from port ships, followed by SO₂ and CO. The impact coefficients of coastline length and population on pollutant emissions in port areas are mostly positive, indicating that the growth of coastline length and population will increase pollutant emissions in port areas, while the effect of container throughput is opposite. Relevant departments should put forward effective measures to curb NOx emission. Port managers should reasonably plan the number of ship transactions according to the coastline length of the port.
The global shipping industry takes a crucial role in international logistics and the growth of the world economy (Yu et al., 2022). However, increased maritime transport activities have caused severe harm to the marine environment. With the advancement of technology and equipment, including transmission and positioning function, these emerging technical means provide real-time observation information for the daily operation of ships and provide data support for scientific research activities (Jiang et al., 2023). The Automatic Identification System (AIS) has become a critical tool in supporting and maintaining the growth of the shipping industry, which provides real-time monitoring of ship navigation and location information (Shu et al., 2023). Green development is an important development topic in the global port and shipping industry (Magazine, 2018; Xiao et al., 2022).
The International Maritime Organization (IMO) was erected by the United Nations. Its main objectives are to promote shipping technical cooperation among countries, ensure the safety of marine sailing activity, improve the efficiency of ship navigation, and prevent and control pollutants emitted by ships (Zhi, 2021). It can also greatly promote the technical cooperation between countries in shipping and control the consistency of ship pollutant emissions standards. On the premise of maintaining the safety of maritime transport, it improves the efficiency of ship navigation and the quantification and controllability of pollutants generated by ship activities. IMO has formulated a range of criteria for controlling the ship pollutant discharge, and constantly updated these conventions to solve the new problems. The “Sulfur Limit Order” for vessels in 2020 has attracted the attention of relevant enterprises and shipping departments in various countries (Xiao and Cui, 2023). In order to reduce the emission of NOX, SOX, and particulate matter during ship operation, IMO has set up ship Emission Control Areas (ECA) internationally, and the EU, the United States, China, and others have also set up ship emission control areas in major sea areas (Xu et al., 2021a). Relevant policies have certain influence on the discharge of pollutants from ships, and the discharge of pollutants from ships has some spatial effects (Chen et al., 2022).
The goals of this study are given as follows. First, the major ports in the United States are taken as the object and the ship pollutant emissions are quantified. Second, the model of Multiscale Geographically Weighted Regression (MGWR) is applied for analyze the spatial heterogeneity of various influencing factors on ship pollutant emission characteristics. Third, the difference of ship pollution emission characteristics between different ports is evaluated.
In recent years, the number of studies on the ship pollutant emissions has gradually increased, most of which are about the compilation of the pollutant emissions list from ships, the harm of the pollutant discharge caused by vessels to the environment, and the exploration of how to establish more effective policies to curb the excessive emissions of pollutants from ships (Shi et al., 2020). Based on the available studies, the compilation methods of ship discharge inventories in the world mainly include “top-down” method (fuel method and trade method) and “bottom-up” method (statistical method and dynamic method) (Liu et al., 2018). Liu (2020) used the trade data of Qingdao Port between 2005 and 2017 to establish the ship emission inventory through the trade method, mainly including five atmospheric pollutants: NOx, SO2, CO, PM10, and VOCs. Lee et al. (2021) chose the “bottom-up” approach to create a comprehensive local discharge inventory of ships from the Incheon Port in 2019. The data were collected by the Vessel Tracking Services (VTS). The study indicated that CO2 emissions dominated, followed by NOx and SOx. Tokuslu (2021) calculated the ships’ exhaust emissions throughout the states of berthing, maneuvering, and cruising in Samsun Port using ship activity-based methods. The results showed that cargo carriers, ro-ro ships, and oil tankers are the top port pollutant emission sources, with these types of ship generating nearly 91% of all port emissions. Meanwhile, the highest pollutant emissions are generated when the ship is in the cruising state, accounting for 86% of the total. In addition, the research results also show that ship pollution emissions will affect the population size of port cities, which was not involved in previous studies. Yang et al (2021). proposed the ship emission inventory according to the AIS data from Tianjin Port with the “bottom-up” method. According to the inventory it can be found that NOx was the main pollutant, followed by SO2. In terms of temporal distribution, NOx, SO2, and other ship pollutants will not only affect the air environment in the surrounding areas, but also particularly in summer and autumn. Chen et al. (2021) established a ship discharge inventory estimation method according to operating modes to capture the features of ship pollutant emissions. The operating modes of ships were first classified through AIS data, and then emissions were estimated based on the identified operating modes. Finally, ship emissions in the water of Dalian Port were computed and the research showed that port operators could decrease ship emissions by controlling the sulfur content of marine fuel and requesting tugboats to operate at lower engine loads. Feng et al. (2018) made use of the ship traffic emission model STEAM2 to establish an inventory of ship emissions at four typical cross-sections of the Yangtze River in Jiangsu in 2017, with data derived from AIS data, field observation and research and other data on ship characteristics. And the spatial distribution and temporal variation patterns of vessel pollution source emissions at each section were also analyzed. The results indicated that SO2 and NOx were the main air pollutant emissions from ships in the Jiangsu section of the Yangtze River; March to April was the peak period of ship emissions, and February and September were the trough periods; the contribution of pollutant discharge from container ships and cargo ships is the highest, exceeding 90% of the total. Lee et al. (2020) analyzed the inventory of non-GHG emissions from ships in Incheon Port. In order to obtain reliable estimates, a “bottom-up” methodology based on operations with real-time ship activity data recorded by the VTS was used. NOx and SOx dominated ship emissions. The study also discussed the necessity for long-term policies, including designating a local emissions control area and establishing an emissions management platform. Toscano et al. (2021) used the “bottom-up” approach to set up a global ship pollutant discharge inventory including the emissions of NOx, SO2, and PM from ships with 2018 AIS data. The objective of the research is to evaluate the amount of ship pollutant emissions in port and its effects on the atmosphere of contamination. Murcia et al (Murcia González, 2021). assessed port-wide emissions from port-assisted vessels with “bottom-up” method, including estimates of CO2, NOx, SOx, and PM, by collecting data such as real-time AIS data and IMO-established emission factors.
Shipping activities are the major source of anthropogenic emissions of particulate matter in most parts of the world and can take a major effect on the marine environment, atmospheric quality, and the health of nearby residents. Kuittinen et al. (2020) presented the number of particulate matter particles produced by global shipping activities in 2016, and the spatial distribution showed that the particulate matter emissions from shipping were mainly concentrated near the coastline, but there were also large quantities of emissions in the open ocean. In order to control pollution emissions from ships, IMO had established a series of related conventions and updated them according to the needs of different times, such as the sulfur limit order, the “preliminary strategy for reducing greenhouse gas emissions from ships” formulated for greenhouse gas emissions. Ma et al. (2021) proposed a non-linear integer programming model to solve the problem of concurrently optimizing the route, speed, and bunkering strategy of ship operations under the constraints of the ECA policy.
Some researchers have started to compare and assess the effect of the implementation of policies on decreasing ship emissions. Repka et al. (2021) assessed the changes in SOx and NOx deposition from ship exhaust discharge in 2014 and 2016 of the Baltic Sea regions. The results showed a 7.3% reduction in total SOx deposition in the study area. Shi et al. (2020) evaluated ship pollutant emissions after the implementation of ECA policies in Shanghai Port with 2017 AIS data. The results showed that ECA policies differed obviously between various ship types and waters, and that pollutant emissions from cargo ships, including SO2 and PM2.5, were most affected by ECA policies. However, NOx emissions have not changed significantly under the various ECA policies. The results also suggested that the ECA policy might lead to significant reductions in pollutant emissions from Yangshan and Wusong water areas in the future. Tauchi et al. (2022) evaluated the reduction of the global sulfur cap requirement from 3.5% to 0.5% in 2020, and the research showed that the gaseous sulfur dioxide content in the sea dropped immediately after the regulation took effect. Wang et al. (2021) compiled a series of high spatial and temporal ship discharge inventories from 2016 to 2019 across China to provide an effective and comprehensive ex-post assessment of the policy for ships. SO2 emissions from ships fell by 29.6% over the three years, as did PM emissions by 26.4%, while the emissions of NOx raised by 13.0%. Yang et al. (2022) calculated the ship discharge in Qingdao based on 2020 AIS data in order to evaluate the environmental benefits of the policy. The results suggested that after the implementation of the policy, the air pollution from ships in various regions was substantially reduced, especially SO2 and PM. Zhang et al. (2022b) applied to empirical data modelling in the Yangtze River Delta region with the regression discontinuity (RD) approach to assess the impact of the ECA policies. The statistical results suggested that implementation of the ECA policies in Shanghai and Suzhou achieved SO2 reductions at the 1% level of significance. However, the effect of the policy on SO2 concentrations in Ningbo and Nanjing is not effective. Zhang et al. (2019) compared the impact of the domestic emissions control area policies on SO2 and particulate matter in Shanghai from 2015 to 2017. The research results showed that SO2 decreased significantly by 27–55% after implementing of the policies. Zhou and Fan (2021) used the Difference-in-Difference (DID) model to determine the impact of fuel switching regulations on SO2 content in port air. The study collected the wind speed, wind direction, and SO2 concentration, as well as the time of the arrival and departure. Due to the use of high sulfur fuels the effect of increased SO2 concentration in the air of the port was particularly significant when the wind direction was downwind. Wan et al. (2019) applied the DID model to assess the effect of implementing the ECA policies on sulfur emissions from ships. The results of the study showed that the ECA policies had significant influence on reducing SO2 concentrations in the Yangtze River Delta and Bohai Rim regions. However, it has no positive impact on the reduction of SO2 content in the Pearl River Delta, which may be related to a series of policies adopted before.
In addition to the effect of technological changes and international policies on the inhibition of ship pollutant discharge, other external factors may also affect pollutant emissions from ships to some extent. Xu et al. (2021b) assessed the effect of the COVID-19 outbreak and measures taken by the government to deal with the epidemic on shipping trade. The results suggested that shipping business would grow to some extent as the outbreak was further controlled. Luigia and Franco (Mocerino and Quaranta, 2022) quantified the SOx emissions, NOx emissions, and CO2 emissions and estimated their generation and reduction. Then the results for 2020 were compared with the assumed emissions without closure control and with the emissions of the corresponding period of the previous year. Li et al. (2022) studied the effect of ship massification on typical pollutant emissions. The study showed that an increase in average ship tonnage resulted in a significant reduction in ship traffic and a significant increase in cargo volume, resulting in an increase of about 7.7% in pollution reduction compared to a constant average ship tonnage. Shi and Weng (2021) compared AIS data in February of 2019 and 2020 to verify whether the COVID-19 has an impact on merchant shipping trade activities and the influence of the epidemic on pollutant emissions of ships in Shanghai Port. The epidemic was likely to lead to longer turnaround times for ships, with significantly lower emissions of cargo ships, while emissions of tankers and container ships were slightly reduced due to strict COVID-19 quarantine measures. The research also shows that a slow downward trend in SOx and NOx emissions observed. Saliba et al. (2021) analyzed the influence of the COVID-19 on maritime transportation modes and air quality.
Weng et al. (2020) estimated emissions of ships with Yangtze River estuary AIS data with high precision using the STEAM model. This study explored some factors affecting ship emissions such as ship types, modes of operation, and unloading facilities, etc. The findings indicated that many ship emissions were produced during the states of slow steam and cruising, and time and location had significant influence on ship emissions. The spatial data was found to be heterogeneous or non-stationary, which highlights the importance of selecting the appropriate spatial modeling tool to analyze ship emissions. One such tool is the Geographically Weighted Regression (GWR) analysis technique, which is often used to analyze pollution emissions (Lu et al., 2020). Alahmadi et al. (2019) applied a local GWR model to understand and quantify the impact of the emissions form marine transportation department in the Red Sea. The research results showed that the local GWR model outperformed the global Ordinary Least Squares (OLS) regression model. However, the basic GWR model often uses the same bandwidth and a single kernel function to calculate weights, which also causes the spatial variation of all parameter estimates to present the same scale characteristics. The MGWR technique, on the other hand can reveal the scale differences of variable truly. Fotheringham et al. (2017) applied the GWR and MGWR models to two simulated datasets with known attributes and an empirical dataset on the Irish famine, and then compared the regression results of the two models. The results show that MGWR has significant advantages in parameter surface with different spatial heterogeneity levels, and can also provide valuable information about the operation scale of different processes. Zhang et al. (2022a) used MGWR model to analyze the spatial heterogeneity of the influence of tourism development on the urban-rural income disparity and its scaling pattern. The results of the comparative model fitting founded that the MGWR model was closer to the regression results of the actual values. An et al. (2022) controlled for three socio-economic attribute variables. Then the GWR and MGWR models were used to describe Wuhan’s built environment by detailing. It was found that the MGWR model worked better to explain all influencing factors than GWR. Tholiya et al. (2022) used OLS, GWR, and MGWR regression to analyze the factors of the water supply distribution and spatial patterns. The study pointed out that MGWR outperforms the GWR model, while the two models significantly outperform the OLS model, and proved how local factors influence variables. At present, there are few studies considering the use of GWR models to analyze ship pollution emissions. And there are few studies on spatial econometrics in ports and most concern industries and regional development in port areas.
In summary, the academic contributions of this paper are about three directions. First, this study calculates the pollutant emissions of 30 ports in the United States, including SO2, NOX, and CO emissions, and analyzes the distribution of ship types and ports. Second, the MGWR model is used to explain the impact of pollutant emissions from ports in the United States with the length of coastline, population, and container throughput as independent variables. Third, the regression effects of OLS, GWR, MGWR, and neural network are compared, which proves the superiority of MGWR in interpreting this study.
The United States Coast Guard collects AIS data through on-board navigation safety equipment, which supports transmission and detection of the position and characteristics of ships in the United States waters in real time. The AIS data source that supplies real-time data feeds back the AIS data set of the current time period, which cannot meet the requirement of simultaneously providing AIS data in different periods. Real-time AIS data is presented for time points, while historical AIS data is more like a collection of real-time AIS data. Real-time AIS data is convenient for relevant departments to supervise marine vessel information and monitor abnormal conditions, and it is also helpful for shipowners and cargo owners to obtain real-time ship sailing progress. Historical AIS data can reflect the development and changes of marine shipping and provide relevant departments to formulate strategies. At the same time, it can also provide a data basis for the calculation of pollutant emissions, which is also the data type selected to build model.
Since the code designation of ship types in AIS datasets from different sources may be different, the user manual on the same website was also searched when acquiring AIS data. In the report “Frequently Asked Questions: AIS Data and Tools,” the detailed ship types and their corresponding codes are given, and the version is updated to “Vessel Type Code 2018” (AIS vessel type and group codes used by the marine cadastre project[EB/OL] 2018-05-23).
Different from the general two-digit ship code, its ship code is a value from 0 to 1025, because it leaves a lot of blanks in the ship code for use. A fine distinction is made for each type of ship according to its nature and purpose (AIS vessel type and group codes used by the marine cadastre project[EB/OL] 2018-05-23). The ships are according to their primary classification and are mainly divided into six categories, and the correspondence between ship types and codes is shown in the Table 1 (Repka et al., 2021).
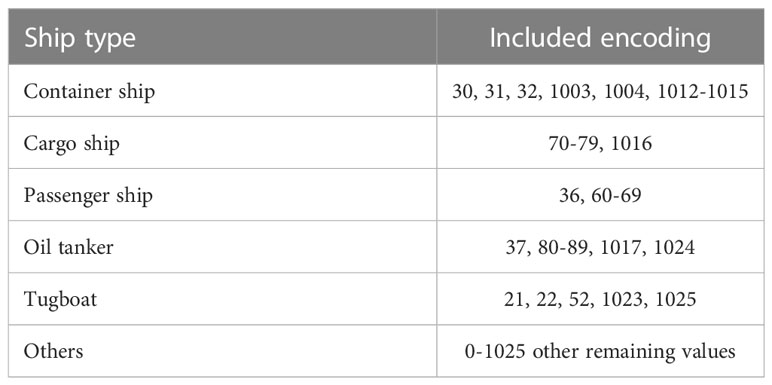
Table 1 Ship types and code correspondence.
This paper calculates ship pollutant emissions based on 2021 American AIS data, and the objective is to use MGWR model to analyze the spatial heterogeneity of ship pollutant emission characteristics of major American ports at different scales. The scope of major ports is divided according to latitude and longitude and route, and ship pollutant emissions in 2021 are calculated. The framework of this paper is illustrated in the Figure 1.
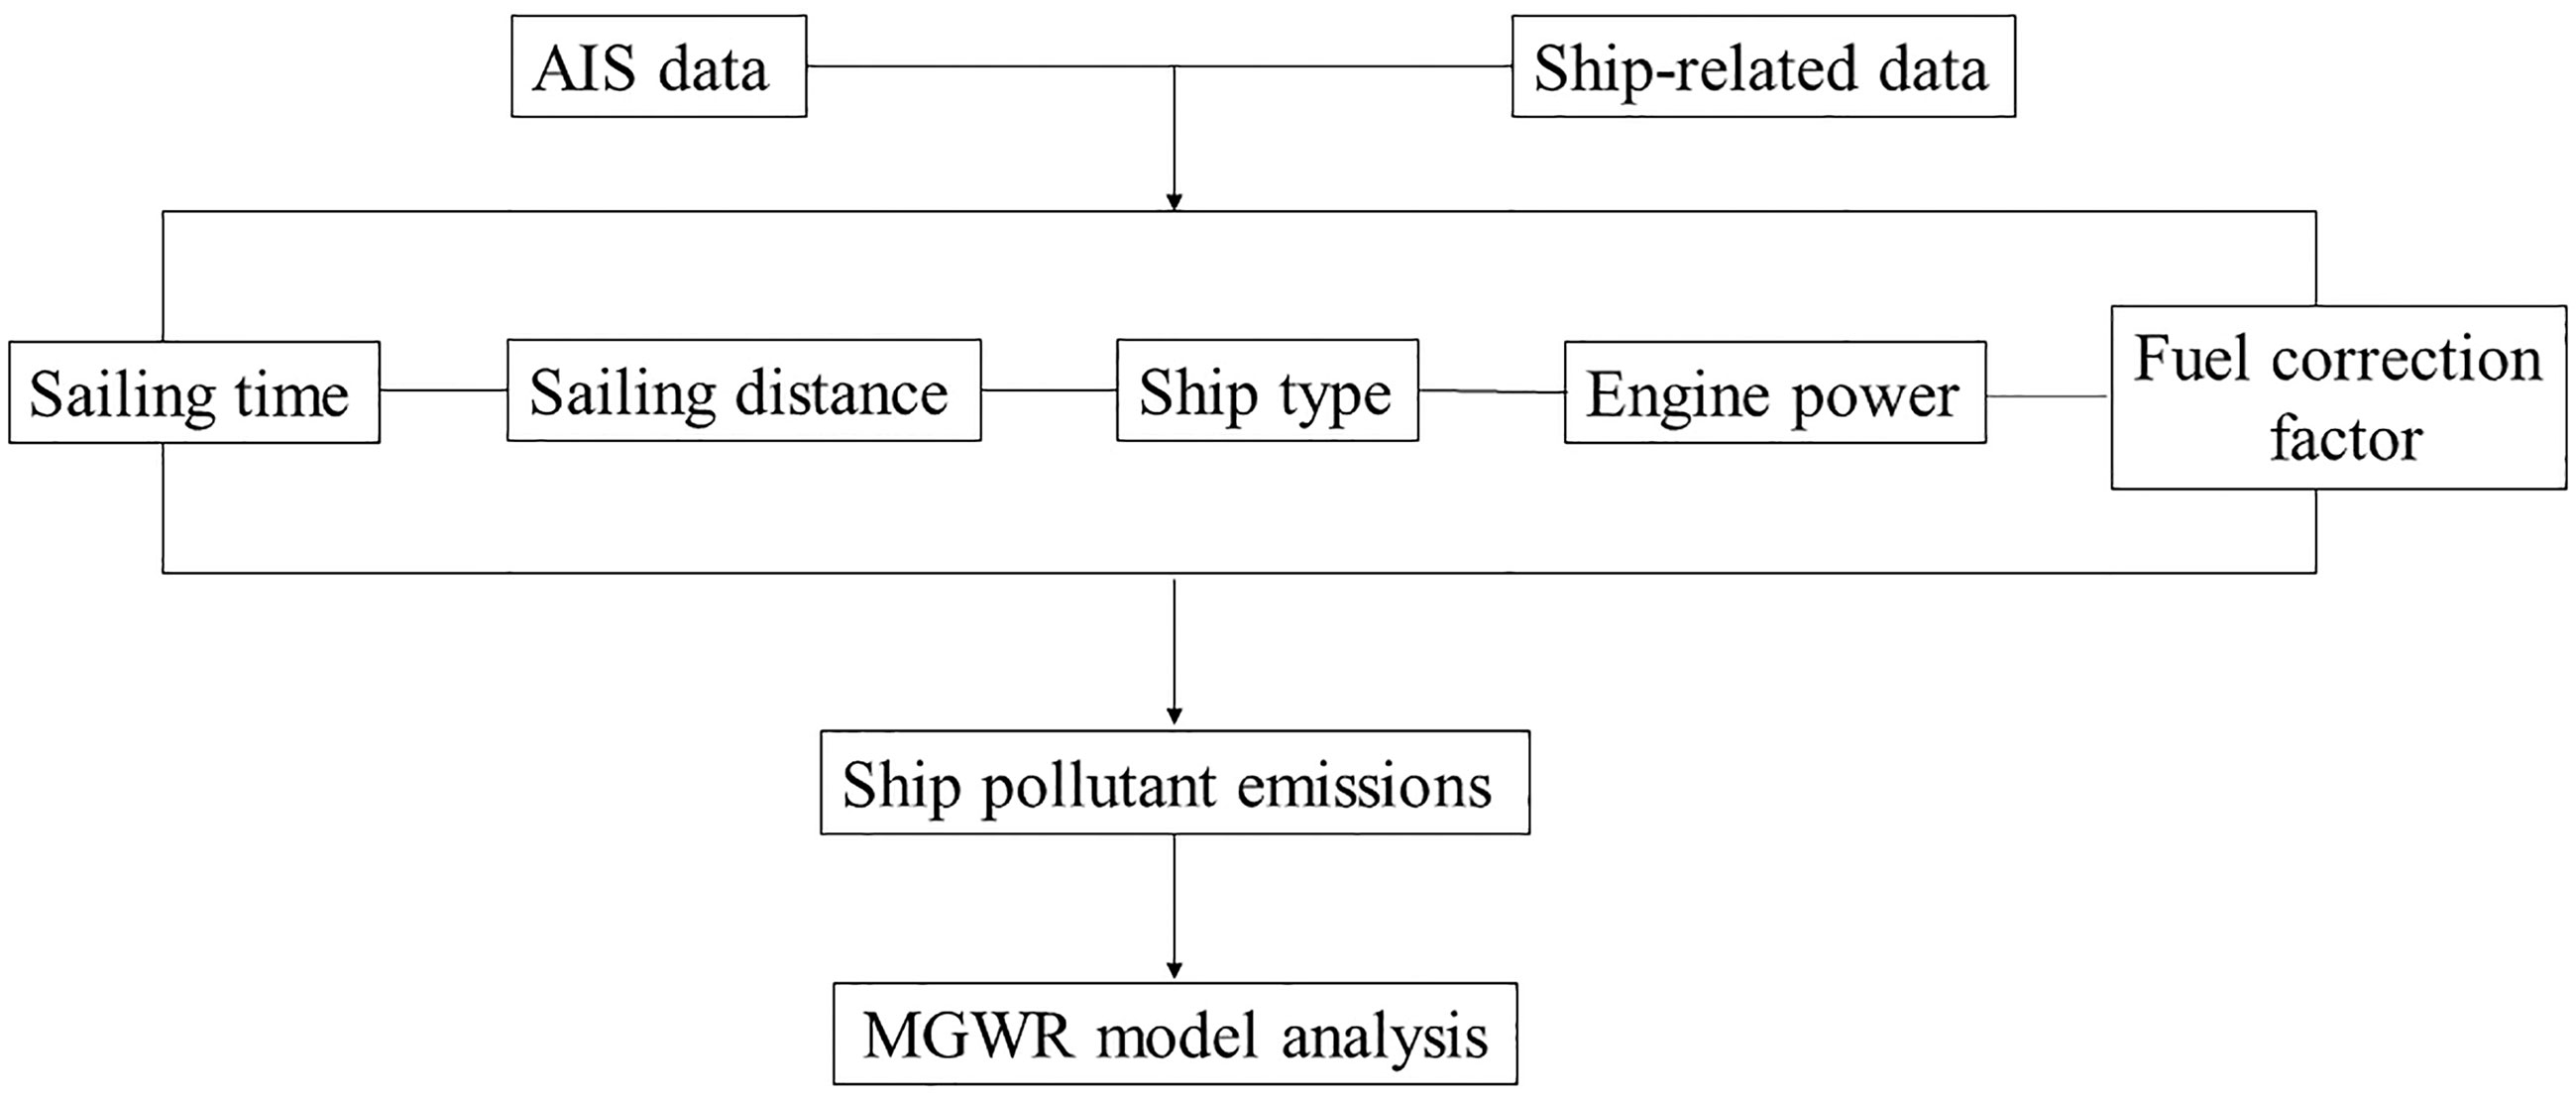
Figure 1 Evaluation framework.
Based on the port information and related materials consulted, combined with land information and water conditions, 30 ports were finally selected. These ports include major ports in the US-East route, such as the ports of New York and New Jersey, Savannah, Jacksonville, Charleston, etc. Major ports in the US-East route, such as the ports of Los Angeles, Long Beach, Seattle and Tacoma, Oakland, etc. In addition, some American inland ports such as the ports of Wilmington and Hampton Roads also include. The time range of this paper is from January to March in 2021. The calculation of emissions relies mainly on the energy output of the ship’s engines. Emissions are calculated from three sources: the main engine, the auxiliary engine, and the auxiliary boiler. The pollutant emission calculation formula is (Kao et al., 2022):
where E refers the emissions and the unit is ton, Energy refers to the total energy demand and the unit is kW-hrs, Energyme, Energyae, and Energyab represent the energy demand of main engine, auxiliary engine, and auxiliary boiler, respectively. MCR refers to the maximum continuous rating power and the unit is kW. LFme, LFae, and LFab denote the load factor of main engine, auxiliary engine, and auxiliary engine, respectively. Act indicates the activity, EF refers to the emission factor, and FCF signifies fuel correction factor. AS is actual speed and MS being maximum speed, whose units are all knots. D refers to the sailing distance. The data about the parameters are shown in the Tables 2, 3 (Kao et al., 2022).
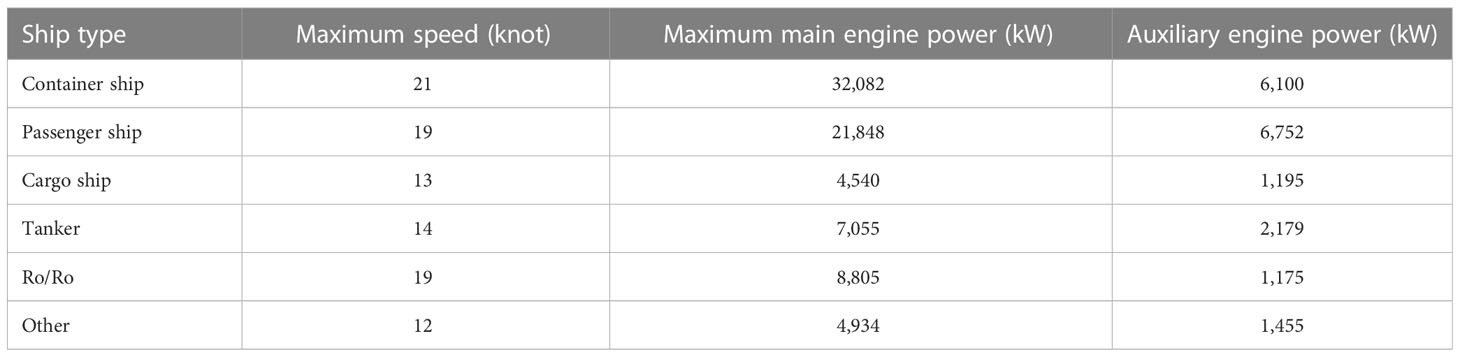
Table 2 Parameter defaults for ships.
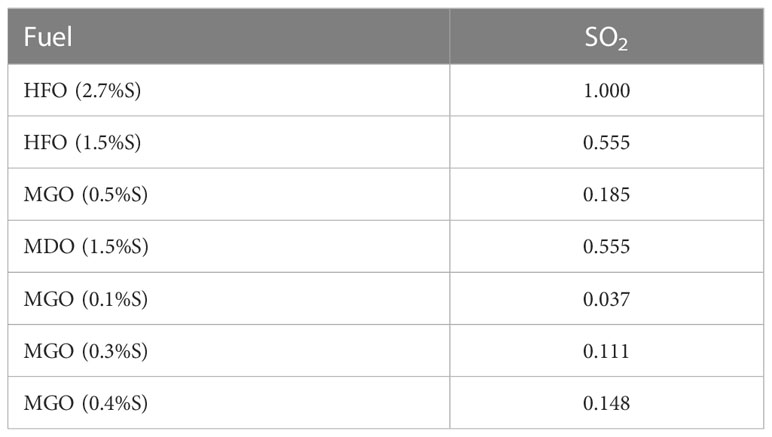
Table 3 Fuel correction factor.
In this study, the data of the first three months are selected from the AIS data of 2021 provided by Marinecadastre.gov, and the water area records of 30 ports selected in this study are about 16.9 million AIS records in total according to the port location. The number distribution of various ship types is shown in the Figure 2. It can be seen from the results that the pollutant emissions of container ships and oil tankers are higher than other ship types, which may be because the AIS records collected in the main port waters of the two ship types in 2021 account for more relevant records.
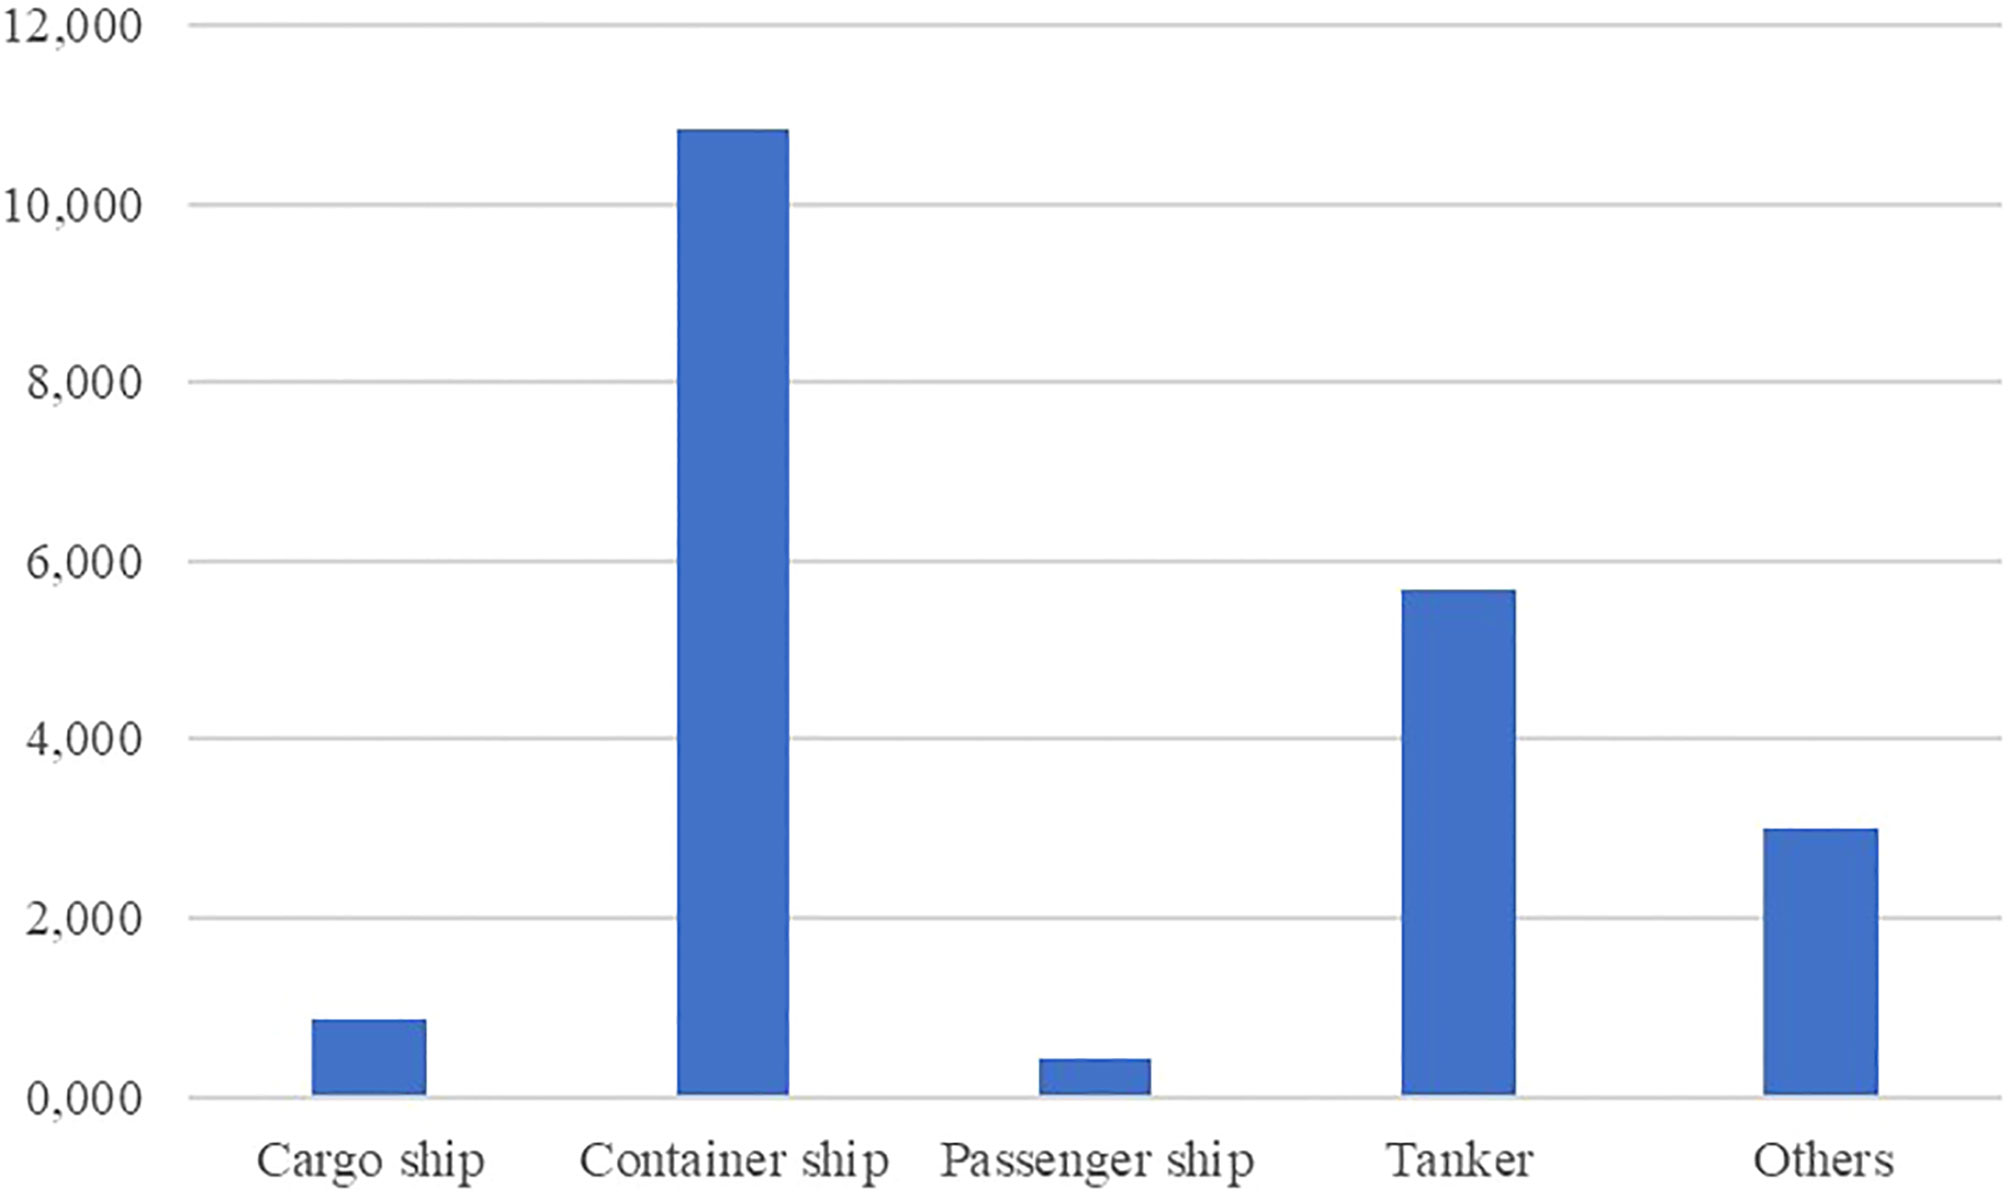
Figure 2 The number distribution of various ship types.
In the early stage of development, container ships also had various structures and styles, but in order to facilitate international circulation, containers began the process of developing to international standardization in 1961 under the leadership of the International Organization for Standardization (ISO). Up to now, the manufacturing of containers generally follows the specific standards of each region (Shi, 2004). Under the premise of container standardization, container ship transportation has an efficient and economical transportation system, and at the same time, the scale of container ships can be decided according to the capacity of the ship to load containers. Although container ships also have different sizes, the container ships with the largest circulation and the most frequent use are of a fixed dimensions in the world. In this regard, the uncertainty and difference caused by the size and size of ships to ship pollutant emissions are not as good as a cargo ship. Oil tankers generally refer to transportation ships that carry crude oil or refined oil and other petroleum products. The oil tankers active in the waters of the ports are mostly medium-sized ships mainly responsible for the transportation of refined oil and large ships mainly responsible for the transportation of crude oil and heavy oil. The size of these ships also has certain standards, which are mostly in connection with the load of the ship itself.
The top 15 ports with the largest pollutant emission among the 30 ports are shown in the Figure 3. The ship pollutant emissions in the port of Houston, the port of New Jersey and New York, and the port of Seattle and Tacoma far exceed that of other ports. There are many records of Houston Port in AIS records. Houston Port is located on the northwest coast of Galveston, the Gulf of Mexico. It is the second international commercial port in the United States, the second energy and trade port in the United States and the sixth in the world. As joint ports, the port of New Jersey New York, the port of Seattle and Tacoma have more AIS data within their waters. The port of New Jersey and New York are located on the northeastern coast of the United States. The port hinterland is vast and radiates the northeastern region of the United States. This region is the most developed of the three major regions in the economic development of the United States. Most of the ports are located along the Brooklyn coast of New York City and Newark Bay coast of New Jersey (List of ports in the united States[EB/OL]). Seattle port and Tacoma port proposed to merge the marine cargo business in 2014. In 2015, a public development agency, Northwest Seaports Alliance, was established and approved by the Federal Maritime Commission. In terms of container volume, it is the third largest cargo port in the United States after the merger (Port introduction | Northwest seaport alliance: Seattle port and Tacoma Port[EB/OL] Haituo joint supply chain).
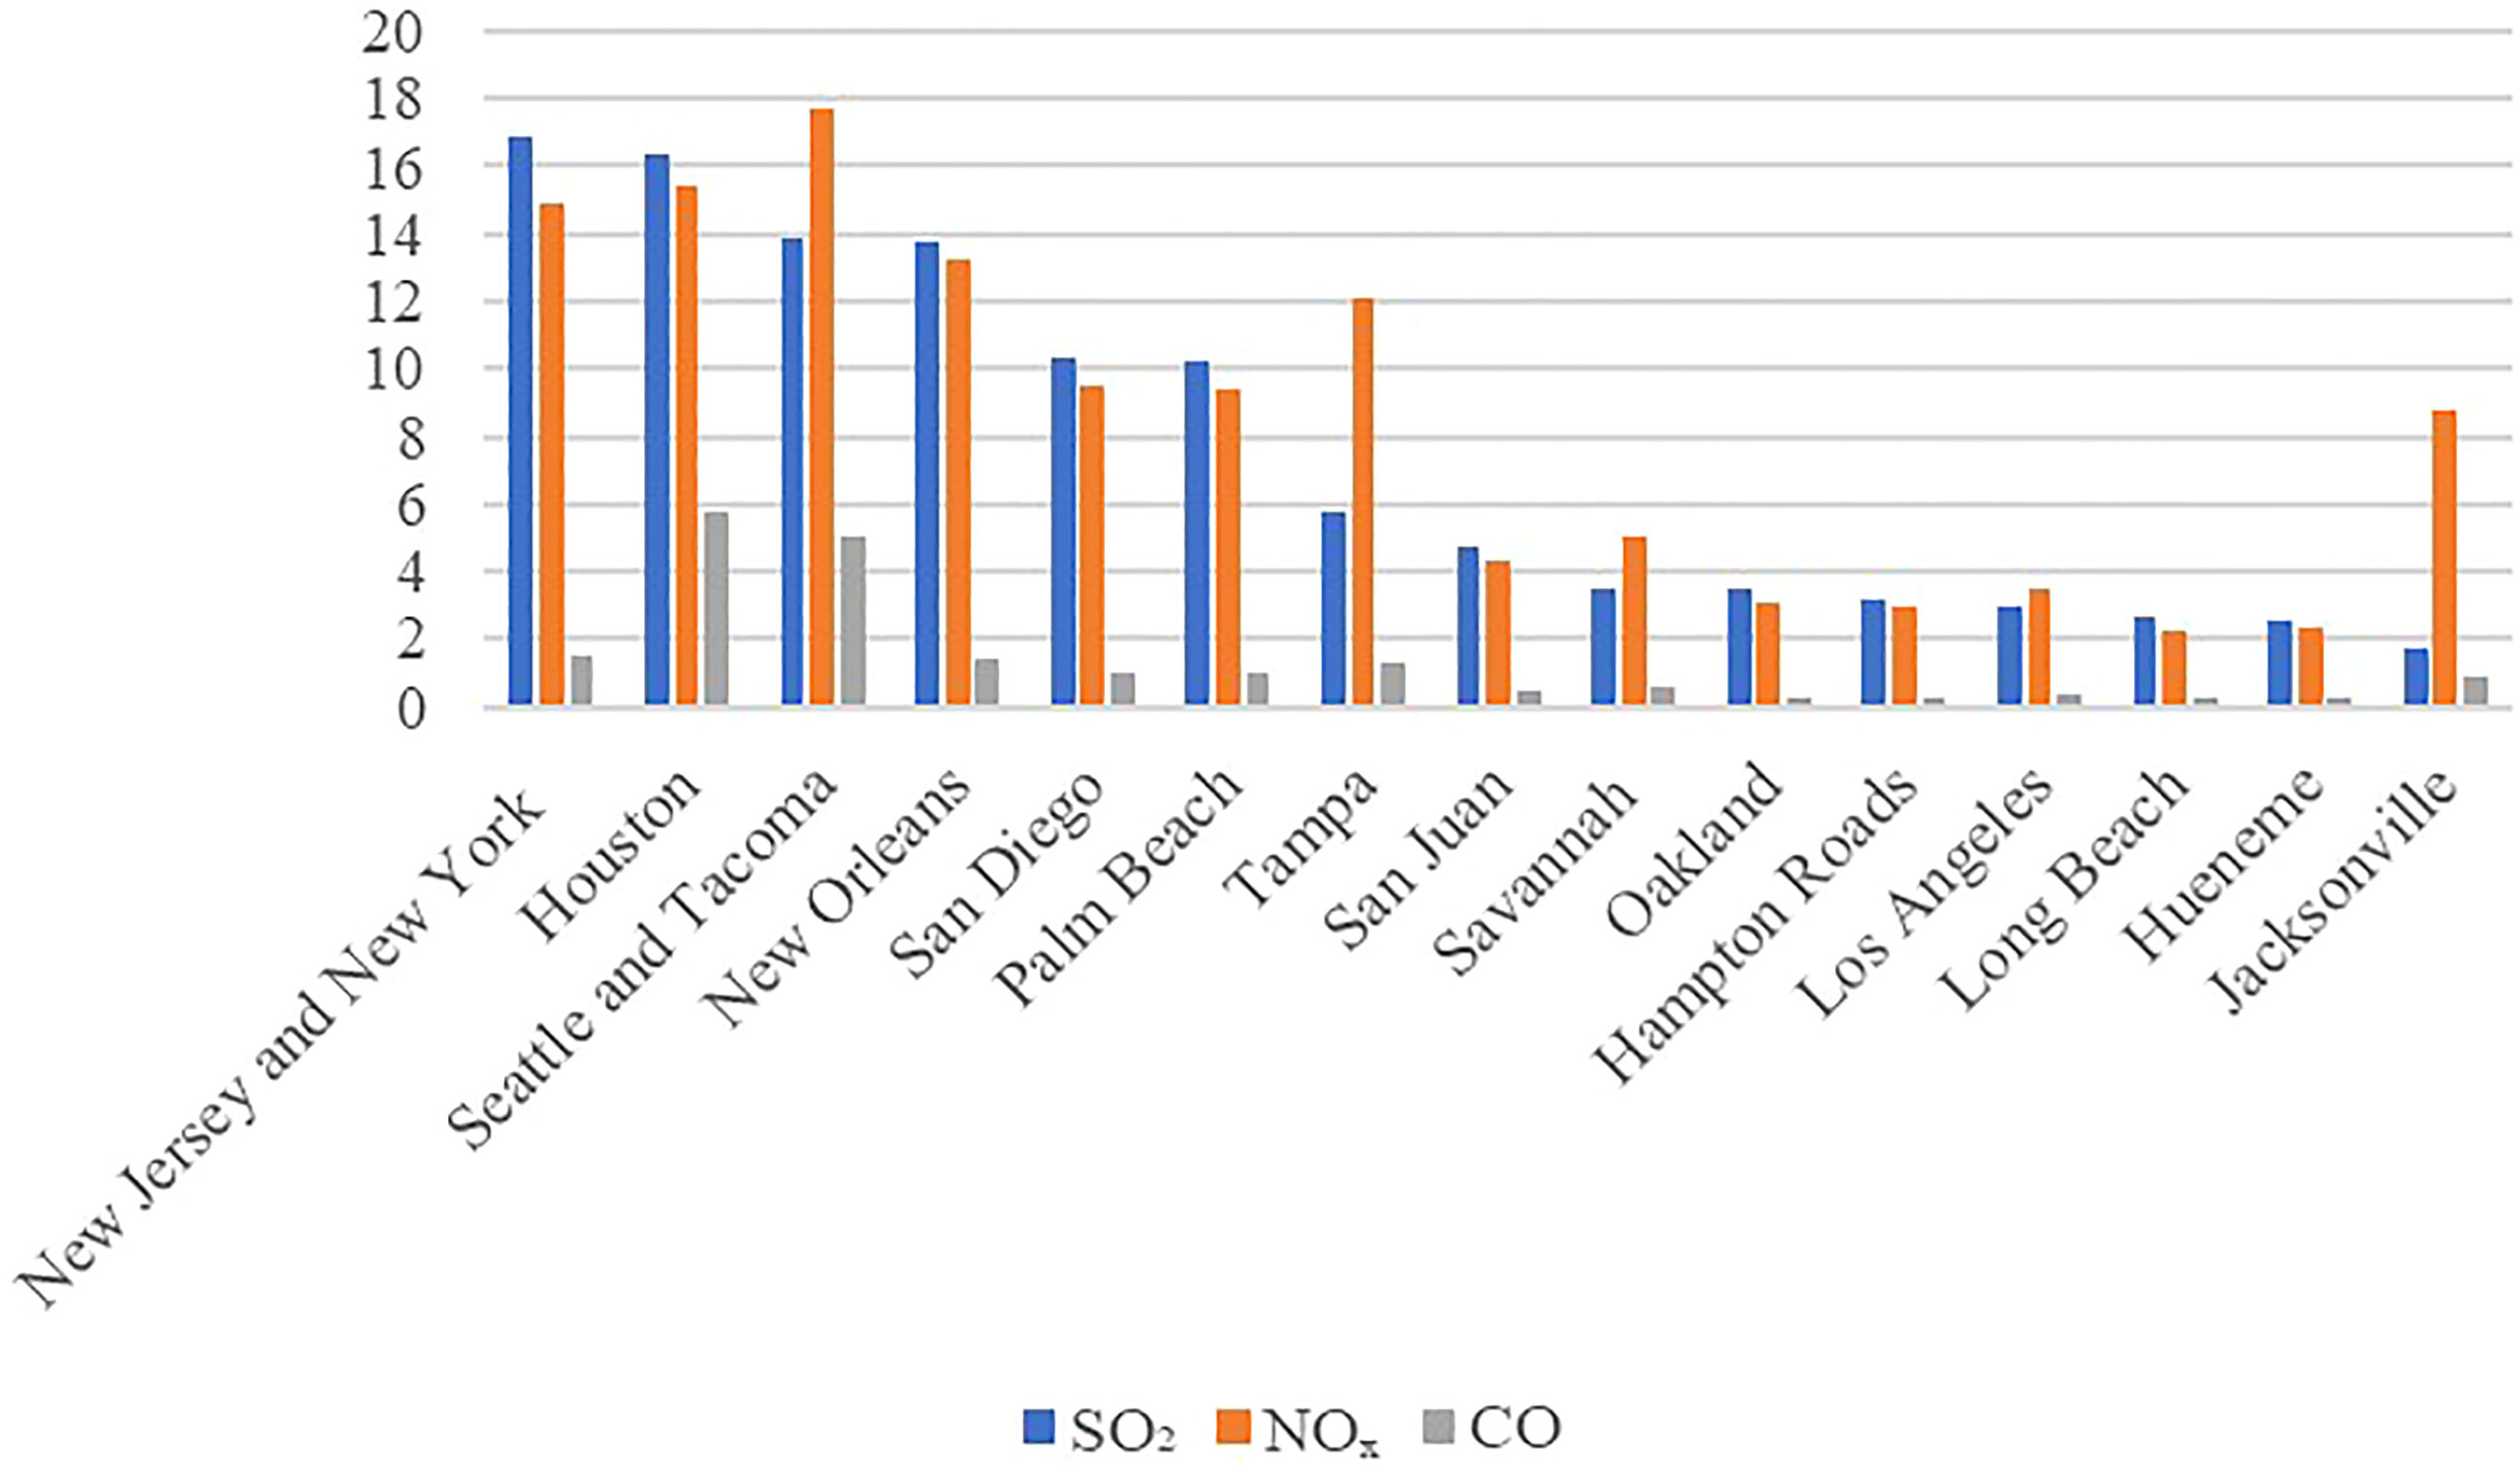
Figure 3 15 Ports with high pollutant emissions (unit: ton).
From the perspective of pollutant types, the emissions of SO2 and NOX are much higher than that of CO, and the emissions of NOX are the highest among the three. Due to the great harm of SO2 to the environment, more and more policies aimed at suppressing SO2 emissions are being introduced. Some measures to inhibit SO2 emissions, such as establishing ECA and using low-sulfur fuel oil, have been proved to be effective in reducing SO2 emissions during ship operation. However, the impact of ECA policies on restraining NOX emission is relatively weak compared with SO2.
In this study, the SO2 emissions of major ports in the United States in the first quarter of 2021 are taken as dependent variables, and the port coastline length, port throughput, and port city population are taken as independent variables to describe the distribution of pollutant emissions from ships of major ports in the United States. The regression results of GWR and MGWR models are compared.
In general, the coastline can be simply regarded as the boundary between sea and land. Natural factors such as coastal erosion and siltation, sea level rise, and factors such as artificial levees and reclamation of land from the sea will lead to changes in sea level. The coastline is long and tortuous, which is more conducive to the development of ports. In addition, socio-economic development and policies are also important driving factors of coastline evolution (Yang et al., 2021). The acquisition of coastline length is mainly determined by consulting relevant data and using measurement tools in ArcGIS.
Ship pollutant emissions to the air environment will ultimately have harm to normal production, daily life, and physical health of people. For example, the sulfur is an important factor that can cause the formation of acid rain, moreover it can ruin and acidify soil, which has seriously affected the development of economics in relevant areas. The port can promote the development of its own city and nearby cities, so the population density in the port area is relatively high. At the same time, because ships take a lot of time to load and unload goods, the pollutants generated while in port will also have an impact on the people living in the port city. The more obvious is that the inhalable particulate matter in the ship pollutant emissions increases the risk of people suffering from cardiopulmonary diseases. Some studies have shown that the particulate matter caused by shipping activities causes about 60,000 deaths every year. Most of the causes of death are related to the common diseases caused by particulate matter emissions (Corbett et al., 2007; Sofiev et al., 2018). The population density will have an impact on the pollutant emission policies formulated by port managers and the government. Relevant policies should minimize the impact of pollutant emissions on human health.
Port throughput refers to the total throughput of bulk cargo, liquid cargo, containers, etc. In this study, port throughput mainly refers to the throughput of container ports. Container throughput includes the number of imported containers and exported containers at the port in a period, usually taking TEU as the unit. Container throughput can generally be used to measure the international trade market demand of a port city. As it is difficult to obtain the statistical data of container throughput of major ports in the United States in 2021, the container throughput data in this study is the average of the container throughput data of major ports in the United States from 2013 to 2017 according to the statistics of the American Association of Port Authorities (American Association of Port Authorities[EB/OL]).
The data of major ports in the United States, independent variables (coastline length, population, and throughput) and dependent variables (SO2, NOX, CO emissions) used in this study are shown in the Table 4.
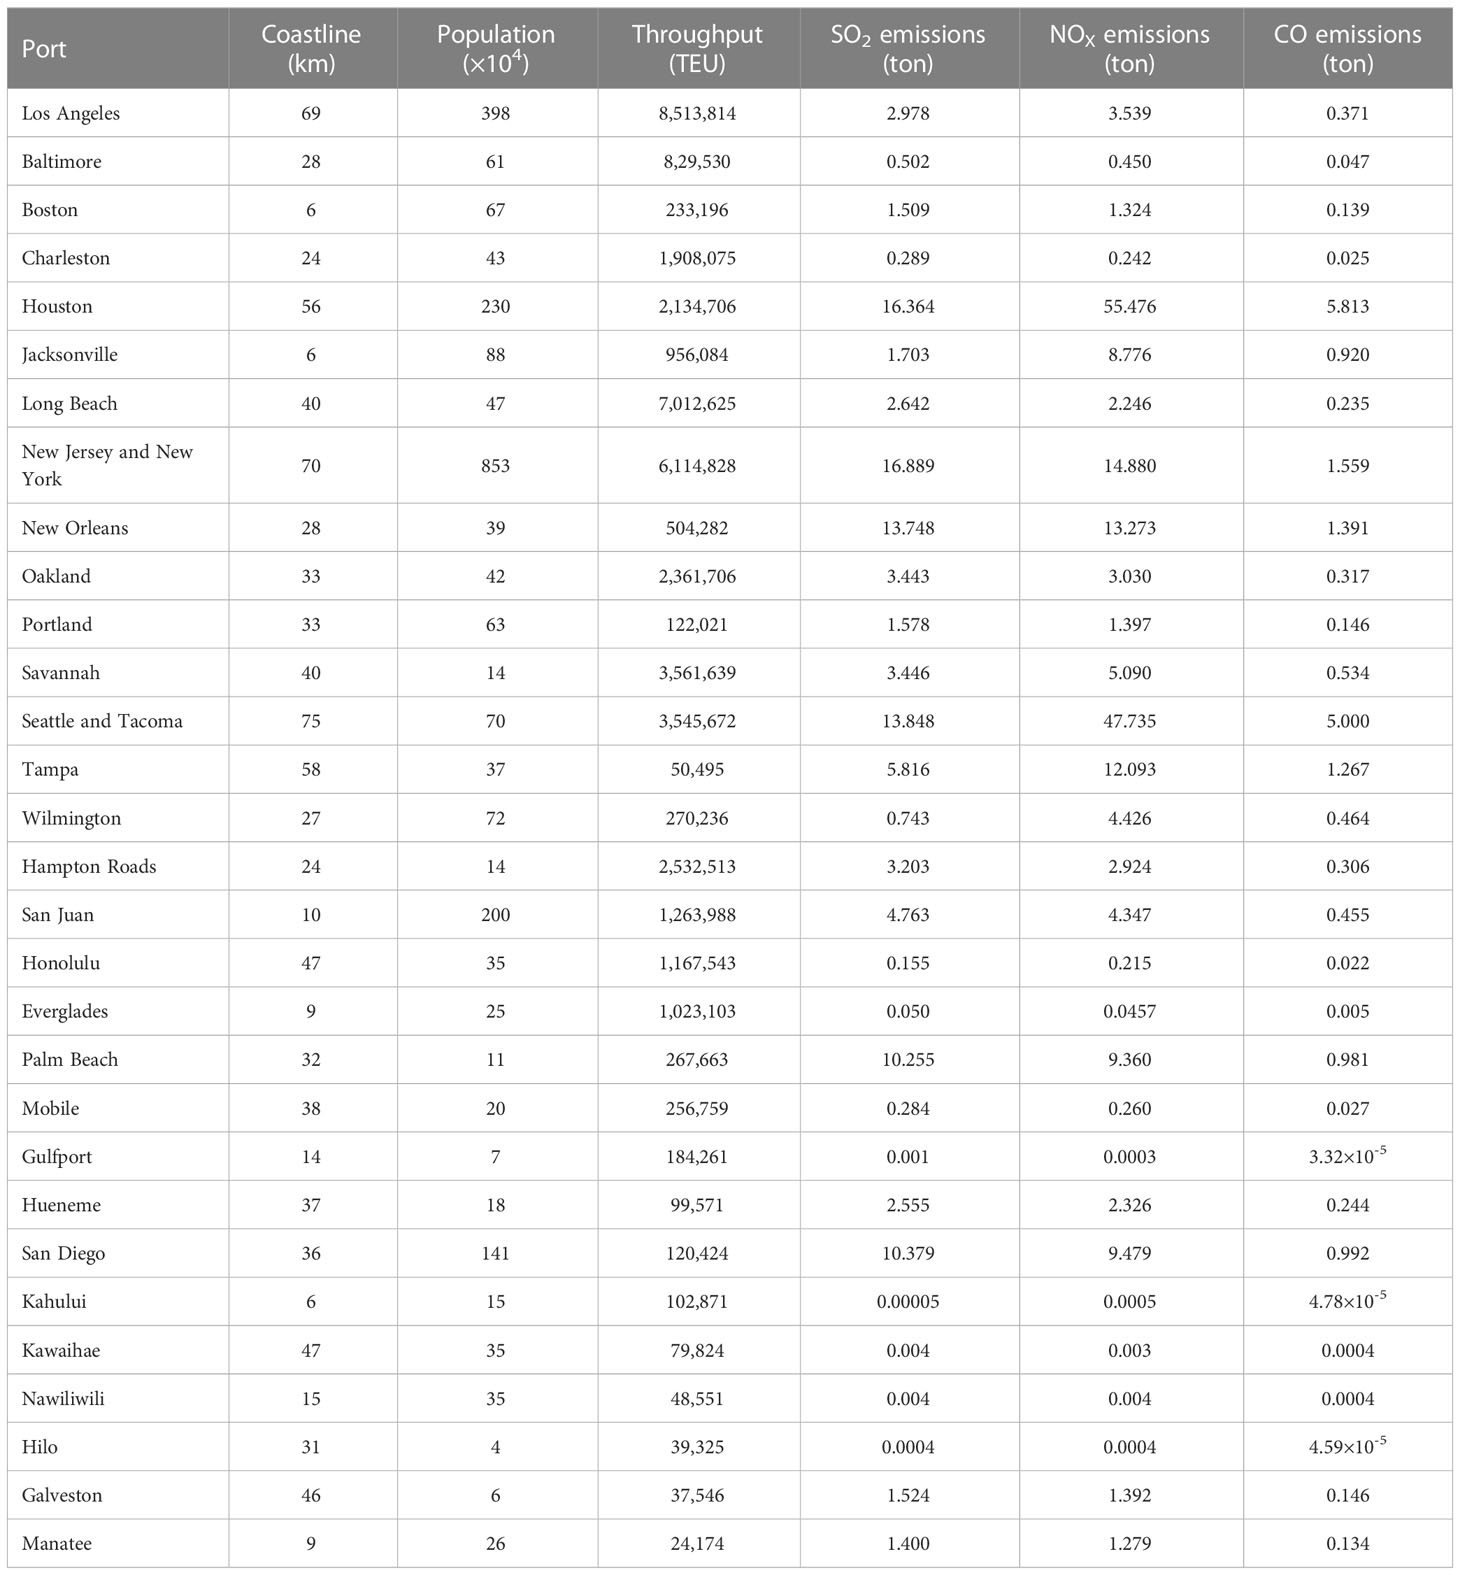
Table 4 Main variables of the model.
The distribution of major ports in the United States on the map is shown in the Figure 4. GWR is based on the idea of local regression analysis and variable parameters. Based on the theory of nonparametric methods of local weighted regression such as curve fitting and smoothing, it embeds the spatial position of data into regression parameters to study the regression relationship varying with space. The structure of GWR model is as follows (Li et al., 2022):
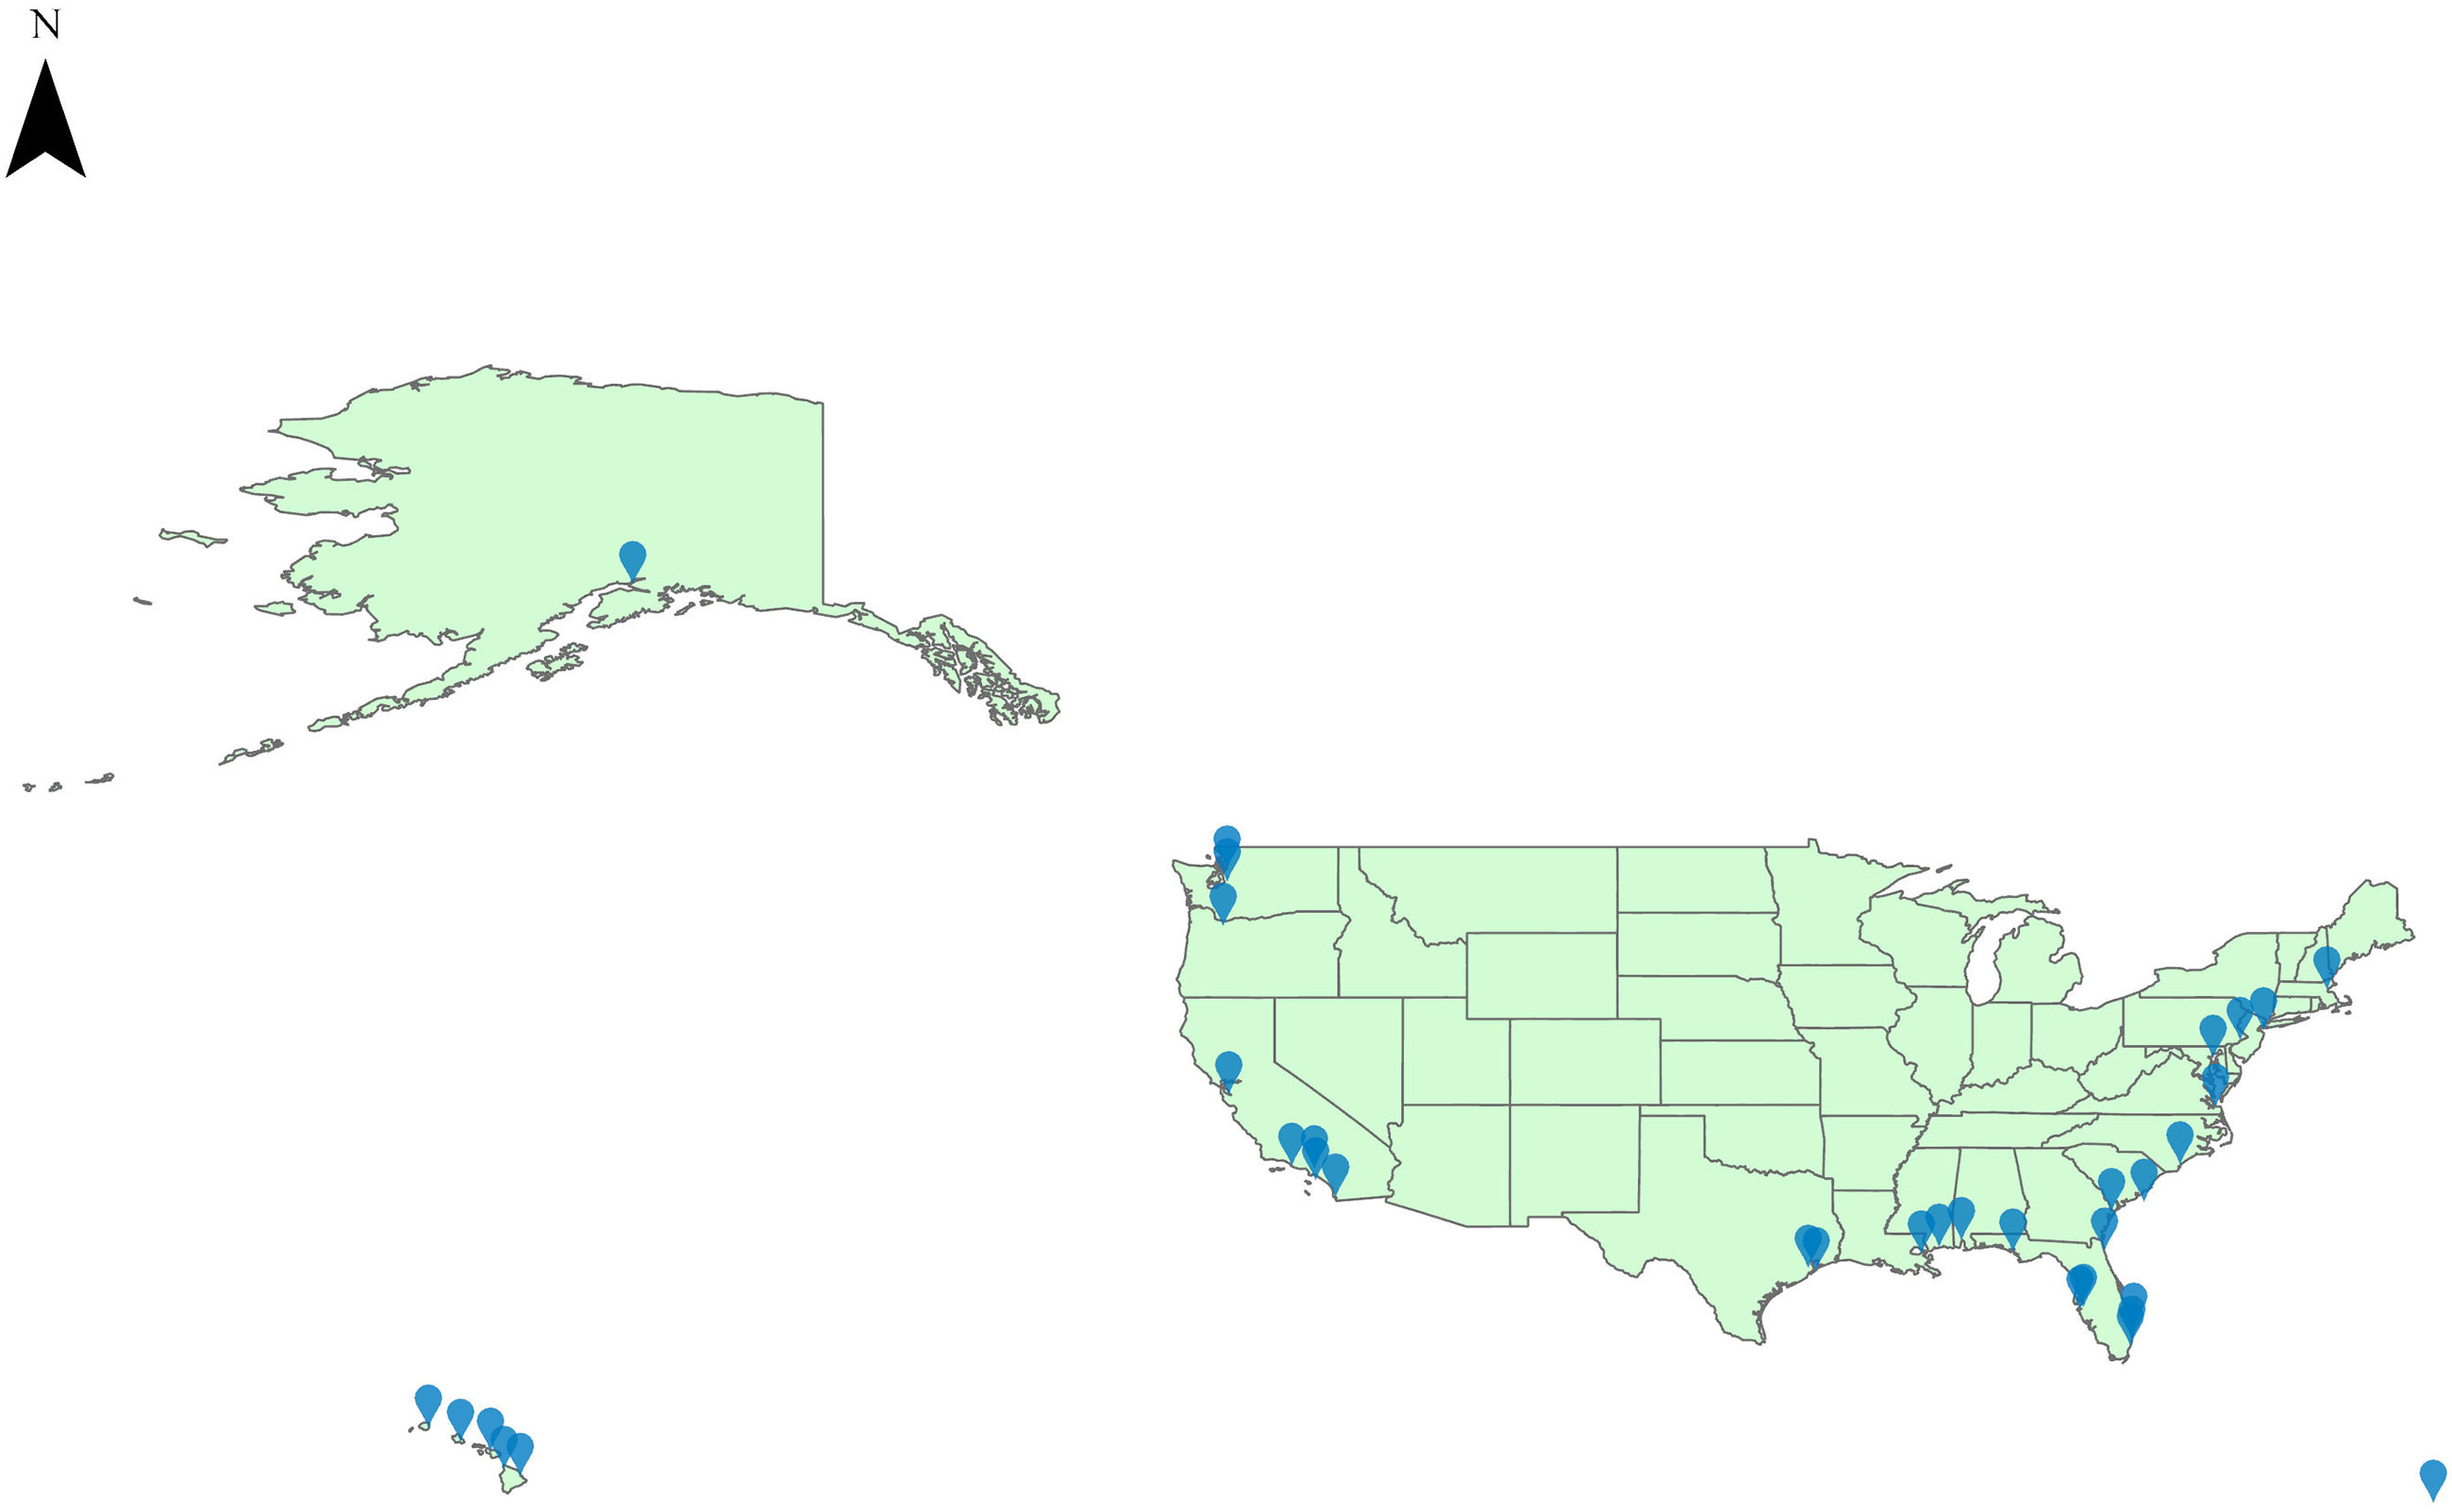
Figure 4 The distribution of major ports in the United States.
where yi represents the interpreted variable, (ui, vi) represents the coordinate of the center point at i, bwj represents the bandwidth used for the coefficient of the jth regression variable, and βbwj represents the regression coefficient of the jth variable at i.
Compared with the classical GWR model, the biggest difference of MGWR is that this model is a local model, allowing parameters to change in space, that is, bandwidth specificity. The kernel function and bandwidth selection criteria of the MGWR model still follow the selection criteria of the GWR model. In this paper, the most used quadratic kernel function and the correct Akchi information criterion (AICc) are used. For the estimation of MGWR model, it can be seen as a generalized additive model (Zhang et al., 2022a).
We conducted spatial autocorrelation analysis, clustering and outlier analysis on the model, and obtained the local Moran’s I. We found that the results of some ports, such as Honolulu Port, Galveston Port were more significant, indicating that there was a certain degree of spatial aggregation of ship pollutant emissions, and the use of MGWR analysis can better explore the characteristics of ship pollutant emissions at the port. First, the collinearity analysis is carried out in the OLS model, and all independent variables are added to the model. The variance inflation factor (VIF) is less than 3 and the tolerance is greater than 0, which indicates that there is no obvious collinearity between independent variables. In OLS model results, R2 of SO2, NOX, and CO are 0.193, 0.081, and 0.081 respectively. The interpretation effect of the model is insufficient. In the MGWR model results, the R2 of SO2, NOX, and CO are 0.421, 0.283, and 0.283 respectively. The effect of R2 in the results of GWR and MGWR is better than that of OLS. We also used neural network to predict the model. Thirty representative ports were selected as samples for training through analysis. Due to the small sample size, we divided the data into 15 training sets and 15 test sets each according to 1:1. After determining the training set, the training set was normalized. Initially, we set the neural network with three layers, including input layer, hidden layer, and output layer. The input layer includes three neurons, which are three independent variables Coastline, Population and Throughput average (2013-2017). The hidden layer includes four neurons. The output layer consists of one neuron representing the dependent variable. The entire neural network was implemented by MATLAB, and the three model R-squares obtained under the learning rate of 0.01 and the epochs of 4000 were SO2:0.271 NOx:0.004 CO:0.024. We compare R2 in the regression results of the four models, and the comparison results are shown in the Table 5.
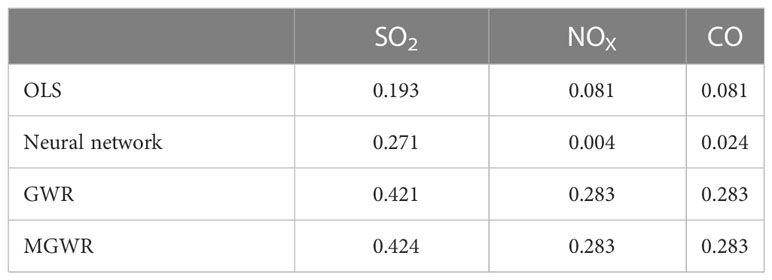
Table 5 R2 of regression results of four models.
The Tables 6–8 show the regression results of three types of pollutants. These tables showthe regression results of GWR and MGWR. Then, we compare the bandwidth and regression coefficient of the sink measurement between GWR and MGWR models. The GWR model allocates a fixed bandwidth for all independent variables. In contrast, MGWR sets a different bandwidth for each variable, and the standard deviation of the GWR coefficient of the independent variable is higher than the MGWR coefficient.
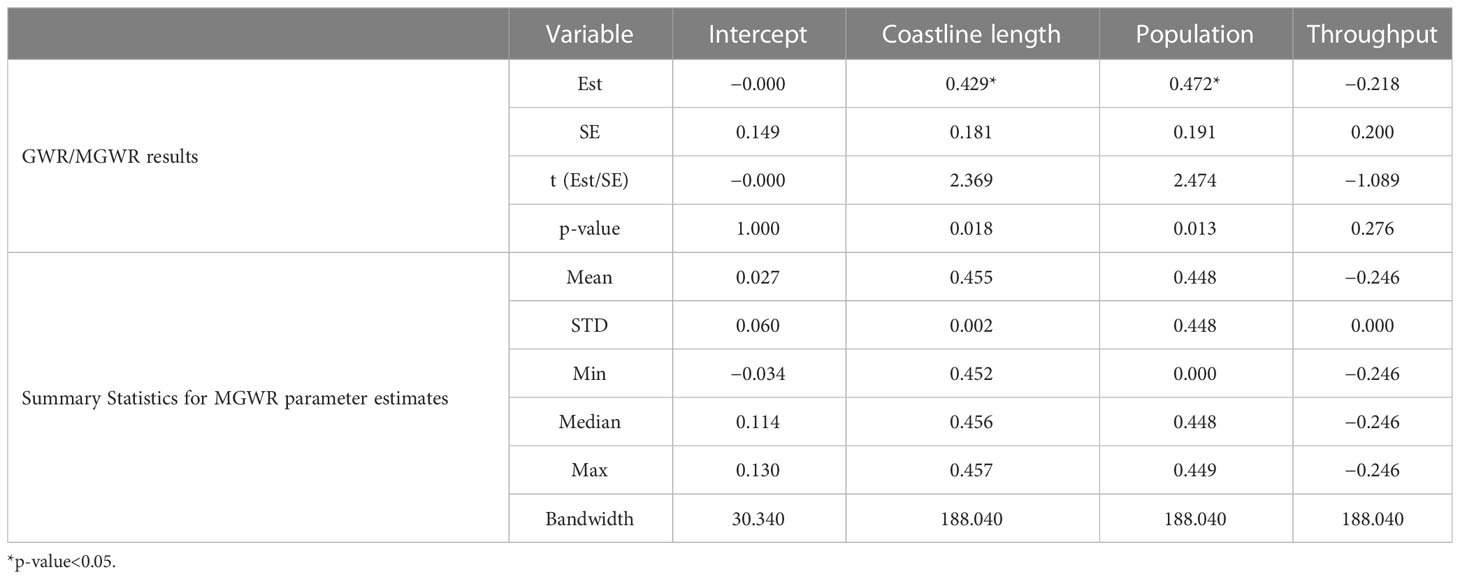
Table 6 Regression results of SO2 emissions.

Table 7 Regression results of NOX emissions.
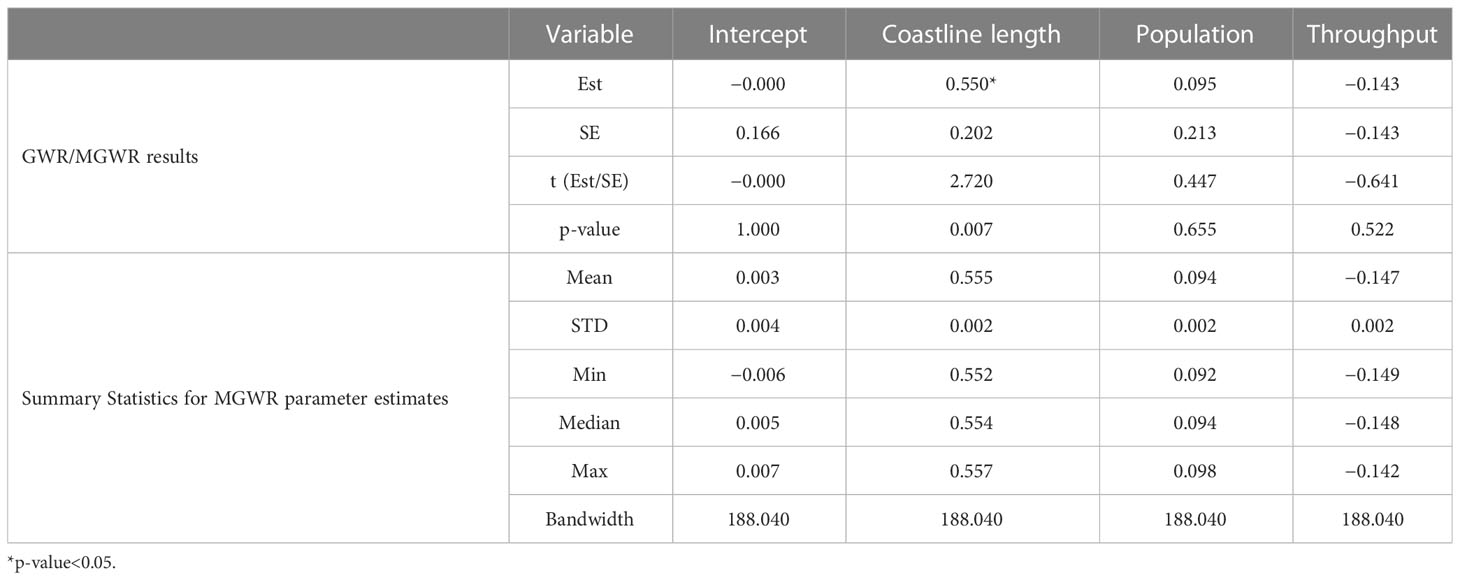
Table 8 Regression results of CO emissions.
Descriptive statistics of regression coefficients of MGWR model reflect the overall influence of various factors on the port pollutant emissions. In the regression results of the three types of pollutants, among the variables with significant impact, the constant term mainly has an expanding effect on the port pollutant emissions. The impact coefficients of coastline length and population on the port pollutant emissions are mainly positive, indicating that the increase of coastline length and population will increase the port pollutant emissions. However, the impact coefficient of throughput on the port area is mostly negative, and container throughput plays a strong role in inhibiting pollutant emissions from ship in the port area. In general, the impact of coastline length, population, and container throughput on pollutant emissions in port areas is mainly to expand. In the regression results of SO2, the p-value of the two independent variables of coastline length and population are both less than 0.05, and the results are significant. In the regression results of NOX and CO, only the P-value of coastline length is less than 0.05. The variable bandwidth reflects the action scale of each variable. A larger bandwidth means that the variable affects the pollutant emissions of the United States ports in a larger range or even in a global range. A smaller bandwidth means that the variable affects the pollutant emissions of the major ship types in the United States ports in a regional or local range. In the GWR model, the control bandwidth is 186.630, the bandwidth of each variable in the MGWR is 188.040, and the bandwidth of the constant term is 30.340, indicating that the core variables such as the length of coastline and population have certain spatial heterogeneity on the pollutant emissions of the United States ports.
The innovation of this paper is to calculate the ship pollutant emissions of three different types of pollutants (SO2, NOX, and CO) in the 30 ports of the United States. The MGWR model is used to evaluate the influencing factors of these pollutant emissions. The variables studied include the length of the coastline of the port area, the population of the port city, and the throughput of containers at each port. This paper also has some limitations. First, there are errors in the process of data acquisition. The coastline length of each port is measured in ArcGIS, and there are some errors in the measurement process, which may have some effect on the results of the model. Second, due to the AIS data is divided according to port scope, and the port scope is determined according to longitude and latitude, there may be data omission. Third, this paper does not consider the impact of navigation status on the emissions of three types of pollutants, and the location of AIS data points is also related to navigation status, such as berthing status and cruising status. Fourth, because it is hard to acquire the data of container throughput of ports in the United States in 2021, the data of container throughput in the model is based on the average of container throughput from 2013 to 2017, which may have some impacts on the regression results of the model.
From the regression results of the model in this study, among the regression methods of OLS, GWR, MGWR, and neural network, due to the insufficient sample size and possible error, the prediction results of neural network in the model studied are not ideal, and the prediction value differs greatly from the expected value. In the OLS model, the correlation between each variable and the dependent variable can only be judged by the regression results, and the overall impact of each factor on the discharge of pollutants from ships in 30 ports in the United States cannot be known. Both MGWR and GWR models are applicable to explain the spatial heterogeneity of the independent variables of the model on the port pollutant emissions. The model comparison results show that the AICc value of MGWR is lower than that of GWR, and the adjusted goodness of fit R2 is higher, and the sum of residual squares of MGWR is significantly lower than that of GWR, which indicates that the MGWR is closer to the regression results of the true value. Therefore, MGWR is more suitable for explaining the influence of each variable on the pollutant emissions of ports in the United States.
By calculating the pollutant emissions of 30 ports in the United States, we found that NOX accounted for the highest proportion of the three pollutant types, followed by SO2 and CO, and the pollutant emissions in each month in the first three months were roughly the same, and the distribution of pollutant types was also similar. We speculated that the pollutant emissions in different quarters would have different distribution trends. In the distribution of ship types, oil tankers and container ships are the main sources of pollutant emissions from ships, which may be related to the size of ships and the navigation status of ships. In terms of port distribution, the New Jersey and New York Port, Houston Port, Seattle and Tacoma Port are the ports with the largest pollutant emissions. These three ports are large in scale. The first two are the main ports on the US-East route, while Seattle and Tacoma Port is the main port on the US-East route. There are many types of ships for trading and transportation, and the geographical location is favorable for the development of maritime transport business.
The emission of SO2, NOX, and CO will have a vital effect on the environment. These pollutants will cause irreversible harm to the environment and human health. As people attach more importance to the treatment of ship pollution, more and more policies and measures have been put forward and implemented by the policy and relevant organizations to curb the emission of ship pollutants. Researches show that ECA policies and the use of low-sulfur fuel can effectively reduce SO2 emissions. However, some policies have not acted significantly in inhibiting NOx, which accounts for the largest proportion of all kinds of pollutants. In the future, port administrator and local government should consider how to take measures to effectively reduce NOx emissions. The emission of SO2 is significantly correlated with the length of coastline and population, while the emissions of NOX and CO are only significantly interrelated with the length of coastline. It is showed that the length of coastline is an important factor affecting the discharge of pollutants from various types of ships. Therefore, port managers and local governments should reasonably control the number of ships parked and traded along the coast according to the length of coastline in the area where the port is located, and reasonably develop the shipping economy to achieve the sustainable development of the port economy.
The navigation status of ships will also have significant influence on the pollutant discharge in the port area. In ports with long coastline and large scope, the number of ships docked will also increase. However, the pollutant discharge of ships in the berthing status is more, so it is necessary to minimize the stay time of ships in the port. Besides the majorization of loading and unloading process, other measures can also be used to alleviate the port congestion and avoid many ships are stranded in ports. In 2020, the Baltic and International Maritime Council (BIMCO) launched the virtual arrival clause, so that when ships face congestion in the port, they can delay the arrival time by reducing the sailing speed on the way, which not only effectively alleviates ship detention problems at the port, reducing the pollutant emission caused by the ship waiting at the berth, but also reducing the cost of the ship operator due to the detention of the ship in the port.
This paper takes the pollutant emissions of 30 major ports in the United States as the main research object, and uses the AIS data of American waters from January to March 2021 to compute the discharge of pollutants from ships in ports. (1) The results show that oil tankers and container ships are the main sources of pollutants in various ship types. (2) Among the ports, Houston Port, New Jersey and New York Port, and Seattle and Tacoma Port have far more pollutant emissions than other ports. The distribution difference of ship types may be related to the number of ship types recorded in AIS records. There are many AIS data records within the scope of Houston Port. New Jersey and New York Port, and Seattle and Tacoma Port are joint ports with large port scope. Because there are many AIS data records within the scope of these three ports, the pollutant emissions within the scope of these three ports are relatively high. (3) The distribution trend of pollutant emissions of SO2, NOX, and CO in each port is roughly the same, and NOX emissions are the largest, and the emission distribution of various types of pollutants in each month is also the same.
Taking coastline length, population and container throughput as independent variables and port pollutant emissions as dependent variables, the MGWR is used to analyze the effect of the discharge of pollutants from ships of ports in the United States. The results show that the length of coastline and population promote the pollutant discharge of ports, while the container throughput reduces the pollutant discharge of ports. Among the variables with significant influence, the constant term mainly has a reducing effect on the port pollutant emissions.
Future research can consider taking more ports on the inland ports, the US-East route, and the US-West route as samples to analyze the spatial distribution of pollutant emissions from the ports of the United States, and analyze the influence of factors affecting the pollutant emissions from ships in different regions. In addition, some social and economic factors, such as policies on pollutant emissions and the degree of economic development, can also be considered as independent variables to study their effect on the pollutant emissions of various ship types in the port area. The dynamic ensemble method can be considered to investigate the distribution of pollutant discharge from ships in ports.
The original contributions presented in the study are included in the article/supplementary material. Further inquiries can be directed to the corresponding author.
GX: Conceptualization, Methodology, Writing—Review and Editing, Funding acquisition. TW: Conceptualization, Methodology, Writing—Original Draft. YL: Writing—Original Draft, Investigation. DY: Formal analysis. All authors contributed to the article and approved the submitted version.
This research was funded by the National Natural Science Foundation of China, grant number 52002243.
The authors declare that the research was conducted in the absence of any commercial or financial relationships that could be construed as a potential conflict of interest.
All claims expressed in this article are solely those of the authors and do not necessarily represent those of their affiliated organizations, or those of the publisher, the editors and the reviewers. Any product that may be evaluated in this article, or claim that may be made by its manufacturer, is not guaranteed or endorsed by the publisher.
Alahmadi S., Al-Ahmadi K., Almeshari M. (2019). Spatial variation in the association between NO2 concentrations and shipping emissions in the red Sea. Sci. Total Environ. 676, 131–143. doi: 10.1016/j.scitotenv.2019.04.161
An R., Wu Z., Tong Z., Qin S., Zhu Y., Liu Y. (2022). How the built environment promotes public transportation in wuhan: A multiscale geographically weighted regression analysis. Travel Behav. Soc. 29, 186–199. doi: 10.1016/j.tbs.2022.06.011
AIS vessel type and group codes used by the marine cadastre project[EB/OL] 2018-05-23. Available at: https://coast.noaa.gov/data/marinecadastre/ais/VesselTypeCodes2018.pdf.
List of ports in the united States[EB/OL] Available at: https://www.sofreight.com/ports/us?page=2&area_code=US&=%E7%BE%8E%E5%9B%BD.
Port introduction | Northwest seaport alliance: Seattle port and Tacoma Port[EB/OL] Haituo joint supply chain 2022-11-03. Available at: https://baijiahao.baidu.com/s?id=1748440696898265478&wfr=spider&for=pc.
American Association of port Authorities[EB/OL] Available at: http://www.aapa-ports.org.
Chen X., Liu S., Liu R. W., Kuang H. (2022). Quantifying Arctic oil spilling event risk by integrating an analytic network process and a fuzzy comprehensive evaluation model. Ocean Coast. Manage. 228, 106326. doi: 10.1016/j.ocecoaman.2022.106326
Chen S., Meng Q., Jia P., Wu H., Han B., Zhao J. (2021). An operational-mode-based method for estimating ship emissions in port waters. Transportation Res. Part D: Transport Environ. 101, 103080. doi: 10.1016/j.trd.2021.103080
Corbett J. J., Winebrake J. J., Green E. H., Kasibhatla P., Eyring V., Lauer A. (2007). Mortality from ship emissions: A global assessment. Environ. Sci. Technol. 41 (24), 8512–8518. doi: 10.1021/es071686z
Feng X., Yuan S., Zhang Y., Chen M. (2018). Research on the time and space distribution characteristics of ship air pollutant emission inventory in the jiangsu section of the Yangtze river. J. Saf. Environ. 18 (4), 1609–1614. doi: 10.13637/j.issn.1009-6094.2018.04.065
Fotheringham A. S., Yang W., Kang W. (2017). Multiscale geographically weighted regression (MGWR). Ann. Am. Assoc. Geographers 107 (6), 1247–1265. doi: 10.1080/24694452.2017.1352480
Jiang Z., Lei L., Zhang J., Wang C., Ye S. (2023). Spatio-temporal evolution and location factors of port and shipping service enterprises: A case study of the Yangtze river delta. J. Transport Geogr. 106, 103515. doi: 10.1016/j.jtrangeo.2022.103515
Kao S.-L., Chung W.-H., Chen C.-W. (2022). AIS-based scenario simulation for the control and improvement of ship emissions in ports. J. Mar. Sci. Eng. 10 (2), 129. doi: 10.3390/jmse10020129
Kuittinen N., Jalkanen J.-P., Alanen J., Ntziachristos L., Hannuniemi H., Johansson L., et al. (2020). Shipping remains a globally significant source of anthropogenic PN emissions even after 2020 sulfur regulation. Environ. Sci. Technol. 55 (1), 129–138. doi: 10.1021/acs.est.0c03627
Lee H., Park D., Choo S., Pham H. T. (2020). Estimation of the non-greenhouse gas emissions inventory from ships in the port of incheon. Sustainability 12 (19), 8231. doi: 10.3390/su12198231
Lee H., Pham H. T., Chen M., Choo S., Dong-Kyu K., Kim D.-K. (2021). Bottom-up approach ship emission inventory in port of incheon based on VTS data. J. Advanced Transportation 2021, 1–16. doi: 10.1155/2021/5568777
Li W., Yang N., Du H., Wan Y., Yang S., Xiao Y. (2022). The impact of large-scale ships on the upper reaches of the Yangtze river on typical pollution emissions. Port Waterway Eng. 2, 100–105. doi: 10.3969/j.issn.1002-4972.2022.02.016
Liu L. (2020). Research on the negative externality cost of air pollutant emissions from qingdao port and its emission prediction[D] (Qingdao, China: Qingdao University).
Liu H., Shang Y., Jin X., Fu M. (2018). Research methods and progress of ship emission inventory. J. Environ. Sci. 38 (1), 1–12.
Lu B., Ge Y., Qin K., Zheng J. (2020). A survey of geographically weighted regression analysis techniques. Geomatics Inf. Sci. Wuhan Univ. 45 (9), 1356–1366. doi: 10.13203/j.whugis20190346
Ma D., Ma W., Hao S., Jin S., Qu F. (2021). Ship's response to low-sulfur regulations: From the perspective of route, speed and refueling strategy. Comput. Ind. Eng. 155, 107140. doi: 10.1016/j.cie.2021.107140
Magazine R. O. T. (2018). Overview of port green development in California, USA. Port Technol. 6, 40–42.
Mocerino L., Quaranta F. (2022). How emissions from cruise ships in the port of Naples changed in the COVID-19 lock down period. Proc. Institution Mechanical Engineers Part M: J. Eng. Maritime Environ. 236 (1), 125–130. doi: 10.1177/14750902211028421
Murcia González J.-C. (2021). Analysis and measurement of SOx, CO2, PM and NOx emissions in port auxiliary vessels. Environ. Monit. Assess. 193 (6), 374. doi: 10.1007/s10661-021-09145-4
Repka S., Erkkilä-Välimäki A., Jonson J. E., Posch M., Torronen J., Jalkanen J. P. (2021). Assessing the costs and environmental benefits of IMO regulations of ship-originated SOx and NOx emissions in the Baltic Sea. Ambio 50, 1718–1730. doi: 10.1007/s13280-021-01500-6
Saliba M., Azzopardi F., Muscat R., Grima M., Smyth A., Jalkanen J.-P. (2021). Trends in vessel atmospheric emissions in the central Mediterranean over the last 10 years and during the covid-19 outbreak. J. Mar. Sci. Eng. 9 (7), 762. doi: 10.3390/jmse9070762
Shi J. (2004). The development status, and problems of the container ship market. Tianjin Sailing 4), 40–41.
Shi K., Weng J. (2021). Impacts of the COVID-19 epidemic on merchant ship activity and pollution emissions in shanghai port waters. Sci. Total Environ. 790, 148198. doi: 10.1016/j.scitotenv.2021.148198
Shi K., Weng J., Li G. (2020). Exploring the effectiveness of ECA policies in reducing pollutant emissions from merchant ships in shanghai port waters. Mar. pollut. Bull. 155, 111164. doi: 10.1016/j.marpolbul.2020.111164
Shu Y., Zhu Y., Xu F., Gan L., Lee P. T.-W., Yin J., et al. (2023). Path planning for ships assisted by the icebreaker in ice-covered waters in the northern Sea route based on optimal control. Ocean Eng. 267, 113182. doi: 10.1016/j.oceaneng.2022.113182
Sofiev M., Winebrake J. J., Johansson L., Carr E. W., Prank M., Soares J., et al. (2018). Cleaner fuels for ships provide public health benefits with climate tradeoffs. Nat. Commun. 9 (1), 406. doi: 10.1038/s41467-017-02774-9
Tauchi M., Yamaji K., Nakatsubo R., Oshita Y., Kawamoto K., Itano Y., et al. (2022). Evaluation of the effect of global sulfur cap 2020 on a Japanese inland sea area. Case Stud. Transport Policy 10 (2), 785–794. doi: 10.1016/j.cstp.2022.02.006
Tholiya J. J., Chaudhary N., Alam B. M. (2022). Determinants of geographical inequalities in domestic water supply across city of pune, India. Water Supply 22 (2), 2148–2169. doi: 10.2166/ws.2021.364
Tokuslu A. (2021). Assessment of environmental costs of ship emissions: Case study on the samsun port. Environ. Eng. Manage. J. 20 (5), 739–747. doi: 10.30638/eemj.2021.070
Toscano D., Murena F., Quaranta F., Mocerino L. (2021). Assessment of the impact of ship emissions on air quality based on a complete annual emission inventory using AIS data for the port of Naples. Ocean Eng. 232, 109166. doi: 10.1016/j.oceaneng.2021.109166
Wan Z., Zhou X., Zhang Q., Chen J. (2019). Do ship emission control areas in China reduce sulfur dioxide concentrations in local air? a study on causal effect using the difference-in-difference model. Mar. pollut. Bull. 149, 110506. doi: 10.1016/j.marpolbul.2019.110506
Wang X., Yi W., Lv Z., Deng F., Zheng S., Xu H., et al. (2021). Ship emissions around China under gradually promoted control policies from 2016 to 2019. Atmospheric Chem. Phys. 21 (18), 13835–13853. doi: 10.5194/acp-21-13835-2021
Weng J., Shi K., Gan X., Li G., Huang Z. (2020). Ship emission estimation with high spatial-temporal resolution in the Yangtze river estuary using AIS data. J. Cleaner Production 248, 119297. doi: 10.1016/j.jclepro.2019.119297
Xiao G., Cui W. (2023). Evolutionary game between government and shipping companies based on shipping cycle and carbon quota. Front. Mar. Sci. 10, 1132174.
Xiao G., Wang T., Chen X., Zhou L. (2022). Evaluation of ship pollutant emissions in the ports of Los Angeles and long beach. J. Mar. Sci. Eng. 10 (9), 1206. doi: 10.3390/jmse10091206
Xu L., Di Z., Chen J. (2021a). Evolutionary game of inland shipping pollution control under government co-supervision. Mar. pollut. Bull. 171, 112730.
Xu L., Shi J., Chen J., Li L. (2021b). Estimating the effect of COVID-19 epidemic on shipping trade: An empirical analysis using panel data. Mar. Policy 133, 104768. doi: 10.1016/j.marpol.2021.104768
Yang C., Gan H., Wan R., Zhang Y. (2021). Analysis on the space-time evolution and influencing factors of the coastline of guangdong Hong Kong Macao greater bay area from 1975 to 2018. Geology China 48 (3), 697–707.
Yang L., Zhang Q., Lv Z., Zhang Y., Yang Z., Fu F. (2022). Efficiency of DECA on ship emission and urban air quality: A case study of China port. J. Cleaner Production 362, 132556. doi: 10.1016/j.jclepro.2022.132556
Yang L., Zhang Q., Zhang Y., Lv Z., Wang Y., Wu L., et al. (2021). An AIS-based emission inventory and the impact on air quality in tianjin port based on localized emission factors. Sci. Total Environ. 783, 146869. doi: 10.1016/j.scitotenv.2021.146869
Yu H., Huang M., He J., Tan C. (2022). The clustering strategy for stacks allocation in automated container terminals. Maritime Policy Manage., 1–16. doi: 10.1080/03088839.2022.2119616
Zhang Q., Cao W., Yan S. (2022a). The spatial heterogeneity of the impact of tourism development on the UrbanRural income gap–—Based on the multiscale geographically weighted regression model (MGWR). J. China Univ. Geosciences (Social Sci. Edition) 22 (5), 112–123.
Zhang Q., Liu H., Wan Z. (2022b). Evaluation on the effectiveness of ship emission control area policy: Heterogeneity detection with the regression discontinuity method. Environ. Impact Assess. Rev. 94, 106747. doi: 10.1016/j.eiar.2022.106747
Zhang X., Zhang Y., Liu Y., Zhao J., Zhou Y., Wang X., et al. (2019). Changes in the SO2 level and PM2. 5 components in shanghai driven by implementing the ship emission control policy. Environ. Sci. Technol. 53 (19), 11580–11587. doi: 10.1021/acs.est.9b03315
Zhi Q. (2021). The impact of maritime energy transportation on the global shipping market. China Storage Transportation 10, 196–197.
Keywords: pollutant emissions, coastline length, population, throughput, multiscale geographically weighted regression
Citation: Xiao G, Wang T, Luo Y and Yang D (2023) Analysis of port pollutant emission characteristics in United States based on multiscale geographically weighted regression. Front. Mar. Sci. 10:1131948. doi: 10.3389/fmars.2023.1131948
Received: 26 December 2022; Accepted: 16 February 2023;
Published: 28 February 2023.
Edited by:
Jihong Chen, Shenzhen University, ChinaReviewed by:
Ruobin Gao, Nanyang Technological University, SingaporeCopyright © 2023 Xiao, Wang, Luo and Yang. This is an open-access article distributed under the terms of the Creative Commons Attribution License (CC BY). The use, distribution or reproduction in other forums is permitted, provided the original author(s) and the copyright owner(s) are credited and that the original publication in this journal is cited, in accordance with accepted academic practice. No use, distribution or reproduction is permitted which does not comply with these terms.
*Correspondence: Guangnian Xiao, Z254aWFvQHNobXR1LmVkdS5jbg==
Disclaimer: All claims expressed in this article are solely those of the authors and do not necessarily represent those of their affiliated organizations, or those of the publisher, the editors and the reviewers. Any product that may be evaluated in this article or claim that may be made by its manufacturer is not guaranteed or endorsed by the publisher.
Research integrity at Frontiers
Learn more about the work of our research integrity team to safeguard the quality of each article we publish.