 Jiawei Liu1,2
 Xiaoshou Liu
95% of researchers rate our articles as excellent or good
Learn more about the work of our research integrity team to safeguard the quality of each article we publish.
Find out more
ORIGINAL RESEARCH article
Front. Mar. Sci. , 22 February 2023
Sec. Marine Pollution
Volume 10 - 2023 | https://doi.org/10.3389/fmars.2023.1130696
To explore the applicability of taxonomic sufficiency in benthic ecological quality assessments, we analyzed the similarity of data matrices under different taxonomic levels and transformations based on macrofaunal data sampled from a semi-enclosed bay. The data matrix similarity revealed a highly significant correlation among the similarity matrices at the species level and those at the higher taxonomic levels (genus, family and order), while the correlation coefficients among the matrices decreased with increasing taxonomic levels. Second-stage CLUSTER plots showed that the quantitative genus level was the closest to the quantitative species level. The loss of family level data varied among seasons. The results of the response to environmental factors at the genus and family levels were similar to those at the species level. In the assessment of the benthic ecological quality of semi-enclosed bays, the level of macrofauna identification can be at the genus or family level to improve the cost performance, depending on logistical conditions.
Accurate biological classification and identification techniques are required for obtaining accurate biological data when using organisms for environmental quality assessments (Cadotte et al., 2013; Gerwing et al., 2020). However, according to the requirements of traditional survey programs, it is usually necessary to perform survey sampling over a large area and using a large number of biological samples for classification and identification in a limited time. Therefore, problems such as a large workload, high professional requirements, and long-time consumption exist (Bilyard, 1987; Wu et al., 2012; Zhu et al., 2018). In this context, the use of higher taxonomic levels instead of the species level for environmental assessments was proposed. In 1985, Ellis introduced the concept of taxonomic sufficiency in pollution assessment studies (Ellis, 1985). Taxonomic sufficiency refers to the use of higher taxonomic levels (genus, family, etc.) instead of the species level to assess ecological quality status without losing statistical significance in environmental quality assessments. Taxonomic sufficiency does not require identification of biological samples at the species level, thereby not only reducing the level of expertise and workload required for identification, but also reducing the chance of taxonomic errors. In some studies, similar results were obtained when using data at the family or genus level instead of those at the species level when conducting environmental quality assessments (e.g. Terlizzi et al., 2009; Aguado-Giménez et al., 2015; Xiong et al., 2018). Some studies on environmental stress responses have shown that responses to environmental factors at the family or genus level are similar to that at the species level (Landeiro et al., 2012; Pitacco et al., 2019a). Many studies have concluded that the identification of organisms at the genus and family levels is sufficient (Chessman et al., 2009; Dauvin et al., 2016; Pitacco et al., 2019b), and one study even concluded that environmental quality assessments conducted at the family and genus levels are more accurate than those at conducted the species level (Checon and Amaral, 2017). Meanwhile, some researchers have questioned the reliability of taxonomic adequacy methods, arguing that information at the species level is lost when using higher taxonomic levels instead of the species level for environmental quality assessment, especially when there are large differences in the fouling tolerance of some macrofauna of the same family or genus. Only identification at the species level can accurately reveal the response of assemblage structure to environmental stress (Maurer, 2000; Elbrecht et al., 2017; Laini et al., 2020).
Considering the professional requirement to identify biological samples at the species level and the large workload required, many countries and regions worldwide did not have sufficient resources to conduct excessively detailed research (Li, 2015). Taxonomic sufficiency has been applied in many regions globally as a rapid method for conducting environmental quality assessments (Terlizzi et al., 2003). A study on heterogeneous tropical coastlines in India showed consistent spatial and temporal distribution trends at the order, family, genus, and species levels in polychaetes (Vijapure and Sukumaran, 2019). The taxonomic diversity of macrofauna in Xiamen Bay showed that the assemblage structure at the species, genus, and family levels was highly consistent, and there is less information lost at the genus level than at the family level (Zhu et al., 2018). A study on Guanabara Bay showed similar results when species were aggregated into genera and families (Soares-Gomes et al., 2012). A study conducted in the southern Gulf of Mexico found almost no loss of information for assessment of the benthic ecological quality when using the family level instead of the species level (Domínguez-Castanedo et al., 2007).
Semi-enclosed bays with large areas of water and small waves are ideal for the development of port shipping and aquaculture. However, with increasing human activities around bays (such as sewage, aquaculture, port shipping, and tourism), pollution of semi-enclosed bays is a major concern (Peng et al., 2013). Macrofauna has often been used to assess the quality of marine benthic environments (Li et al., 2020). Jiaozhou Bay is a typical semi-enclosed bay in the southern Shandong Peninsula. Historical studies on the macrofaunal assemblage in Jiaozhou Bay showed that the abundance and biomass of macrofauna in Jiaozhou Bay increased from the central region of the bay to the northern and southern regions, and that the bottom temperature and substrate characteristics were important factors influencing the distribution of macrofauna in the bay (Yang et al., 2021). Based on the macrofauna data from four seasons in Jiaozhou Bay, we analyzed the correlation between different taxonomic levels of macrofauna and their response to environmental stresses under different data transformations and explored whether higher taxonomic levels could have the same or similar assessment effects to those at the species level to provide a basis for the application of macrofaunal taxonomic sufficiency in benthic ecological quality assessments.
Jiaozhou Bay is located in the southern Shandong Peninsula and is a typical semi-enclosed bay and one of the earliest bays on which benthic ecology studies were conducted in China (Chen et al., 2021). Several rivers around Jiaozhou Bay, such as the Nanjiao and Dagu Rivers, constantly transport various nutrients into the bay, resulting in high biodiversity and productivity in the bay. The dense population around Jiaozhou Bay, river runoff inputs, point source pollution discharge, and other anthropogenic activities have aggravated eutrophication in this region.
Macrofauna sampling was conducted in Jiaozhou Bay in February, May, August, and November 2014 during four seasons (winter, spring, summer, and autumn), and a total of 14 stations (J1-J14, Figure 1) were set up for the survey, with the sampling-station map being obtained from Han et al. (2021) and Lu et al. (2021). The station locations were consistent for each season, while Station J6 was not sampled in spring and autumn because of weather conditions. Four replicate samples were collected using a 0.05 m2 box-corer, sorted on board using a 0.5-mm sieve, and combined into one sample. Macrofauna and residues were then stored in 500-mL sample bottles, and preserved in 75% ethanol. Surface sediments were also collected at each station and brought back to the laboratory to determine the water content, organic matter content, median grain size, chlorophyll a (Chl-a), and phaeophorbide (Pha). The sediment grain size was measured using a laser particle size analyzer (Master Sizer 3000; Liu et al., 2007), and Chl-a and Pha were determined using fluorescence spectrophotometry and calculated using the correction formula of Wang (1986). The organic matter content was determined using the potassium dichromate-sulfuric acid (K2Cr2O7-H2SO4) oxidization method. The water depth, bottom temperature, salinity, and pH at all stations were measured in situ using a YSI 600XLM Multi-Parameter Water Quality Sonde (YSI Inc., USA).

Figure 1 Map of the sampling stations in Jiaozhou Bay, China.
The macrofaunal samples were stained for 24 h in the laboratory using 1 ‰ Rose Bengal. After sieving and washing using a 0.5-mm sieve, all macrofauna specimens were collected, identified under a stereomicroscope, and weighed using an electronic balance with 0.0001 g sensitivity.
The multivariate analysis software PRIMER 6.0 was used to analyze the assemblage structure. The macrofauna species-abundance data identified at the species level were taxonomically aggregated to the genus, family, and order levels to create a total of four datasets. The aggregation rate (φ) (ratio of the higher rank taxon count to the species count) was calculated separately for the different taxonomic levels (Bevilacqua et al., 2012). The ratios were used to evaluate the consistency between species and higher taxonomic levels.
The Shannon-Wiener diversity index (H’(log2)), Simpson diversity index (D), Margalef’s richness index (d), and Pielou’ evenness index (J′) were calculated separately for each taxonomic level using Primer 6.0.
To analyze the relationship between the same diversity indices at different taxonomic levels, Pearson’s correlation coefficients were calculated between the same diversity indices at different taxonomic levels using SPSS 22.0. Five data transformations (none, square root, fourth root, log(x+1), and presence/absence) were then performed on each of the four taxonomic-level datasets using the PRIMER software (version 6.0) to produce a total of 20 data matrices, thereby gradually reducing the contribution of dominant taxa. Thereafter, the Spearman rank correlations between the species level and higher taxonomic level Bray-Curtis similarity matrices under different data transformations were analyzed using the RELATE routine, and the corresponding correlation coefficients were calculated. The range of the correlation coefficient rho is 0–1, where rho=0 indicates that the two taxonomic levels are not correlated, and rho=1 indicates that the two taxonomic levels are highly correlated (Sun et al., 2021). To balance minimal information loss and least classification efforts, the cost/benefit ratio (CBL) was calculated for all combinations of taxonomic levels and data conversion methods to select the appropriate taxonomic level according to Karakassis and Hatziyanni (2000).
where CBL is the cost/benefit ratio at taxonomic level L, rL is the Spearman correlation coefficient between taxonomic level L and the species level, tL is the number of taxa present at taxonomic level L, and S is the number of species. The ratio ranges between 0 and 1, where a lower value indicates higher cost-effectiveness of the treatment.
The above 20 data matrices were visualized using second-stage non-metric multidimensional scaling (nMDS) to visually represent the correlation between different taxonomic levels.
We selected the species, genus, and family levels converted using the fourth root transformation as quantitative data (Quan) and those converted using the presence/absence transformation as qualitative data (Qual) for second-stage CLUSTER analysis according to the results of the nMDS plot (Xu et al., 2016), calculated the similarity between different matrices, and drew a CLUSTER plot to analyze the degree of information loss between assemblages at different taxonomic levels. BIOENV analysis was used to identify the best matching combination of environmental factors determining macrofaunal distribution patterns (Wang et al., 2017).
A total of 251 species of macrofauna were collected from four seasons in Jiaozhou Bay, including polychaetes (104 species, 41.43%), mollusks (51 species, 20.32%), crustaceans (73 species, 29.08%), and other taxa (23 species, 9.16%). The aggregation rates (Table 1) were 0.91, 0.87, 0.90, and 0.91 for genera; 0.68, 0.60, 0.61, and 0.67 for families; and 0.29, 0.20, 0.20, and 0.24 for orders in spring, summer, autumn, and winter, respectively.
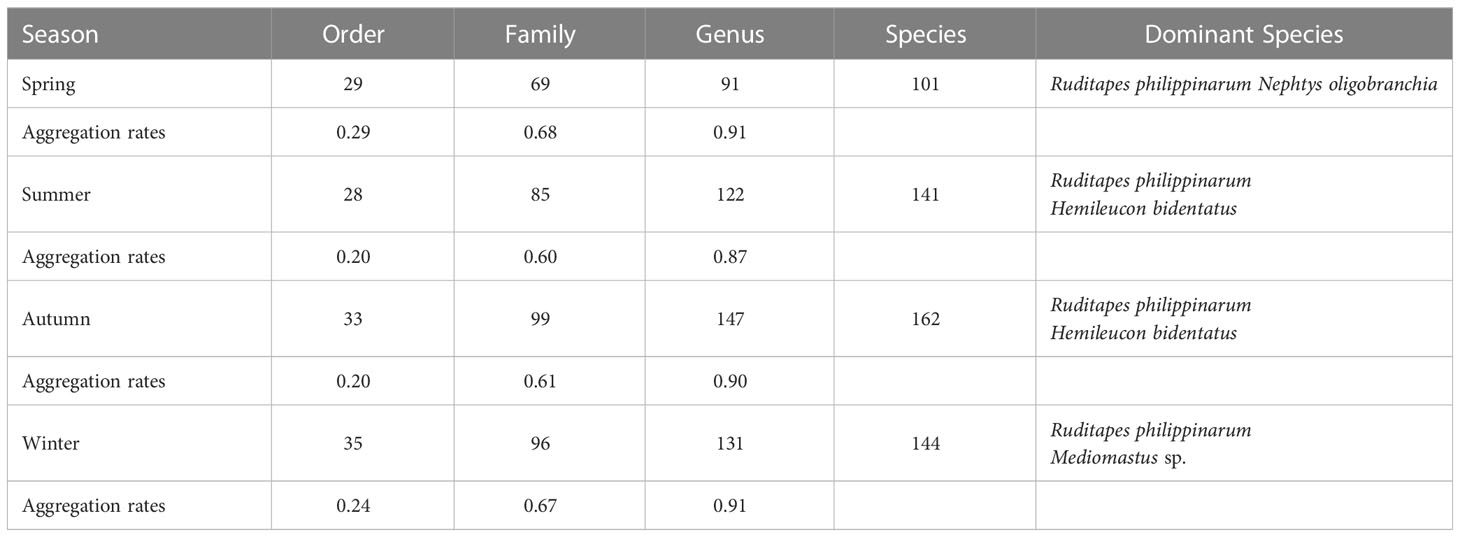
Table 1 Numbers of macrofauna orders, families, genera, and species, aggregation rates, and dominant species for the four sampling seasons in Jiaozhou Bay, China.
As shown in Figure 2, the Shannon-Wiener diversity index (H’), Simpson diversity index (D), Margalef’s richness index (d), and Pielou’s evenness index (J’) at different taxonomic levels exhibited similar spatial and temporal trends, and the Simpson diversity index (D) and Pielou’s evenness index (J’) at different taxonomic levels were very similar among stations. Pearson’s correlation coefficients were calculated between the same diversity indices at four different taxonomic levels: species, genus, family, and order, and it was found that the relationships between the same diversity indices at different taxonomic levels were all highly significantly positive (p<0.01). In general, higher taxonomic levels yielded lower values of H’, D, and d. Diversity indices derived from different taxonomic levels were significantly lower at stations 2, 3, and 12 in summer and at station 2 in autumn.
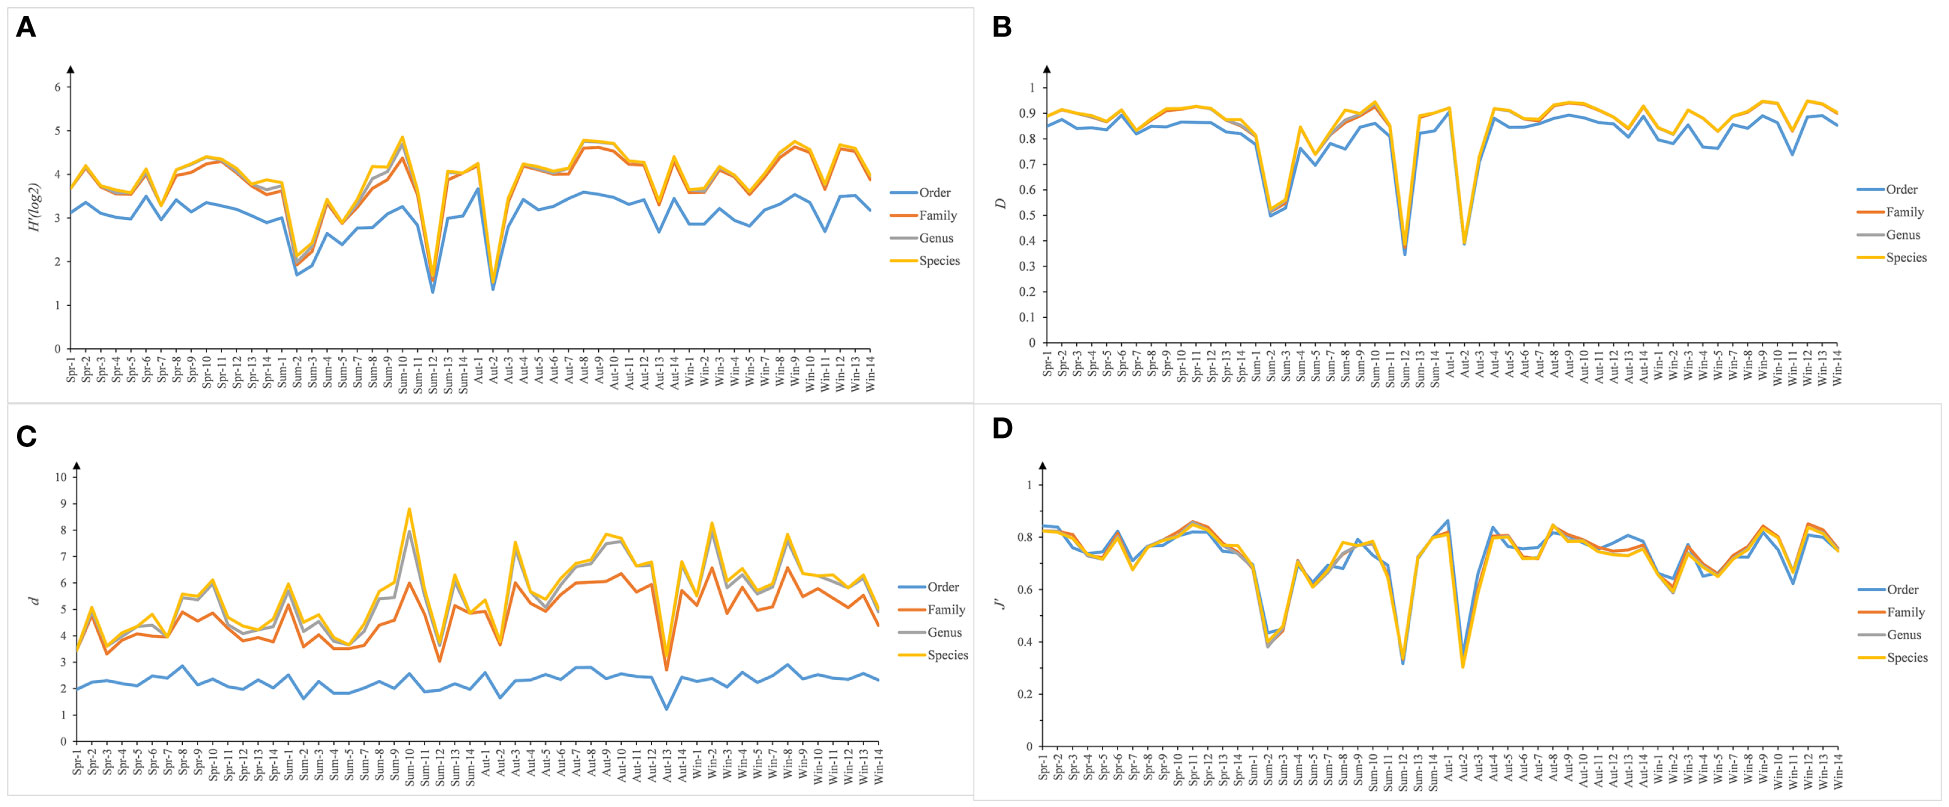
Figure 2 Univariate indices of Shannon-Wiener diversity index (H’), Simpson diversity index (D), Margalef's richness index (d), and Pielou' evenness index (J’) calculated for each station (J1J14) at taxonomic resolutions of species, genus, family, and order in spring (Spr), summer (Sum), autumn (Aum), and winter (Win) of Jiaozhou Bay, China.
The results of the correlation of Bray-Curtis similarity matrices with different data transformations at different taxonomic levels for the four seasonal macrofauna assemblages in Jiaozhou Bay (Figure 3) showed that there were significant correlations (P<0.001) between the species level and higher taxonomic level similarity matrices; however, the correlation coefficients between the matrices decreased with increasing taxonomic level, regardless of the data transformation method. The correlation between species- and genus-level matrices was particularly high (Rho ≥0.965), independent of the type of data transformation applied. Data compression at the family level resulted in matrix similarity coefficients (Rho) ≥0.8 for the vast majority of family levels and corresponding species levels (except for the summer quadratic-root-transformed similarity coefficient, which was 0.797 and the summer presence/absence-transformed similarity coefficient, which was 0.622), which were large despite the gaps in correlation at the genus and species levels. However, the severe transformation type of presence/absence appeared to considerably lower the correlation values of order with the species matrices. In contrast, the species–order levels had the lowest similarity coefficients under all data transformations compared with the species–genus and species–family levels. The CBL values at the order level and presence/absence transformation were the lowest among the 20 data matrices for all taxonomic levels and data transformations (Table S1). In this study, the genus aggregation rate ranged from 0.87– 0.91, the family aggregation rate ranged from 0.60–0.68 and the order aggregation rate ranged from 0.20– 0.29 for the four seasons.
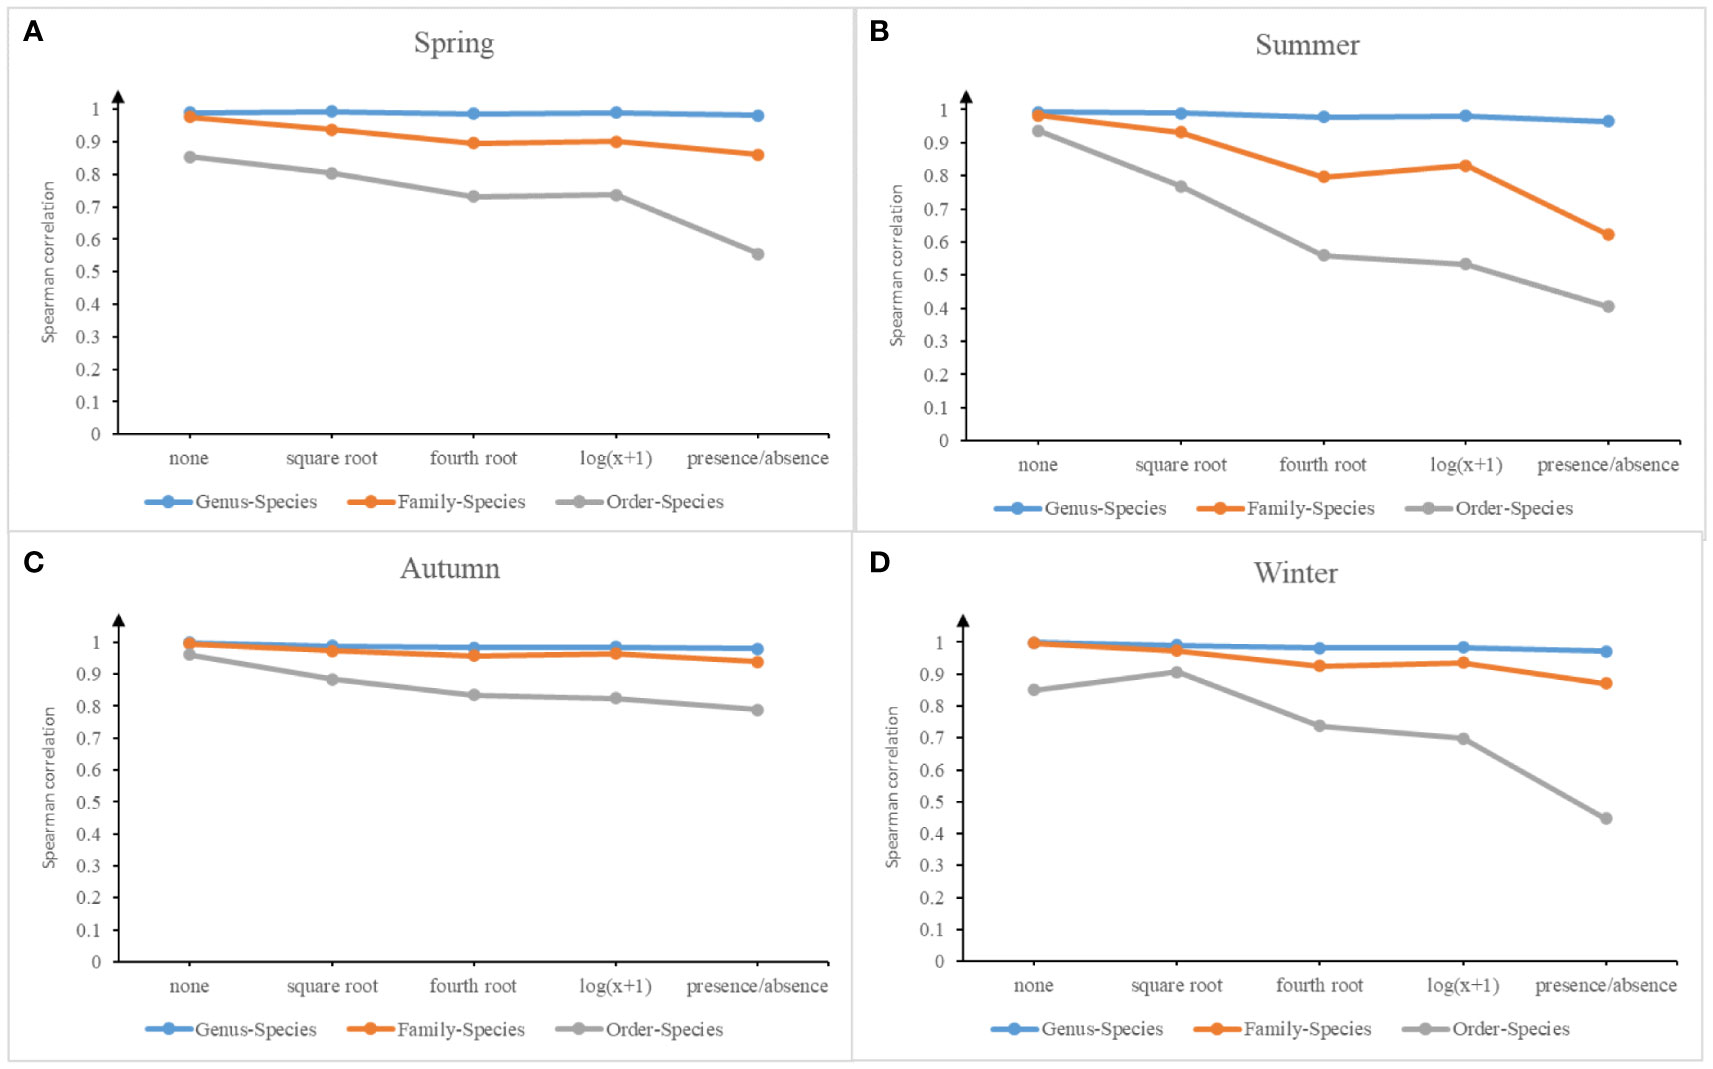
Figure 3 Spearman correlation coefficient trends between the similarity matrices of different taxonomic levels (genus-species, family-species and order-species) with various data transformations (none, square root, fourth root, log (x+1), and presence/absence) in the four seasons of Jiaozhou Bay, China.
Each symbol in the second-stage nMDS ranking plot (Figure 4) represented a similarity matrix, and the degree of similarity between the similarity matrices is represented by the distance between symbols. As Figure 4 showed, the taxonomic levels and data transformations occur in different directions of separation, indicating the independent effects of these two treatments on the data. In the second-stage nMDS ranking plot, similarity to the species-level matrix decreased as the taxonomic level increased from genus to order. It can be clearly seen that the genus level matrices are very similar to the species level matrices, while the order level matrices are the least similar to the species level matrices. It is worth noting that, in the data transformation, the distance between the fourth root and log(x+1) transformations was significantly smaller (Figure 4) than the distance between other data transformations, indicating that the matrix after the fourth root and log(x+1) transformations are highly similar.
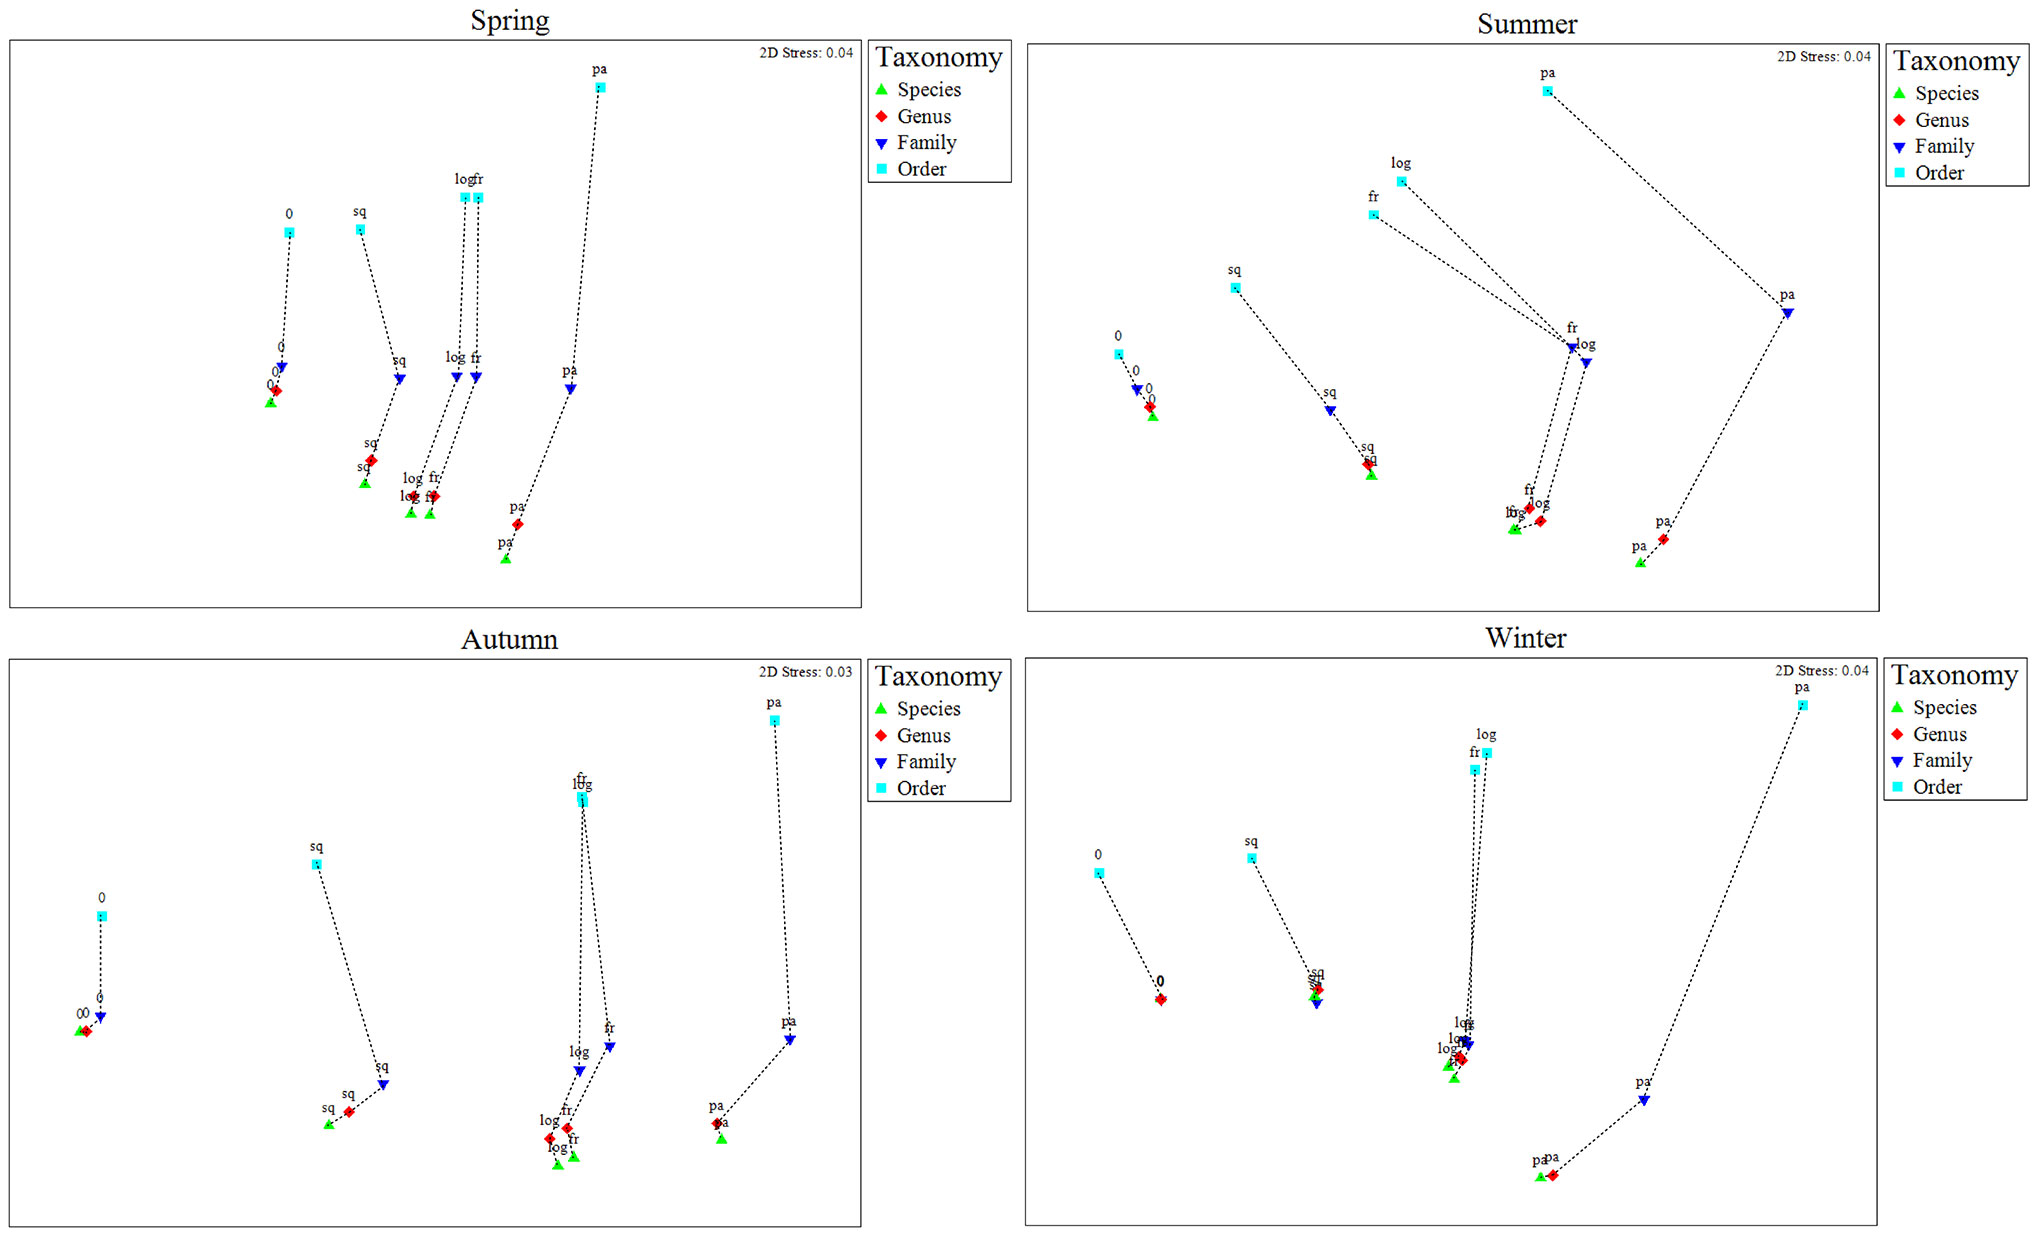
Figure 4 Second-stage non-metric multidimensional scaling (nMDS) of the four taxonomic levels (species, genus, family and order) with various data transformations (0: none; sq: square root; fr: fourth root; log: log (x+1); pa: presence/absence) in the four seasons of Jiaozhou Bay, China.
According to the second-stage nMDS plot, the highest similarity with the species level was at the genus level, followed by the family level, and the lowest similarity with the species level was at the order level. Moreover, it was found that the taxonomic levels with the lowest CBL values after the same data conversion only included the genus and family levels (Table S1). According to the second-stage CLUSTER plot (Figure 5), during the four seasons, the quantitative species level was closest to the quantitative genus level, and the loss of information was less than 3%. The loss of information between the quantitative and qualitative species-level data was less than 8%. Comparing the quantitative data of the different taxonomic levels, the information lost from the genus level data was less than 3% compared with the species-level data, whereas the degree of information loss from the family level data varied greatly among seasons: 10.5% in spring, 20.3% in summer, 4.3% in autumn, and 7.4% in winter.
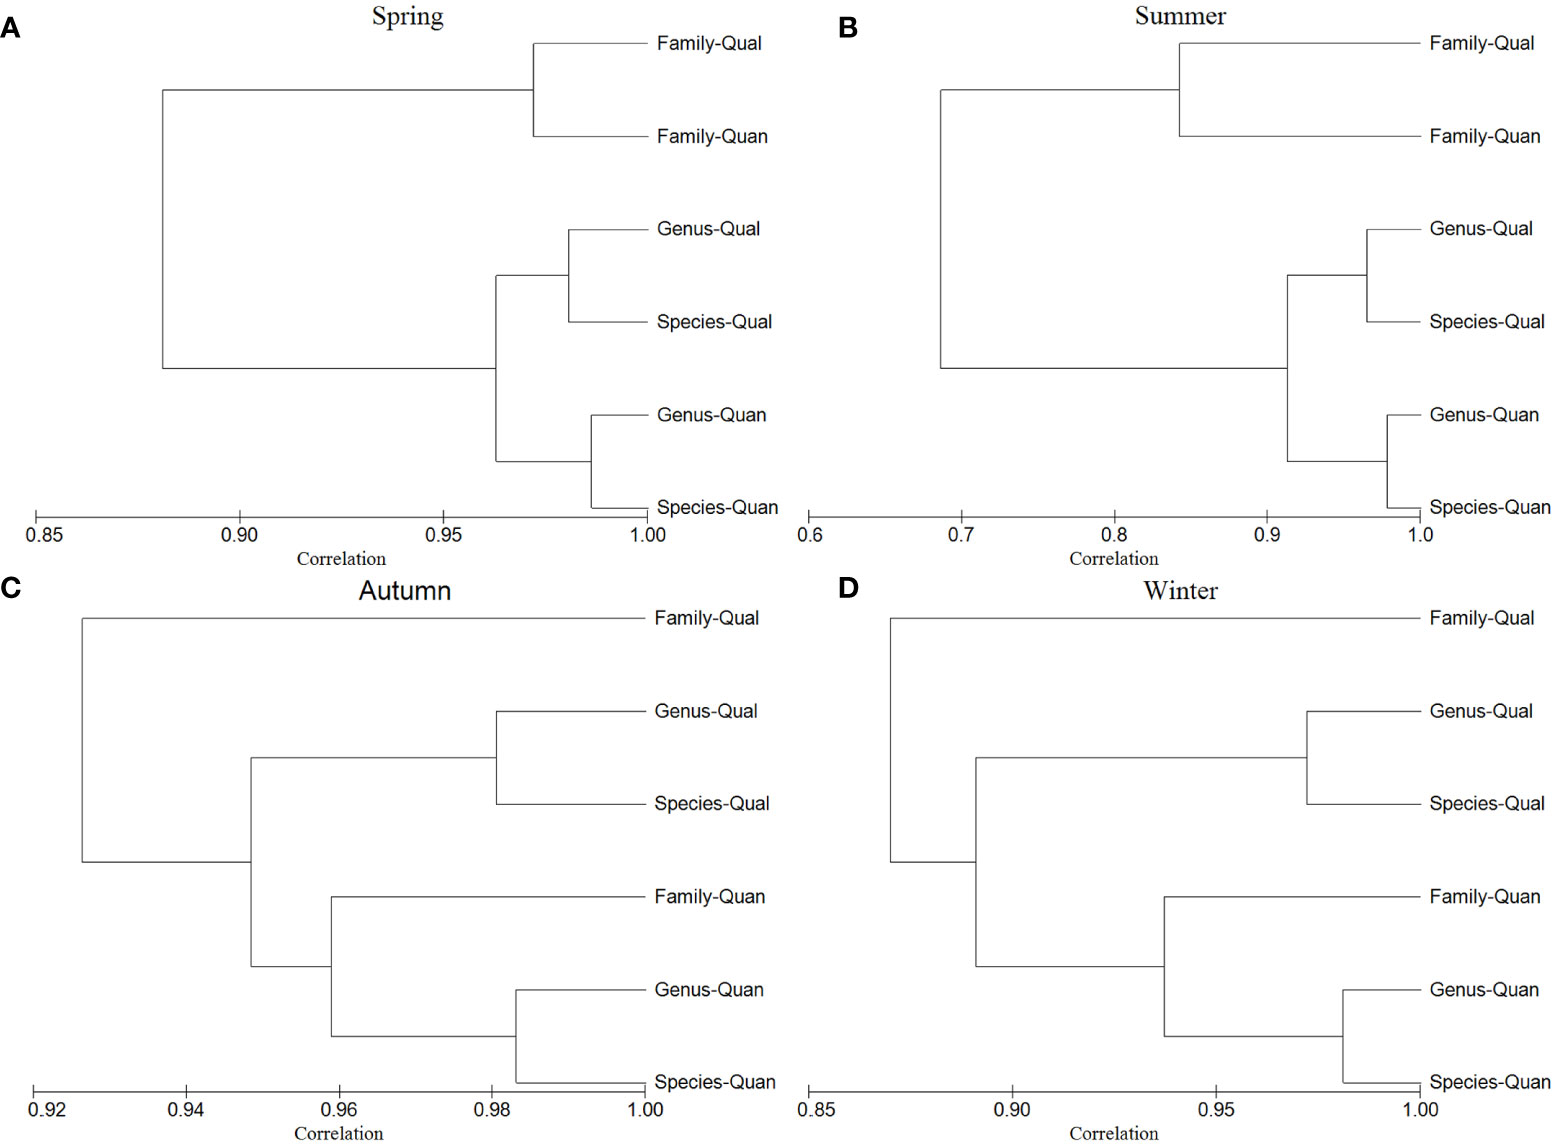
Figure 5 Second-stage CLUSTER plots based on the similarity matrices of different taxonomic levels (species, genus and family) with quantitative data converted using the fourth root transformation (Quan) and qualitative data converted using the presence/absence transformation (Qual) in the four seasons of Jiaozhou Bay, China.
The correlation between macrofaunal assemblages at different taxonomic levels with environmental factors was influenced by season, taxonomic level, and differences of quantitative or qualitative data (Table 2). Considering the best combination of environmental factors and the coefficients of correlation, it was found that there were remarkable seasonal differences in the response of macrofauna to environmental factors. Overall, the correlation between macrofaunal assemblages at the genus and family levels with environmental factors were similar to those at the species level. The correlation between macrofaunal quantitative data with environmental factors was higher than that of the qualitative data at the same taxonomic level. The correlation between macrofaunal quantitative and qualitative data at different taxonomic levels with environmental factors decreased with increasing taxonomic levels (except that the genus level was slightly higher than the species level in spring). The most correlated environmental factors with macrofaunal assemblages at each taxonomic level were the same in spring, while for the other three seasons, only similar environmental factors at the genus and species levels. The correlation between macrofaunal assemblages at the genus level with environmental factors was the highest in spring, and the correlation between macrofaunal assemblages at species level with environmental factors was the highest in the other three seasons.
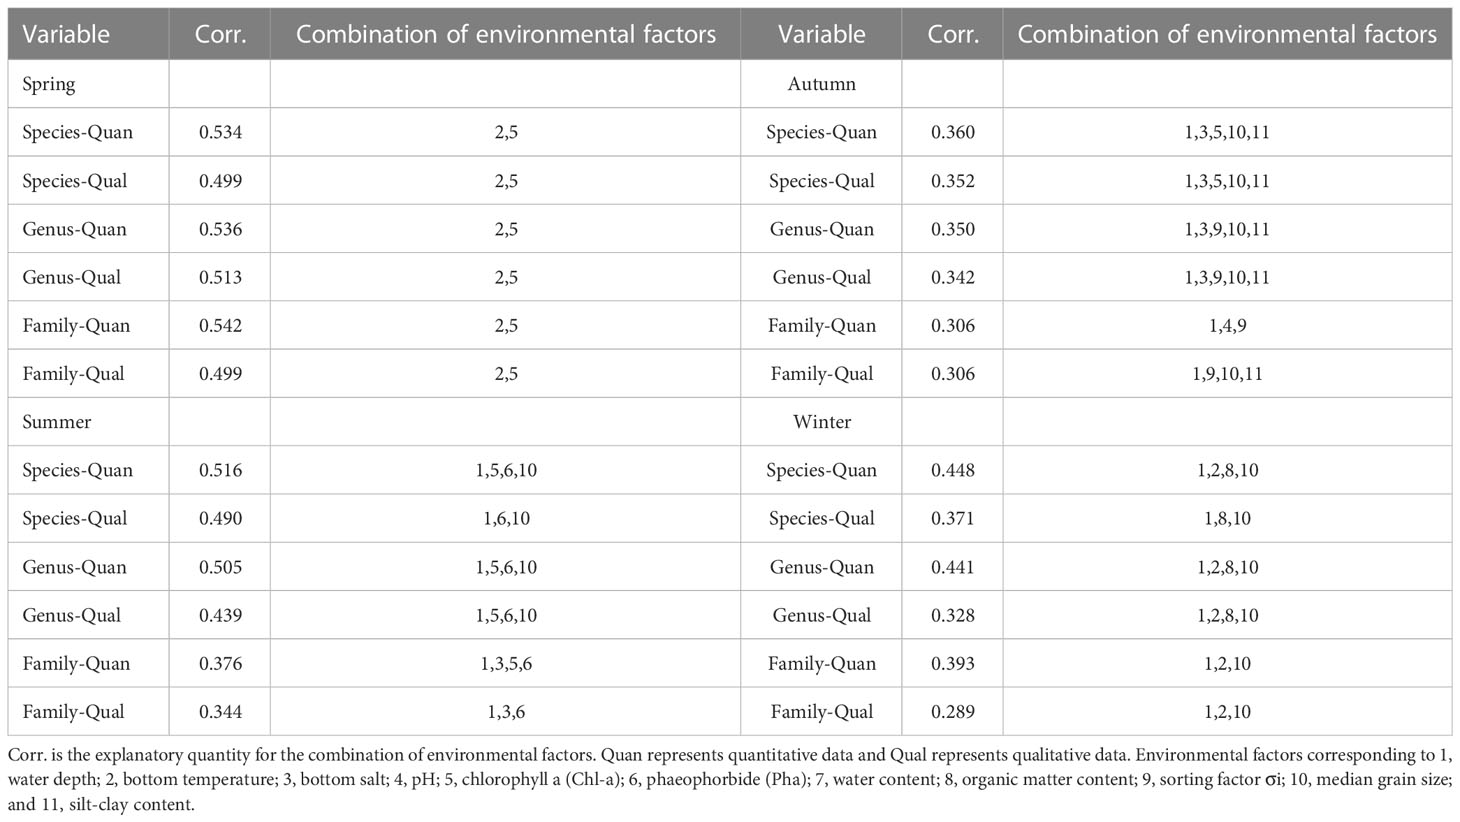
Table 2 Results of BIOENV analysis between environmental factors and macrofaunal assemblages in Jiaozhou Bay, China.
In this study, five different data transformations (none, square root, fourth root, log(x+1), and presence/absence) were used to explore the applicability of taxonomic sufficiency in benthic ecological quality assessments using macrofauna. The fourth root and log(x+1) transformations were the closest among all those biological data transformations, and identification of biological data to higher taxonomic levels (genus and family levels) were both effective methods for assessing macrofaunal assemblages. Overall, as the transformation intensity and the classification become rougher, the CBL index values will increase.
Among the four seasons, the correlation coefficients of the similarity matrices between the species levels and the higher taxonomic levels were significantly correlated (p<0.001), and the correlation coefficients of the similarity matrices between the different taxonomic levels decreased with increasing taxonomic levels, regardless of the data transformation method. The correlation between the same taxonomic level and species level changed dramatically because of season and data transformation, indicating that the assemblage structure at the genus level was the most consistent with the species level, and the assemblage structure of order level data was least consistent with the species level. The genus aggregation rate was higher than the family aggregation rate, which was much higher than the order level aggregation rate. A study showed that the consistency of assemblage structure between species and higher taxonomic levels increases as a result of higher rates of aggregation within assemblages, which leads to closer assemblage composition between taxonomic levels (Bowman and Bailey, 1997). Therefore, less information was lost at the genus and family levels compared to at the order level in Jiaozhou Bay. A study showed that the aggregation rate has a major influence on the effectiveness of taxonomic sufficiency and that the use of taxonomic sufficiency would work better in biomes with high aggregation rates (Oliveira et al., 2020).
The relationships between the transformed data matrices of different data at different taxonomic levels were further analyzed using second-stage nMDS plots. The closer the relative position, the stronger the correlation of the corresponding assemblage structures. Regardless of the type of data transformation, the distance between the genus and species levels was smaller than that between the species level and family level during all four seasons; therefore, the consistency between the species and genus level assemblage compositions was higher.
Further CLUSTER analysis of the quantitative and qualitative data selected from the nMDS plot revealed that the quantitative data at the genus level in Jiaozhou Bay had the lowest loss of information during the four seasons (all less than 3%), which was similar to results obtained from the Liaohe estuary and northern Jiangsu (less than 3% and less than 5%, respectively) and better than that in Xiamen Bay (8%). The loss of information at the family level varied widely (4.3%–20.3%) among seasons, similar to results obtained from Xiamen Bay (20%) and differing remarkable from those obtained from the Liaohe estuary and northern Jiangsu (less than 6% and 7%, respectively) (Wu et al., 2012; Zhu et al., 2018; Sun et al., 2021). The above results were consistent with the nMDS plot, indicating the genus level was the most consistent with the species level, and the correlation between family level and species level was also high on the whole of that year. The reasons of this phenomenon need further study. In terms of the quantitative and qualitative data, it was always the genus-level quantitative data that differed the least from the species-level quantitative data in all four seasons, while the genus-level qualitative data that were closest to the species-level qualitative data. It can be seen that the genus- and species-level data in the quantitative data of Jiaozhou Bay had very minor differences. However, the information is lost at the family level (Figure 5). In summary, genus- and family-level data could replace species-level quantitative data to some extent.
The correlation results between macrofaunal assemblages with environmental factors showed that the coefficients for the combination of environmental factors decreased with increasing taxonomic level except the spring. It has been suggested that, when environmental pollution becomes heavier, pollution-tolerant species increase together because of their tolerance to environmental pollution, whereas sensitive species decrease as they avoid the unfavorable environment. The higher taxonomic levels would respond more obvious to environmental factors (Olsgard et al., 1998). Although the family level aggregation rate in Jiaozhou Bay was large (φ>0.6), our study was not consistent with the study in the Liaohe Estuary (Sun et al., 2021), possibly because the pollution was lighter and the majority of species belonged to sensitive species in Jiaozhou Bay. The correlation between macrofaunal assemblages with environmental factors in different seasons differed significantly, indicating that the optimal combination of environmental factors differed significantly among different seasons. Because Jiaozhou Bay is located in a warm temperate zone and has shallow water, the bottom temperature changes drastically. Thus, the response of macrofauna to bottom temperature is more remarkable in spring and winter, probably because the warming temperature in spring can promote the spawning, growth, and development of macrofauna larvae, while the sudden temperature drops in winter may inhibit the feeding and other behaviors of macrofauna (Quan et al., 2020). The response to Chl-a may be related to the seasonal variation in nutrient input. With rapid population growth and industrial and agricultural development around Jiaozhou Bay in recent years, industrial and agricultural wastewater, domestic sewage, and solid waste discharged into Jiaozhou Bay have increased annually (Li et al., 2021). Nutrient concentrations in Jiaozhou Bay are mainly influenced by coastal inlet rivers (Dagu River, Licang River, etc.) and urban discharges, and the nutrient input from these land-based sources will lead to eutrophication in Jiaozhou Bay, which will, in turn, elevate the Chl-a content (Song et al., 2020). The response to Chl-a is more remarkable in spring and summer, which are the two seasons with relatively concentrated rainfall in Qingdao, and this will intensify the discharge of pollution. The water depth in Jiaozhou Bay is generally shallow, and human activities such as shipping and fishing are frequent, all of which will have influence on the state of the substrate. Therefore, the macrofauna assemblages respond remarkably to the indicators related to the substrate during the three seasons. Because the different physicochemical properties of Jiaozhou Bay in different seasons led to differences in the assemblage composition of macrofauna in the different seasons, the correlation between macrofaunal assemblages with environmental factors were not consistent in different seasons. The explanatory degree for the combination of environmental factors decreases with increasing taxonomic level and data transformation within the same season. This is because some information is lost as the transformation intensifies and the classification becomes coarser. In general, the correlation between macrofaunal assemblages at genus and family levels with environmental factors were similar to those at the species level to some extent. Therefore, the identification of macrobenthos can be extended to the genus and species levels when environmental monitoring is conducted in Jiaozhou Bay.
In studies related to biome structure and environmental responses, quantitative data are generally used to reflect the environment more clearly than qualitative data. However, quantitative data require detailed work and are susceptible to being influenced by the dominant species. In contrast, qualitative data only consider the presence or absence of species, and cannot be interfered by the dominant species, while being able to work better for rare and diagnostic species (Serrana et al., 2022). The combination of environmental factors identified by quantitative and qualitative data corresponding to taxonomic levels in the four seasons had high similarity, while the amount of explanatory environmental factors by qualitative data was lower than that explained by quantitative data in all cases. Therefore, we recommend that using species-level qualitative data instead of species-level quantitative data to reduce sampling efforts for large-scale environmental monitoring surveys. However, this requires further study and discussion at larger spatial and temporal scales (Pires et al., 2021). In this study, only the qualitative data of different categorical order elements in spring are consistent with the quantitative data in terms of environmental response changes (Corr. and environmental factors), so the qualitative data cannot be generalized to all applications.
In conclusion, taxonomic sufficiency has been widely used as a simplified biological monitoring method for aquatic ecosystems (Warwick, 1988). The identification of macrofauna at the species level usually requires a high level of classification expertise and increases the rate of identification errors, and identification of macrofauna at the species level is not always feasible because of time constraints or economic costs (Furse et al., 1984). Studies have shown that the cost of identification can be greatly reduced by identifying the genus and family levels, and that information loss at the genus level is less than that at the family level (Ferraro and Cole, 1995; Baldo et al., 1999). Moreover, environmental changes mainly affect assemblage structure through species replacement. Paying too much attention to species-level identification is usually unnecessary in environmental quality assessments, and environmental changes can also be monitored at a higher taxonomic level. According to the results in this study, monitoring and evaluating the environmental quality in semi-enclosed bays, the genus or family levels were recommended to improve the cost performance.
The original contributions presented in the study are included in the article/Supplementary Material. Further inquiries can be directed to the corresponding author.
JL contributed to the methodology, software, formal analysis, data curation, writing - original draft. ZX contributed to the investigation, data curation, editing, and funding acquisition. XL contributed to the conceptualization resources, writing - review and editing, supervision and funding acquisition. All authors contributed to the article and approved the submitted version.
This study was jointly supported by the National Natural Science Foundation of China (No. 41976131) and the Key Laboratory of Marine Ecology and Environmental Science and Engineering, State Oceanic Administration, China (No. MESE-2019-08).
We are grateful to the members of Lab of Benthos in Ocean University of China for their kind help during the field sampling and laboratory analysis.
The authors declare that the research was conducted in the absence of any commercial or financial relationships that could be construed as a potential conflict of interest.
All claims expressed in this article are solely those of the authors and do not necessarily represent those of their affiliated organizations, or those of the publisher, the editors and the reviewers. Any product that may be evaluated in this article, or claim that may be made by its manufacturer, is not guaranteed or endorsed by the publisher.
The Supplementary Material for this article can be found online at: https://www.frontiersin.org/articles/10.3389/fmars.2023.1130696/full#supplementary-material
Aguado-Giménez F., Gairín J. I., Martinez-Garcia E., Fernandez-Gonzalez V., Moltó M. B., Cerezo-Valverde J., et al. (2015). Application of “taxocene surrogation” and “taxonomic sufficiency” concepts to fish farming environmental monitoring. comparison of BOPA index versus polychaete assemblage structure. Mar. Environ. Res. 103, 27–35. doi: 10.1016/j.marenvres.2014.10.006
Baldo F., Garcia-Martin S. F., Drake P., Aris A. M. (1999). Discrimination between disturbed coastal ecosystems by using macrofauna at different taxonomic levels. Boletin. - Inst. Espanol. Oceanografia. 15, 489–493.
Bevilacqua S., Terlizzi A., Claudet J., Fraschetti S., Boero F. (2012). Taxonomic relatedness does not matter for species surrogacy in the assessment of community responses to environmental drivers. J. Appl. Ecol. 49, 357–366. doi: 10.1111/j.1365-2664.2011.02096.x
Bilyard G. R. (1987). The value of benthic infauna in marine pollution monitoring studies. Mar. Pollut. Bull. 18, 581–585. doi: 10.1016/0025-326X(87)90277-3
Bowman M. F., Bailey R. C. (1997). Does taxonomic resolution affect the multivariate description of the structure of freshwater benthic macroinvertebrate communities? Can. J. Fish. Aquat. Sci. 54, 1802–1807. doi: 10.1139/f97-085
Cadotte M., Albert C. H., Walker S. T. (2013). The ecology of differences: assessing community assembly with trait and evolutionary distances. Ecol. Lett. 16, 1234–1244. doi: 10.1111/ele.12161
Checon H. H., Amaral A. C. Z. (2017). Taxonomic sufficiency and the influence of rare species on variation partitioning analysis of a polychaete community. Mar. Ecol. 38, e12384. doi: 10.1111/maec.12384
Chen C., Yang X. J., Cui W. Y., Zhang M. S., Yu Z. S. (2021). Study on annual secondary production of macrobenthos and its influencing factors in Jiaozhou Bay. Periodical. Ocean. Univ. China 51, 45–56. doi: 10.16441/j.cnki.hdxb.20210034
Chessman B., Williams S., Besley C. (2009). Bioassessment of streams with macroinvertebrates: effect of sampled habitat and taxonomic resolution. J. North Am. Benthol. Soc. 26, 546–565. doi: 10.1899/06-074.1
Dauvin J. C., Andrade H., de-la-Ossa-Carretero J. A., Del-Pilar-Ruso Y., Riera R. (2016). Polychaete/amphipod ratios: An approach to validating simple benthic indicators. Ecol. Indic. 63, 89–99. doi: 10.1016/j.ecolind.2015.11.055
Domínguez-Castanedo N., Rojas-López R., Solís-Weiss V., Hernández-Alcántara P., Granados-Barba A. (2007). The use of higher taxa to assess the benthic conditions in the southern gulf of Mexico. Mar. Ecol. 28, 161–168. doi: 10.1111/j.1439-0485.2007.00178.x
Elbrecht V., Vamos E. E., Meissner K., Aroviita J., Leese F. (2017). Assessing strengths and weaknesses of DNA metabarcoding-based macroinvertebrate identification for routine stream monitoring. Methods Ecol. Evol. 8, 1265–1275. doi: 10.1111/2041-210X.12789
Ellis D. (1985). Taxonomic sufficiency in pollution assessment. Mar. Pollut. Bull. 16, 459. doi: 10.1016/0025-326X(85)90362-5
Ferraro S. P., Cole F. A. (1995). Taxonomic level sufficient for assessing pollution impacts on the southern California bight macrobenthos–revisited. Environ. Toxicol. Chem. 14, 1031–1040. doi: 10.1002/etc.5620140614
Furse M. T., Moss D., Wright J. F., Armitage P. D. (1984). The influence of seasonal and taxonomic factors on the ordination and classification of running-water sites in great Britain and on the prediction of their macro-invertebrate communities. Freshw. Biol. 14, 257–280. doi: 10.1111/j.1365-2427.1984.tb00040.x
Gerwing T. G., Cox K., Gerwing A. M. A., Campbell L., Macdonald T., Dudas S. E., et al. (2020). Varying intertidal invertebrate taxonomic resolution does not influence ecological findings. Estuarine. Coast. Shelf. Sci. 232, 106516. doi: 10.1016/j.ecss.2019.106516
Han C., Xu Z. D., Liu X. S. (2021). Characteristics of macrofaunal assemblages and their relationships with environmental factors in a semi-enclosed bay. Mar. Pollut. Bull. 167, 112348. doi: 10.1016/j.marpolbul.2021.112348
Karakassis I., Hatziyanni E. (2000). Benthic disturbance due to fish farming analyzed under different levels of taxonomic resolution. Mar. Ecol. Prog. Ser. 203, 247–253. doi: 10.3354/meps203247
Laini A., Beermann A. J., Bolpagni R., Burgazzi G., Elbrecht V., Zizka M. A., et al. (2020). Exploring the potential of metabarcoding to disentangle macroinvertebrate community dynamics in intermittent streams. Metabarcoding. Metagenom. 4, 65–79. doi: 10.3897/mbmg.4.51433
Landeiro V. L., Bini L. M., Costa F. R. C., Franklin E., Nogueira A., Souza J. L. P. D., et al. (2012). How far can we go in simplifying biomonitoring assessments? an integrated analysis of taxonomic surrogacy, taxonomic sufficiency and numerical resolution in a megadiverse region. Ecol. Indic. 23, 366–373. doi: 10.1016/j.ecolind.2012.04.023
Li Q. (2015). Taxonomic sufficiency and its application in biodiversity. J. Yunnan. Agric. University (Natural. Science). 30, 629–633. doi: 10.16211/j.issn.1004-390X(n).2015.04.023
Li B. Q., Jiang S. Y., Lv J. Z., Chen L. L., Yan L., Liu C. Y., et al. (2020). Species composition and long-term variation of macrobenthos in intertidal zone and offshore areas of the Yellow River Delta. Biodivers. Sci. 28, 1511–1522. doi: 10.17520/biods.2020164
Li S. S., Yu X. X., Zhang P., Cui W. L., Yang N. N., Li A. H., et al. (2021). Analysis of overloaded nitrogen and phosphorus discharged from land-based areas into Jiaozhou Bay. Environ. Sci. Technol. 44, 11–18. doi: 10.19672/j.cnki.1003-6504.1031.21.338
Liu X. S., Zhang Z. N., Huang Y. (2007). Sublittoral meiofauna with particular reference to nematodes in the southern Yellow Sea, China. Estuar. Coast. Shelf. Sci. 71, 616–628. doi: 10.1016/j.ecss.2006.09.013
Lu X., Xu J., Xu Z. D., Liu X. S. (2021). Assessment of benthic ecological quality status using multi-biotic indices based on macrofaunal assemblages in a semi-enclosed bay. Front. Mar. Sci. 8, 734710. doi: 10.3389/fmars.2021.734710
Maurer M. (2000). The dark side of taxonomic sufficiency (TS). Mar. Pollut. Bull. 40, 98–101. doi: 10.1016/S0025-326X(99)00235-0
Oliveira S. S. D., Ortega J. C. G., Ribas L. G. D. S., Lopes V. G., Bini L. M. (2020). Higher taxa are sufficient to represent biodiversity patterns. Ecol. Indic. 111, 105994. doi: 10.1016/j.ecolind.2019.105994
Olsgard F., Somerfield P. J., Carr M. R. (1998). Relationships between taxonomic resolution, macrobenthic community patterns and disturbance. Mar. Ecol. Prog. 172, 25–36. doi: 10.3354/meps172025
Peng S. T., Zhou R., Qin X. B., Shi H. H., Ding D. W. (2013). Application of macrobenthos functional groups to estimate the ecosystem health in a semi-enclosed bay. Mar. Pollut. Bull. 74, 302–310. doi: 10.1016/j.marpolbul.2013.06.037
Pires M. M., Grech M. G., Stenert C., Maltchik L., Epele L. B., McLean K. I., et al. (2021). Does taxonomic and numerical resolution affect the assessment of invertebrate community structure in new world freshwater wetlands? Ecol. Indic. 125, 107437. doi: 10.1016/j.ecolind.2021.107437
Pitacco V., Mistri M., Aleffi I. F., Lardicci C., Prato S., Tagliapietra D., et al. (2019b). The efficiency of taxonomic sufficiency for identification of spatial patterns at different scales in transitional waters. Mar. Environ. Res. 144, 84–91. doi: 10.1016/j.marenvres.2019.01.001
Pitacco V., Mistri M., Infantini V., Sfriso A., Sfriso A. A., Munari C. (2019a). Benthic studies in LTER sites: the use of taxonomy surrogates in the detection of long-term changes in lagoonal benthic assemblages. Nat. Conserv. 34, 247–272. doi: 10.3897/natureconservation.34.27610
Quan Q. M., Xiao Y. Y., Xu S. N., Fu F. F., Li C. H., Liu Y. (2020). Seasonal variation in macrozoobenthos community structure and its relation to environmental factors in Jiaozhou Bay. Chin. J. Ecol. 39, 4110–4120. doi: 10.13292/j.1000-4890.202012.027
Serrana J. M., Li B., Sumi T., Takemon Y., Watanabe K. (2022). Implications of taxonomic and numerical resolution on DNA metabarcoding-based inference of benthic macroinvertebrate responses to river restoration. Ecol. Indic. 135, 108508. doi: 10.1016/j.ecolind.2021.108508
Soares-Gomes A., Mendes C. L. T., Tavares M., Santi L. (2012). Taxonomic sufficiency of polychaete taxocenes for estuary monitoring. Ecol. Indic. 15, 149–156. doi: 10.1016/j.ecolind.2011.09.030
Song J. M., Yuan H. M., Li X. G., Duan L. Q. (2020). Ecological environment evolution and nutrient variations in Jiaozhou Bay. Mar. Sci. 44, 106–117. doi: 10.11759/hykx20200220001
Sun Y., Li H. J., Gu Y. B., Fan J. F., Guo H. (2021). Optimization of macrobenthos monitoring strategy using taxonomic sufficiency in the Liaohe Estuary. Acta Ecol. Sin. 41, 1645–1655. doi: 10.5846/stxb202001230169
Terlizzi A., Anderson M. J., Bevilacqua S., Fraschetti S., Wlodarska-Kowalczuk M., Ellingsen K. E. (2009). Beta diversity and taxonomic sufficiency: Do higher-level taxa reflect heterogeneity in species composition? Diversity Distributions. 15, 450–458. doi: 10.1111/j.1472-4642.2008.00551.x
Terlizzi A., Bevilacqua S., Fraschetti S., Boero F. (2003). Taxonomic sufficiency and the increasing insufficiency of taxonomic expertise. Mar. Pollut. Bull. 46, 556–561. doi: 10.1016/S0025-326X(03)00066-3
Vijapure T., Sukumaran S. (2019). Optimization of the taxonomic resolution of an indicator taxon for cost-effective ecological monitoring: Perspectives from a heterogeneous tropical coastline. J. Environ. Manage. 247, 474–483. doi: 10.1016/j.jenvman.2019.05.154
Wang R. (1986). Correction of the formula to convert fluorescence measurement to phaeophorbide a concentration in acidification method. Mar. Sci. 10, 1–5.
Wang L., Fan Y., Yan C. J., Gao C. Z., Xu Z. D., Liu X. S. (2017). Assessing benthic ecological impacts of bottom aquaculture using macrofaunal assemblages. Mar. Pollut. Bull. 114, 258–268. doi: 10.1016/j.marpolbul.2016.09.032
Warwick R. M. (1988). The level of taxonomic discrimination required to detect pollution effects on marine benthic communities. Mar. Pollut. Bull. 19, 259–268. doi: 10.1016/0025-326X(88)90596-6
Wu D. H., Xu Z. A., Wang B. X., Zhang Y., Li Y. Q., Shen Y. F. (2012). Effects of macroinvertebrate taxonomic resolution on water ecological assessment. Res. Environ. Sci. 25, 24–29. doi: 10.13198/j.res.2012.01.27.wudh.009
Xiong W., Yang Y. Z., Zhan A. (2018). Reliability of simplifying strategies for rapid biodiversity assessment in studying community-environment interactions. Ecol. Indic. 85, 861–868. doi: 10.1016/j.ecolind.2017.11.050
Xu Y., Li X. Z., Wang H. F., Zhang B. L., Shuai L. M. (2016). Characteristics of a macrozoobenthic community in the sea adjacent to the Yangtze River Estuary during the wet season. Biodivers. Sci. 24, 811–819. doi: 10.17520/biods.2016039
Yang X. J., Cui W. Y., Zhang M. S., Chen C., Yu Z. S. (2021). Preliminary study on the ecology of macrobenthos in Jiaozhou Bay. Adv. Mar. Sci. 39, 89–101. doi: 10.3969/j.issn.1671-6647.2021.01.009
Keywords: taxonomic sufficiency, macrofauna, biotic index, benthic ecological quality assessment, semi-enclosed bay
Citation: Liu J, Xu Z and Liu X (2023) Applicability of taxonomic sufficiency of macrofaunal assemblages in benthic ecological quality assessments: Insights from a semi-enclosed bay. Front. Mar. Sci. 10:1130696. doi: 10.3389/fmars.2023.1130696
Received: 23 December 2022; Accepted: 09 February 2023;
Published: 22 February 2023.
Edited by:
Xiaoshan Zhu, Hainan University, ChinaReviewed by:
Shengyan Tian, Tianjin University of Science and Technology, ChinaCopyright © 2023 Liu, Xu and Liu. This is an open-access article distributed under the terms of the Creative Commons Attribution License (CC BY). The use, distribution or reproduction in other forums is permitted, provided the original author(s) and the copyright owner(s) are credited and that the original publication in this journal is cited, in accordance with accepted academic practice. No use, distribution or reproduction is permitted which does not comply with these terms.
*Correspondence: Xiaoshou Liu, bGl1eHNAb3VjLmVkdS5jbg==
Disclaimer: All claims expressed in this article are solely those of the authors and do not necessarily represent those of their affiliated organizations, or those of the publisher, the editors and the reviewers. Any product that may be evaluated in this article or claim that may be made by its manufacturer is not guaranteed or endorsed by the publisher.
Research integrity at Frontiers
Learn more about the work of our research integrity team to safeguard the quality of each article we publish.