 David Alejandro González-Rivas
 Felipe Omar Tapia-Silva
95% of researchers rate our articles as excellent or good
Learn more about the work of our research integrity team to safeguard the quality of each article we publish.
Find out more
BRIEF RESEARCH REPORT article
Front. Mar. Sci. , 23 February 2023
Sec. Marine Fisheries, Aquaculture and Living Resources
Volume 10 - 2023 | https://doi.org/10.3389/fmars.2023.1130125
Shrimp farms are within the main aquaculture activities and In the last 30 years, shrimp farms have expanded along the Gulf of California. Because the shrimp farm’s production is related to the pond area and the extended location of shrimp farms, we employed a multi-disciplinary approach to study the process of annual shrimp farm expansion, in addition to predicting shrimp production in the short term. Our study hypothesizes that semi-intensive shrimp farm production is dependent on the pond area which can be accurately quantified by using remote sensing image classification combined with the historical production data of shrimp aquaculture. We could calculate the long-term expansion of the total pond area and forecast the total annual shrimp production in the short-term. Our results highlight the development over the last 28 years. The total surface area of the shrimp ponds grew by more than 1100%. The linear regression model between the shrimp farms area, calculated using remote sensing, and statistical data on shrimp production, was strongly positive and significant (r2 = 0.874, p =2.209e-11). Likewise, the linear regression model for the total pond area as a function of time resulted strong positive and statistically significant (r2 = 0.936, p =2.917e-15). We demonstrated that the shrimp production could be assessed based on the total pond area by year, obtained by remote sensing. We estimated the past long-term shrimp farm expansion in the study zone using remote sensing data. This methodology is valuable for monitoring food security, aquaculture management decisions, and coastal ecology.
The rapid growth of shrimp farms in northwest Mexico and other countries, such as China, India, Indonesia, and Vietnam, is being driven by the increasing demand for fish and seafood proteins worldwide (FAO, 2020; Naylor et al., 2021). Along this exponential growth, there has been a transformation of different ecosystems into shrimp ponds. These changes in land use have attracted research interest on the environmental and social impacts of shrimp farms in these areas, as well as methods to promote better development of this industry (Martinez-Porchas and Martinez-Cordova, 2012; Martínez-Durazo et al., 2019; Sampantamit et al., 2020).
Shrimp production is well known for its economic value, and currently, Mexico ranks seventh in terms of Crustacea aquaculture (FAO, 2020; FAO, 2022). In 2020, this activity represented a revenue of nearly 676 US million dollars for the Mexican states of Sonora and Sinaloa (CONAPESCA, 2020), which are located northwest of the Gulf of California. Accelerated development of shrimp farms has occurred in the area near the coastal zone of the Gulf. In the last 30 years, farms have constantly developed in these two states, where most aquaculture ponds are located (Castellanos-Tapia et al., 2022). In 2020, shrimp production in these states represented almost 88% of the total shrimp production in Mexico (CONAPESCA, 2020). It is within this theme that we searched how aquaculture and remote sensing data could be made and used for a better understanding of food security, management decisions, and sustainability of the coastal areas.
Shrimp farms are located along different ecosystems including coastal lagoons, mangrove forests, agricultural systems, and even shrub and desert ecosystems; moreover, some shrimp ponds are no longer in use. The lagoon, rivers, canals, and temporary water bodies make it challenging to model land use and assess the total area occupied by shrimp farms along the coastal zone during a certain period (Duan et al., 2020a; Duan et al., 2020b).
In recent years, remote sensing data such as Landsat images have been used to map aquaculture ponds in China (Duan et al., 2020a) and Mexico to study the effects of shrimp pond expansion (Scheuering, 2021; Castellanos-Tapia et al., 2022). In this context, Scheuering (2021) noted that, in 2020, there were approximately 122 000 ha of shrimp ponds in the Gulf of California.
New tools and platforms are available to identify changes in land use and conduct large-scale studies. One of these geospatial analysis platforms is the Google Earth Engine (GEE) (Gorelick et al., 2017), which integrates data from different sensor collections such as Sentinel or Landsat, and can be used with other images through classification methods such as random forest classification (RFC), support vector machine, or naive Bayes (Shelestov et al., 2017; Pimple et al., 2018; Duan et al., 2020a). This platform allows for an improved and highly precise analysis that can improve estimations of shrimp farm area and production, as demonstrated in the present study.
We hypothesized that semi-intensive shrimp farm production is dependent on the pond area; besides, it is possible to calculate the long-term expansion of the total pond area and to forecast the total annual shrimp production in the short-term, by using remote sensing image classification combined with the historical production data of shrimp aquaculture.
For testing this hypothesis, we used a 29-year (from 1993 to 2021) time series of Landsat (5 and 8) and classified this data to detect the long-term annual shrimp pond expansion. Moreover, the multi-disciplinary approach we developed, aimed to generate a model that predicts, in the short-term (e.g., for the next 5 years), the total annual production of shrimp farms along the Gulf of California and their future area of growth, using the remote sensing–detected annual pond area and statistical data on shrimp production.
We collected remote sensing images from the Landsat catalog of the U.S. Geological Survey (USGS) by using the GEE platform (Gorelick et al., 2017). From 1993 to 2010, the images corresponded to the Landsat 5 surface reflectance Tier 1 (T1_SR). We corrected atmospherically the images using the LEDAPS. To improve the classification, we applied masks for cloud, shadow, water, and snow. From 2013 to 2021, we used images from the Landsat 8 surface reflectance Tier 1 (T1_SR) and we corrected them atmospherically using the LaSRC (Gorelick et al., 2017).
To assess the land cover of shrimp ponds per year, image classification must be performed for the period in which the farms are operational. Therefore, we used the average reflectance of the images from May to September, depending on the year based on cloud cover. We could not obtain the area of the shrimp ponds owing to cloud cover for 2002, 2003, 2010, and 2011. We used the RFC method (Breiman, 1999) included in the supervised classification algorithms package in GEE.
We categorized each supervised classification as shrimp pond, soil, and vegetation. Before the RFC, we generated another mask that filtered all the coastal lagoons and permanent and seasonal water bodies unrelated to shrimp ponds in the region of interest. The mask had a maximum width of 5 km from the sea to the land mass, and the land classification area had an average of 1 482 936 ha.
For the accuracy assessment (validation of RFC classification results and area calculation), we used the methodology proposed by as Ref. (2014) as explained in as Ref. (2020a).
We obtained shrimp production data from the Aquaculture and Fisheries Statistical Yearbook (CONAPESCA, 1993–2020) (CONAPESCA, 1993; CONAPESCA, 1994; CONAPESCA, 1995; CONAPESCA, 1996; CONAPESCA, 1997; CONAPESCA, 1998; CONAPESCA, 1999; CONAPESCA, 2000; CONAPESCA, 2001; CONAPESCA, 2002; CONAPESCA, 2003; CONAPESCA, 2004; CONAPESCA, 2005; CONAPESCA, 2006; CONAPESCA, 2007; CONAPESCA, 2008; CONAPESCA, 2009; CONAPESCA, 2010; CONAPESCA, 2011; CONAPESCA, 2012; CONAPESCA, 2013; CONAPESCA, 2014; CONAPESCA, 2015; CONAPESCA, 2016; CONAPESCA, 2017; CONAPESCA, 2018; CONAPESCA, 2019; CONAPESCA, 2020) for each sampling year. Finally, we used the statistical program R studio v. 4.0.3(Wickham, 2016) to analyze and plot the linear regression between the total area obtained and the entire shrimp produced.
We included in the Figure A of support material a methodology flowchart to better comprehend this methodology.
Based on image analysis and the validation procedure (Olofsson et al., 2014), we obtained the shrimp pond area per year and the estimated error for each year (Data sheet 1). The estimated errors corresponding to the 95% confidence interval were generally lower than 4%. The years with the highest estimated errors were 2005 (22.1%), 2013 (14.95%), and 2015 (12.51%).
The annual area we obtained through image classification and the total shrimp production are shown in Figure 1. These results highlight the massive development over the last 28 years. In 1993, we assessed 8367 ha of active shrimp farms in this region, whereas in 2021, our results showed that the total active area of shrimp farms was more than 114 000 ha. This means that during this period, the total area of shrimp farms grew by more than 1100%.
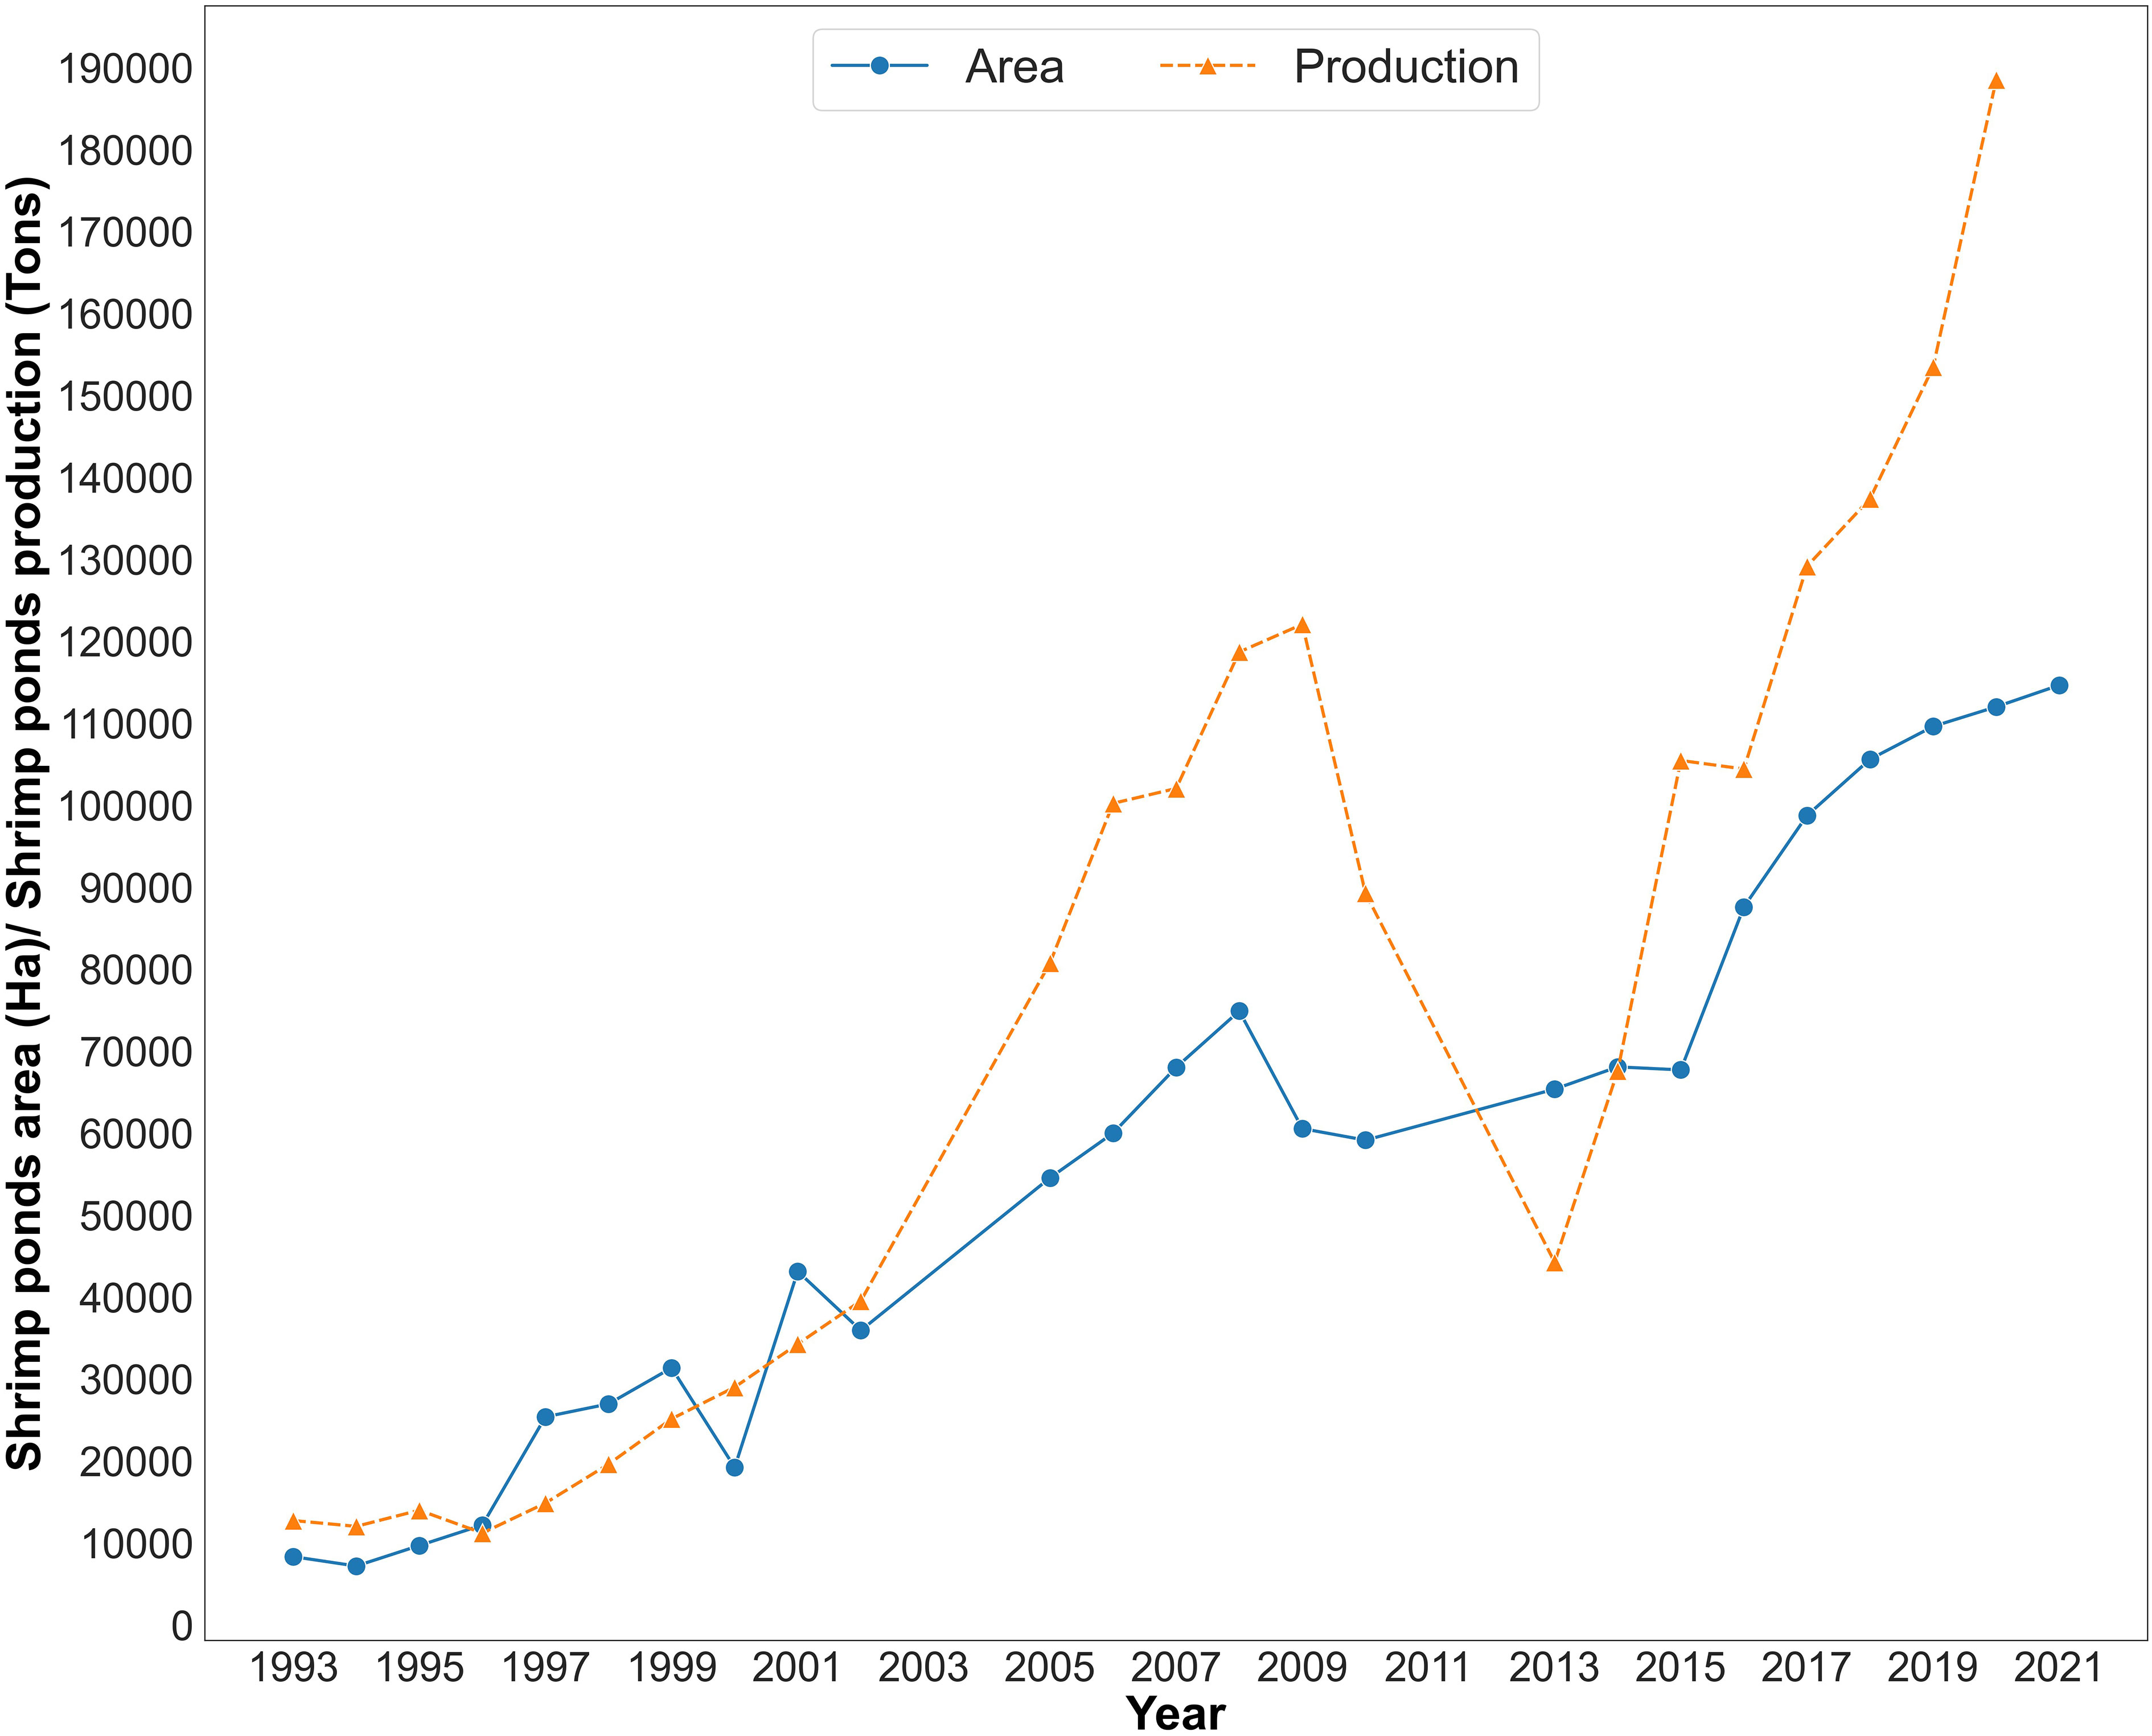
Figure 1 Total estimated area of shrimp ponds (ha, blue line) based on remote sensing and shrimp production (tons, dotted orange line) from 1993 to 2021, for the east part of the Gulf of California corresponding to the Mexican states of Sinaloa and Sonora.
Figure 2 shows the location of shrimp ponds at 5-year intervals from 1993 to 2021.
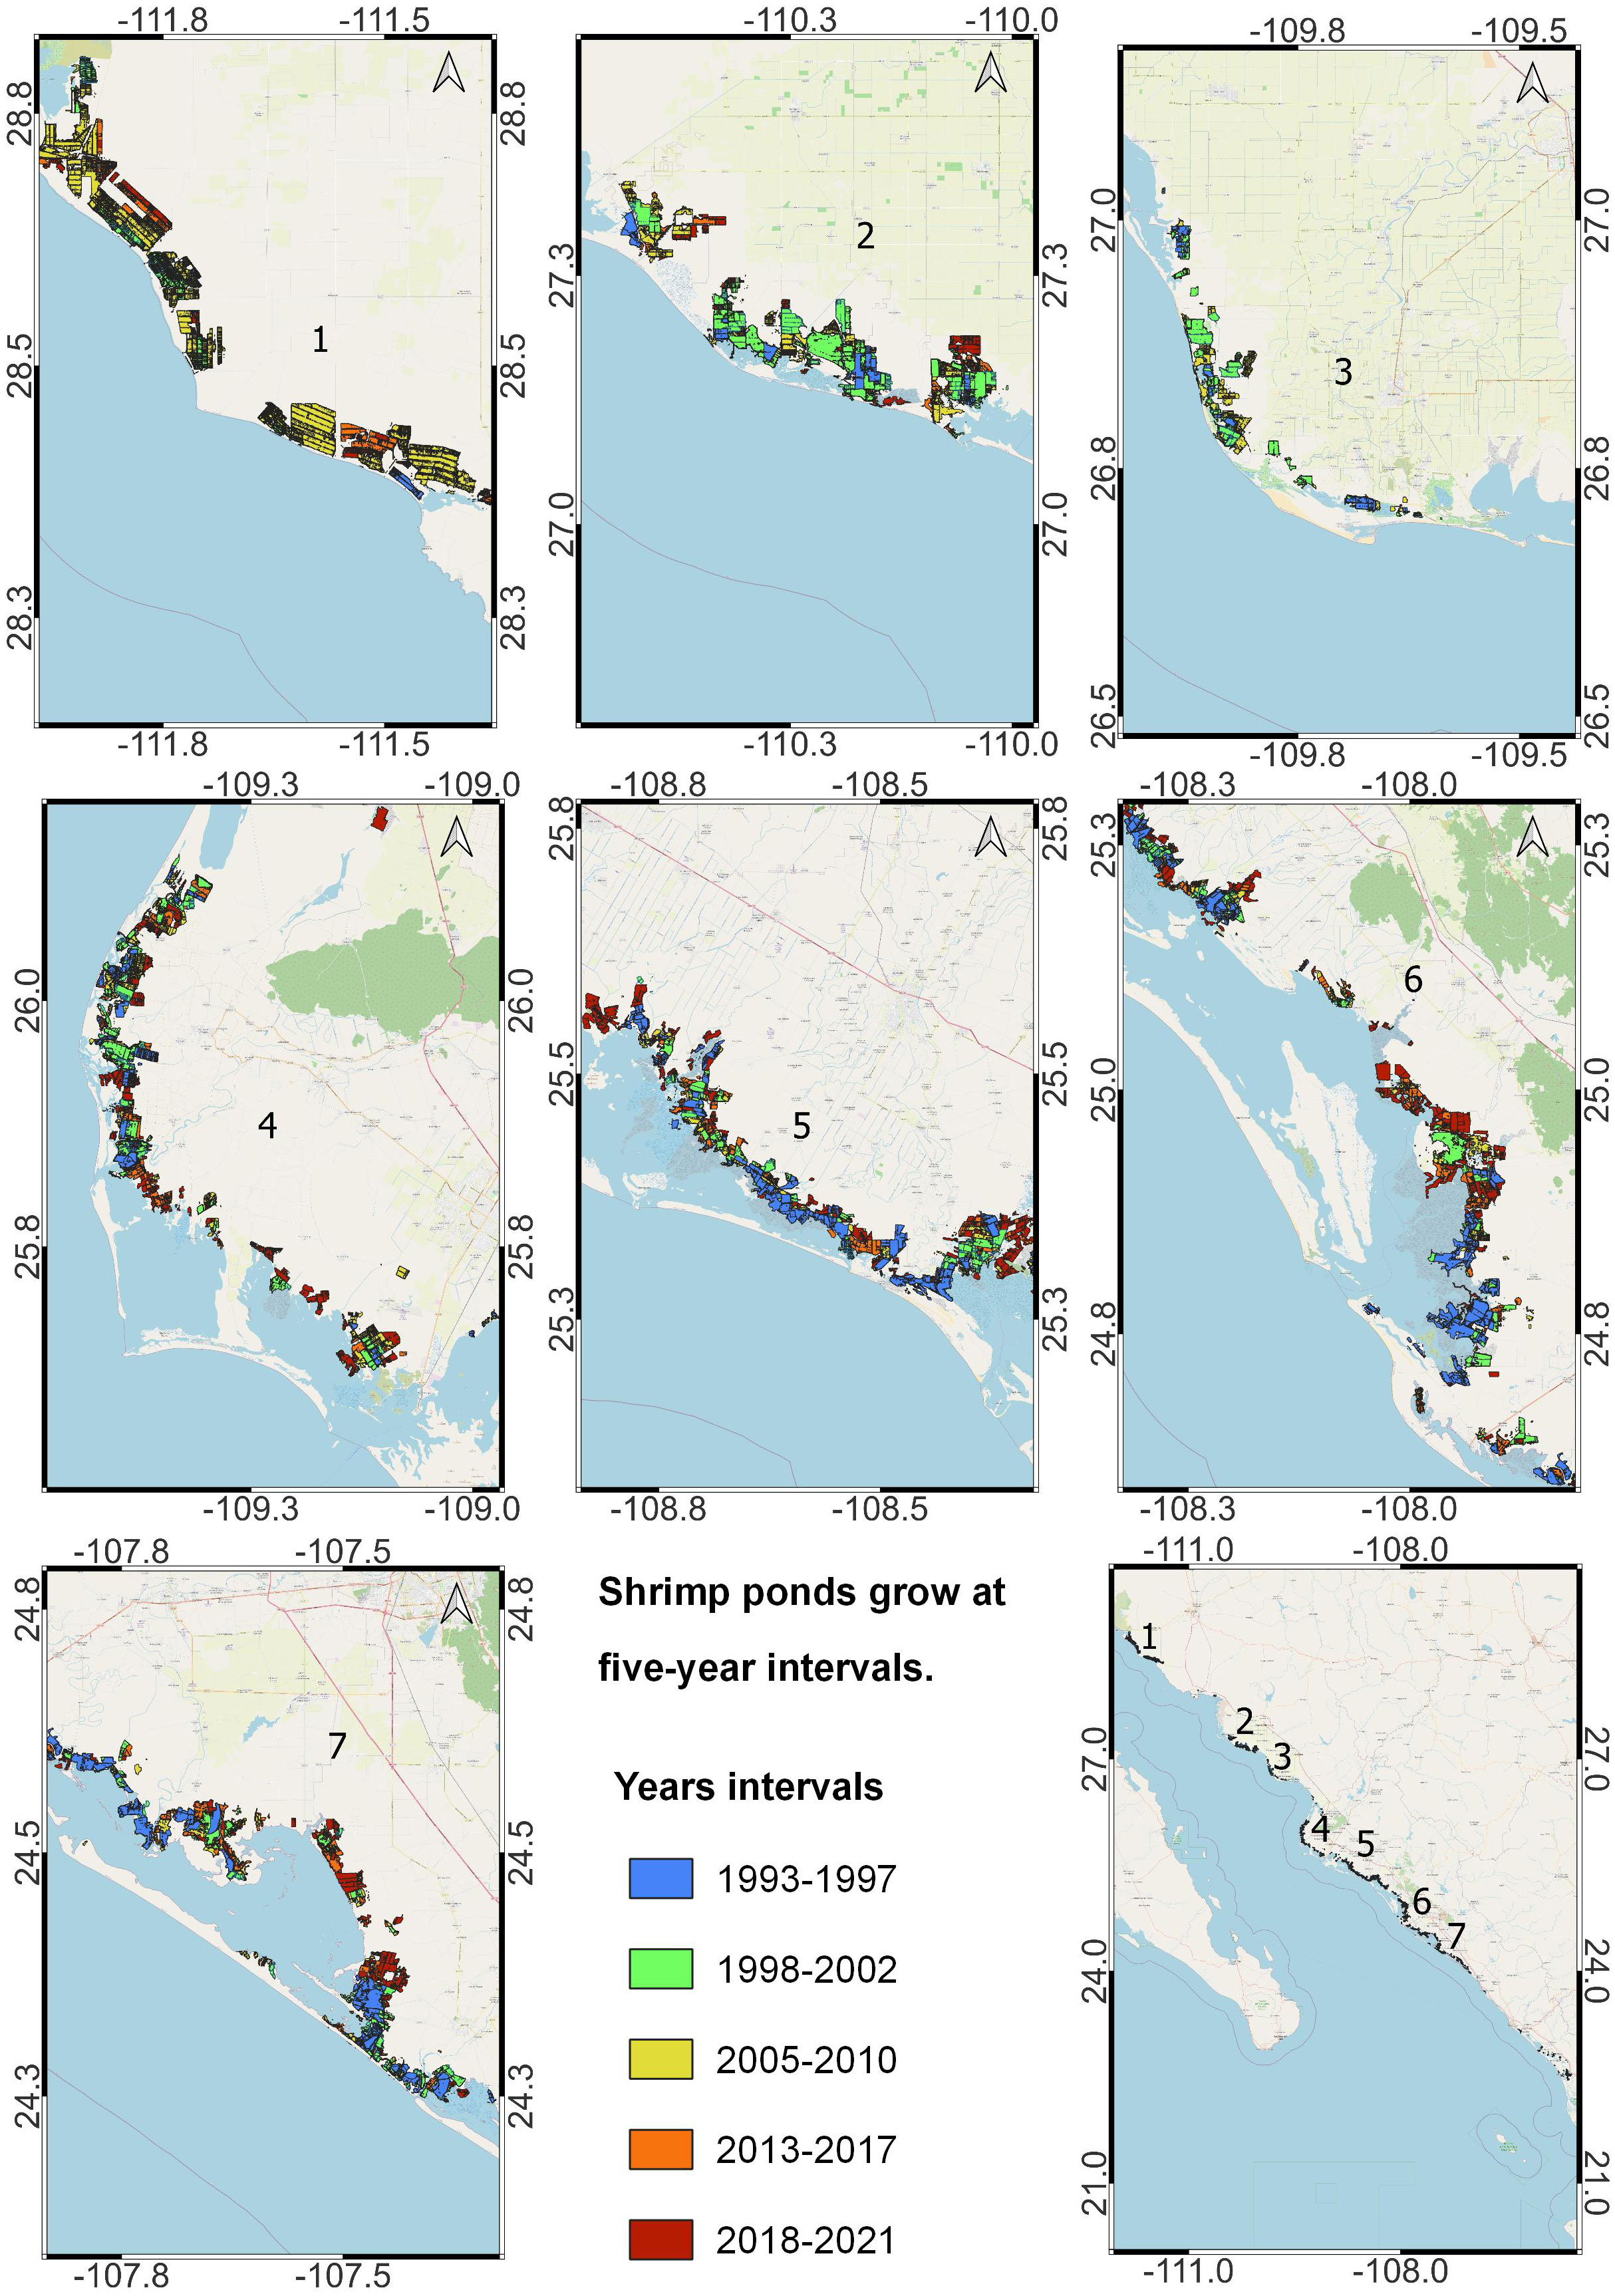
Figure 2 Shrimp ponds detected from 1993 to 2021 using remote sensing. Owing to the extended area occupied and for an improved observation of growth, the data were grouped by five-year periods.
The linear regression model of the total area calculated using remote sensing and statistical data on shrimp production, shown in Figure 3, was strongly positive and highly significant (r2 = 0.874, p = 2.209e-11). The linear regression model for the total pond area as a function of time (in years) (Figure 3) was also linear, strongly positive, and highly significant (r2 = 0.936, p = 2.917e-15). Using this model, we predicted the expansion of shrimp ponds and their corresponding production in the short term (the next 5 years). Table 1 presents the results.
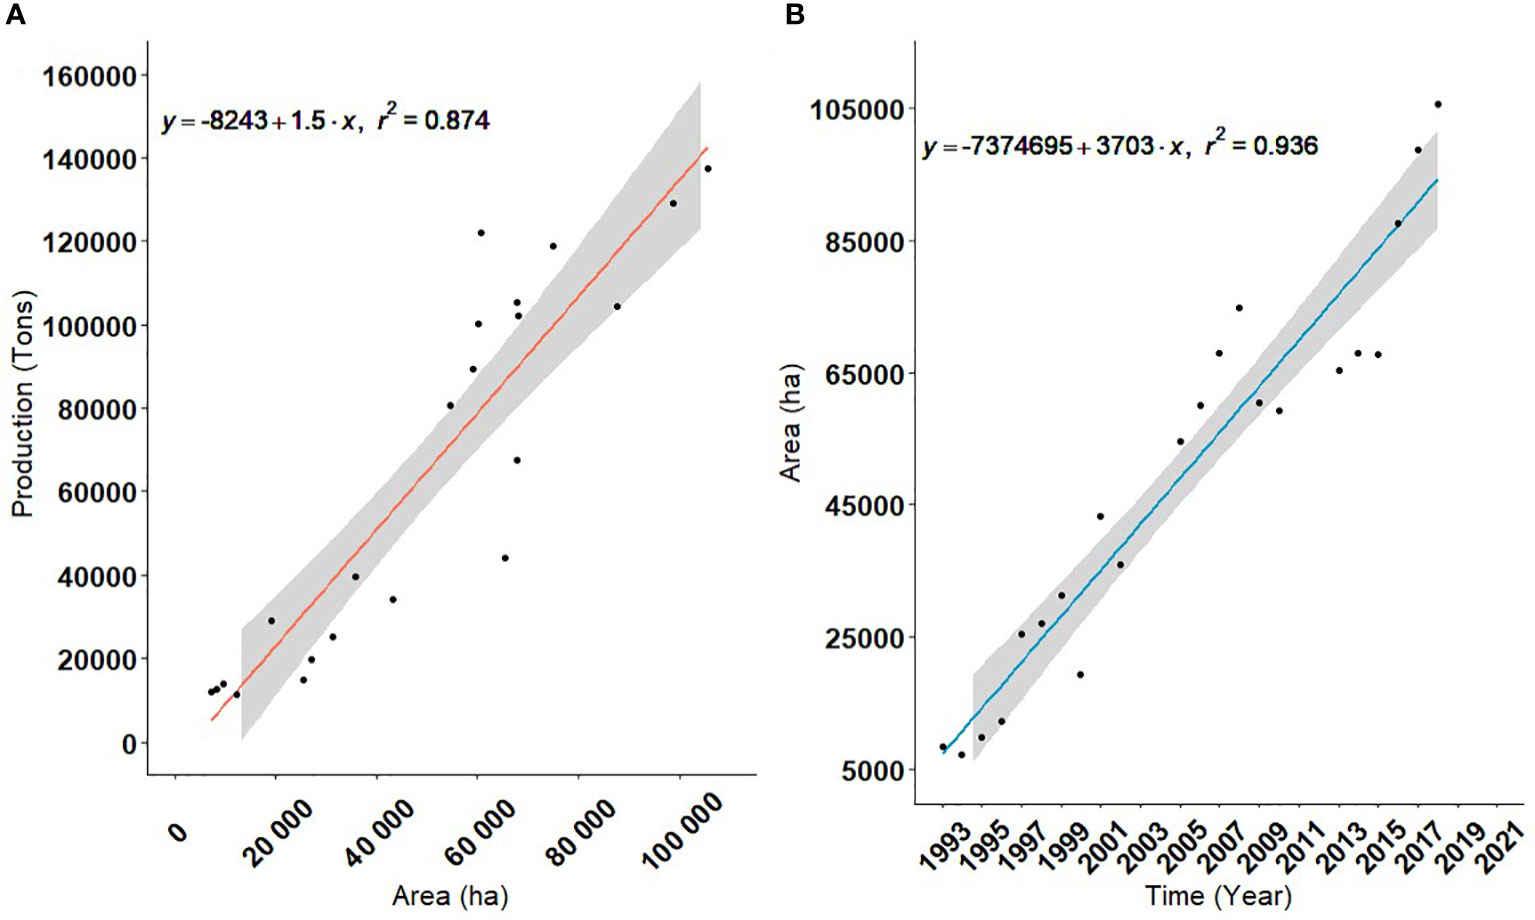
Figure 3 Relationship between the total shrimp pond area estimated using remote sensing (ha/year) and (A) the corresponding production (ton/year) and (B) time (years).
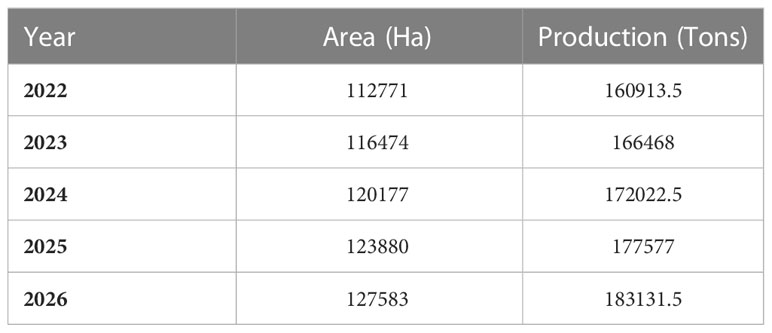
Table 1 Predicted shrimp pond area and production for the short-term.
We used Landsat 5 and 8 remote sensing images because the purpose of the present study was to estimate the total area of shrimp ponds from 1993 to 2021. As mentioned, these two sensors have also been successfully used for large-scale mapping of aquaculture ponds in China (Duan et al., 2020a) and Mexico to study the ecological effects of shrimp pond expansions in the states of Sonora and Sinaloa (Scheuering, 2021; Castellanos-Tapia et al., 2022). Although Scheuering (2021) did not specify how he obtained a total of 122 000 ha of shrimp ponds for 2020 in the Gulf of California, this information is consistent with our estimated value of 112 047 ha for 2020 using remote sensing for the states of Sinaloa and Sonora.
It is worth noting that before area determination by remote sensing, we filtered each image classification to exclude most of the water bodies (coastal lagoons), which generally resulted in a small error in the accuracy assessment for most of the shrimp ponds in the region, as shown in Data sheet 1. The years with the highest estimated errors were 2005 (22.1%), 2013 (14.95%), and 2015 (12.51%). These high estimated errors can be attributed to the similar spectral characteristics of shrimp ponds and natural water bodies. Another factor causing this error is that some small and shallow water bodies were not properly masked before the validation method.
Although the methodology described in this study was adequate for most of years, we could not estimate the total pond area for 2002, 2003, 2010, and 2011 owing to cloud cover. For cloudy conditions, an approach similar to that implemented by other studies such as (Stiller et al., 2019; Sun et al., 2020; Ottinger et al., 2022) is advisable. In these studies, radar images from the Sentinel 1 sensor were used to demonstrate the viability of radar to identify shrimp ponds in regions where cloud cover is a constant challenge, as in parts of Asia such as Vietnam or some regions of China. Another similar study (López-Caloca et al., 2020) also used Sentinel 1 radar data to study water bodies under constant cloud cover in areas located in the south of Mexico. Although the use of radar has been demonstrated to be a powerful method for studying aquaculture ponds, for our study, using the open access Sentinel 1 images was not possible because data for this sensor is available only from 2014 to date. Therefore, considering monetary limitations, we chose to use optical remote sensing images from the Landsat sensor because it allowed us to cover an extended period compared to that with the other sensors. However, we believe that the available data for the remaining 25 years were sufficient to determine the expansion of the shrimp ponds in the present study.
The analysis showed an accelerated increase in shrimp farms in the coastal zone. The area under aquaculture grew more than 1100% in 28 years, and more than 114 683 ha of the different ecosystems were converted into shrimp ponds by 2021. Previous studies have shown the ecological problems associated with this expansion in parts of the Gulf of California. Using remote sensing tools, Scheuering (2021) studied how this economic activity impacts waterbird migration. Castellanos-Tapia et al. (2022) described how this expansion contributed to the loss of salt marsh areas in Sinaloa.
Consistent with this background, our results showed that the growth in area was almost linear for the Sinaloa and Sonora shrimp farms. It should be noted that the development of shrimp farms has different ecological implications, and this data and methodology can help to understand some of the ecological pressure for the divers ecosystems in the region, such as land use change, nitrogen and organic matter inputs, pathogen contamination, or even heavy metal pollution (Páez-Osuna and Ruiz-Fernández, 2005; Martínez-Durazo et al., 2019; Jara-Marini et al., 2020). With the methodology we introduced in this study and the results reported by (Arreola-Lizárraga et al., 2016; Páez-Osuna et al., 2017; González-Rivas et al., 2020), studying and estimating the entry of diverse compounds, such as heavy metals or nutrients that can impact the neighboring ecosystems, into the Gulf of California coastal zone is possible.
Although the relationship between area and production in shrimp farms is well established (Páez-Osuna et al., 2003; Miranda et al., 2009), most studies refer to shrimp ponds being managed as semi-intensive ponds (Páez-Osuna et al., 2003; Ponce-Palafox et al., 2011; Cortés et al., 2021). In our case, we compared shrimp production with the annual pond area detected by remote sensing, and the results showed that shrimp pond production averaged 1.28 tons/ha, which is within the range of semi-intensive model shrimp pond production systems, which is the most common management system of shrimp aquaculture in the region (Estrada-Pérez et al., 2015; Hernandez-Llamas et al., 2016).
Regarding the statistical analysis shown in Figure 3A, the value of r2 = 0.887 for the dependence model showed a strong relationship between shrimp production and area estimated by remote sensing. This r2 value, as well as the estimation error in Data sheet 1, verify the area obtained using the RFC in the GEE platform. We demonstrated that observing long-term changes occurring in shrimp production and pond area as well as, to predict these in the short-term is possible for the Gulf of California using remote sensing images and powerful platforms such as GEE to download and process geospatial data.
The shrimp pond area has continued to grow during the last three years of our study (2019–2021), but at a rate lower than that in the early 1990s or 2000s. As shown in Figure 1, the data indicate that for the northeast of the Gulf of California, shrimp ponds will probably continue expanding over the next decade. Therefore, we generated a prediction of shrimp pond area for the next 5 years using a linear regression model (the results are shown in Table 1). As shown in Figure 3B and Table 1 although the growth in pond area is evident. When we analyzed the aquaculture expansion prediction (Table 1), we observed that the prediction has a growth rate near the 3.5% for 2022 and a decrease to 3% for 2026. We believe that this growth value will depend on multiple factors such as the availability of land, cost, restructuring of existing ponds, etc.
On the other hand the decrease in production during the 2000s (shown in Figure 1) was caused by pathogens such as Vibrio and white-spot virus (Anaya-Rosas, 2005; Soto-Rodriguez Sonia et al., 2015). These infections resulted in the emptying or drying of shrimp ponds during the harvest season, especially for the years 2000, 2002, 2009, 2010, and 2013. We believe that these dry ponds generated noise or bias in the regression models. Finally, these models we obtained to estimate pond area and production assume that the aquaculture farms in this part of Mexico mainly operate as semi-intensive production systems and that no major disaster or event will occur that would affect and significantly decrease their production.
We demonstrated that it is possible to determine, in the long term, the areal expansion of semi-intensive shrimp farms located in the Gulf of California based on satellite image classification using geospatial processing platforms such as GEE. We determined that the growth in area of shrimp ponds was almost linear for the Mexican states of Sinaloa and Sonora. We assessed 8367 ha of active shrimp farms in 1993, whereas in 2021, this rose to 114 000 ha. This implies that the total area of shrimp farms has grown by more than 1100% from 1993 to 2021. This expansion means an increasing economic value of production, along with an accelerated reduction in the area under ecosystems such as coastal lagoons, mangrove forests, agricultural systems, or even shrub and desert, as well as an increasing input of contaminants to the surrounding ecosystems.
We obtained a prediction model that could be used in the short term to track shrimp production in the study region. We believe that this methodology can also be easily applied in other parts of the world and can be implemented using various remote sensors such as the sentinel family, Landsat, or even sensors with higher resolution. We are convinced that this is valuable information for coastal aquaculture policymakers and can be applied to the monitoring of food security, aquaculture management decisions, and coastal ecology.
Finally, we would like to highlight four points related to the results of the manuscript 1) This study demonstrated that is possible to forecast shrimp farm production by using remote sensing data, 2) The prediction model could be used in the short term to track shrimp production in the study region, 3) This study can be replicated in different parts of the world and thus have a greater certainty of aquaculture production in places where the data is not available or is discontinued and 4) The data obtained by this methodology can have multiple uses from management decisions to ecological purposes.
The raw data supporting the conclusions of this article will be made available by the authors, without undue reservation.
DG-R: Conceptualization, methodology, software, validation, formal analysis, investigation, data curation. FT-S: Supervision, conceptualization, methodology, software, validation, formal analysis, investigation. Both authors contributed to the article and approved the submitted version.
This research was possible thanks to the CONACYT Postdoctoral scholarship num. 419362.
We acknowledge CONACYT for the Postdoctoral scholarship num. 419362, the UAM-I postgraduate program of “Energía y Medio Ambiente”, we would like to thank Editage (www.editage.com) for the English language editing. The authors appreciate the United States Geological Survey (USGS) and Google Earth Engine (GEE) for providing the satellite data used in this study, as well as two reviewers Edison Barbieri and Brenda Karen González Pérez together with the associate editor S.S.S. Sarma for all their time an effort devoted to improving earlier versions of our manuscript.
The authors declare that the research was conducted in the absence of any commercial or financial relationships that could be construed as a potential conflict of interest.
All claims expressed in this article are solely those of the authors and do not necessarily represent those of their affiliated organizations, or those of the publisher, the editors and the reviewers. Any product that may be evaluated in this article, or claim that may be made by its manufacturer, is not guaranteed or endorsed by the publisher.
The Supplementary Material for this article can be found online at: https://www.frontiersin.org/articles/10.3389/fmars.2023.1130125/full#supplementary-material
Anaya-Rosas R.-E. (2005). Cultivo de camarón blanco, Litopenaeus vannamei, Boone (1931), en sistema cerrado a alta densidad.
Arreola-Lizárraga J. A., Padilla-Arredondo G., Medina-Galván J., Méndez-Rodríguez L., Mendoza-Salgado R., Cordoba-Matson M. V. (2016). Analysis of hydrobiological responses to anthropogenic and natural influences in a lagoon system in the gulf of California. Oceanological Hydrobiological Stud. 45, 112–120. doi: 10.1515/ohs-2016-0011
Castellanos-Tapia F., Fernández G., Ruiz-Luna A., Cervantes-Escobar A., Berlanga-Robles C. (2022). Landscape changes in a critical subtropical coastal wetland in northwestern Mexico: Is shrimp farming a driver of concern? PREPRINT (Version 1). doi: 10.21203/rs.3.rs-1777673/v1
CONAPESCA (1993). Anuario estadístico de acuacultura y pesca (Comisión Nacional de Acuacultura y Pesca). Available at: https://www.gob.mx/conapesca/documentos/anuario-estadistico-de-acuacultura-y-pesca.
CONAPESCA (1994). Anuario estadístico de acuacultura y pesca (Comisión Nacional de Acuacultura y Pesca). Available at: https://www.gob.mx/conapesca/documentos/anuario-estadistico-de-acuacultura-y-pesca.
CONAPESCA (1995). Anuario estadístico de acuacultura y pesca (Comisión Nacional de Acuacultura y Pesca). Available at: https://www.gob.mx/conapesca/documentos/anuario-estadistico-de-acuacultura-y-pesca.
CONAPESCA (1996). Anuario estadístico de acuacultura y pesca (Comisión Nacional de Acuacultura y Pesca). Available at: https://www.gob.mx/conapesca/documentos/anuario-estadistico-de-acuacultura-y-pesca.
CONAPESCA (1997). Anuario estadístico de acuacultura y pesca (Comisión Nacional de Acuacultura y Pesca). Available at: https://www.gob.mx/conapesca/documentos/anuario-estadistico-de-acuacultura-y-pesca.
CONAPESCA (1998). Anuario estadístico de acuacultura y pesca (Comisión Nacional de Acuacultura y Pesca). Available at: https://www.gob.mx/conapesca/documentos/anuario-estadistico-de-acuacultura-y-pesca.
CONAPESCA (1999). Anuario estadístico de acuacultura y pesca (Comisión Nacional de Acuacultura y Pesca). Available at: https://www.gob.mx/conapesca/documentos/anuario-estadistico-de-acuacultura-y-pesca.
CONAPESCA (2000). Anuario estadístico de acuacultura y pesca (Comisión Nacional de Acuacultura y Pesca). Available at: https://www.gob.mx/conapesca/documentos/anuario-estadistico-de-acuacultura-y-pesca.
CONAPESCA (2001). Anuario estadístico de acuacultura y pesca (Comisión Nacional de Acuacultura y Pesca). Available at: https://www.gob.mx/conapesca/documentos/anuario-estadistico-de-acuacultura-y-pesca.
CONAPESCA (2002). Anuario estadístico de acuacultura y pesca (Comisión Nacional de Acuacultura y Pesca). Available at: https://www.gob.mx/conapesca/documentos/anuario-estadistico-de-acuacultura-y-pesca.
CONAPESCA (2003). Anuario estadístico de acuacultura y pesca (Comisión Nacional de Acuacultura y Pesca). Available at: https://www.gob.mx/conapesca/documentos/anuario-estadistico-de-acuacultura-y-pesca.
CONAPESCA (2004). Anuario estadístico de acuacultura y pesca (Comisión Nacional de Acuacultura y Pesca). Available at: https://www.gob.mx/conapesca/documentos/anuario-estadistico-de-acuacultura-y-pesca.
CONAPESCA (2005). Base de datos de producción anuarios (Comisión Nacional de Acuacultura y Pesca). Available at: https://www.gob.mx/conapesca/documentos/anuario-estadistico-de-acuacultura-y-pesca.
CONAPESCA (2006). Base de datos de producción anuarios (Comisión Nacional de Acuacultura y Pesca). Available at: https://www.gob.mx/conapesca/documentos/anuario-estadistico-de-acuacultura-y-pesca.
CONAPESCA (2007). Base de datos de producción anuarios (Comisión Nacional de Acuacultura y Pesca). Available at: https://www.gob.mx/conapesca/documentos/anuario-estadistico-de-acuacultura-y-pesca.
CONAPESCA (2008). Base de datos de producción anuarios (Comisión Nacional de Acuacultura y Pesca). Available at: https://www.gob.mx/conapesca/documentos/anuario-estadistico-de-acuacultura-y-pesca.
CONAPESCA (2009). Base de datos de producción anuarios (Comisión Nacional de Acuacultura y Pesca). Available at: https://www.gob.mx/conapesca/documentos/anuario-estadistico-de-acuacultura-y-pesca.
CONAPESCA (2010). Base de datos de producción anuarios (Comisión Nacional de Acuacultura y Pesca). Available at: https://www.gob.mx/conapesca/documentos/anuario-estadistico-de-acuacultura-y-pesca.
CONAPESCA (2011). Base de datos de producción anuarios (Comisión Nacional de Acuacultura y Pesca). Available at: https://www.gob.mx/conapesca/documentos/anuario-estadistico-de-acuacultura-y-pesca.
CONAPESCA (2012). Base de datos de producción anuarios (Comisión Nacional de Acuacultura y Pesca). Available at: https://www.gob.mx/conapesca/documentos/anuario-estadistico-de-acuacultura-y-pesca.
CONAPESCA (2013). Base de datos de producción anuarios (Comisión Nacional de Acuacultura y Pesca). Available at: https://www.gob.mx/conapesca/documentos/anuario-estadistico-de-acuacultura-y-pesca.
CONAPESCA (2014). Base de datos de producción anuarios (Comisión Nacional de Acuacultura y Pesca). Available at: https://www.gob.mx/conapesca/documentos/anuario-estadistico-de-acuacultura-y-pesca.
CONAPESCA (2015). Base de datos de producción anuarios (Comisión Nacional de Acuacultura y Pesca). Available at: https://www.gob.mx/conapesca/documentos/anuario-estadistico-de-acuacultura-y-pesca.
CONAPESCA (2016). Base de datos de producción anuarios (Comisión Nacional de Acuacultura y Pesca). Available at: https://www.gob.mx/conapesca/documentos/anuario-estadistico-de-acuacultura-y-pesca.
CONAPESCA (2017). Base de datos de producción anuarios (Comisión Nacional de Acuacultura y Pesca). Available at: https://www.gob.mx/conapesca/documentos/anuario-estadistico-de-acuacultura-y-pesca.
CONAPESCA (2018). Base de datos de producción anuarios (Comisión Nacional de Acuacultura y Pesca). Available at: https://www.gob.mx/conapesca/documentos/anuario-estadistico-de-acuacultura-y-pesca.
CONAPESCA (2019). Base de datos de producción anuarios (Comisión Nacional de Acuacultura y Pesca). Available at: https://www.gob.mx/conapesca/documentos/anuario-estadistico-de-acuacultura-y-pesca.
CONAPESCA (2020). Base de datos de producción anuarios (Comisión Nacional de Acuacultura y Pesca). Available at: https://www.gob.mx/conapesca/documentos/anuario-estadistico-de-acuacultura-y-pesca.
Cortés A., Casillas-Hernández R., Cambeses-Franco C., Bórquez-López R., Magallón-Barajas F., Quadros-Seiffert W., et al. (2021). Eco-efficiency assessment of shrimp aquaculture production in Mexico. Aquaculture 544, 737145. doi: 10.1016/j.aquaculture.2021.737145
Duan Y., Li X., Zhang L., Chen D., Liu S., Ji H. (2020a). Mapping national-scale aquaculture ponds based on the Google earth engine in the Chinese coastal zone. Aquaculture 520, 734666. doi: 10.1016/j.aquaculture.2019.734666
Duan Y., Li X., Zhang L., Liu W., Liu S., Chen D., et al. (2020b). Detecting spatiotemporal changes of large-scale aquaculture ponds regions over 1988–2018 in jiangsu province, China using Google earth engine. Ocean Coast. Manage. 188, 105144. doi: 10.1016/j.ocecoaman.2020.105144
Estrada-Pérez M., Ruiz-Velazco J. M. J., Hernandez-Llamas A., Zavala-Leal I. (2015). A bio-economic approach to analyze the role of alternative seeding-harvesting schedules, water quality, stocking density and duration of cultivation in semi-intensive production of shrimp in Mexico. Latin Am. J. Aquat. Res. 43, 466–472. doi: 10.3856/vol43-issue3-fulltext-8
FAO (2020). “The state of world fisheries and aquaculture 2020,” in Sustainability in action(Roma: FAO (Food and Agriculture Organization)). https://www.fao.org/documents/card/en/c/ca9229en
FAO (2022). “The state of world fisheries and aquaculture 2022,” in Towards blue transformation (Roma: FAO). doi: 10.4060/cc0461en
González-Rivas D. A., Tapia-Silva F. O., Bustillos-Guzmán J. J., Revollo-Fernández D. A., Beltrán-Morales L. F., Lluch-Cota D. B., et al. (2020). Estimating nitrogen runoff from agriculture to coastal zones by a rapid GIS and remote sensing-based method for a case study from the irrigation district río Mayo, gulf of California, méxico. Front. Mar. Sci. 7. doi: 10.3389/fmars.2020.00316
Gorelick N., Hancher M., Dixon M., Ilyushchenko S., Thau D., Moore R. (2017). Google Earth engine: Planetary-scale geospatial analysis for everyone. Remote Sens. Environ. 202, 18–27. doi: 10.1016/j.rse.2017.06.031
Hernandez-Llamas A., Cabanillas-Ramos J., Magallon-Barajas F. J. (2016). Estimating impact of white spot disease on economic risk in semi-intensive shrimp farms in Mexico: the case of the state of sinaloa. Rev. Aquaculture 8, 111–120. doi: 10.1111/raq.12084
Jara-Marini M. E., Molina-García A., Martínez-Durazo Á., Páez-Osuna F. (2020). Trace metal trophic transference and biomagnification in a semiarid coastal lagoon impacted by agriculture and shrimp aquaculture. Environ. Sci. pollut. Res. 27, 5323–5336. doi: 10.1007/s11356-019-06788-2
López-Caloca A. A., Tapia-Silva F. O., López F., Pilar H., Ramírez González A. O., Rivera G. (2020). Analyzing short term spatial and temporal dynamics of water presence at a basin-scale in Mexico using SAR data. null 57, 985–1004. doi: 10.1080/15481603.2020.1840106
Martínez-Durazo A., García-Hernández J., Páez-Osuna F., Soto-Jiménez M. F., Jara-Marini M. E. (2019). The influence of anthropogenic organic matter and nutrient inputs on the food web structure in a coastal lagoon receiving agriculture and shrimp farming effluents. Sci. Total Environ. 664, 635–646. doi: 10.1016/j.scitotenv.2019.01.343
Martinez-Porchas M., Martinez-Cordova L. R. (2012). World aquaculture: Environmental impacts and troubleshooting alternatives. Sci. World J. 2012, 389623. doi: 10.1100/2012/389623
Miranda A., Voltolina D., Frías-Espericueta M. G., Izaguirre-Fierro G., Rivas-Vega M. E. (2009). Budget and discharges of nutrients to the Gulf of California of a semi-intensive shrimp farm (NW Mexico). 19.
Naylor R. L., Hardy R. W., Buschmann A. H., Bush S. R., Cao L., Klinger D. H., et al. (2021). A 20-year retrospective review of global aquaculture. Nature 591, 551–563. doi: 10.1038/s41586-021-03308-6
Olofsson P., Foody G. M., Herold M., Stehman S. V., Woodcock C. E., Wulder M. A. (2014). Good practices for estimating area and assessing accuracy of land change. Remote Sens. Environ. 148, 42–57. doi: 10.1016/j.rse.2014.02.015
Ottinger M., Bachofer F., Huth J., Kuenzer C. (2022). Mapping aquaculture ponds for the coastal zone of Asia with sentinel-1 and sentinel-2 time series. Remote Sens. 14. doi: 10.3390/rs14010153
Páez-Osuna F., Álvarez-Borrego S., Ruiz-Fernández A. C., García-Hernández J., Jara-Marini M. E., Bergés-Tiznado M. E., et al. (2017). Environmental status of the gulf of California: A pollution review. Earth-Science Rev. 166, 181–205. doi: 10.1016/j.earscirev.2017.01.014
Páez-Osuna F., Gracia A., Flores-Verdugo F., Lyle-Fritch L. P., Alonso-Rodrıíguez R., Roque A., et al. (2003). Shrimp aquaculture development and the environment in the gulf of California ecoregion. Mar. pollut. Bull. 46, 806–815. doi: 10.1016/S0025-326X(03)00107-3
Páez-Osuna F., Ruiz-Fernández A. C. (2005). Environmental load of nitrogen and phosphorus from extensive, semiintensive, and intensive shrimp farms in the gulf of California ecoregion. Bull. Environ. Contamination Toxicol. 74, 681–688. doi: 10.1007/s00128-005-0637-8
Pimple U., Simonetti D., Sitthi A., Pungkul S., Leadprathom K., Skupek H., et al. (2018). Google Earth engine based three decadal landsat imagery analysis for mapping of mangrove forests and its surroundings in the trat province of Thailand. J. Comput. Commun. 6, 247–264. doi: 10.4236/jcc.2018.61025
Ponce-Palafox J. T., Ruiz-Luna A., Castillo-Vargasmachuca S., García-Ulloa M., Arredondo-Figueroa J. L. (2011). Technical, economics and environmental analysis of semi-intensive shrimp (Litopenaeus vannamei) farming in Sonora, sinaloa and nayarit states, at the east coast of the gulf of California, méxico. Ocean Coast. Manage. 54, 507–513. doi: 10.1016/j.ocecoaman.2011.03.008
Sampantamit T., Ho L., Lachat C., Sutummawong N., Sorgeloos P., Goethals P. (2020). Aquaculture production and its environmental sustainability in Thailand: Challenges and potential solutions. Sustainability 12. doi: 10.3390/su12052010
Scheuering M. (2021). The expansion of shrimp farms in the gulf of California and potential for restoration to support migratory waterbirds. Undergraduate Theses, Professional Papers, and Capstone Artifacts 335. https://scholarworks.umt.edu/utpp/335
Shelestov A., Lavreniuk M., Kussul N., Novikov A., Skakun S. (2017). Exploring Google earth engine platform for big data processing: Classification of multi-temporal satellite imagery for crop mapping. Front. Earth Sci. 5. doi: 10.3389/feart.2017.00017
Soto-Rodriguez Sonia A., Gomez-Gil B., Lozano-Olvera R., Betancourt-Lozano M., Morales-Covarrubias M. S. (2015). Field and experimental evidence of vibrio parahaemolyticus as the causative agent of acute hepatopancreatic necrosis disease of cultured shrimp (Litopenaeus vannamei) in northwestern Mexico. Appl. Environ. Microbiol. 81, 1689–1699. doi: 10.1128/AEM.03610-14
Stiller D., Ottinger M., Leinenkugel P. (2019). Spatio-temporal patterns of coastal aquaculture derived from sentinel-1 time series data and the full landsat archive. Remote Sens. 11. doi: 10.3390/rs11141707
Sun Z., Luo J., Yang J., Yu Q., Zhang L., Xue K., et al. (2020). Nation-scale mapping of coastal aquaculture ponds with sentinel-1 SAR data using Google earth engine. Remote Sens. 12. doi: 10.3390/rs12183086
Wickham H. (2016). ggplot2: Elegant graphics for data analysis (Springer-Verlag New York). Available at: https://ggplot2.tidyverse.org.
Keywords: aquaculture production forecast, google earth engine, satellite image classification, aquaculture expansion forecast, prediction model
Citation: González-Rivas DA and Tapia-Silva FO (2023) Estimating the shrimp farm’s production and their future growth prediction by remote sensing: Case study Gulf of California. Front. Mar. Sci. 10:1130125. doi: 10.3389/fmars.2023.1130125
Received: 22 December 2022; Accepted: 13 February 2023;
Published: 23 February 2023.
Edited by:
S.S.S. Sarma, Faculty of Higher Education Iztacala, National Autonomous University of Mexico, MexicoReviewed by:
Edison Barbieri, Agência de Agronegócio e Tecnologia de São Paulo (APTA), BrazilCopyright © 2023 González-Rivas and Tapia-Silva. This is an open-access article distributed under the terms of the Creative Commons Attribution License (CC BY). The use, distribution or reproduction in other forums is permitted, provided the original author(s) and the copyright owner(s) are credited and that the original publication in this journal is cited, in accordance with accepted academic practice. No use, distribution or reproduction is permitted which does not comply with these terms.
*Correspondence: David Alejandro González-Rivas, ZGFncml2YUBnbWFpbC5jb20=; Felipe Omar Tapia-Silva, ZnRhcGlhQGl6dC51YW0ubXg=
Disclaimer: All claims expressed in this article are solely those of the authors and do not necessarily represent those of their affiliated organizations, or those of the publisher, the editors and the reviewers. Any product that may be evaluated in this article or claim that may be made by its manufacturer is not guaranteed or endorsed by the publisher.
Research integrity at Frontiers
Learn more about the work of our research integrity team to safeguard the quality of each article we publish.