- 1School of Ocean Technology Sciences, Qilu University of Technology (Shandong Academy of Sciences), Qingdao, China
- 2Key Laboratory of Marine Genetics and Breeding (Ministry of Education), Ocean University of China, Qingdao, China
Yesso scallop, Patinopecten yessoensis, is one of the most economically important marine bivalves that has been extensively cultured on the northern coast of China. Unfortunately, recurrent mass scallop mortalities have caused enormous economic losses to farmers and industries. Therefore, the exploration of indicators to assess the survival potential of scallops is conducive to breeding new varieties for a high survival rate. However, traditional indicators related to scallop health are generally measured using laborious and time-consuming methods that often involve killing the scallops. In this study, we developed a non-invasive and real-time method for monitoring Yesso scallop valve movements. Our research demonstrated a close correlation between the behavior of valve movements and the survival potential of scallops. The frequency of valve movements was found to have a circadian rhythm with elevated frequency during 7:00–9:00 and 17:00–19:00, showing a coincident rhythm with cardiac activity. Moreover, the patterns of valve behavior indicated that intense valve movements appeared to be more equally distributed in the lifespan of long-surviving individuals. Velocity estimation of valve movement was further applied to assess its correlation with scallop vitality and mortality. The top valve movement velocity was the most important determinant of the scallop vitality coefficient, which was positively correlated with scallop survival time (R2 = 0.873, P < 0.01). The prominent variables in predicting scallop survival potential, including the scallop top velocity and thickness, were presumed to be linked to the movement associated attributes of the shell ligament and muscle, which are important determinants of valve behavior intensity. Our findings demonstrate that an understanding of the valve movements of bivalves can be of great benefit, not only in exploring scallop vitality but also in developing scallop breeding strategies.
1 Introduction
Bivalve mollusks are considered important marine organisms of both economic and ecological significance. Among bivalves, over 40 species of scallops have been cultured along the coast of China, representing one of the most valuable marine resources in China (Guo and Luo, 2006; Wang et al., 2013). However, recurrent outbreaks of mass scallop mortalities have caused enormous economic losses to farmers and industries (Yu et al., 2019; Ye et al., 2021). Many factors are suspected of causing scallop mass mortality episodes, mainly including environmental parameter fluctuations (e.g., temperature, salinity, dissolved oxygen, and pH) (Chen et al., 2007; Tan and Zheng, 2020; Coleman et al., 2022), pathogen and parasite infestation (Kawahara et al., 2019; Soon and Zheng, 2019), contamination with pollutants (Song et al., 2015b; Stewart et al., 2021), and phytoplankton alternations (Yu et al., 2019). However, most factors are speculative or unexplained, as they involve complex interactions between scallops and the environment (Ye et al., 2021).
To promote the rapid revival of the scallop aquaculture industry, continuous efforts in genetic selection and breeding have been applied to improve the survival and adaptative performance of scallops by cultivating new varieties with high survival rates (Wang et al., 2017; Hu et al., 2021). Accordingly, many important traits have been assessed, including heat endurance (Xing et al., 2021), nutrient deposition (Li et al., 2019), immunity response (Song et al., 2015a), and hypoxia and biotoxin resistance (Li et al., 2017; Xun et al., 2020; Yang et al., 2021). It is worth noting that accurate and efficient indicators are considered as essential prerequisites for exploring traits. At present, the traditional indicators related to scallop health mainly comprise physiological indices such as mortality rate and physiological indices (e.g., growth rate and food clearance rate), as well as indicators of molecular biology concerning enzyme activity and functional gene expression (Laing, 2002; Xing et al., 2016; Li et al., 2020; Wang et al., 2021a). However, these indicators are measured using laborious and time-consuming methods that often involve killing the scallops. Besides, many valuable scallops are difficult to distinguish, even at the laboratory level, due to the lack of indicators assessing or predicting individual survival potential. In practice, the task is considerably more difficult, because technology relating to real time and non-invasive detection methods is often lacking, especially for plenty of candidate scallops. Therefore, the development of real time and efficient detection methods will facilitate the exploration of valuable candidate indicators to evaluate daily scallop vitality and enable the breeding of scallops for superior survival potential.
Bivalves are known to open and close their valves in natural conditions to maintain their basal metabolic status and respond to external stimuli to protect themselves. Moreover, this phenomenon is closely linked to vital activities, such as respiration, feeding, excretion, and escape behavior (Nagai et al., 2006; Robson et al., 2009; Redmond et al., 2017). In addition, these behavioral responses are affected by both physiological and environmental factors (Hartmann et al., 2016). Consequently, valve movements were usually measured and utilized as a predominant indicator reflecting short term changes in environmental conditions and water quality monitoring (Hartmann et al., 2016; Redmond et al., 2017). However, few studies have assessed bivalve valve movements in relation to the associated vital behavior, including survival potential. In the present study, we developed a rapid valve movement detection method for multi-sample real-time monitoring of bivalves, which produced data acquired once every 100 ms for the precise measurement of valve behavior. Furthermore, we continuously monitored valve movements in Yesso scallop (Patinopecten yessoensis), an important aquaculture bivalve mollusk from the northern coast of China (Wang et al., 2017), and refined several parameters, including the frequency and velocity of valve movements, to assess their correlation with scallop vitality and mortality. Our results revealed that valve movement could be applied as a vital indicator associated with the circadian rhythm and survival potential. This study will contribute to scallop breeding aiming to prevent future regional scallop mass mortalities.
2 Materials and methods
2.1 Collection and maintenance of scallops
In this study, all adult Yesso scallops were from a contemporaneously cultured population obtained from Zhangzidao Group Co., Ltd (Dalian, China) in 2021. Limited by the monitoring capacity of devices, a total of 16 scallops were randomly selected and equally divided into two groups and designated S1-0 to S1-7 and S2-0 to S2-7 after 3 days acclimation and depurations in filtered seawater at 14 °C with aeration. Each group was held in the same experimental aquarium containing 16 L of water. Isochrysis galbana cells were cultivated (Kaplan et al., 1986) and fed to each group once a day to a final density of 106 cells/mL in a 50 mL volume. The scallops nearly filtered all the algal cells within 12 h. The phenotype data of scallops was measured, including shell length (Lenshell), height (Heishell) and width (Widshell) and whole wet weight (WT). Shell length and height were measured as the maximum dimension at right angles to each other (Supplementary Figure S1), while shell width was measured as the greatest vertical distance between the two valves, generally reflecting scallop thickness (Supplementary Figure S1).
2.2 Measurement of scallop valve movements
Scallop valve movement was monitored using a noninvasive method based on the Hall effect (Wilson et al., 2005; Robson et al., 2009; Wang et al., 2021b). In this study, each sensor probe comprised a Hall detection module, a signal transmission line, a flexible sheet with a magnet, and plastic stents (Wang et al., 2021b). For each sensor probe, the magnet was fixed at the top of the flexible sheet, perpendicular to the Hall element, which was encapsulated in plastic housing with a signal transmission line attached at the end (Figure 1A). The sensor probe was fixed on the bottom plate through the plastic stents. During the experiment, each scallop was placed on the bottom plate and directly below the flexible sheet (Figure 1B). When the valve of a scallop opened or closed, the shell moved the magnet on the flexible sheet, causing the Hall element voltage to change. The voltage data was transmitted to a data acquisition unit at 10 Hz (at 100 ms intervals) (DAM3055, ART Technology Corp., China). The maximum capacity of each monitoring device contains eight sensor probes; therefore, each group comprised only eight scallops. Scallops were continuously monitored until natural death.
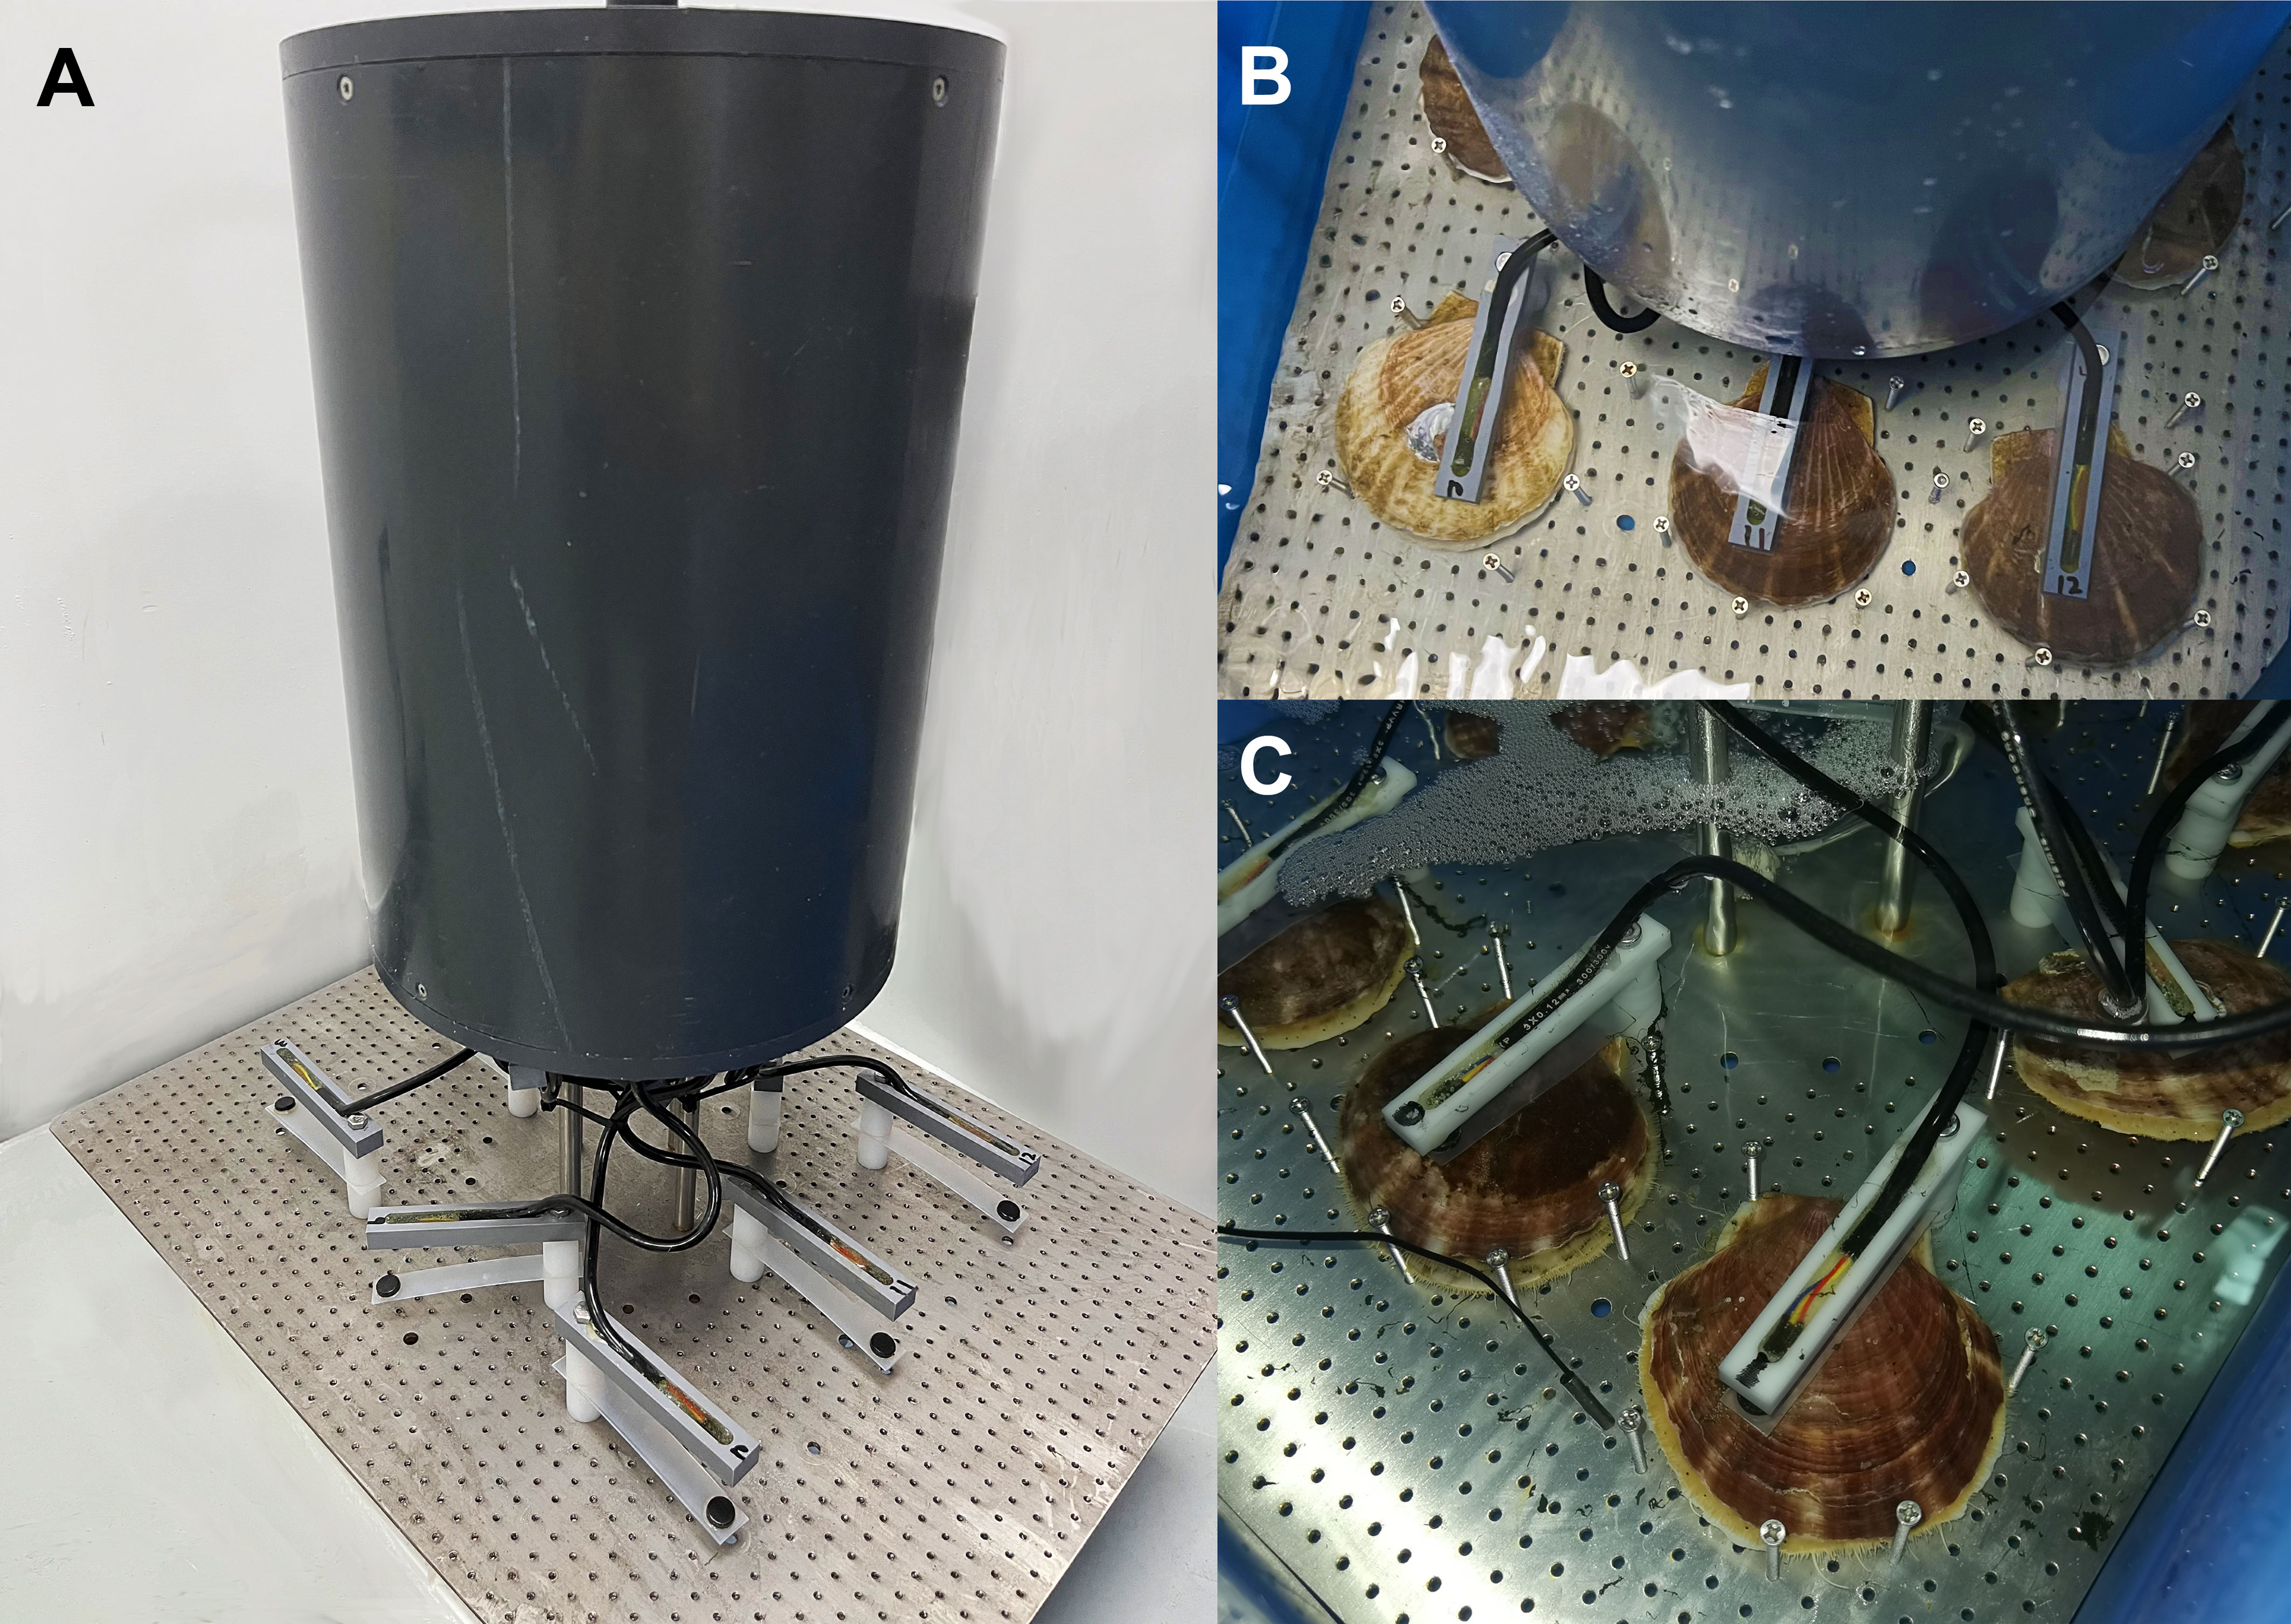
Figure 1 Scallop valve movement monitoring device. (A) The overlook view of the monitoring device with eight sensor probes. (B) The top view of the device when monitoring scallops. The activity of each scallop was limited to the area enclosed by specific fences. (C) The scallops lay undisturbed during the experiment.
2.3 Calculation and estimation of scallop valve movement indicators
The distance of valve movements can be calculated from output voltage data since the external magnetic field is inversely proportional to the square of the distance between the magnet and the Hall element sensor (Nagai et al., 2006). The voltage data for each scallop was converted to distance data based on the calibration of the sensor probe (Wang et al., 2021b). The real time distance curve of the scallop was constructed to show valve movement performance during the whole experiment. The velocity was estimated by calculating the time derivative of valve movement distance in homemade Perl scripts. Regression analysis of all data were fitted to calculate the prediction equations of survival potential from the measured variables by optimizing the coefficient of determination (R2). All data were analyzed using SPSS 21.0 (IBM Corp., Armonk, USA). In addition, a heat map of frequency patterns was constructed using custom R scripts.
3 Results & discussion
3.1 Measurement of scallop valve movements
The scallop valve movement monitor was designed to fit the bottom space of the experimental aquarium with eight sensor probes (Figure 1A). Its waterproof outer case makes it possible for application in an actual mariculture environment. To avoid exceeding the detection range of the sensor, the activity of each scallop was limited to the area enclosed by specific fences (Figure 1B). However, the scallops lay undisturbed during the experiment, as the tentacles lengthened and waved slowly in the water currents (MacKenzie Jr, 2008) (Figure 1C).
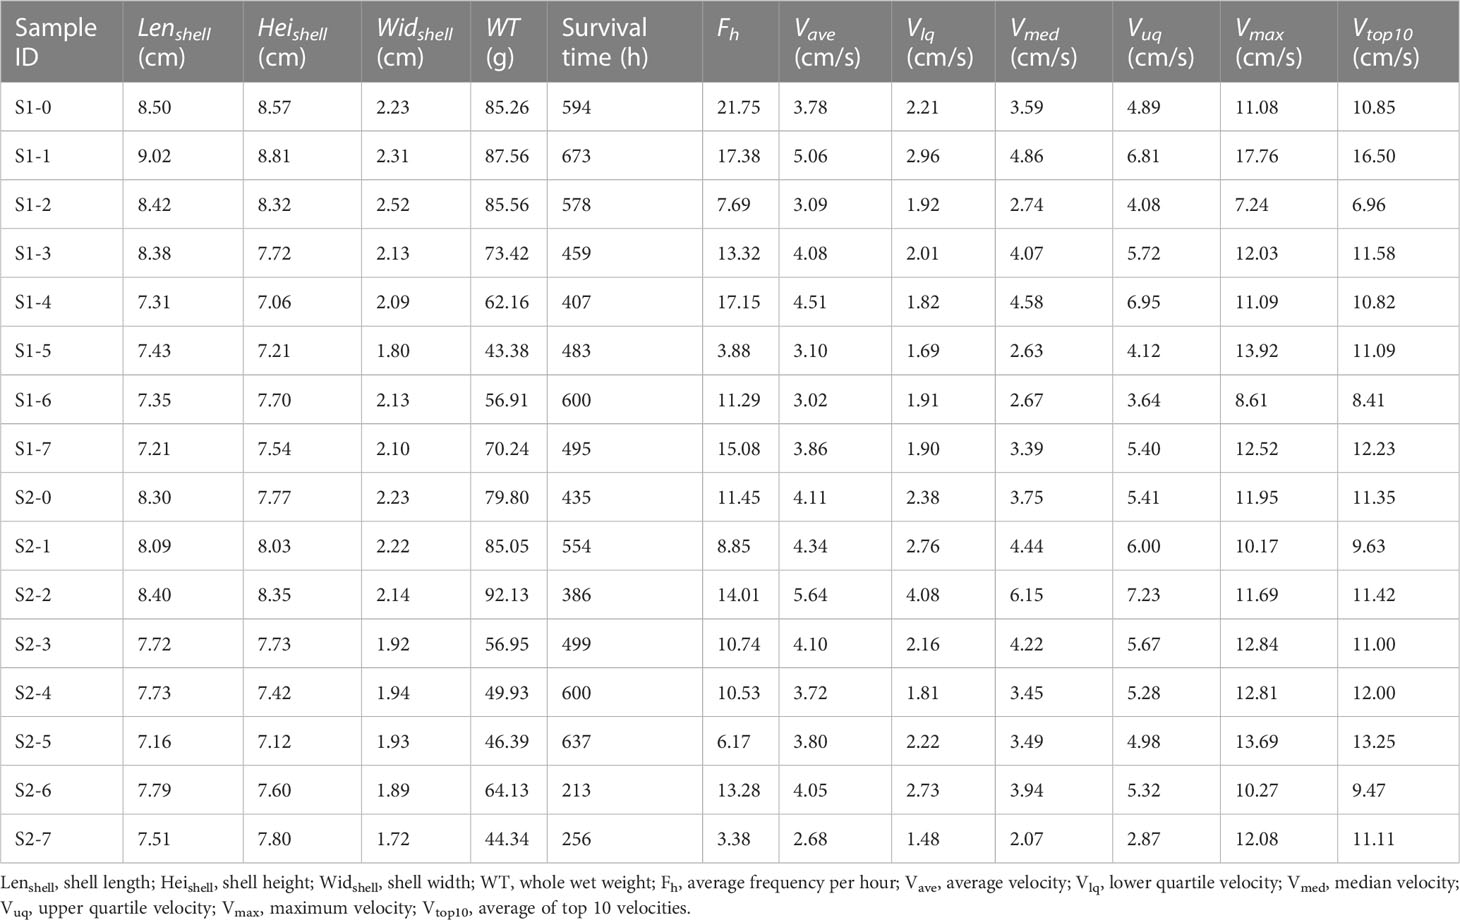
Continuous recording of the valve movements of all scallops (n = 16) lasted the whole experiment until they died naturally. The first scallop died after approximately 213 h of investigation, while the last one survived for over 673 h, approximately 1 month (Table 1). Valve position information for each scallop was recorded at 10 Hz (100 ms intervals) after optimization since the difference among the curves at frequencies over 2 Hz (0.5 s intervals) was almost indistinguishable (Robson et al., 2009). Therefore, increasing measuring frequency appeared to approximate actual scallop action, resulting in a smoother valve movement curve. The pattern of scallop valve behavior sometimes showed periods where the line was flat (i.e., the shell is open) and displayed frequent spikes, indicating the intense valve movement of shell closure for a short duration (Figure 2A). However, due to long term monitoring and individual differences, many scallops demonstrated abundant and idiosyncratic behavioral patterns of valve movements, illustrating the challenges in behavior data analysis.
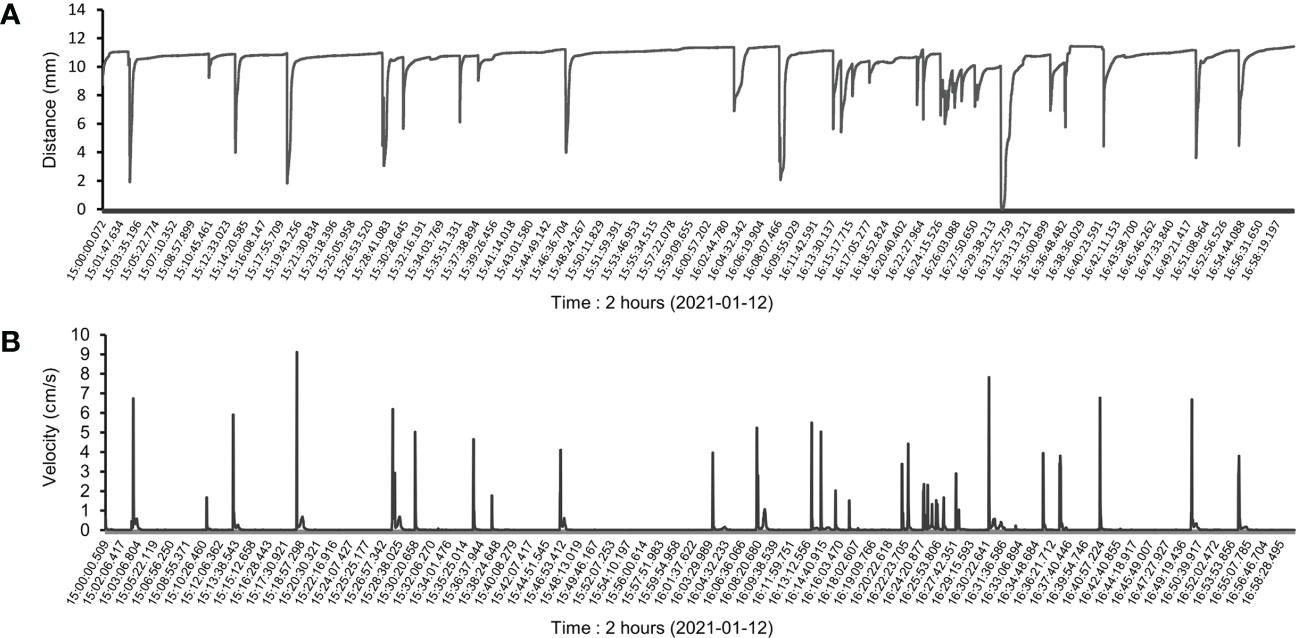
Figure 2 Partial raw data for scallop valve movements. (A) Two-hour raw distance data were selected from one continuous monitoring sample to display partial behavioral patterns of scallop valve movements. (B) Coincident with the patterns above, the velocities of valve movements were calculated based on the distance data, reflecting the intensity of each valve movement.
To quantify valve movement behavior, velocity was estimated using the time derivative of valve movement distance (Figure 2B). Relative valve abduction and adduction velocities were measured as ethological variables of scallop valve movement. Our calculations demonstrated that each velocity value could represent one valve movement, and both showed a coincident variation tendency (Figure 2). Furthermore, these indicators, such as velocity and frequency, could be used to assess and reflect the intensity of each valve movement.
3.2 Circadian rhythm of scallop valve movements
We monitored the valve movement of all scallops and counted their respective frequencies. The scallops were divided into two groups based on their frequency patterns. Nearly three quarters of the scallops were clustered in one group with more than one active period. Their frequent valve movements were spread out over a 7 h-period from 2:00 to 8:00 and increased to a peak in a 3 h-period from 17:00 to 19:00 (Figure 3A). While the scallops from the other group (e.g., ID: S2-3, S2-5, S2-7) had a peak period of valve movements from 7:00 to 9:00 (Figure 3A). Coincidentally, an investigation monitoring 43 Zhikong scallops (Chlamys farreri) over approximately 48 h showed that the frequency of valve movements also began to decrease at 9:00 after an active period from 1:00 to 8:00 and increased rapidly from 17:00 after a quiescent phase (Supplementary Figure S2). Therefore, scallop frequency patterns showed a possible circadian rhythm of valve movements. However, there might not be a direct correlation between the circadian rhythm of valve behavior and scallop survival time, since individuals with different lifespans seemed to share a similar frequency pattern. For instance, the individual S2-5 lived much longer than S2-7 clustered in the same group as S2-5 (Figure 3A). In addition, the individuals with frequent daily valve movements, such as S1-0 and S1-1, were almost as long-lived as those with low frequency, such as S1-2 and S2-5 (Figure 3B), which suggested that the daily frequency of valve movements also could not be directly applied in assessment of scallop survival potential.

Figure 3 Frequency of valve movements in monitored scallops. (A) Heatmap showing the circadian rhythm of valve movements among the scallops based on the hourly average frequencies of 24-h time points. (B) In order of sample ID, the histogram shows the average activity frequency per hour throughout the experiment for each scallop. In addition, the number of daily valve movements for each scallop is highlighted with colors varying from blue to red, representing the scale of the daily frequency level.
Notably, the circadian rhythm phenomenon in scallops was not only found in their valve movements but also in other physiological activities, such as cardiac performance. Two daily active periods of cardiac performance have also been reported in the scallops with significant heart rate elevation during 1:00–9:00 (peak at 2:00 and 8:00) and 17:00–19:00 (peak at 18:00), where the circadian rhythm was similar to valve movements (Xing et al., 2019). The acceleration in heart rate is usually accompanied by energy conversion, reflecting increased cardiac workload or oxygen demand. As an energy adaption behavior, scallop valve opening/closing mainly depends on muscular relaxation and contraction, which is more energetically costly than in quiescent phases (Redmond et al., 2017). Therefore, their coincident performance in the circadian rhythm might be related to the energy metabolism of daily behavior (Robson et al., 2009; Riisgård and Larsen, 2015).
However, considering all scallops monitored in a relatively stable environment, the daily frequency of valve movements fluctuated widely from dozens to hundreds in most individuals throughout the whole investigation (Figure 3B), which seemed to be in contradiction with possible stability of the energy consumption for scallop daily behavior. Thus, it was suggested that quantification of valve behavior was reflected not only by daily frequency but also by intensity of each valve movement.
3.3 Indicators for assessing scallop survival potential
The daily valve movement velocities of each scallop throughout the experiment were measured and used to calculate the average (Vave), lower quartile (Vlq), median (Vmed), and upper quartile (Vuq) velocities (Table 1). The scallops preferred to control the speeds for daily valve gape or closure with respect to the median and upper quartile velocities, maintaining these at 3 ± 1 and 5 ± 2 cm/s, respectively (Figure 4). In contrast, the maximum velocity (Vmax) of valve movements in most scallops was over 10 cm/s except for individuals S1-2 and S1-6 with maximum velocities of 7.24 and 8.61 cm/s, respectively (Table 1). Considering the average of the top 10 velocities (Vtop10) for each scallop, both the maximum and averaged top velocities had a coincident variation tendency and close absolute values among the scallops, eliminating the possible effects of some extremums due to accidental errors (Table 1).
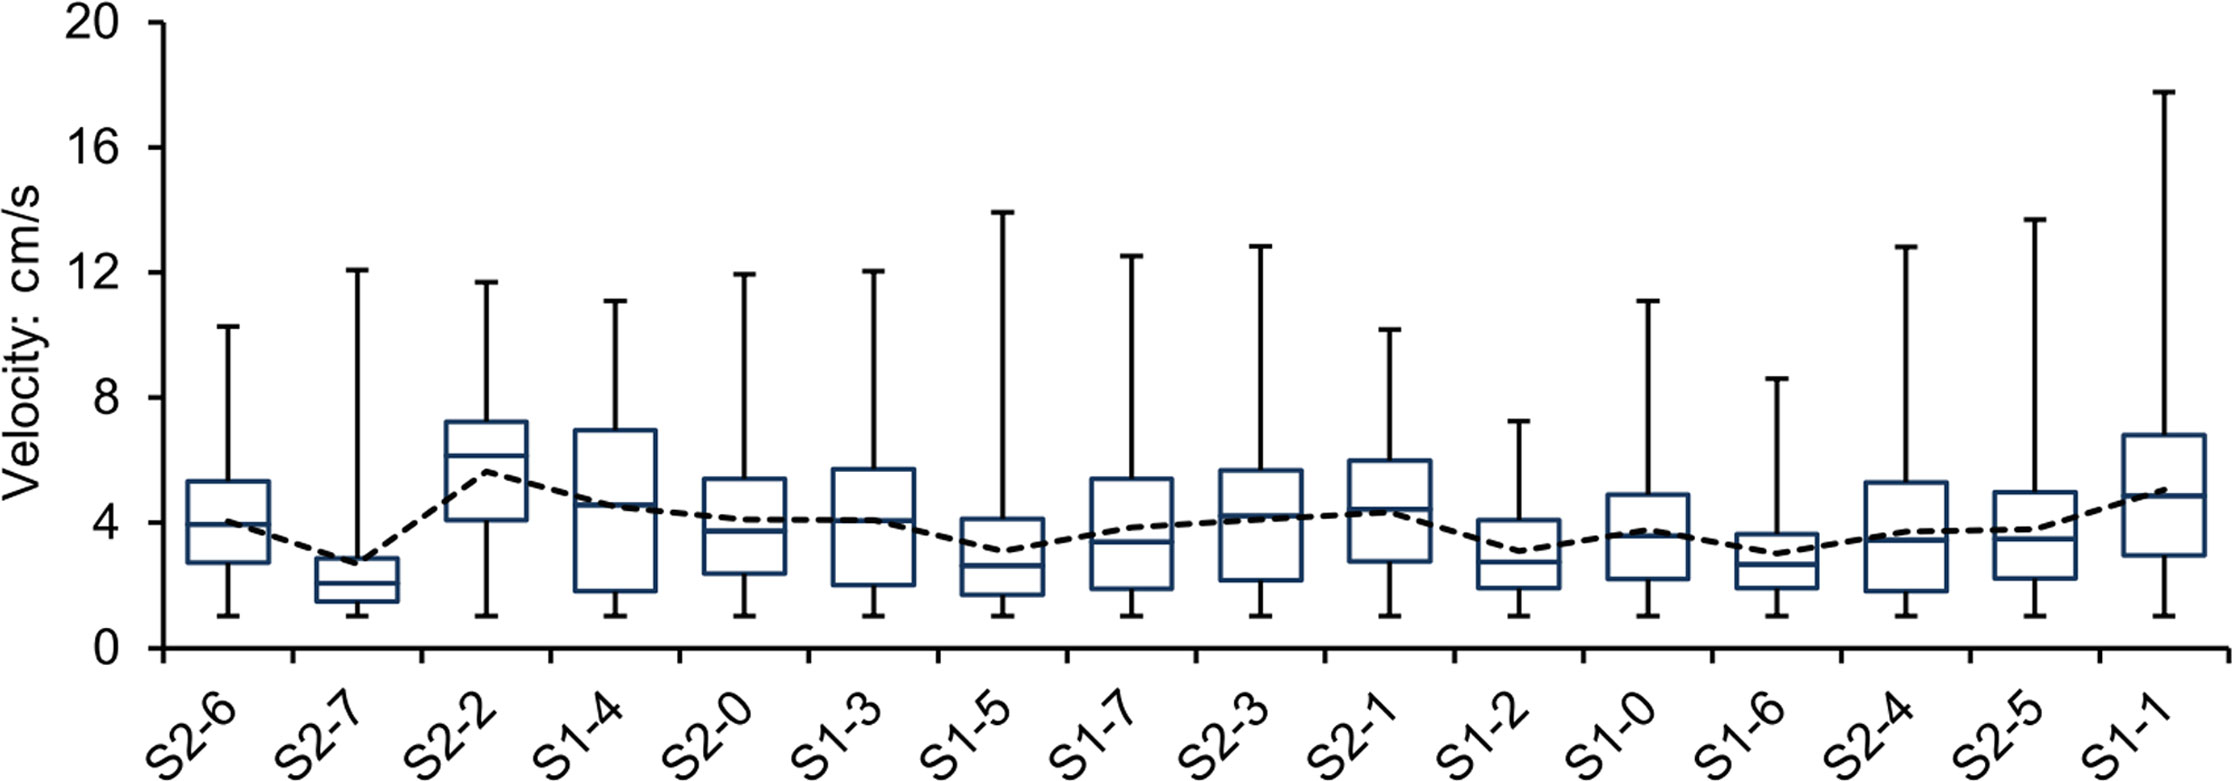
Figure 4 Box and whisker plots showing velocity data for scallop valve movements. Box plots show the median, 25th (lower quartile) and 75th (upper quartile) percentile (box), and minimum-maximum percentile range (whiskers). The dotted line represents the average velocities for each scallop. The order of samples on the x-axis is based on scallop survival times in this study.
Valve movements with high velocity values might be more directly related to energy consumption (Redmond et al., 2017). Accordingly, we investigated the distribution of intense valve movements for each scallop, where only the top 5% of valve opening/closing events were selected based on their velocities. Our results showed that intense valve movement events were almost equally distributed in the lifespan of the longest surviving individual, S1-1, of which the percentage of days spent with high-speed movements was 93.5% (Figure 5), whereas that for the shortest-lived individual, S2-7, was only 13.3% (Figure 5). Moreover, the average survival days of groups with percentages over 90% (ID: S1-1, S1-4, S2-1, S2-3) were 24.3 days, more than the those of the other groups, which were 22.2 days (70–90%, ID: S1-0, S1-3, S2-0, S2-2, S2-4), 20.3 days (60–70%, ID: S1-7, S2-5, S2-6), and 22 days (<50%, ID: S1-2, S1-5, S1-6, S2-7) (Figure 5). Indeed, behavioral data from continuously monitored organisms are usually complex and there are always exceptions (Hartmann et al., 2016). Even though some individuals exhibited nonlinearity and variable behaviors, the daily intense valve responses based on the velocity index reflected scallop behavioral strategies, which might be related to the survival potential of scallops.
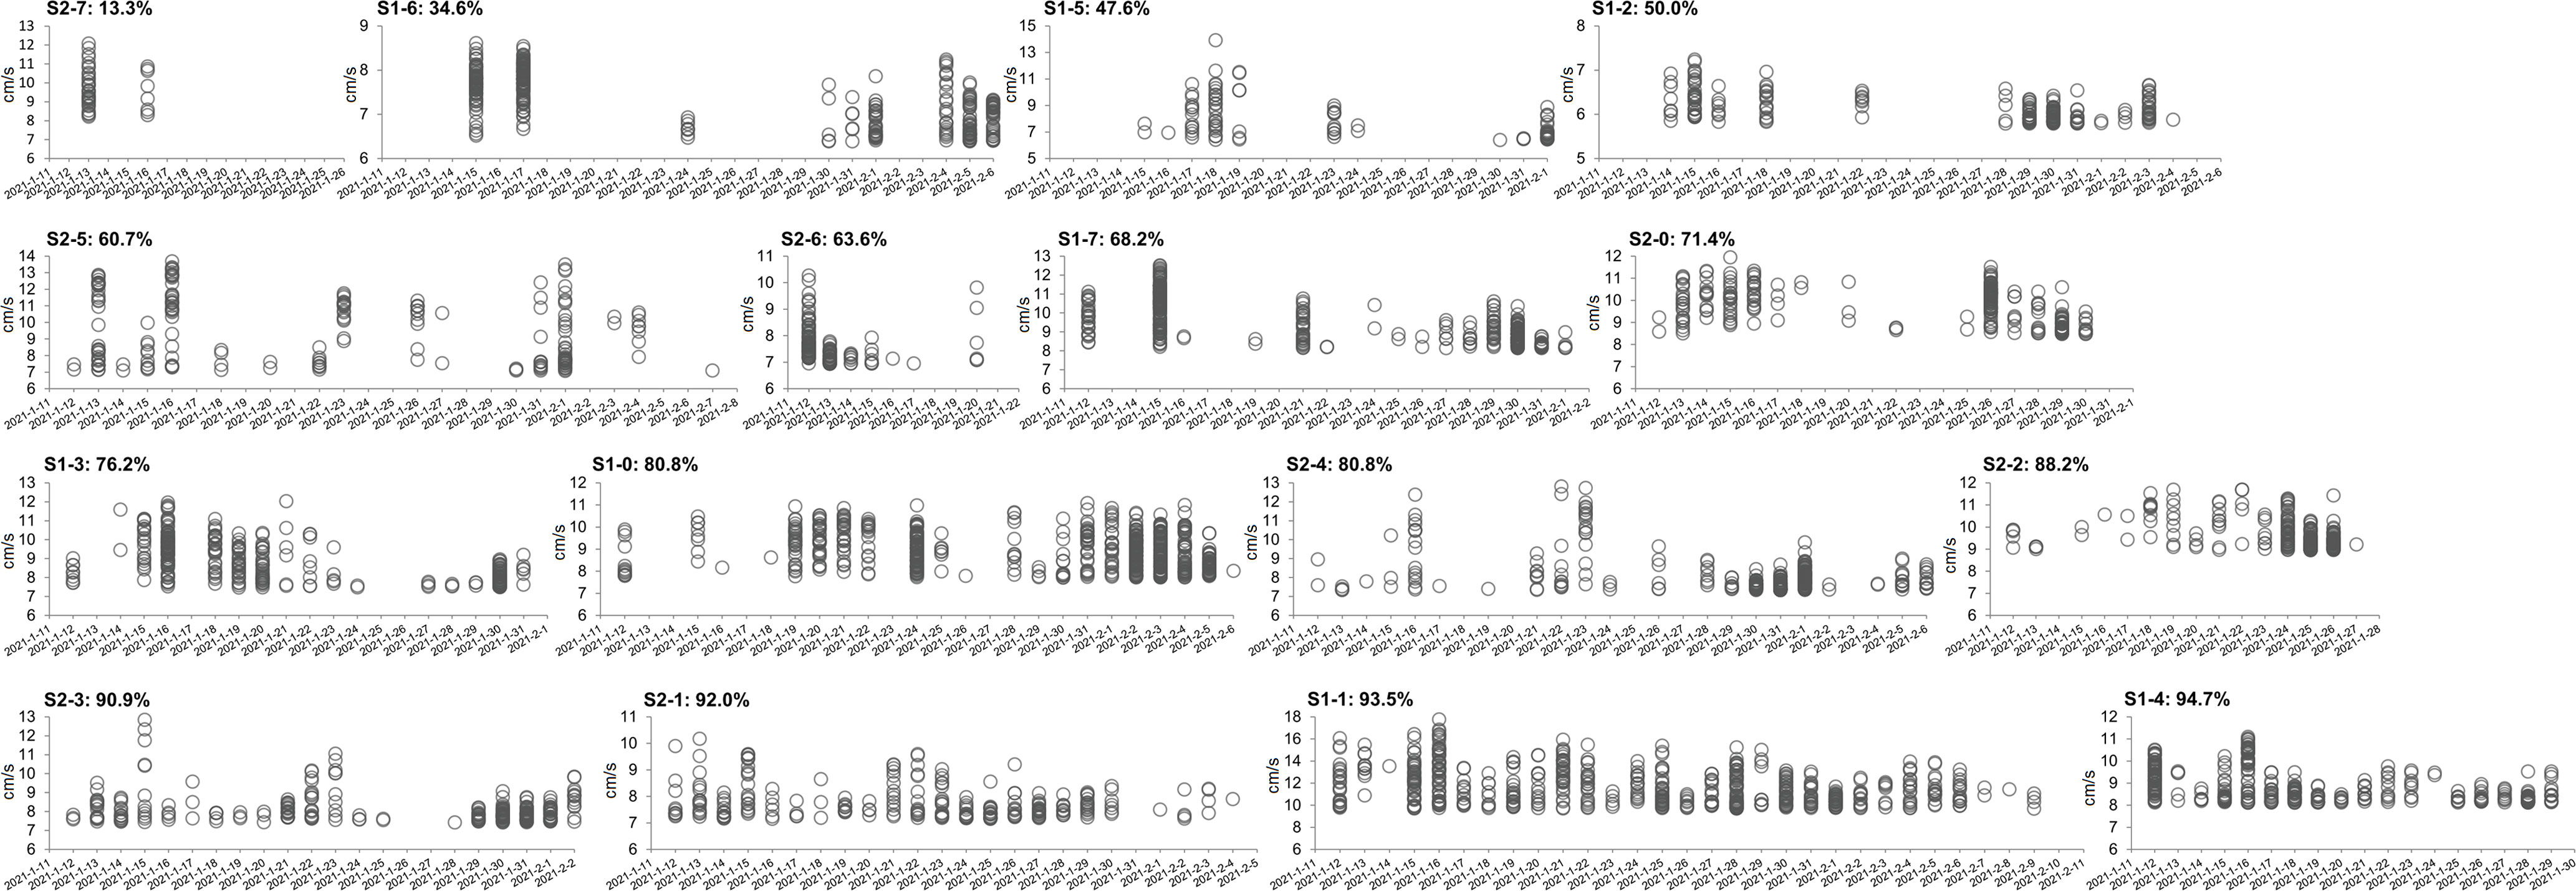
Figure 5 Distribution of intense valve movements among the scallops. Only the top 5% valve movement events of each scallop were selected based on the order of their velocities. The percentage of each graph represents the ratio of the days with the top events to the total survival days of each scallop. The order of graphs in the figure is based on their percentages.
Furthermore, the regression equations of scallop valve movements were determined to predict individual survival potential from the measured variables in reference to valve behavior and body size, which was a primary finding of the work conducted here. The regression predictive value (RPV) was defined as scallop vitality coefficient and calculated by multiple linear regression analysis with models of backward elimination. The correlation between RPV and survival time was positive but not significant when the model containing all variables under consideration (R2 = 0.906, P=0.12). When removing the least significant variable, shell height, we found a significant positive correlation between the RPV and survival time with the highest coefficient (R2 = 0.906, P<0.05) (Figure 6A). The equation of RPV was defined as follows: RPV = 1043.5Widshell -112.9Lenshell -4.0WT +366.5Vlq +241.9Vuq +624.4Vmed -1579.7Vave +83.1Vtop10 +26.1Vmax +6.2Fh -51.0, where the phenotype data of scallops was involved, as well as the velocity variables and the average frequency per hour (Fh) of valve movements (Figure 6A). The equation of RPV was further optimized through backward stepwise regression to have a smaller P-value than preceding equations and maintain a high correlation coefficient (R2 = 0.873, P<0.01) (Figure 6B). The optimized equation of RPV was as follows: RPV = 856.5Widshell -123.7Lenshell +364.8Vlq +295.6Vuq +670.6Vmed -1750.8Vave +120.8Vtop10 +335.1, which only retained size and velocity variables (Figure 6B). Furthermore, starting with a model including the significant phenotype data of Widshell, Lenshell, and WT, each variable in reference to valve behavior was separately added to the model to reveal its effect on the equation. RPV was significantly positively correlated with survival time, only when containing Vtop10 or Vmax in the model (respectively R2 = 0.628, R2 = 0.643, and both P<0.05) (Figure 6C). By contrast, no matter which of Widshell and Vtop10was removed, the RPV of the optimized equation in Figure 6B could not be positively correlated with survival time, as its elimination from the model caused a huge drop in R2 (respectively R2 = 0.340, R2 = 0.303) (Figure 6D).
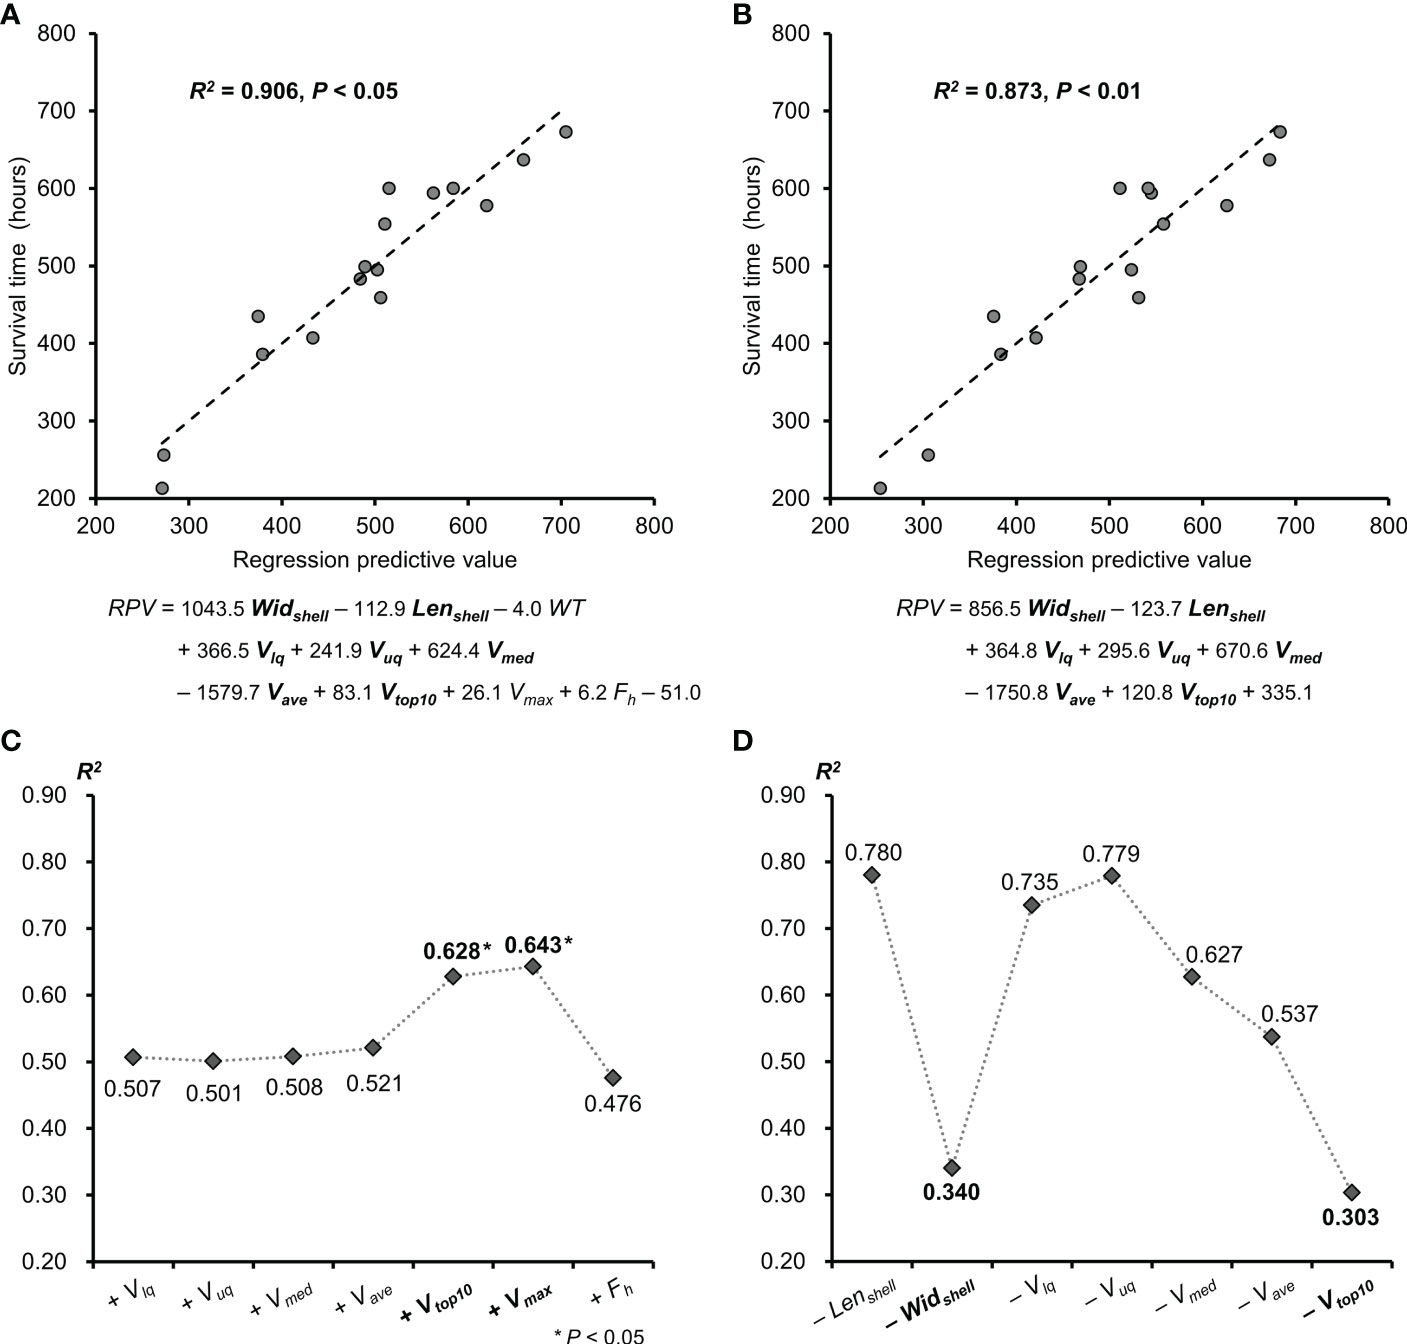
Figure 6 The relationship between scallop vitality predictive value and scallop survival time. (A) Significant positive correlation between scallop survival time and the RPV with the highest R2 value. (B) Significant positive correlation between scallop survival time and the optimized RPV through backward stepwise regression. The variables involved in both equations above were shown in bold. (C) Changes of the R2 values with the variables which were separately added to the model containing Widshell, Lenshell and WT. (D) Changes of the R2 values with the variables which were separately removed from the model used in (B). RPV, regression predictive value; Widshell, shell width; Lenshell, shell length; WT, whole weight; Vlq, lower quartile velocity; Vuq, upper quartile velocity; Vmed, median velocity; Vave, average velocity; Vmax, the maximum velocity; Vtop10, average of top 10 velocities; Fh, average frequency per hour.
Therefore, the variables regarding to the top velocity of valve movement and scallop thickness dominated the estimation of scallop survival potential. Indeed, these indicators were found to be related to exercise adaptations of scallops. Compared with the top velocity, which reflects intense valve movements, modifications in shell width and muscle mass were also considered derived adaptations to scallop locomotion activity (Tremblay and Guderley, 2017). It was reported that the scallops with greater shell width usually had faster sinking time, heavier muscle masses and more tonic contraction duration (Tremblay et al., 2012; Tremblay and Guderley, 2017). Indeed, tonic contraction plays a crucial role in maintenance of valve opening and prolonged valve closure (Tremblay et al., 2012). For example, the scallops with greater shell width usually prefer to keep tonic contraction when controlling their valves to escape predators, which is energetically economical (Tremblay et al., 2012). It means that scallops with greater shell width probably have better muscle physiological capacities including muscles masses, strength, and endurance, as well as advantages in energetic cost, which is beneficial to improve scallop survival performance. In addition, since an increase in valve closure velocity requires that the ligament allow the rapid opening of the valves, the resilience of the ligament tends to be higher in scallops with more intense responses (Tremblay et al., 2015). Therefore, these variables were presumed to be linked to the movement associated attributes of the ligament and muscle, which are important determinants of the intensity of the response to external stimuli. As responses to daily activities, bivalve valve movements demonstrate bivalve behavioral adaptations to varying levels of food availability and predation risk, which have crucial effects on individual survival (Robson et al., 2010). Our findings highlight the roles of valve movements in relation to scallop vitality and provide relevant variables for predicting individual survival potential without harming scallops.
4 Conclusion
Compared with general applications in water monitoring, here, valve movements were monitored to assess scallop vitality. Our results emphasize the importance of valve movements in assessing daily behavior and predicting survival potential, which has rarely been reported in previous studies. Indeed, bivalves maintain their basal metabolic status and response to external stimuli through their valve movements, which underlie aspects of scallop adaptation to variation in food availability and predation risk. Further analysis of bivalve valve behavior will assist in obtaining a deeper understanding of bivalve survival and provide a background for exploring important indicators for the bivalve aquaculture industry.
Data availability statement
The original contributions presented in the study are included in the article/Supplementary Material. Further inquiries can be directed to the corresponding authors.
Ethics statement
The animal study was reviewed and approved by Qilu University of Technology (Shandong Academy of Sciences).
Author contributions
XX and XH conceived and designed the experiments. JW, XX, and FL set up the device. XX, LC, YZ, and YL performed the experiments and collected data. XX and XK analyzed the data. XX wrote the manuscript. All authors contributed to the article and approved the submitted version.
Funding
This work was supported by the National Natural Science Foundation of China (31802292), the Pilot Innovation Project from Qilu University of Technology (Shandong Academy of Sciences) (2022GH019), Key R&D Program of Shandong Province, China (2022TZXD003), Institute of Oceanographic Instrumentation, Shandong Academy of Sciences (28-21-YXXM), and the Basic Research Project from Qilu University of Technology (Shandong Academy of Sciences) (2022PX064). The authors also wish to thank Dr. Liang Zhao (Liaoning Ocean and Fisheries Science Research Institute) for his kind assistance in scallop collection.
Conflict of interest
The authors declare that the research was conducted in the absence of any commercial or financial relationships that could be construed as a potential conflict of interest.
Publisher’s note
All claims expressed in this article are solely those of the authors and do not necessarily represent those of their affiliated organizations, or those of the publisher, the editors and the reviewers. Any product that may be evaluated in this article, or claim that may be made by its manufacturer, is not guaranteed or endorsed by the publisher.
Supplementary material
The Supplementary Material for this article can be found online at: https://www.frontiersin.org/articles/10.3389/fmars.2023.1129456/full#supplementary-material
Supplementary Figure 1 | Dimensional distribution of scallop.
Supplementary Figure 2 | Frequency of valve movements in Zhikong scallops (A) The heatmap shows the circadian rhythm of valve movement frequency patterns in adult Zhikong scallops (Chlamys farreri). A total of 43 Zhikong scallops in three batches (ID: A_CF1-A_CF13, B_CF14-B_CF28, C_CF29-C_CF43) were under 48-hour monitoring. (B) The stacked histogram shows the hourly valve movement frequencies of Zhikong scallops at 24-h time points.
References
Chen J., Mai K., Ma H., Wang X., Deng D., Liu X., et al. (2007). Effects of dissolved oxygen on survival and immune responses of scallop (Chlamys farreri Jones et Preston). Fish Shellfish Immunol. 22 (3), 272–281. doi: 10.1016/j.fsi.2006.06.003
Coleman S., Kiffney T., Tanaka K. R., Morse D., Brady D. C. (2022). Meta-analysis of growth and mortality rates of net cultured sea scallops across the Northwest Atlantic. Aquaculture. 546, 737392. doi: 10.1016/j.aquaculture.2021.737392
Guo X., Luo Y. (2006). Scallop culture in China. Dev. Aquacult. Fish. Sci. 35, 1143–1161. doi: 10.1016/S0167-9309(06)80050-5
Hartmann J. T., Beggel S., Auerswald K., Stoeckle B. C., Geist J. (2016). Establishing mussel behavior as a biomarker in ecotoxicology. Aquat. Toxicol. 170, 279–288. doi: 10.1016/j.aquatox.2015.06.014
Hu F., Zhong H., Wu C., Wang S., Guo Z., Tao M., et al. (2021). Development of fisheries in China. Reproduction Breed. 1 (1), 64–79. doi: 10.1016/j.repbre.2021.03.003
Kaplan D., Cohen Z., Abeliovich A. (1986). Optimal growth conditions for Isochrysis galbana. Biomass. 9, 37–48. doi: 10.1016/0144-4565(86)90011-9
Kawahara M., Meyer G. R., Lowe G. J., Kim E., Polinski M. P., Yoshinaga T., et al. (2019). Parallel studies confirm Francisella halioticida causes mortality in Yesso scallops Patinopecten yessoensis. Dis Aquat Organ. 135 (2), 127–134. doi: 10.3354/dao03383
Laing I. (2002). Effect of salinity on growth and survival of king scallop spat (Pecten maximus). Aquaculture. 205, 171–181. doi: 10.1016/S0044-8486(01)00663-9
Li Y., Sun X., Hu X., Xun X., Zhang J., Guo X., et al. (2017). Scallop genome reveals molecular adaptations to semi-sessile life and neurotoxins. Nat. Commun. 8 (1), 1721. doi: 10.1038/s41467-017-01927-0
Li X., Wang S., Xun X., Zhang M., Wang S., Li H., et al. (2019). A carotenoid oxygenase is responsible for muscle coloration in scallop. Biochim. Biophys. Acta Mol. Cell Biol. Lipids. 1864 (7), 966–975. doi: 10.1016/j.bbalip.2019.03.003
Li Q., Zhang F., Wang M., Li M., Sun S. (2020). Effects of hypoxia on survival, behavior, and metabolism of zhikong scallop Chlamys farreri Jones et Preston 1904. J. Ocean. Limnol. 38, 351–363. doi: 10.1007/s00343-019-9074-0
MacKenzie C. L. Jr. (2008) The bay scallop, Argopecten irradians, Massachusetts through North Carolina: Its biology and the history of its habitats and fisheries. Mar. Fish. Rev. 70, 6-79
Nagai K., Honjo T., Go J., Yamashita H., Oh S. J. (2006). Detecting the shellfish killer Heterocapsa circularisquama (Dinophyceae) by measuring bivalve valve activity with a hall element sensor. Aquaculture. 255, 395–401. doi: 10.1016/j.aquaculture.2005.12.018
Redmond K. J., Berry M., Pampanin D. M., Andersen O. K. (2017). Valve gape behaviour of mussels (Mytilus edulis) exposed to dispersed crude oil as an environmental monitoring endpoint. Mar. Pollut. Bull. 117 (1-2), 330–339. doi: 10.1016/j.marpolbul.2017.02.005
Riisgård H. U., Larsen P. S. (2015). Physiologically regulated valve-closure makes mussels long-term starvation survivors: test of hypothesis. J. Molluscan Stud. 81 (2), 303–307. doi: 10.1093/mollus/eyu087
Robson A. A., Garcia De Leaniz C., Wilson R. P., Halsey L. G. (2010). Behavioural adaptations of mussels to varying levels of food availability and predation risk. J. Molluscan Stud. 76 (4), 348–353. doi: 10.1093/mollus/eyq025
Robson A., Thomas G., De Leaniz C. G., Wilson R. (2009). Valve gape and exhalant pumping in bivalves: optimization of measurement. Aquat. Biol. 6, 191–200. doi: 10.3354/ab00128
Song T., Liu L., Song X., Liang Y., Zhuang G. (2015b). Depuration of paralytic shellfish toxins in Japanese scallop (Patinopecten yessoensis) in natural environment. Acta Oceanol. Sin. 34, 170–174. doi: 10.1007/s13131-015-0764-y
Song L., Wang L., Zhang H., Wang M. (2015a). The immune system and its modulation mechanism in scallop. Fish Shellfish Immunol. 46 (1), 65–78. doi: 10.1016/j.fsi.2015.03.013
Soon T. K., Zheng H. (2019). Climate change and bivalve mass mortality in temperate regions. Rev. Environ. Contam. Toxicol. 251, 109–129. doi: 10.1007/398_2019_31
Stewart B. D., Jenkins S. R., Boig C., Sinfield C., Kennington K., Brand A. R., et al. (2021). Metal pollution as a potential threat to shell strength and survival in marine bivalves. Sci. Total Environ. 755 (Pt 1), 143019. doi: 10.1016/j.scitotenv.2020.143019
Tan K., Zheng H. (2020). Ocean acidification and adaptive bivalve farming. Sci. Total Environ. 701, 134794. doi: 10.1016/j.scitotenv.2019.134794
Tremblay I., Guderley H. E. (2017). Possible prediction of scallop swimming styles from shell and adductor muscle morphology. J. Shellfish Res. 36 (1), 17–30. doi: 10.2983/035.036.0104
Tremblay I., Guderley H. E., Himmelman J. H. (2012). Swimming away or clamming up: the use of phasic and tonic adductor muscles during escape responses varies with shell morphology in scallops. J. Exp. Biol. 215 (Pt 23), 4131–4143. doi: 10.1242/jeb.075986
Tremblay I., Samson-Dô M., Guderley H. E. (2015). When behavior and mechanics meet: scallop swimming capacities and their hinge ligament. J. Shellfish Res. 34 (2), 203–212. doi: 10.2983/035.034.0201
Wang J., Chen L., Kong X., Zhang T., Lv J., Xun X., et al. (2021b). Calibration method of biotoxicity monitoring sensor in seawater environment. IOP Conference Series: Earth Environ. Sci. 787, 012070. doi: 10.1088/1755-1315/787/1/012070
Wang S., Hou R., Bao Z., Du H., He Y., Su H., et al. (2013). Transcriptome sequencing of Zhikong scallop (Chlamys farreri) and comparative transcriptomic analysis with Yesso scallop (Patinopecten yessoensis). PloS One. 8 (5), e63927. doi: 10.1371/journal.pone.0063927
Wang H., Liu S., Xun X., Li M., Lou J., Zhang Y., et al. (2021a). Toxin-and species-dependent regulation of ATP-binding cassette (ABC) transporters in scallops after exposure to paralytic shellfish toxin-producing dinoflagellates. Aquat. Toxicol. 230, 105697. doi: 10.1016/j.aquatox.2020.105697
Wang S., Zhang J., Jiao W., Li J., Xun X., Sun Y., et al. (2017). Scallop genome provides insights into evolution of bilaterian karyotype and development. Nat. Ecol. Evol. 1, 0120. doi: 10.1038/s41559-017-0120
Wilson R., Reuter P., Wahl M. (2005). Muscling in on mussels: new insights into bivalve behaviour using vertebrate remote-sensing technology. Mar. Biol. 147, 1165–1172. doi: 10.1007/s00227-005-0021-6
Xing Q., Li Y., Guo H., Yu Q., Huang X., Wang S., et al. (2016). Cardiac performance: a thermal tolerance indicator in scallops. Mar. Biol. 163, 244. doi: 10.1007/s00227-016-3021-9
Xing Q., Wang J., Hu L., Sun Y., Huang X., Zhang L., et al. (2021). Seasonal variation of the thermal tolerance indicator ABT and the development of a rapid detection method in scallop Chlamys farreri. Aquaculture. 531, 735960. doi: 10.1016/j.aquaculture.2020.735960
Xing Q., Zhang L., Li Y., Zhu X., Li Y., Guo H., et al. (2019). Development of Novel Cardiac Indices and Assessment of Factors Affecting Cardiac Activity in a Bivalve Mollusc Chlamys farreri. Front. Physiol. 10, 293. doi: 10.3389/fphys.2019.00293
Xun X., Cheng J., Wang J., Li Y., Li X., Li M., et al. (2020). Solute carriers in scallop genome: Gene expansion and expression regulation after exposure to toxic dinoflagellate. Chemosphere. 241, 124968. doi: 10.1016/j.chemosphere.2019.124968
Yang B., Gao X., Zhao J., Liu Y., Gao T., Lui H.-K., et al. (2021). The influence of summer hypoxia on sedimentary phosphorus biogeochemistry in a coastal scallop farming area, North Yellow Sea. Sci. Total Environ. 759, 143486. doi: 10.1016/j.scitotenv.2020.143486
Ye T., Tan K., Zhang H., Zheng H. (2021). Potential causative factors of noble scallop Chlamys nobilis mass mortality in Nan’ao Island, Shantou, China in 2017. Sci. Total Environ. 751, 142268. doi: 10.1016/j.scitotenv.2020.142268
Keywords: scallop, Patinopecten yessoensis, valve movement, circadian rhythm, survival potential
Citation: Xun X, Wang J, Liu F, Chen L, Zou Y, Liu Y, Kong X and Hu X (2023) Valve movements indicate rhythm and survival potential of scallop. Front. Mar. Sci. 10:1129456. doi: 10.3389/fmars.2023.1129456
Received: 22 December 2022; Accepted: 27 February 2023;
Published: 15 March 2023.
Edited by:
Lingling Wang, Dalian Ocean University, ChinaReviewed by:
Yuehuan Zhang, South China Sea Institute of Oceanology (CAS), ChinaWang Minxiao, Institute of Oceanology (CAS), China
Copyright © 2023 Xun, Wang, Liu, Chen, Zou, Liu, Kong and Hu. This is an open-access article distributed under the terms of the Creative Commons Attribution License (CC BY). The use, distribution or reproduction in other forums is permitted, provided the original author(s) and the copyright owner(s) are credited and that the original publication in this journal is cited, in accordance with accepted academic practice. No use, distribution or reproduction is permitted which does not comply with these terms.
*Correspondence: Xiangfeng Kong, a3hmXzE5ODVAMTYzLmNvbQ==; Xiaoli Hu, aHhsNzA3QG91Yy5lZHUuY24=
 Xiaogang Xun
 Jingru Wang1
 Xiangfeng Kong
 Xiaoli Hu