 Alexander Osadchiev1,2*
 Zinaida Zabudkina2
 Vladimir Rogozhin1,3
 Dmitry Frey1,4
 Alexandra Gordey1
 Eduard Spivak5Anatoly Salyuk5
 Igor Semiletov5
 Roman Sedakov1
- 1Shirshov Institute of Oceanology, Russian Academy of Sciences, Moscow, Russia
- 2Moscow Institute of Physics and Technology, Dolgoprudny, Russia
- 3Marine Research Center at Lomonosov Moscow State University, Moscow, Russia
- 4Marine Hydrophysical Institute, Russian Academy of Sciences, Sevastopol, Russia
- 5Ilyichev Pacific Oceanological Institute, Far Eastern Branch of the Russian Academy of Sciences, Vladivostok, Russia
The major Siberian rivers form large river plumes in the Arctic Ocean, which govern structure of the sea surface layer at the Arctic shelf. These river plumes were explicitly studied during the warm period in summer and early autumn characterized by high river runoff and ice-free conditions. However, little is known about processes, which occur within these river plumes at the beginning of the cold season, i.e., during late autumn shortly before sea ice formation. In this study, we report in situ measurements performed in the Kara Sea in late October in 2020, 2021, and 2022. We reveal that intense convection occurs in the Ob-Yenisei plume due to heat loss from the surface layer, which is caused by transport of cold air from land to the central part of the Kara Sea. This process induces homogenization of the Ob-Yenisei plume and results in extremely sharp salinity jump (up to 10-12 at vertical distance of 1-2 m) between the plume and the subjacent seawater. This sharp gradient is not formed at the whole area of the plume except, first, at the Ob and Yenisei gulfs due to low surface salinities and the related high temperatures of maximal density and, second, at the lateral boundary of the plume due to intense horizontal mixing across the plume-sea border. As a result, autumn convection significantly modifies vertical structure of the Ob-Yenisei plume that could affect its further spreading below sea ice during winter season.
1 Introduction
The Kara Sea receives large river runoff (1350-1500 km3, mainly from the Ob and Yenisei rivers), which accounts for one quarter of total river discharge to the Arctic Ocean (Gordeev et al., 1996). It results in formation of the Ob-Yenisei plume with the area of 200 000 – 250 000 km2 during ice-free period, which is among the largest river plumes in the World Ocean (Frey and Osadchiev, 2021; Osadchiev, 2021; Osadchiev et al., 2021a). In the last two decades, many oceanographic surveys were performed in the Kara Sea during warm period (Pavlov and Pfirman, 1995; Johnson et al., 1997; McClimans et al., 2000; Morozov et al., 2008; Zatsepin et al., 2010, Zatsepin et al., 2015; Zavialov et al., 2015; Zatsepin et al., 2017; Osadchiev et al., 2017; Osadchiev et al., 2019; Osadchiev et al. 2020a; Osadchiev et al., 2020b; Osadchiev et al., 2021b), which provided general understanding of structure and dynamics of the Ob-Yenisei plume from July to September summarized by (Osadchiev et al., 2021a). Initial formation of the Ob-Yenisei plume occurs in June-July during the freshet period at the Ob and Yenisei rivers (total runoff of 100 000 – 150 000 m3/s). Salinities within the plume are 5-15 bounded by sharp vertical salinity gradient (3-5 psu/m) at the plume-sea interface. Later in August and September the plume steadily expands, while its surface salinities increase from 5-15 to 15-25 and vertical stratification at the plume-sea interface relaxes to 1-2 psu/m (Osadchiev et al., 2021a). The boundary between the Ob-Yenisei plume and the surrounding saline seawater is determined as the maximal salinity gradient for both vertical and horizontal dimensions. Generally, this gradient is located at the isohalines of ~20–30, however, it could be more or less pronounced (Osadchiev et al., 2021a).
Oceanographic measurements in the Kara Sea during cold period (October – June when air temperatures are< 0°C) are very scarce due to hard weather and ice conditions. As a result, little is known about structure and dynamics of the Ob-Yenisei plume from October to June. However, the external forcing conditions during the cold season are significantly different as compared to the late summer and early autumn due to (1) reduced river discharge (10 000 – 20 000 m3/s), (2) low air temperature, (3) presence of ice coverage. Scarce measurements in the ice-covered Kara Sea during late winter and spring revealed that surface salinity in the central part of the sea increases to 30-32, while low salinities remain only in the Ob and Yenisei gulfs (Fedulov et al, 2018; Mosharov et al., 2018). However, the fate of the Ob-Yenisei plume during cold season is still unknown, in particular its transformation in late autumn, which preconditions its dissipation and/or advection off the Kara Sea by the end of winter.
In this study, we report in situ measurements performed in the Kara Sea in late October in 2020, 2021, and 2022. These measurements reveal the structure of the Ob-Yenisei plume shortly before ice formation. We describe processes, which determine vertical structure of the plume during late autumn and precondition its buoyancy-driven dynamics in the ice-covered Kara Sea. This paper is organized as follows. In Section 2, we provide general information about, first, the in situ data, satellite-derived sea ice data and wind reanalysis analyzed in this work and, second, the numerical model of convection in the plume. The detailed analysis of in situ measurements and the description of the structure of the Ob-Yenisei plume in late October are provided in Section 3. Section 4 addresses convection in the Ob-Yenisei plume and its dependence on external forcing conditions, followed by the conclusions in Section 5.
2 Data and methods
2.1 Data used
Hydrographic in situ data used to study the Ob-Yenisei plume were collected during four oceanographic surveys in the Kara Sea onboard the research vessels “Akademik Mstislav Keldysh”, “Professor Logachev”, and “Aleksey Maryshev”. All cruises were performed during the beginning of cold period in late October, i.e., on 25-26 October 2020, 13-28 October 2021, and 19-20 October 2022, and shortly before ice formation at the areas of measurements (1-7 days). The vertical thermohaline structure was measured using a CTD instrument (SBE 911plus, SBE19plus, and RBRconcerno) at 0.2-m spatial resolution. In situ measurements between the Ob and Yenisei gulfs (zonal transects T1 and T2, green hexagons and black stars in Figure 1) were organized in October 2020 and October 2021. In situ measurements across the central and northern parts of the Ob-Yenisei plume (meridional transect T3, red circles in Figure 1) were organized in October 2021. In situ measurements across the eastern part of the Ob-Yenisei plume (transects T4 and T5, blue triangles and brown squares in Figure 1) were organized in October 2021 and October 2022. Also, in this study we analyzed vertical in situ thermohaline measurements performed at selected stations at the Ob-Yenisei plume during oceanographic cruises in September 2011 and August 2021 described in (Osadchiev et al., 2021a; Osadchiev et al. 2022a). Wind forcing conditions were examined using ERA5 atmospheric reanalysis with a 0.25° spatial and hourly temporal resolution (Hersbach et al., 2020). The ERA5 reanalysis data were downloaded from the European Centre for Medium-Range Weather Forecasts (ECMWF) website (https://www.ecmwf.int/en/forecasts/datasets/archive-datasets/reanalysisdatasets/era5).
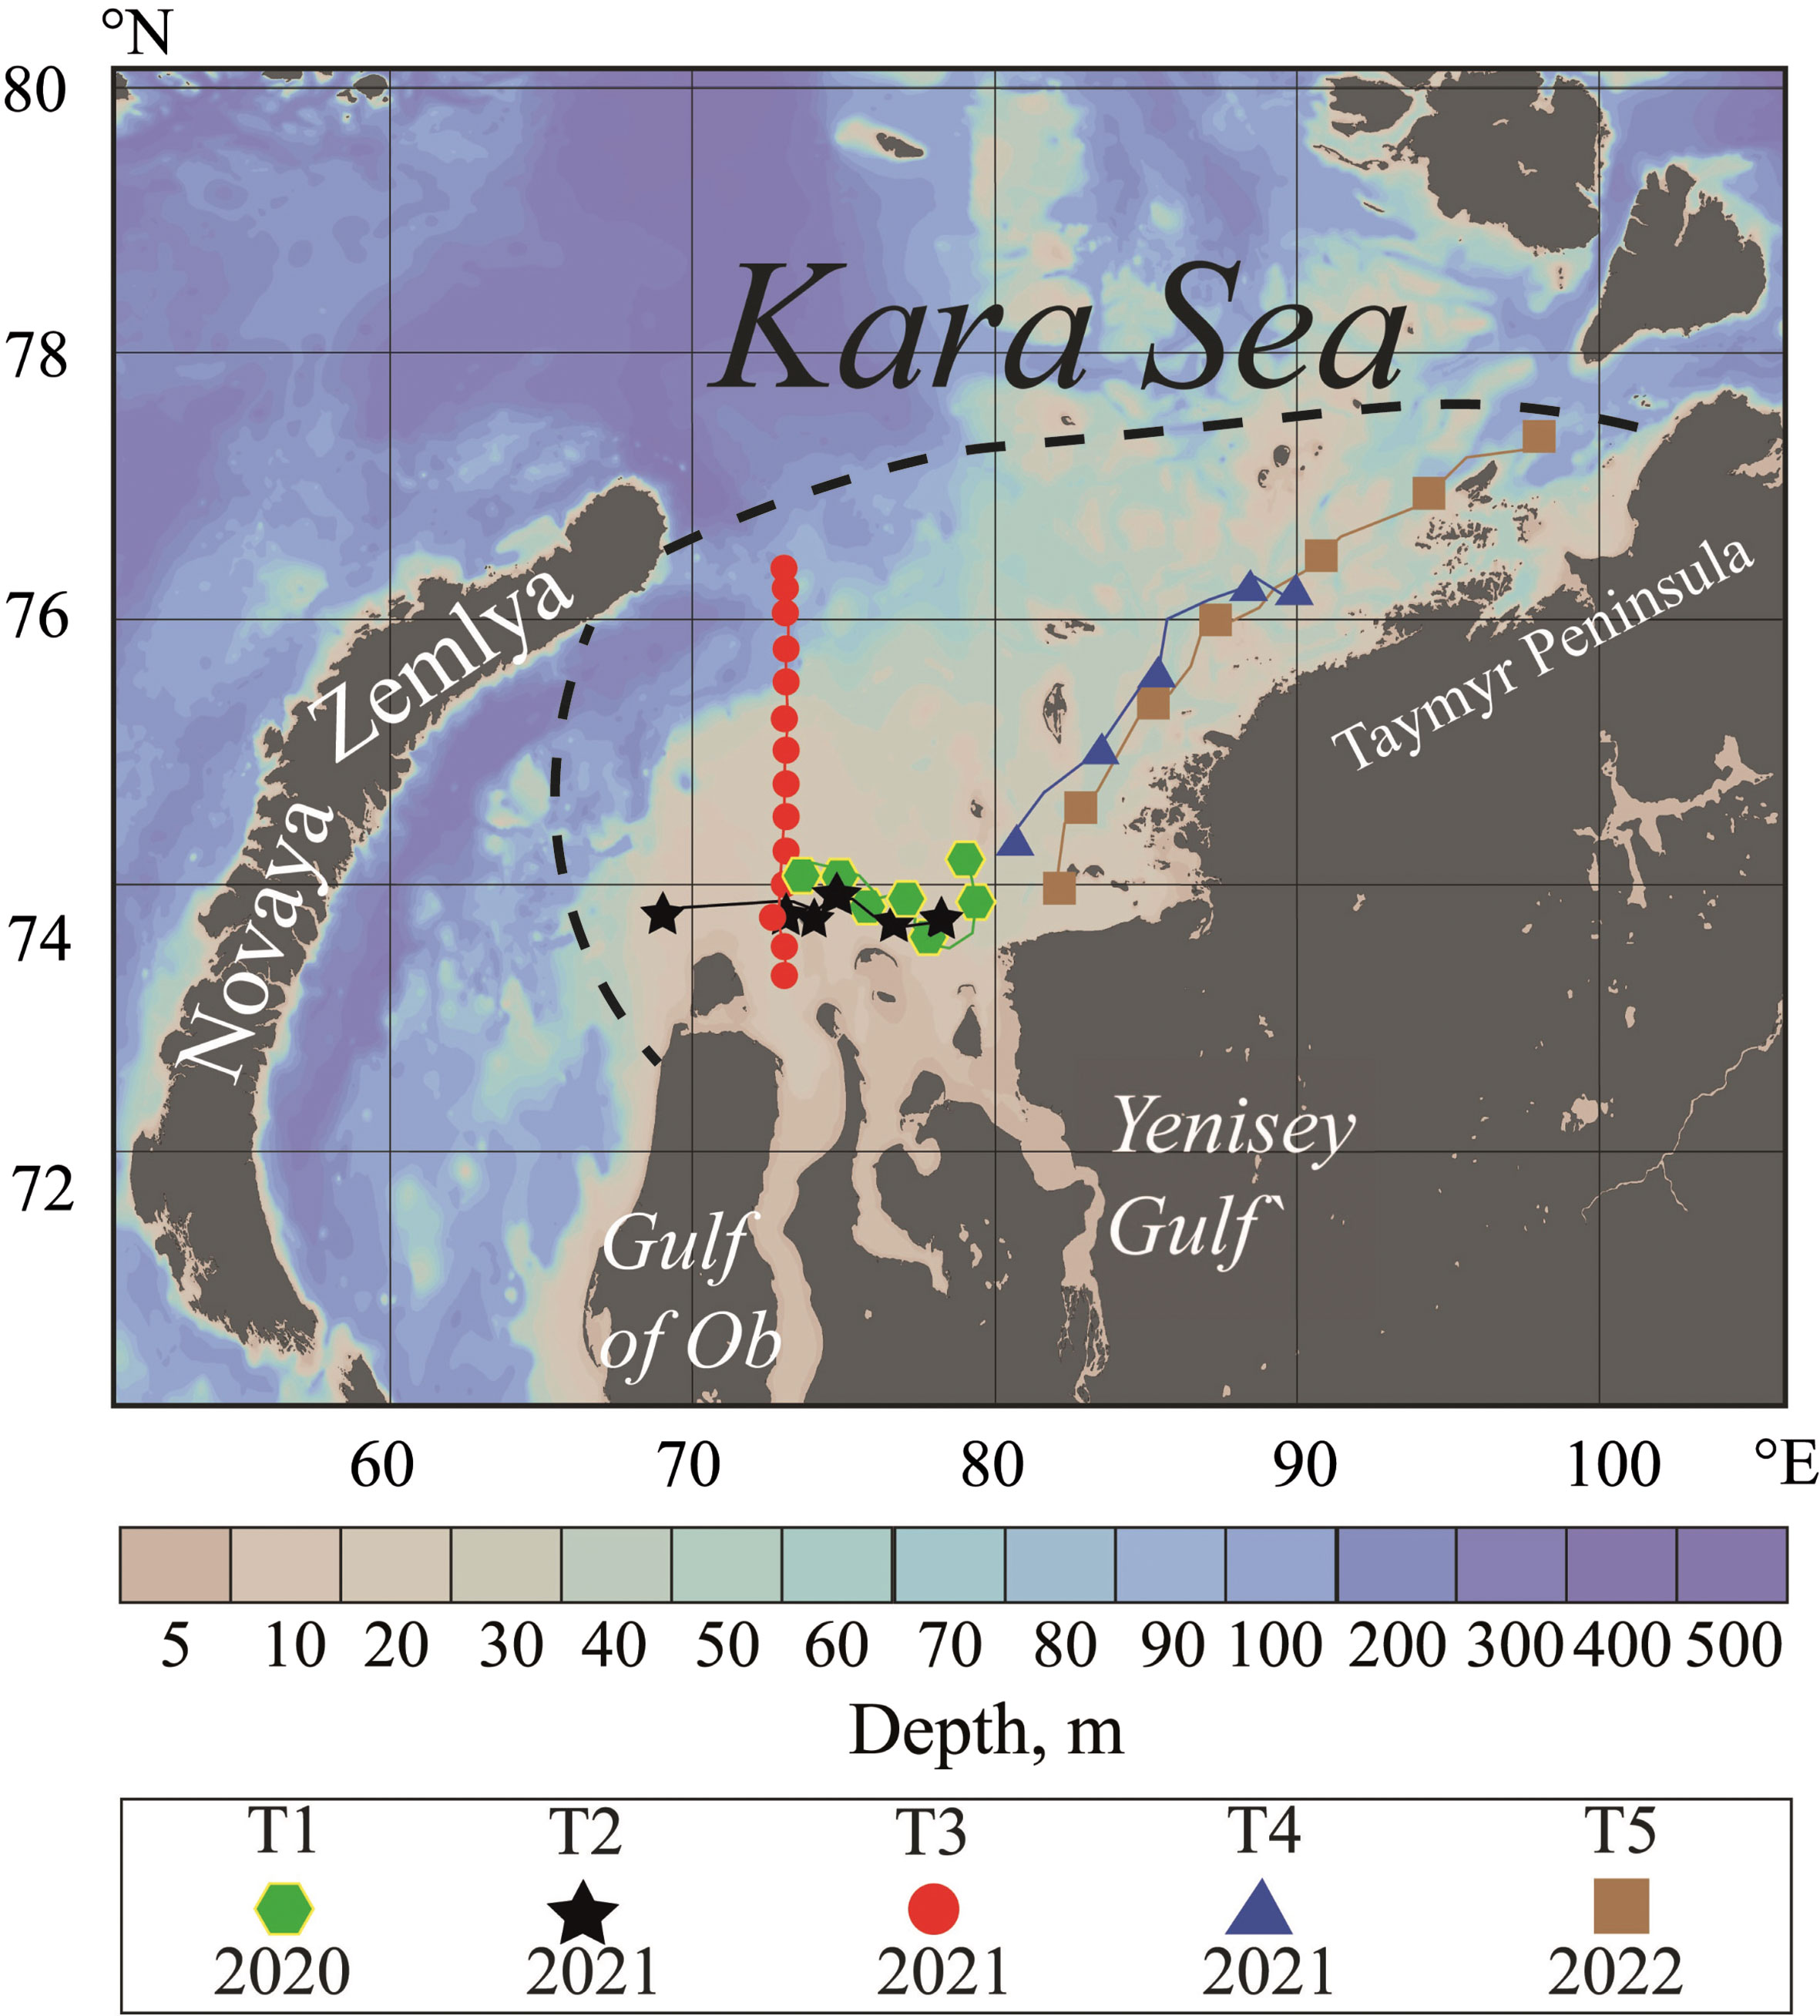
Figure 1 A map of the study area in the Kara Sea and locations of hydrographic stations on 25-26 October 2020 (green hexagons, transect T1), 24-28 October 2021 (black stars, transect T2), 21-26 October 2021 (red circles, transect T3), 13-15 October 2021 (blue triangles, transect T4), 19-20 October 2022 (brown squares, transect T5). The dashed black line indicates location of the Ob-Yenisei plume border during the periods of field surveys.
2.2 Numerical model
In this study, we developed simple one-dimensional model to investigate convection in the Kara Sea induced by rapid cooling of air temperature during late autumn. Convection is determined by heat loss from sea surface resulting in increase of density of upper sea layer and its further overturning, which effectively homogenizes the mixed layer and increases its depth (Marshall and Schott, 1999). The applied one-dimensional model of convection represents vertical water column as a set of layers with fixed vertical size and changing temperature and salinity. At every modeling step, the uppermost layer experiences heat loss due to its interaction with cold air. Temperature of this layer decreases, while its density increases. This process progresses downwards due to heat exchange within the water column. Heat exchange in the water column is determined by the equation. with boundary conditions. , where T is the temperature of water, Kt is the turbulent thermal diffusivity, ρ0 is the density of water layer, cp is the specific heat capacity of water, Q is the heat flow through the sea surface, H is the sea depth (Wells et al., 2009; Landau and Lifshitz, 2013). The thermal turbulent diffusivity Kt was prescribed equal to 10-5 m2/s according to (Schmitt and Olson, 1985). An implicit scheme and a sweep method are used to numerically solve this thermal equation. Change of temperature of the uppermost layer because of heat exchange with atmosphere is described by the equation Q=caρacHV(Ta−Ts) where ca is the specific heat capacity of air at constant pressure, ρa is the air density, cH is the Stanton number, V is the wind speed, Ta and Ts are the air and sea surface temperature, respectively (Smith, 1989; Brickman, 1995).
As a result of cooling, density of upper layers (calculated using the equation of state EOS-80) increases and they sink downwards to the related density levels. In order to reproduce this process, the vertical set of layers is sorted to obtain steadily increasing density from surface to sea bottom. We presume that cooling of the surface layer is much slower than vertical convection flow and mixing in the water column (Marshall and Schott, 1999). Therefore, the resulting depth of vertical convection at the model step is averaged by temperature and salinity to reproduce homogenization of the mixed surface layer. In addition, the model reproduces turbulent mixing at the interface between convective and non-convective parts of the water column caused by abrupt deceleration of the vertical convective flow (Marshall and Schott, 1999; Canuto et al., 2004). For this purpose, once the convective zone expanded below the mixed layer, the latter was extended downward by 0.2 m.
The spatial step in the computational grid, i.e., the fixed vertical size of sea layers, was equal to 0.5 cm according to the characteristic size of the surface thermal boundary layer (Wells et al., 2009). Decrease of this size induces decrease of thermal flux during a model step; as a result, convection penetrates to smaller depths than those observed by in situ measurements. The model time step was prescribed equal to 6 h according to (Schmitt and Olson, 1985). Decrease of this time step similarly results in decrease of both thermal flux and convection depth. Salt diffusion is not reproduced in the model, because it is much slower than salt exchange by turbulent mixing during convection.
3 Results
The main motivation of this study is provided by large differences in vertical salinity structure in the central part of the Kara Sea covered by the Ob-Yenisei plume between August – September and late October (Figure 2). In situ measurements performed during different years in the study area in August – September clearly demonstrate relatively steady increase of salinity from surface to bottom with maximal salinity gradient at the depths of 5-15 m associated with the vertical boundary between the Ob-Yenisei plume and subjacent saline sea (Figure 2A). This structure abruptly changes by late October, which is manifested by homogenization of the surface river plume layer and formation of very sharp salinity gradient at the plume-sea interface (Figure 2B). Vertical structure of the Ob-Yenisei plume in August – September was described and analyzed in detail in our recent paper (Osadchiev et al., 2021a), while in this paper we focus on the processes, which occur in the plume in late October shortly before ice formation.
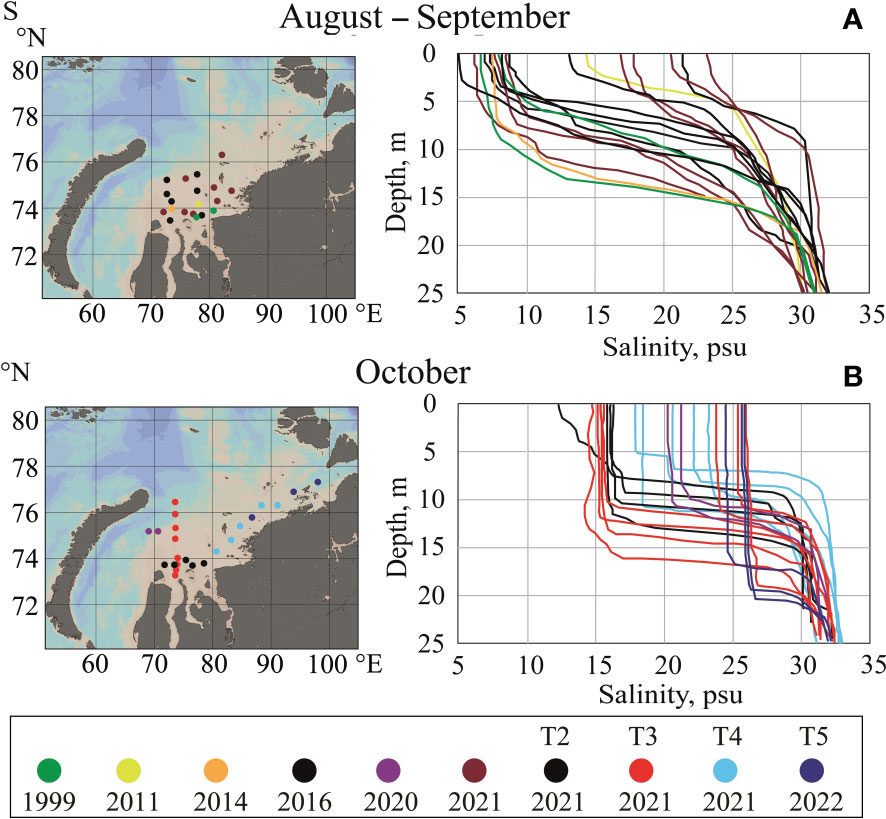
Figure 2 Typical vertical salinity structure in the Ob-Yenisei plume in August – September (A) and October (B).
Measurements at the central part of the Ob-Yenisei plume near the Ob and Yenisei gulfs were performed along transect T1 in October 2020 (Figure 3) and transect T2 in October 2021 (Figure 4). In both cases, salinities of the Ob-Yenisei plume were equal to 14-18, while salinities below the plume were equal to 28-32 (Figures 3A, 4A). Depth of the plume was equal to 10-15 m along both transects. Vertical salinity gradients at the plume-sea interface were very large, namely, 1-5 psu/m in October 2020 and 4-8 psu/m in October 2021 (Figures 3C, 4C). In particular vertical distance between the isohalines of 20 and 28 did not exceed 1-2 m at all hydrographic stations of transect T3 (Figure 4A). Vertical salinity gradients within the plume, on the opposite, were very low and did not exceed 0.5 psu/m (Figures 3C, 4C). Due to low air temperatures in late October 2020 (-2.5 – -2°C) and especially in late October 2021 (-6.5 – -5°C) and the resulting intense cooling of sea surface layer, its temperatures were equal to -0.5 – 0°C in October 2020 and -1 – -0.5°C in October 2021 (Figures 3B, 4B). Temperatures below the Ob-Yenisei plume also were low (-1 – -0.5°C) during both years, while much greater temperatures (0.5-1.5°C) were observed at the plume-sea interface associated with the largest salinity gradients (Figures 3B, 4B). Note that measurements in 2020 and 2021 were performed during almost the same dates; therefore, we associate the observed differences in vertical thermohaline structure of the Ob-Yenisei plume with different atmospheric conditions during these years. These differences were not caused by the inter-annual variability of discharge conditions of the Ob and Yenisei rivers, which were relatively small during the considered years. In particular, total discharge volumes of the Ob and Yenisei rivers during 2020, 2021, and 2022 were 1090, 1162, and 1067 km3, respectively.
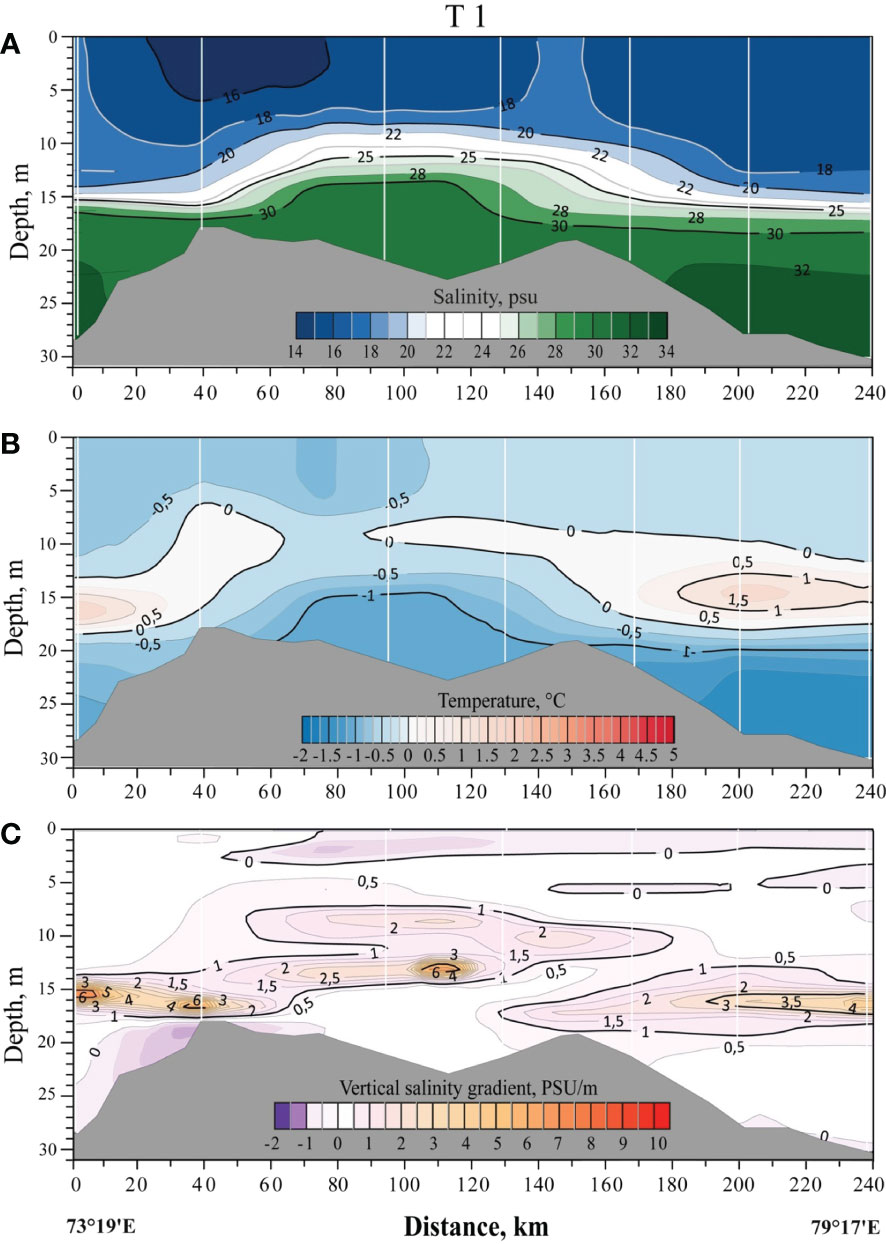
Figure 3 Vertical distribution of salinity (A), temperature (B), and vertical salinity gradient (C) along transect T1 on 25-26 October 2020.
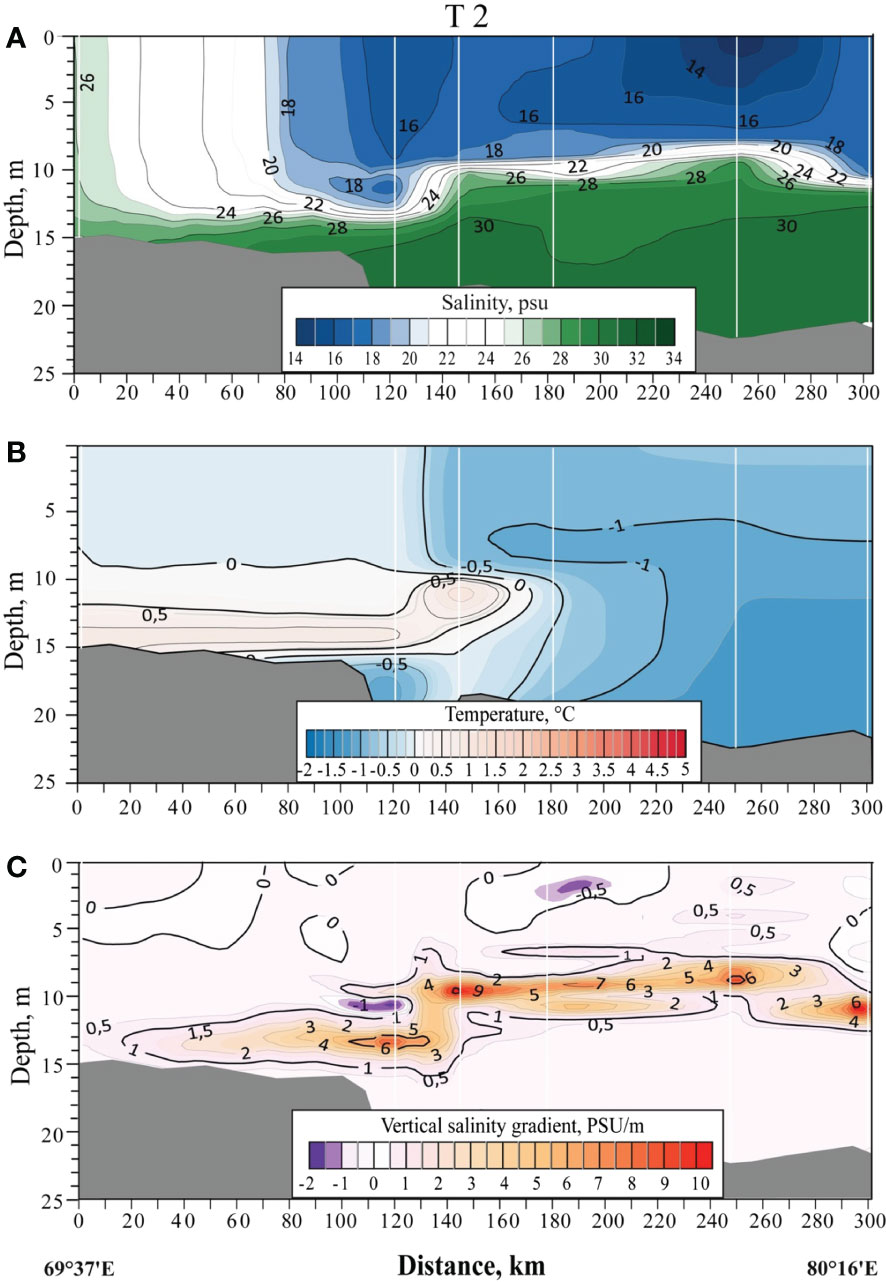
Figure 4 Vertical distribution of salinity (A), temperature (B), and vertical salinity gradient (C) along transect T2 on 24-28 October 2021.
Measurements at the northern part of the Ob-Yenisei plume were performed along transect T3 in October 2021 (Figure 5). Surface salinities along transect T3 increased from 15-18 near the Gulf of Ob to 20-25 at the northern part of the plume, while salinities below the plume were 30-32 (Figure 5A). Vertical salinity gradient at the bottom boundary of the Ob-Yenisei plume was sharp at the southern and central parts of transect T3 (3-5 psu/m), the vertical distance between the isohalines of 20 and 30 was 2-3 m (Figure 5C). At the northern part of the transect, the vertical gradient relaxed to 0.5-1 psu/m and the related distance increased to 8-10 m. Depth of the plume was equal to 9-13 m along the southern and central parts of transect T3. Vertical salinity gradients within the plume did not exceed 0.5 psu/m (Figure 5C). Temperatures of the surface layer were equal to -0.2 – 0°C (Figure 5B). Temperatures below the plume were high at the northern deep part of the transect (up to 2-4°C) and near the Gulf of Ob (0.5-1°C), while at the central part of the transect, on the opposite, temperatures were -0.5 – -0.2°C (Figure 5B).
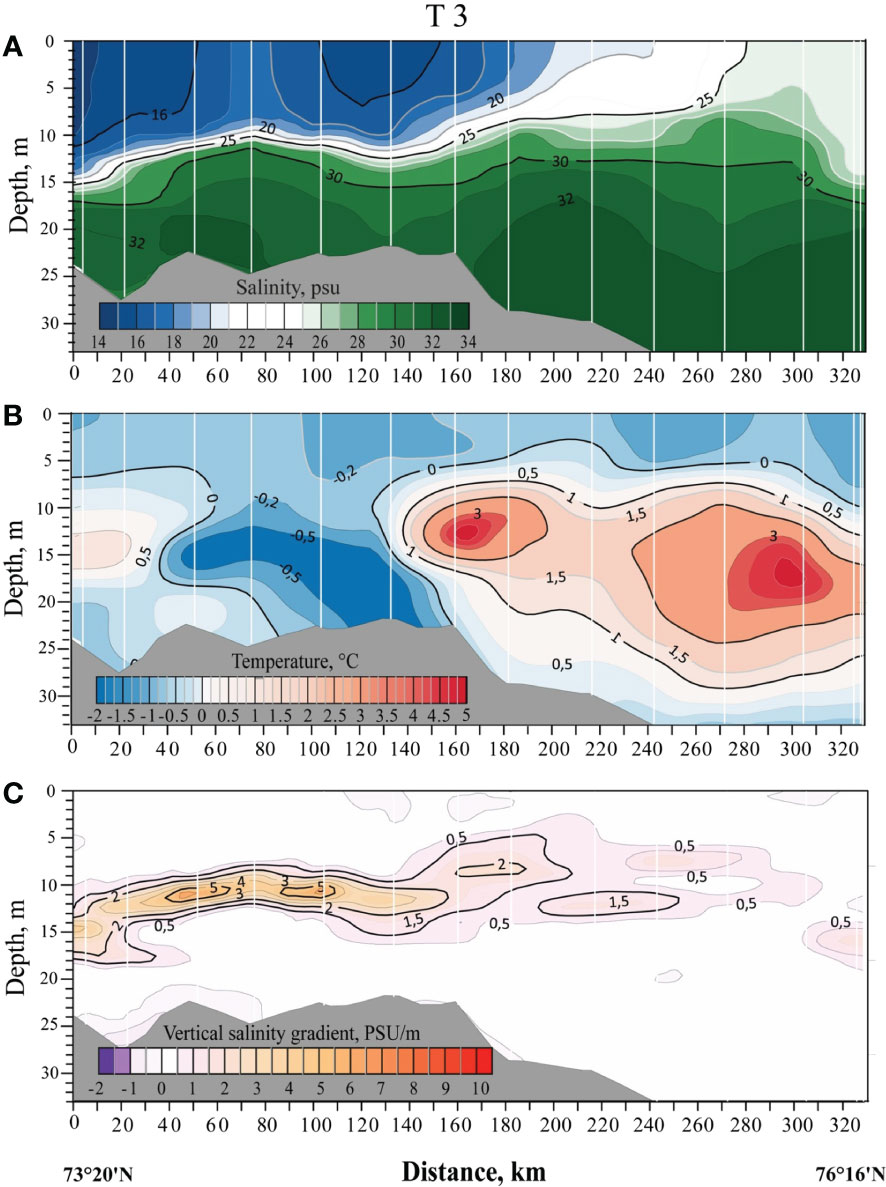
Figure 5 Vertical distribution of salinity (A), temperature (B), and vertical salinity gradient (C) along transect T3 on 21-24 October 2021.
In situ measurements reveal presence of the temperature maximum at the plume-sea interface at the central and northern parts of the plume, i.e., along transects T1, T2, and T3 (Figures 3C, 4C, 5C). This temperature maximum is formed due to the following reasons. During the majority of the ice-free period, the Ob-Yenisei plume waters are much warmer than ambient saline seawater, because watershed basins of the Ob and Yenisei rivers are extended several thousands of kilometers southward from the Kara Sea. In July, this contrast is the most prominent with temperatures >10°C in the Ob-Yenisei and<0°C at the subjacent seawater (Osadchiev et al., 2021a). In August and September, the temperatures steadily decrease to 2-4°C in the Ob-Yenisei plume due to cooling of the surface layer and increase to 0-1°C in the subjacent seawater till the depths of 20-25 m due to thermal exchange at the vertical plume-sea interface. Intensified air-sea cooling in October results in formation of temperature maximum at the plume-sea interface. Later in November, the temperature maximum vanishes due to the ongoing thermal exchange. The bottom shelf waters in this region (below the depths of 25-30 m) remain cold (<0°C) throughout the year.
Measurements at the eastern part of the Ob-Yenisei plume were performed along transect T4 in October 2020 (Figure 6) and transect T5 in October 2021 (Figure 7). Surface salinities along both transects increased from 18-20 near the Yenisei Gulf to 25-27 at the eastern part of the plume, while salinities below the plume were 30-32 (Figures 6A, 7A), which is generally similar to Transect T3 (Figure 5A). However, vertical salinity gradient at the plume-sea interface along transect T4 (1-3 psu/m) and especially along transect T5 (0.5-1 psu/m) were much smaller than those along transects T1-T3. Similarly to transects T1-T3, vertical salinity gradients within the plume did not exceed 0.5 psu/m (Figures 6C, 7C). Depth of the plume was equal to 10-15 m along Transect T4 and to 15-20 m along Transect T5. Temperatures of the surface layer decreased from west to east from 0 to -1° along Transect T4 (Figure 6B) and from 1 to 0°C along Transect T5 (Figure 7B) due to lower air temperatures in late October 2021 (-6.5 – -5°C) as compared to late October 2022 (-4 – -2.5°C). Temperatures below the plume were< -1°C along transect T4 (Figure 6B) and< -0.5°C along Transect T5 (Figure 7B). We do not observe temperature maximum at the eastern part of the plume along transects T4 and T5 (Figures 6C, 7C) presumably because initial temperature difference between the plume and the subjacent sea is much smaller due to its location far off the Ob and Yenisei gulfs. As a result, distinct temperature maximum does not form at this part of the plume.

Figure 6 Vertical distribution of salinity (A), temperature (B), and vertical salinity gradient (C) along transect T4 on 13-15 October 2021.
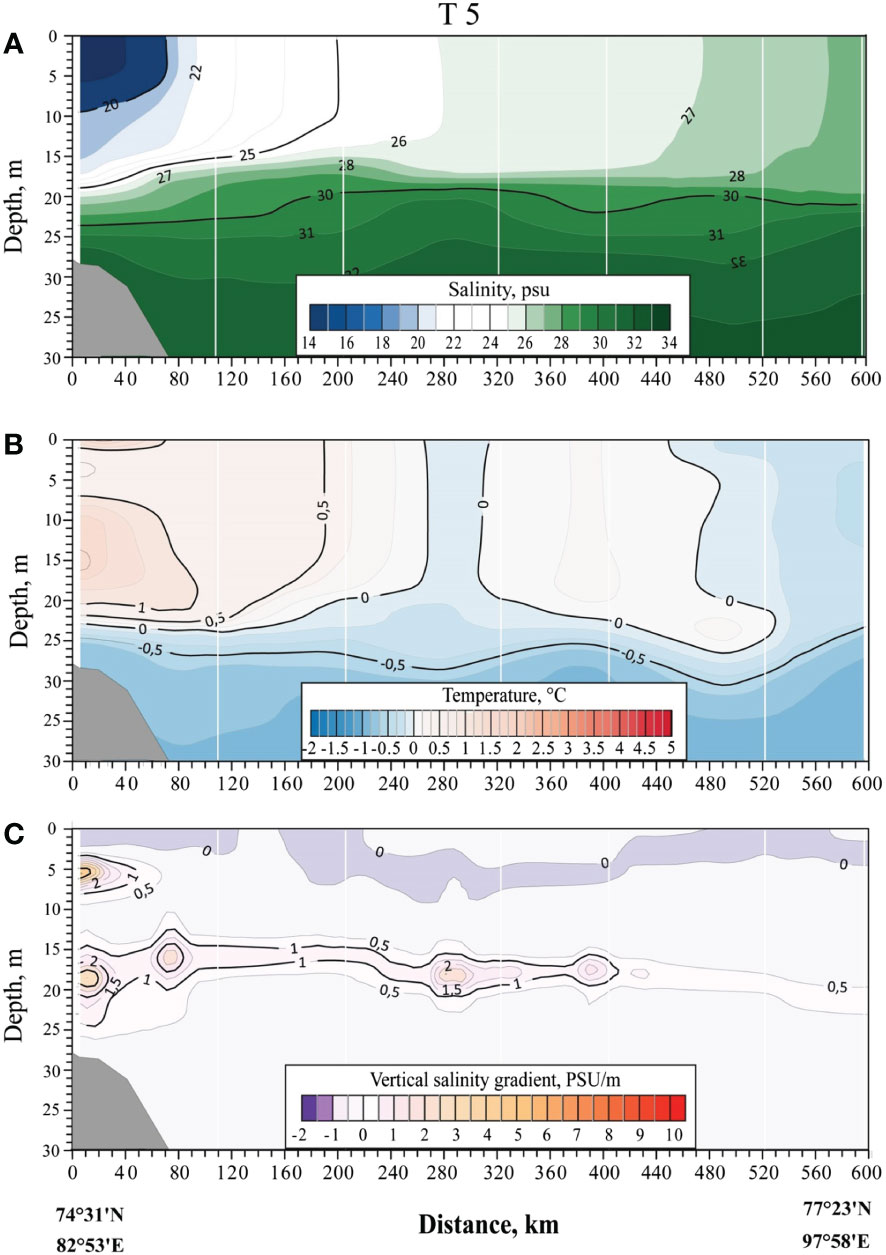
Figure 7 Vertical distribution of salinity (A), temperature (B), and vertical salinity gradient (C) along transect T5 on 19-20 October 2022.
4 Discussion
In situ measurements performed in the Kara Sea in late October demonstrated significant differences in vertical thermohaline structure of the Ob-Yenisei plume as compared to its state in August-September (Figure 2). The most prominent feature of the Ob-Yenisei plume, which is regularly observed in late October, is a very narrow and sharp vertical gradient zone between the plume and the subjacent saline sea. In particular, at certain areas of the plume-sea interface, salinity increased from 16-18 to 28-30 at vertical distance of 1-2 m (black lines in Figure 8), which is among the largest vertical salinity gradients measured in the World Ocean.
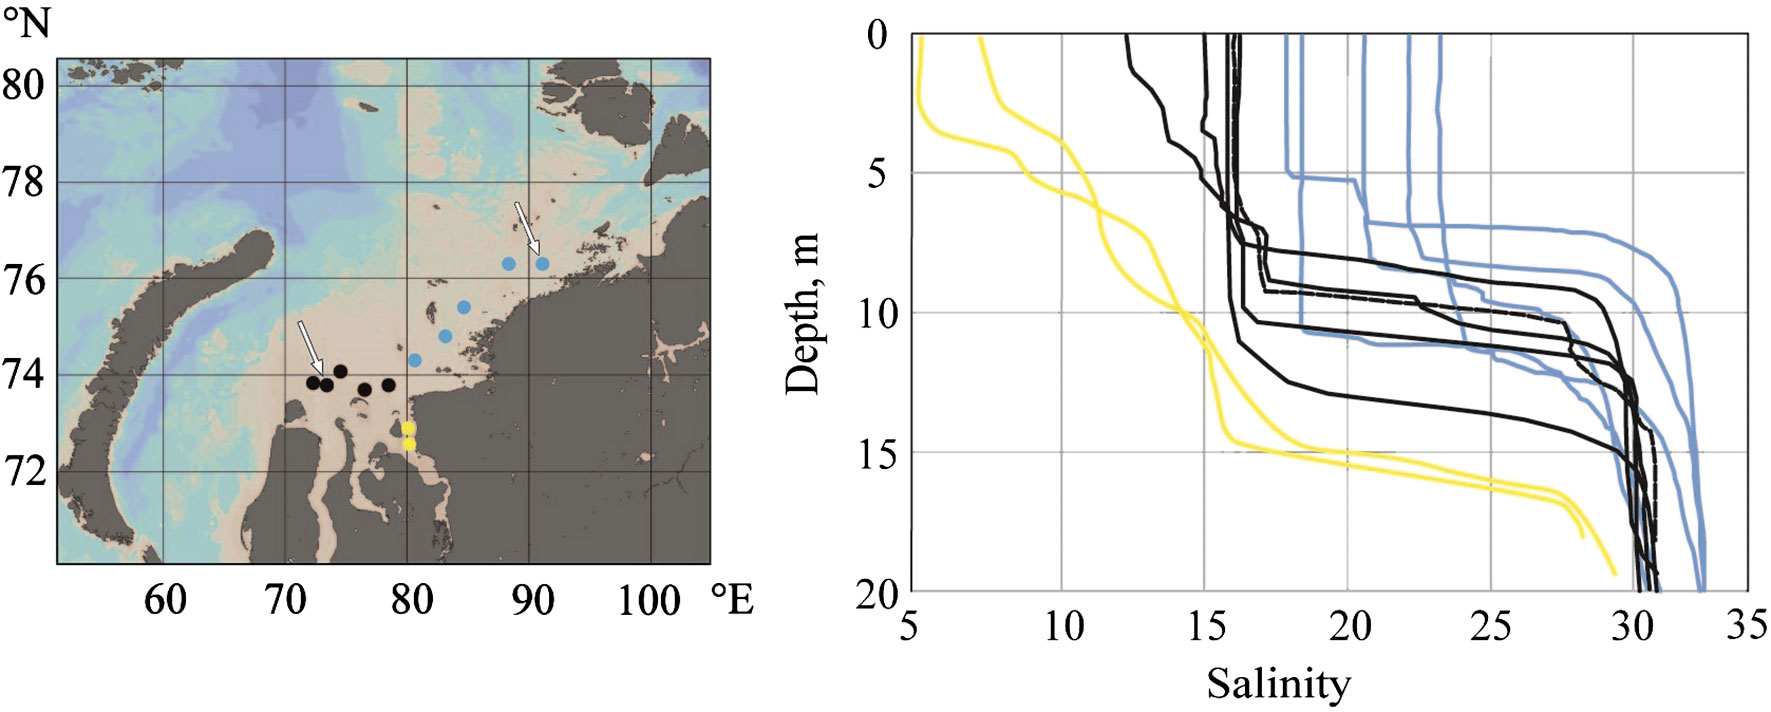
Figure 8 Vertical salinity profiles in the central part of the Ob-Yenisei plume (black circles and lines), eastern part of the Ob-Yenisei plume (blue circles and lines), and the Yenisei Gulf (yellow circles and lines) in October 2021. White arrows indicate two stations in the central and eastern parts of the Ob-Yenisei plume, which were used for validation of the numerical model demonstrated in Figures 9 and 10.
Similar sharp salinity gradients were previously reported at river plumes formed by small rivers in absence of strong external forcing (winds, tides, coastal currents) (McPherson et al., 2020; Osadchiev et al., 2020d; Osadchiev et al., 2022b), however, to the extent of our knowledge, they were never reported at large river plumes. Indeed, sharp salinity gradients at small river plumes are formed close to freshwater sources at river mouths as a result of primary frontogenesis. These gradients represent small residence time (order of hours) of river water within river plumes and subsequently relax due to mixing at the plume-sea interface. Dissipation of freshened water as a result of mixing of a small plume with subjacent saline sea limitedly influence ambient sea and does not result in accumulation of freshwater in adjacent sea area. Therefore, saline seawater remains almost unmodified near river mouth below a small plume. This is the second important factor of formation of sharp salinity gradients by primary frontogenesis in small plumes. This is not the case of large plumes, because their mixing with saline seawater significantly decreases salinity of the ambient sea. As a result, primary frontogenesis in large plumes near river mouths does not provide sharp salinity gradients.
Sharp salinity gradients in the Ob-Yenisei plume are observed at wide areas far from river estuaries and represent river water with large residence time (order of weeks and months); therefore, they are not related to primary frontogenesis. Moreover, these gradients are not observed in September and early October (Osadchiev et al., 2021a); therefore, they are formed during several weeks or less. We presume that these gradients are formed as a result of convection process induced by cooling and overturning of surface layer at the beginning of the cold season in the Kara Sea. This process induces vertical mixing in the plume, increases its depth, and homogenizes its salinity. The plume-sea interface becomes entrained into the mixed layer and steadily erodes. On the other hand, convection does not penetrate below the plume-sea interface because of high salinity and density of the subjacent seawater. It results in formation of a very narrow and sharp vertical gradient zone between the plume and the subjacent saline sea. This secondary frontogenesis associated with autumn convection occurs at the majority of the area of the Ob-Yenisei plume.
In order to prove the assumption about formation of sharp salinity gradients at the Ob-Yenisei plume, we developed a one-dimensional numerical model simulating convection in the Kara Sea from the middle of August till the end of October (Figures 9, 10). One-dimensional models were widely used to study convection in different parts of the World Ocean in previous studies (Schmitt and Olson, 1985; Marshall and Schott, 1999; Canuto et al., 2004). Similarly to these studies in the open sea, one-dimensional model could adequately reproduce convection in the Ob-Yenisei plume due to the following reasons. First, the Ob-Yenisei plume is large, therefore, its thermohaline structure is relatively homogenous in the horizontal direction (Osadchiev et al., 2021a). It is not totally homogenous, in particular, salinity increases from estuaries to the outer part of the plume. Nevertheless, large horizontal salinity gradients are observed only at the lateral plume border. Second, the area and position of the Ob-Yenisei plume is stable in October due to decreased river discharge. Active expanding of the plume, which is caused by flooding at the Ob and Yenisei rivers, ends by September (Osadchiev et al., 2021a). Third, the modeled convection process is induced by atmospheric cooling and, therefore, occurs simultaneously at the whole plume area. Duration of active convection is very quick (several weeks), which is a smaller time scale than the pronounced seasonal variability of the Ob-Yenisei plume.
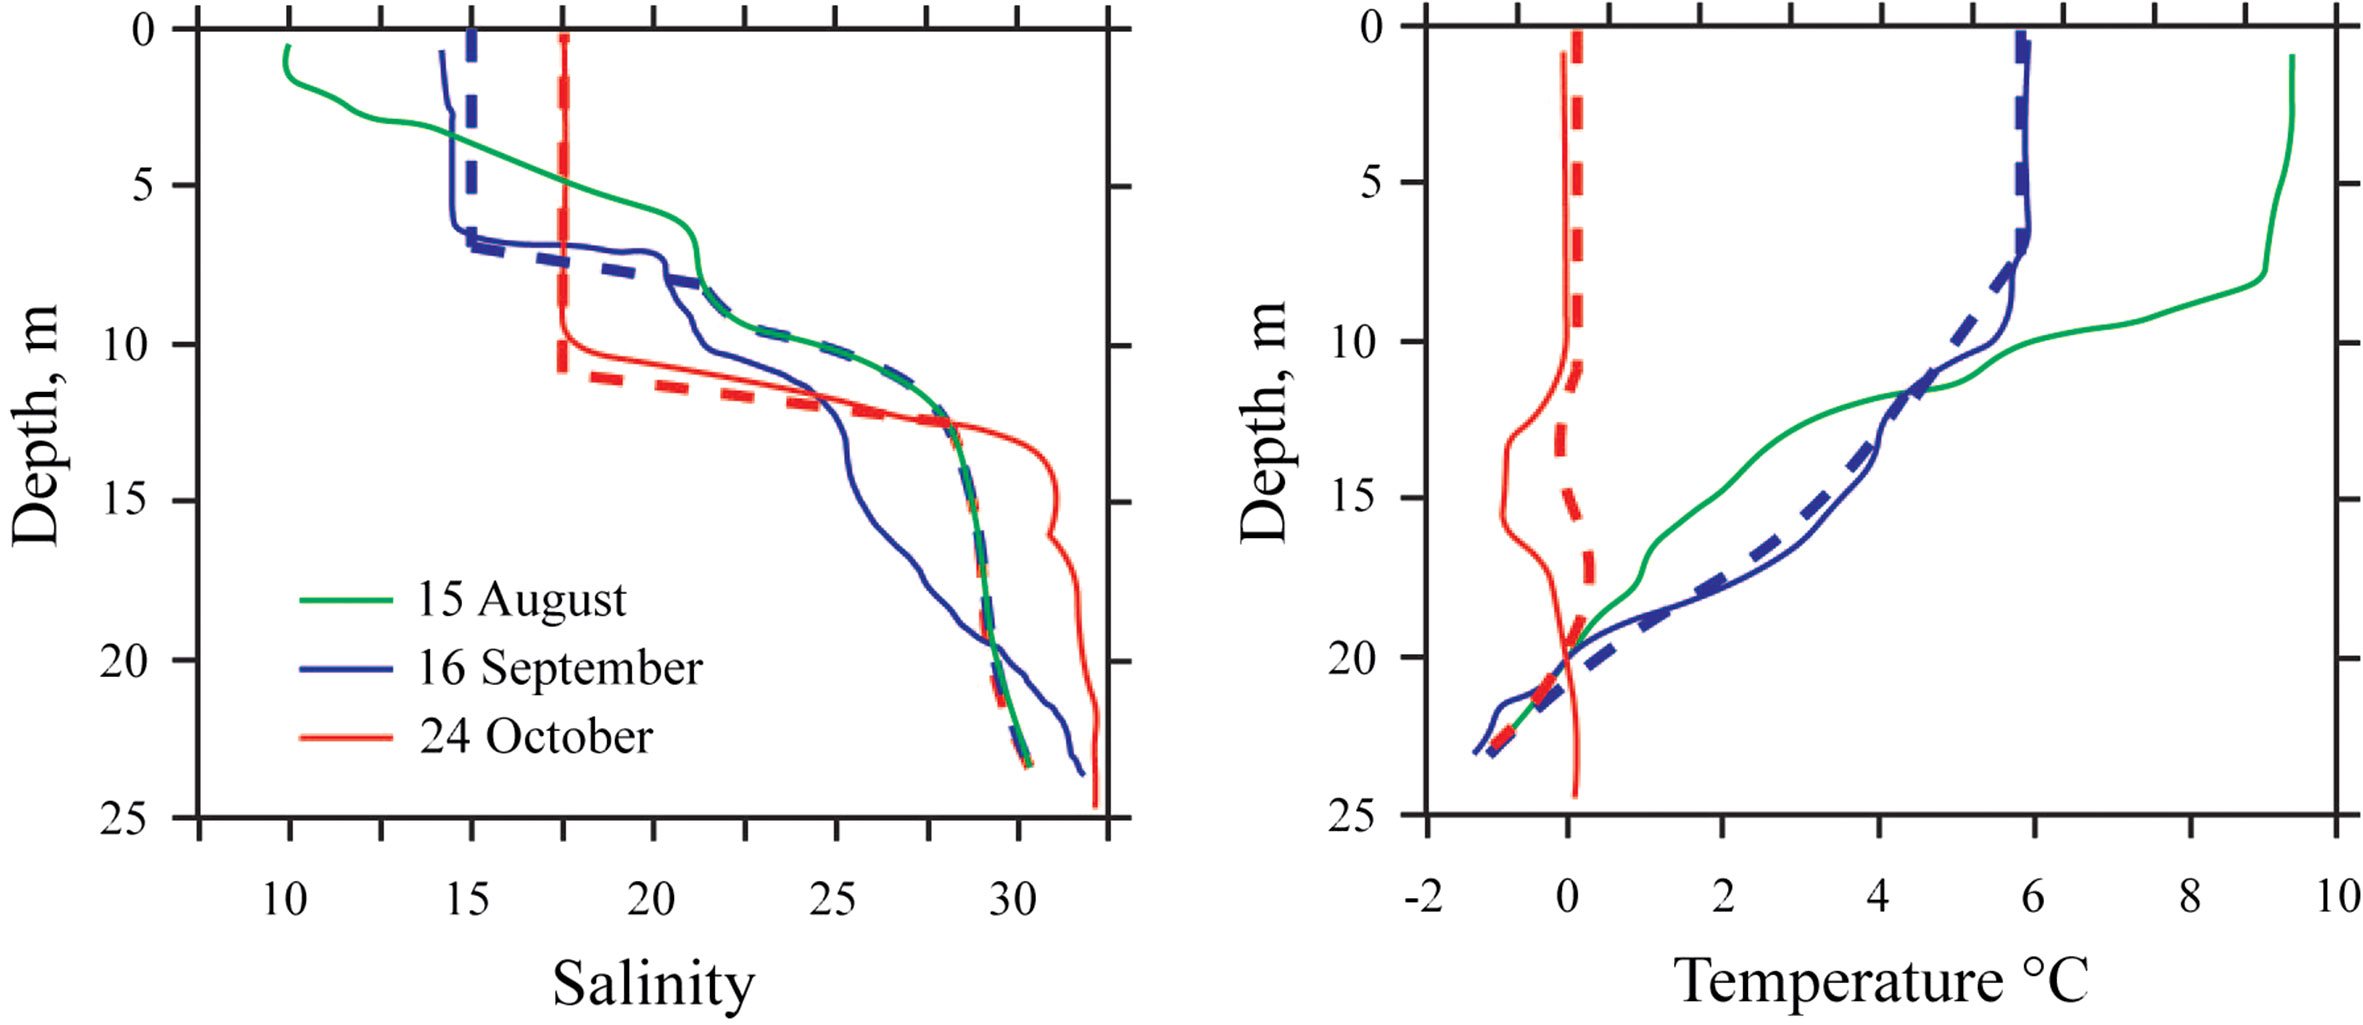
Figure 9 Vertical salinity (left) and temperature (right) structure in the central part of the Ob-Yenisei plume in the middle of August (green line), middle of September (blue lines), and late October (red lines) according to in situ measurements (solid lines) and numerical modeling (dashed lines). Location of the in situ measurements is shown by the left white arrow in Figure 8.

Figure 10 Vertical salinity (left) and temperature (right) structure in the eastern part of the Ob-Yenisei plume in the middle of August (green line) and late October (red lines) according to in situ measurements (solid lines) and numerical modeling (dashed lines). Location of the in situ measurements is shown by the right white arrow in Figure 8.
Initial thermohaline structure of vertical water column in the numerical model was prescribed according to in situ measurements performed at the Ob-Yenisei plume. The resulting vertical structure was validated against in situ measurements. Air temperature (Figure 11G) and wind speed (Figure 11H) and were prescribed as external forcing conditions from ERA5 atmospheric reanalysis. The central part of the Ob-Yenisei plume in the middle of August is characterized by temperatures of 5-9°C and salinities of 10-15 [see Figures 6-9 in (Osadchiev et al., 2021a)]. Below the plume temperatures decrease to -1 – 1°C at the depths of 20-30 m, while salinities increase to 30-32. The vertical interface between the plume and the subjacent seawater is 5-10 m wide, the vertical salinity gradient is 2-3 psu/m. A typical vertical distribution of salinity and temperature in the central part of the Ob-Yenisei plume in the middle of August is shown in Figure 9 (solid green line).
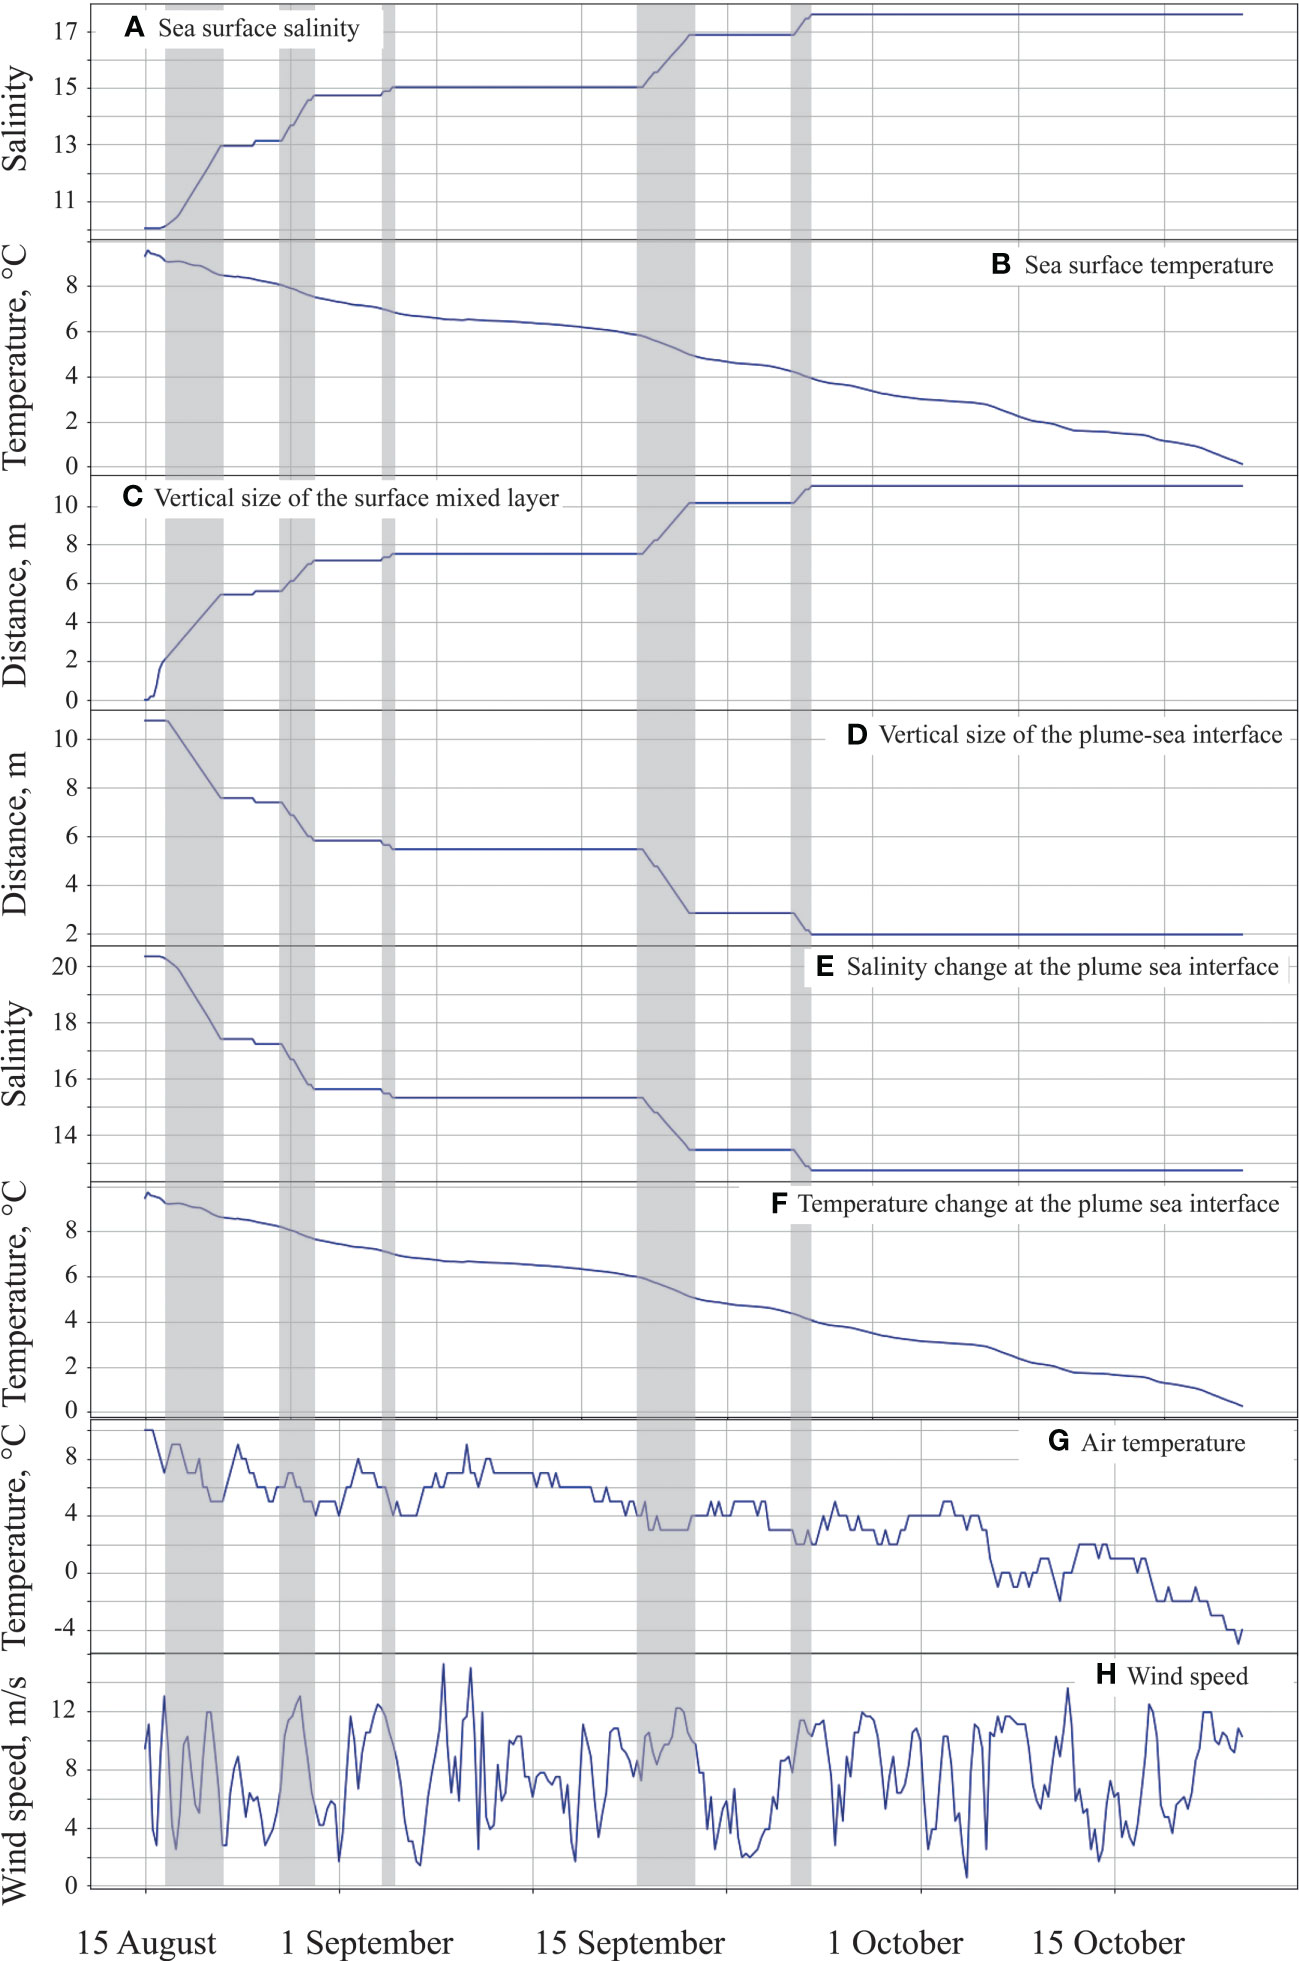
Figure 11 Surface salinity (A) and temperature (B), vertical sizes of the surface mixed layer (C) and the plume-sea interface (D), temperature (E) and salinity (F) changes at plume-sea interface, air temperature (G) and wind speed (H) during the period of numerical modeling of vertical structure of the central part of the Ob-Yenisei plume from the middle of August till late October. Gray bands indicate periods of intense convection.
Cooling of the surface layer of the Ob-Yenisei plume starts in September and is intensified in October (Figure 11B) due to abrupt decrease of air temperature (to 2-4°C in late September and<0°C in October) (Figure 11G) which is advected to the Kara Sea from the continent. It results in development of vertical convection in the plume characterized by increase of mixed layer depth (Figure 11C), decrease of vertical size of the plume-sea interface (Figure 11D), and increase of surface salinity (Figure 11A). At the beginning stage of convection, the depth of the mixed layer is relatively small. The uppermost surface layer with small salinity gradient is quickly entrained into the convection layer that steadily deepens in response to relatively small cooling of air temperature and relatively small wind speed. A sharp salinity and temperature jump (Figures 11E, F) forms at its narrow lower boundary. Temperature jump further relaxes due to vertical heat exchange, while salinity jump remains at the plume-sea interface. Figure 9 shows results of in situ measurements (solid blue line) and numerical simulation (dashed blue line) in the plume in the middle of September. By this time, convection steadily reached the depth of 7 m, while the mixed layer cooled to 6°C.
At the intermediate stage of convection in late September and October, i.e., after the convection layer reached depths with considerable salinity gradient (~2 m), its increase is induced only during storm events with abrupt air cooling. Generally, the convective layer increases its depth at wind speeds >10-11 m/s and air-sea temperature differences >2-2.5°C. However, in certain cases this process occurs at smaller wind speeds with greater air-sea temperature differences and vice versa, because the impact of both factors could be dominant. Average deepening velocity of the convective layer during these periods was 1 m per day (grey bands in Figure 11C). In late October, temperature of surface water decreased to the temperature of maximum density (0°C) and further convection became impossible (red lines in Figure 9). As a result, during the last stage of convection, the depth of the convective layer becomes stable and increases very slowly even during storm periods. By this time, the depth of the mixed layer increased to 10 m (Figure 11C). Vertical plume-sea frontal zone with moderate salinity gradient observed in August transformed to a narrow (1-2 m) interface (Figure 11D) with sharp salinity gradient in late October (Figure 11E).
Note the good agreement of numerical modeling (dashed lines in Figures 9, 10) and in situ measurements (solid lines in Figures 9, 10) of thermohaline characteristics of the mixed layer and the plume-sea interface. Thermohaline structure of saline seawater below the plume-sea interface was reproduced worse. In particular, vertical salinity structure of this layer remained the same as was initially prescribed in the middle of August, because numerical model reproduces changes in salinity only in the convection-modified part of the water column. However, there is ambient circulation below the Ob-Yenisei plume, which could alter salinity structure. Temperature changes simulated by numerical modeling below the plume are related to heat exchange in the water column, which propagates below the salinity jump. However, it does not cause vertical motion and does not affect salinity, therefore density structure changes only slightly. Nevertheless, we believe that this disagreement does not affect correctness of results of the current study focused on changes in vertical structure of the Ob-Yenisei plume.
Numerical experiments demonstrated that vertical convection effectively deepens mixed layer and forms sharp and narrow salinity gradient at its bottom boundary at different parts of the plume, which is consistent with in situ measurements (Figure 8). However, salinity jump and depth of the resulting mixed layer strongly depends on initial thermohaline conditions. In particular, numerical modeling of convection in the more saline and diluted eastern part of the Ob-Yenisei plume demonstrated that the resulting surface salinity (26) and the vertical size of the mixed layer (16-17 m) (red lines in Figure 10) are greater than those in the central part of the plume (red lines in Figure 9), which was also observed by in situ measurements (blue and black lines in Figure 8). Similarly to the central part of the plume, at the beginning stage of convection, the depth of the mixed layer in the eastern part of the plume steadily increases in response to relatively small cooling of air temperature and relatively small wind speed (Figure 12). The intermediate stage occurs after the convection layer reached depths ~11 m with significant salinity gradient. Similarly to the central part of the plume, further vertical increase of the convection layer is induced by strong winds and/or large air-sea temperature differences (grey bands in Figure 12). Decrease of sea surface temperatures to temperature of maximal density (-1.8°C) in late October results in secession of deepening of the convective layer.
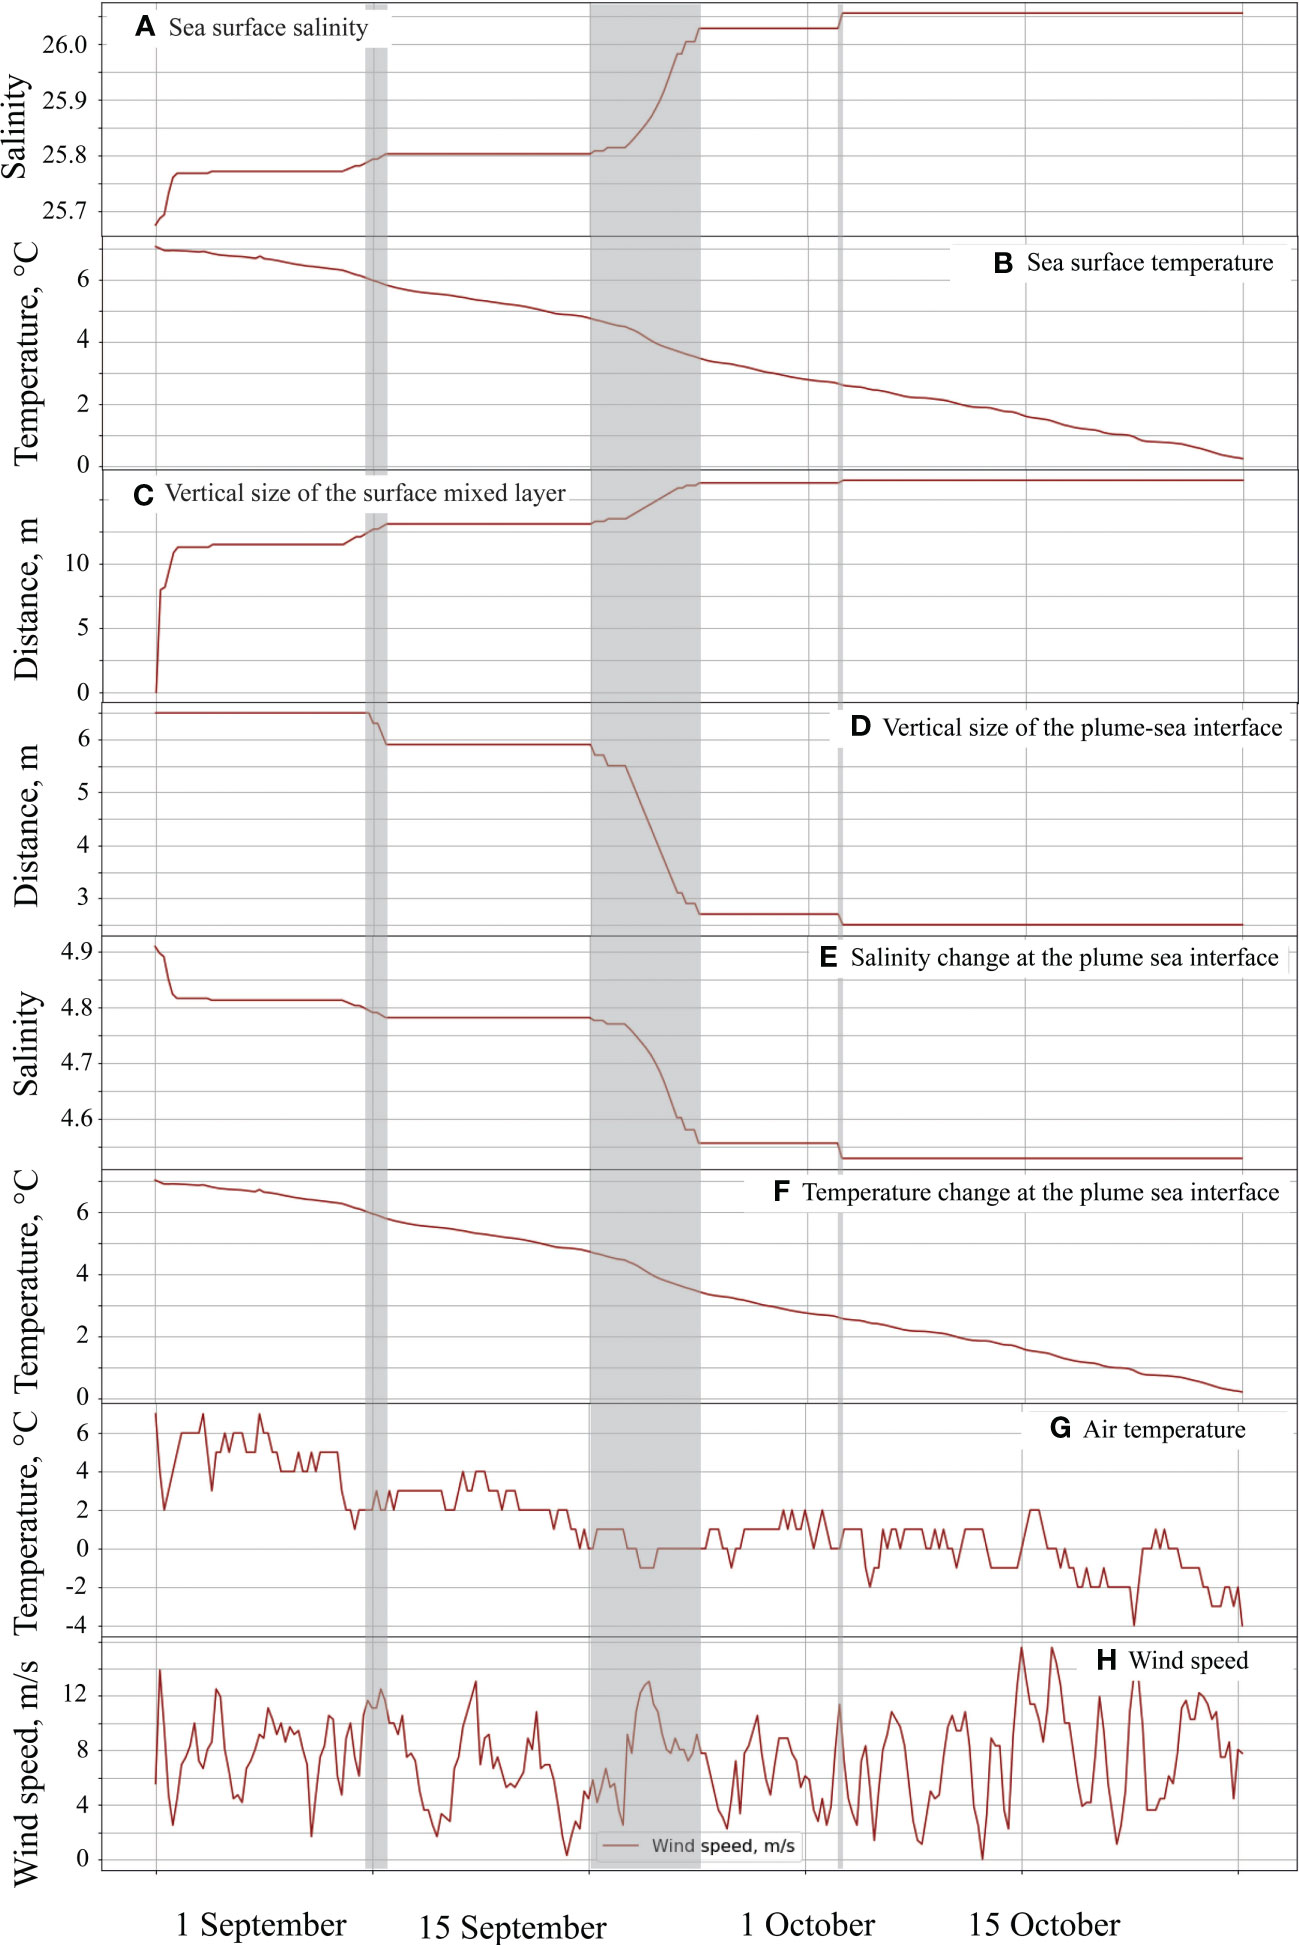
Figure 12 Surface salinity (A) and temperature (B), vertical sizes of the surface mixed layer (C) and the plume-sea interface (D), temperature (E) and salinity (F) changes at plume-sea interface, air temperature (G) and wind speed (H) during the period of numerical modeling of vertical structure of the eastern part of the Ob-Yenisei plume from the middle of August till late October. Gray bands indicate periods of intense convection.
The only parts of the Ob-Yenisei plume where sharp and narrow salinity gradient at the bottom plume boundary is observed by neither in situ measurements, nor numerical modeling are the Ob and Yenisei gulfs. Surface salinity at these areas remain relatively low (4-7) even in August and September, therefore, the related temperatures of maximum density are relatively high (4-6°C). As a result, the cooling effect on water density is low and vertical convection does not penetrate to the plume-sea interface. In particular, numerical simulation of convection in the Gulf of Ob demonstrates that this process does not propagate below 4-6 m and does not affect bottom boundary of the plume, which is consistent with in situ measurements (yellow lines in Figure 8).
5 Conclusions
In this study, we report in situ measurements performed during late October in the Kara Sea, i.e., at the beginning of the cold season and shortly before sea ice formation. These measurements revealed two features of the Ob-Yenisei plume, first, homogenous vertical structure from surface to the bottom boundary of the plume and, second, anomalously abrupt salinity jump at this boundary by 10-12 at vertical distance of 1-2 m. Both features were observed at almost the whole area of the Ob-Yenisei plume except river estuaries, i.e., the Ob and Yenisei gulfs. Both features were formed in the plume during several weeks in October, because extensive in situ measurements performed during previous years in the Kara Sea in August – September did not detect these features.
Using numerical modeling, we demonstrated that these features were formed by autumn convection, which developed within the Ob-Yenisei plume in the middle of autumn. Advection of cold air from the continent to the Kara Sea and enhanced wind forcing during this period resulted in effective cooling of surface layer of the plume and its subsequent overturning. Convection processes during cold season were observed and thorough studied in many areas of World Ocean, especially in the Greenland and Labrador seas, Weddell Sea, and Mediterranean Sea, where they result in formation of very deep (>1000 m) mixed layers (Killworth, 1983; Marshall and Schott, 1999; Lavender et al., 2002; Houpert et al., 2016; Cheon and Gordon, 2019). However, we are not aware of any other study of convection at river plumes and its influence on their vertical structure.
Convection increased depth of the mixed layer and homogenized vertical thermohaline structure of the Ob-Yenisei plume. Convection eroded moderate salinity gradient at the vertical plume-sea interface and halted only after the mixed layer reached the layer of saline seawater. It resulted in formation of narrow (1-2 m) salinity jump between the Ob-Yenisei plume and the subjacent saline seawater. Numerical modeling revealed that the most intense convection generally occurred during storm events with wind speeds >10-11 m/s and air-sea temperature differences >2-2.5°C. During these periods, depth of the convective layer increased by 1 m per day. Convection in the Ob-Yenisei plume occurs only in September and October, because air-sea interaction is blocked in early November by ice formation in the Kara Sea. However, due to relatively small depth of the Ob-Yenisei plume (10-15 m), even this short time period is enough to modify significantly the vertical plume structure. The only areas in the plume, which are not affected by convection, are the Ob and Yenisei gulfs due to low surface salinities and the related high temperatures of maximal density.
The obtained results could be applied to other river plumes located in polar and temperate latitudes with low winter temperatures. In particular, similar autumn convection and formation of narrow and sharp salinity gradient at the bottom boundary could be the case of other large river plumes in the Arctic Ocean, e.g., the Lena, Mackenzie, Yukon, Kolyma, Pechora, Khatanga, Indigirka plumes (Mulligan et al., 2010; Mulligan and Perrie, 2019; Osadchiev et al., 2020a; Osadchiev et al. 2020c; Osadchiev et al. 2021c; Spivak et al., 2021; Clark and Mannino, 2022; Rogozhin et al., 2023). However, possible autumn convection within these plumes remain unstudied due to very hard weather and ice conditions in the Arctic seas shortly before and during ice formation. Formation of sharp salinity gradient at the plume-sea interface shortly before ice formation reduces friction between river plumes and the subjacent seawater. This feature could strongly affect the subsequent buoyancy-driven spreading of river plumes below sea ice, which isolates plumes from wind forcing. Therefore, the results of this study are important for understanding advection and transformation of large river plumes below sea ice during winter and spring that remains the unknown part of the large-scale freshwater cycle in the Arctic Ocean (Osadchiev, 2021).
Data availability statement
The original contributions presented in the study are included in the article/Supplementary Material. Further inquiries can be directed to the corresponding author.
Author contributions
AO designed the study. AO, IS, and RS organized the field surveys. AO, VR, DF, AG, ES, AS, and RS performed the field work. VR and DF processed the in situ data and organized the database. AO, ZZ, VR, DF, AG, ES, AS, IS, and RS performed the analysis of the in situ data. ZZ performed numerical modeling. All authors contributed to the article and approved the submitted version.
Funding
This research was funded by the Russian Science Foundation, research project 22-27-00552.
Acknowledgments
The authors wish to thank State Atomic Energy Corporation Rosatom (ROSATOM) and Marine Research Center at Lomonosov Moscow State University (MRC LMSU) for providing necessary data, which was collected within the project of monitoring of environmental conditions in the Russian Arctic seas in 2021. In addition, the authors wish to thank SCANEX Group for providing necessary AIS data.
Conflict of interest
The authors declare that the research was conducted in the absence of any commercial or financial relationships that could be construed as a potential conflict of interest.
Publisher’s note
All claims expressed in this article are solely those of the authors and do not necessarily represent those of their affiliated organizations, or those of the publisher, the editors and the reviewers. Any product that may be evaluated in this article, or claim that may be made by its manufacturer, is not guaranteed or endorsed by the publisher.
Supplementary material
The Supplementary Material for this article can be found online at: https://www.frontiersin.org/articles/10.3389/fmars.2023.1129331/full#supplementary-material
References
Brickman D. (1995). Heat flux partitioning in open-ocean convection. J. Phys. Oceanogr. 25, 2609–2623. doi: 10.1175/1520-0485(1995)025<2609:HFPIOO>2.0.CO;2
Canuto V. M., Howard A., Hogan P., Cheng Y., Dubovikov M. S., Montenegro L. M. (2004). Modeling ocean deep convection. Ocean Model. 7, 75–95. doi: 10.1016/S1463-5003(03)00038-6
Cheon W. G., Gordon A. L. (2019). Open-ocean polynyas and deep convection in the southern ocean. Sci. Rep. 9, 6935. doi: 10.1038/s41598-019-43466-2
Clark J. B., Mannino A. (2022). The impacts of freshwater input and surface wind velocity on the strength and extent of a large high latitude river plume. Front. Mar. Sci. 8. doi: 10.3389/fmars.2021.793217
Fedulov V. Y., Belyaev N. A., Kolokolova A. V., Sazhin A. F. (2018). Base geochemical parameters of the surface water of southwestern Kara Sea in the winter season. J. Oceanol. Res. 46, 115–122. doi: 10.29006/1564-2291.JOR-2018.46(1).9
Frey D., Osadchiev A. (2021). Large river plumes detection by satellite altimetry: Case study of the Ob–Yenisei plume. Remote Sens 13, 5014. doi: 10.3390/rs13245014
Gordeev V. V., Martin J. M., Sidorov J. S., Sidorova M. V. (1996). A reassessment of the Eurasian river input of water, sediment, major elements, and nutrients to the Arctic Ocean. Am. J. Sci. 296, 664–691. doi: 10.2475/ajs.296.6.664
Hersbach H., Bell B., Berrisford P., Hirahara S., Horányi A., Muñoz-Sabater J., et al. (2020). The ERA5 global reanalysis. Q. J. R. Meteorol. Soc 146, 1999–2049. doi: 10.1002/qj.3803
Houpert L., Madron X. D., Testor P., Bosse A., d'Ortenzio F., Bouin M. N., et al. (2016). Observations of open-ocean deep convection in the northwestern Mediterranean Sea: Seasonal and interannual variability of mixing and deep water masses for the 2007-2013 period. J. Geophys. Res. Oceans 121, 8139–8171. doi: 10.1002/2016JC011857
Johnson D. R., McClimans T. A., King S., Grenness T. (1997). Fresh water masses in the Kara Sea during summer. J. Mar. Sys. 12, 127–145. doi: 10.1016/s0924-7963(96)00093-0
Killworth P. D. (1983). Deep convection in the World Ocean. Rev. Geophys. 21, 1–26. doi: 10.1029/RG021i001p00001
Landau L. D., Lifshitz E. M. (2013). Fluid mechanics: Course of theoretical physics (Great Britain: Pergamon Press).
Lavender K. L., Davis R. E., Owens W. B. (2002). Observations of open-ocean deep convection in the Labrador Sea from subsurface floats. J. Phys. Oceanogr. 32, 511–526. doi: 10.1175/1520-0485(2002)032<0511:OOOODC>2.0.CO;2
Marshall J., Schott F. (1999). Open-ocean convection: Observations, theory, and models. Rev. Geophys. 37, 1–64. doi: 10.1029/98RG02739
McClimans T. A., Johnson D. R., Krosshavn M., King S. E., Carroll J., Grenness T. (2000). Transport processes in the Kara Sea. J. Geophys. Res. 105 (C6), 14121–14139. doi: 10.1029/1999jc000012
McPherson R. A., Stevens C. L., O’Callaghan J. M., Lucas A. J., Nash J. D. (2020). The role of turbulence and internal waves in the structure and evolution of a near-field river plume. Ocean Sci. 16, 799–815. doi: 10.5194/os-16-799-2020
Morozov E. G., Paka V. T., Bakhanov V. V. (2008). Strong internal tides in the Kara Gates Strait. Geophys. Res. Lett. 35, L16603. doi: 10.1029/2008GL033804
Mosharov S. A., Sazhin A. F., Druzhkova E. I., Khlebopashev P. V. (2018). Structure and productivity of the phytocenosis in the southwestern Kara Sea in early spring. Oceanology 58, 396–404. doi: 10.1134/S0001437018030141
Mulligan R. P., Perrie W. (2019). Circulation and structure of the Mackenzie river plume in the coastal Arctic Ocean. Cont. Shelf Res. 177, 59–68. doi: 10.1016/j.csr.2019.03.006
Mulligan R., Perrie W., Solomon S. (2010). Dynamics of the Mackenzie river plume on the inner Beaufort shelf during an open water period in summer. Estuar. Coast. Shelf Sci. 89, 214–220. doi: 10.1016/j.ecss.2010.06.010
Osadchiev A. A. (2021). Spreading and transformation of river discharge in the Russian Arctic. Herald Russ. Acad. Sci. 91, 694–699. doi: 10.1134/S1019331621060101
Osadchiev A. A., Asadulin E., Miroshnikov A., Zavialov I. B., Dubinina E. O., Belyakova P. A. (2019). Bottom sediments reveal inter-annual variability of interaction between the ob and yenisei plumes in the Kara Sea. Sci. Rep. 9, 18642. doi: 10.1038/s41598-019-55242-3
Osadchiev A. A., Barymova A. A., Sedakov R. O., Zhiba R. Y., Dbar R. S. (2020d). Spatial structure, short-temporal variability, and dynamical features of small river plumes as observed by aerial drones: Case study of the Kodor and Bzyp river plumes. Rem. Sens. 12, 3079. doi: 10.3390/rs12183079
Osadchiev A. A., Frey D. I., Shchuka S. A., Tilinina N. D., Morozov E. G., Zavialov P. O. (2021a). Structure of freshened surface layer in the Kara Sea during ice-free periods. J. Geophys. Res. Oceans 126, e2020JC016486. doi: 10.1029/2020JC016486
Osadchiev A. A., Frey D. I., Spivak E. A., Shchuka S. A., Tilinina N. D., Semiletov I. P. (2021c). Structure and inter-annual variability of the freshened surface layer in the Laptev and East-Siberian seas during ice-free periods. Front. Mar. Sci. 8. doi: 10.3389/fmars.2021.735011
Osadchiev A., Gordey A., Barymova A., Sedakov R., Rogozhin V., Zhiba R., et al. (2022b). Lateral border of a small river plume: Salinity structure, instabilities and mass transport. Rem. Sens. 14, 3818. doi: 10.3390/rs14153818
Osadchiev A. A., Izhitskiy A. S., Zavialov P. O., Kremenetskiy V. V., Polukhin A. A., Pelevin V. V., et al. (2017). Structure of the buoyant plume formed by Ob and Yenisei river discharge in the southern part of the Kara Sea during summer and autumn. J. Geophys. Res. Oceans 122, 5916–5935. doi: 10.1002/2016JC012603
Osadchiev A. A., Konovalova O. P., Gordey A. S. (2021b). Water exchange between the Gulf of Ob and the Kara Sea during ice-free seasons: The roles of river discharge and wind forcing. Front. Mar. Sci. 8. doi: 10.3389/fmars.2021.741143
Osadchiev A. A., Medvedev I. P., Shchuka S. A., Kulikov M. E., Spivak E. A., Pisareva M. N., et al. (2020a). Influence of estuarine tidal mixing on structure and spatial scales of large river plumes. Ocean Sci. 16, 1–18. doi: 10.5194/os-16-1-2020
Osadchiev A. A., Pisareva M. N., Spivak E. A., Shchuka S. A., Semiletov I. P. (2020b). Freshwater transport between the Kara, Laptev, and East-Siberian seas. Sci. Rep. 10, 13041. doi: 10.1038/s41598-020-70096-w
Osadchiev A. A., Silvestrova K. P., Myslenkov S. A. (2020c). Wind-driven coastal upwelling near large river deltas in the Laptev and East-Siberian seas. Rem. Sens 12, 844. doi: 10.3390/rs12050844
Osadchiev A., Viting K., Frey D., Demeshko D., Dzhamalova A., Nurlibaeva A., et al. (2022a). Structure and circulation of Atlantic water masses in the St. Anna Trough in the kara Sea. Front. Mar. Sci. 9. doi: 10.3389/fmars.2022.915674
Pavlov V. K., Pfirman S. L. (1995). Hydrographic structure and variability of the Kara Sea: Implications for pollutant distribution. Deep-Sea Res. II: Top. Stud. Oceanogr. 42, 1369–1390. doi: 10.1016/0967-0645(95)00046-1
Rogozhin V., Osadchiev A., Konovalova O. (2023). Structure and variability of the pechora plume in the southeastern part of the barents Sea. Front. Mar. Sci. doi: 10.3389/fmars.2023.1052044
Schmitt R. W., Olson D. B. (1985). Wintertime convection in warm-core rings: Thermocline ventilation and the formation of mesoscale lenses. J. Geophys. Res. Oceans 90 (C5), 8823–8837. doi: 10.1029/JC090iC05p08823
Smith S. D. (1989). Coefficients for sea surface wind stress, heat flux, and wind profiles as a function of wind speed and temperature. J. Geophys. Res. 93, 15467–15472. doi: 10.1029/JC093iC12p15467
Spivak E. A., Osadchiev A. A., Semiletov I. P. (2021). Structure and variability of the Lena river plume in the south-eastern part of the Laptev Sea. Oceanology 61, 839–849. doi: 10.1134/S000143702106014X
Wells A. J., Cenedese C., Farrar J. T., Zappa C. J. (2009). Variations in ocean surface temperature due to near-surface flow: Straining the cool skin layer. J. Phys. Oceanogr. 39, 2685–2710. doi: 10.1175/2009JPO3980.1
Zatsepin A. G., Kremenetskiy V. V., Kubryakov A. A., Stanichny S. V., Soloviev D. M. (2015). Propagation and transformation of waters of the surface desalinated layer in the Kara Sea. Oceanology 55, 450–460. doi: 10.1134/s0001437015040153
Zatsepin A. G., Zavialov P. O., Baranov V. I., Kremenetskiy V. V., Nedospasov A. A., Poyarkov S. G., et al. (2017). On the mechanism of wind-induced transformation of a river runoff water lens in the Kara Sea. Oceanology 57, 1–7. doi: 10.1134/S0001437017010222
Zatsepin A. G., Zavialov P. O., Kremenetskiy V. V., Poyarkov S. G., Soloviev D. M. (2010). The upper desalinated layer in the Kara Sea. Oceanology 50, 657–667. doi: 10.1134/s0001437010050036
Keywords: river plume, autumn convection, stratification, surface layer, Ob, Yenisei, Kara Sea, Arctic Ocean
Citation: Osadchiev A, Zabudkina Z, Rogozhin V, Frey D, Gordey A, Spivak E, Salyuk A, Semiletov I and Sedakov R (2023) Structure of the Ob-Yenisei plume in the Kara Sea shortly before autumn ice formation. Front. Mar. Sci. 10:1129331. doi: 10.3389/fmars.2023.1129331
Received: 21 December 2022; Accepted: 27 February 2023;
Published: 10 March 2023.
Edited by:
Şükrü Beşiktepe, Dokuz Eylül University, TürkiyeReviewed by:
Daniel MacDonald, University of Massachusetts Dartmouth, United StatesMatthew Buckley Alkire, University of Washington, United States
Copyright © 2023 Osadchiev, Zabudkina, Rogozhin, Frey, Gordey, Spivak, Salyuk, Semiletov and Sedakov. This is an open-access article distributed under the terms of the Creative Commons Attribution License (CC BY). The use, distribution or reproduction in other forums is permitted, provided the original author(s) and the copyright owner(s) are credited and that the original publication in this journal is cited, in accordance with accepted academic practice. No use, distribution or reproduction is permitted which does not comply with these terms.
*Correspondence: Alexander Osadchiev, b3NhZGNoaWV2QG9jZWFuLnJ1