 Patricia L. Wiberg
- Department of Environmental Sciences, University of Virginia, Charlottesville, VA, United States
Shallow coastal ecosystems are threatened by marine heatwaves, but few long-term records exist to quantify these heatwaves. Here, 40-year records of measured water temperature were constructed for a site in a system of shallow bays with documented heatwave impacts and a nearby ocean site; available gridded sea-surface temperature datasets in the region were also examined. Water temperatures at both sites increased significantly though bay temperatures were consistently 3-4°C hotter in summer and colder in winter and were more variable overall, differences not captured in high-resolution gridded sea-surface temperature datasets. There was considerable overlap in heatwave events at the coastal bay and ocean sites. Annual heatwave exposure was similar and significantly increased at both sites while annual heatwave intensity was significantly higher at the bay site owing to the high variance of the daily temperature anomaly there. Event frequency at both sites increased at a rate of about 1 event/decade. Future simulations indicate all heatwave metrics increase, as do days above 28°C, a heat stress threshold for seagrass. Ocean temperatures on the U.S. mid-Atlantic margin have rarely exceeded this threshold, while summer bay temperatures commonly do, allowing ocean exchange with coastal bays to provide thermal relief to bay ecosystems. This will have changed by 2100, creating a thermal environment that threatens seagrass communities in these systems. Documenting such change requires development of long-term water temperature records in more shallow coastal systems.
1 Introduction
Marine heatwaves (MHWs) have been the subject of increasing attention as their frequency and duration have increased over much of the ocean in connection with rising sea surface temperatures (SST) (Oliver et al., 2021). Much of this attention stems from the sensitivity of many marine ecosystems to temperature stress (Smale et al., 2019) and observations of ecosystem damage caused by MHWs (Arias-Ortiz et al., 2018; Cavanaugh et al., 2019; Aoki et al., 2021). This paper examines MHWs in the shallow coastal bays along a portion of the U.S. mid-Atlantic coast between Chesapeake Bay and Delaware Bay (Figure 1). A 2015 MHW caused significant dieback in a large restored seagrass (Zostera marina) meadow in one of the bays (Berger et al., in review). Portions of the meadow closer to a tidal inlet experienced less dieback and recovered more quickly than portions further from the inlet (Aoki et al., 2021), likely because tidal exchange of cooler ocean water mitigated impacts of the MHW in regions of the bay proximal to the inlet.
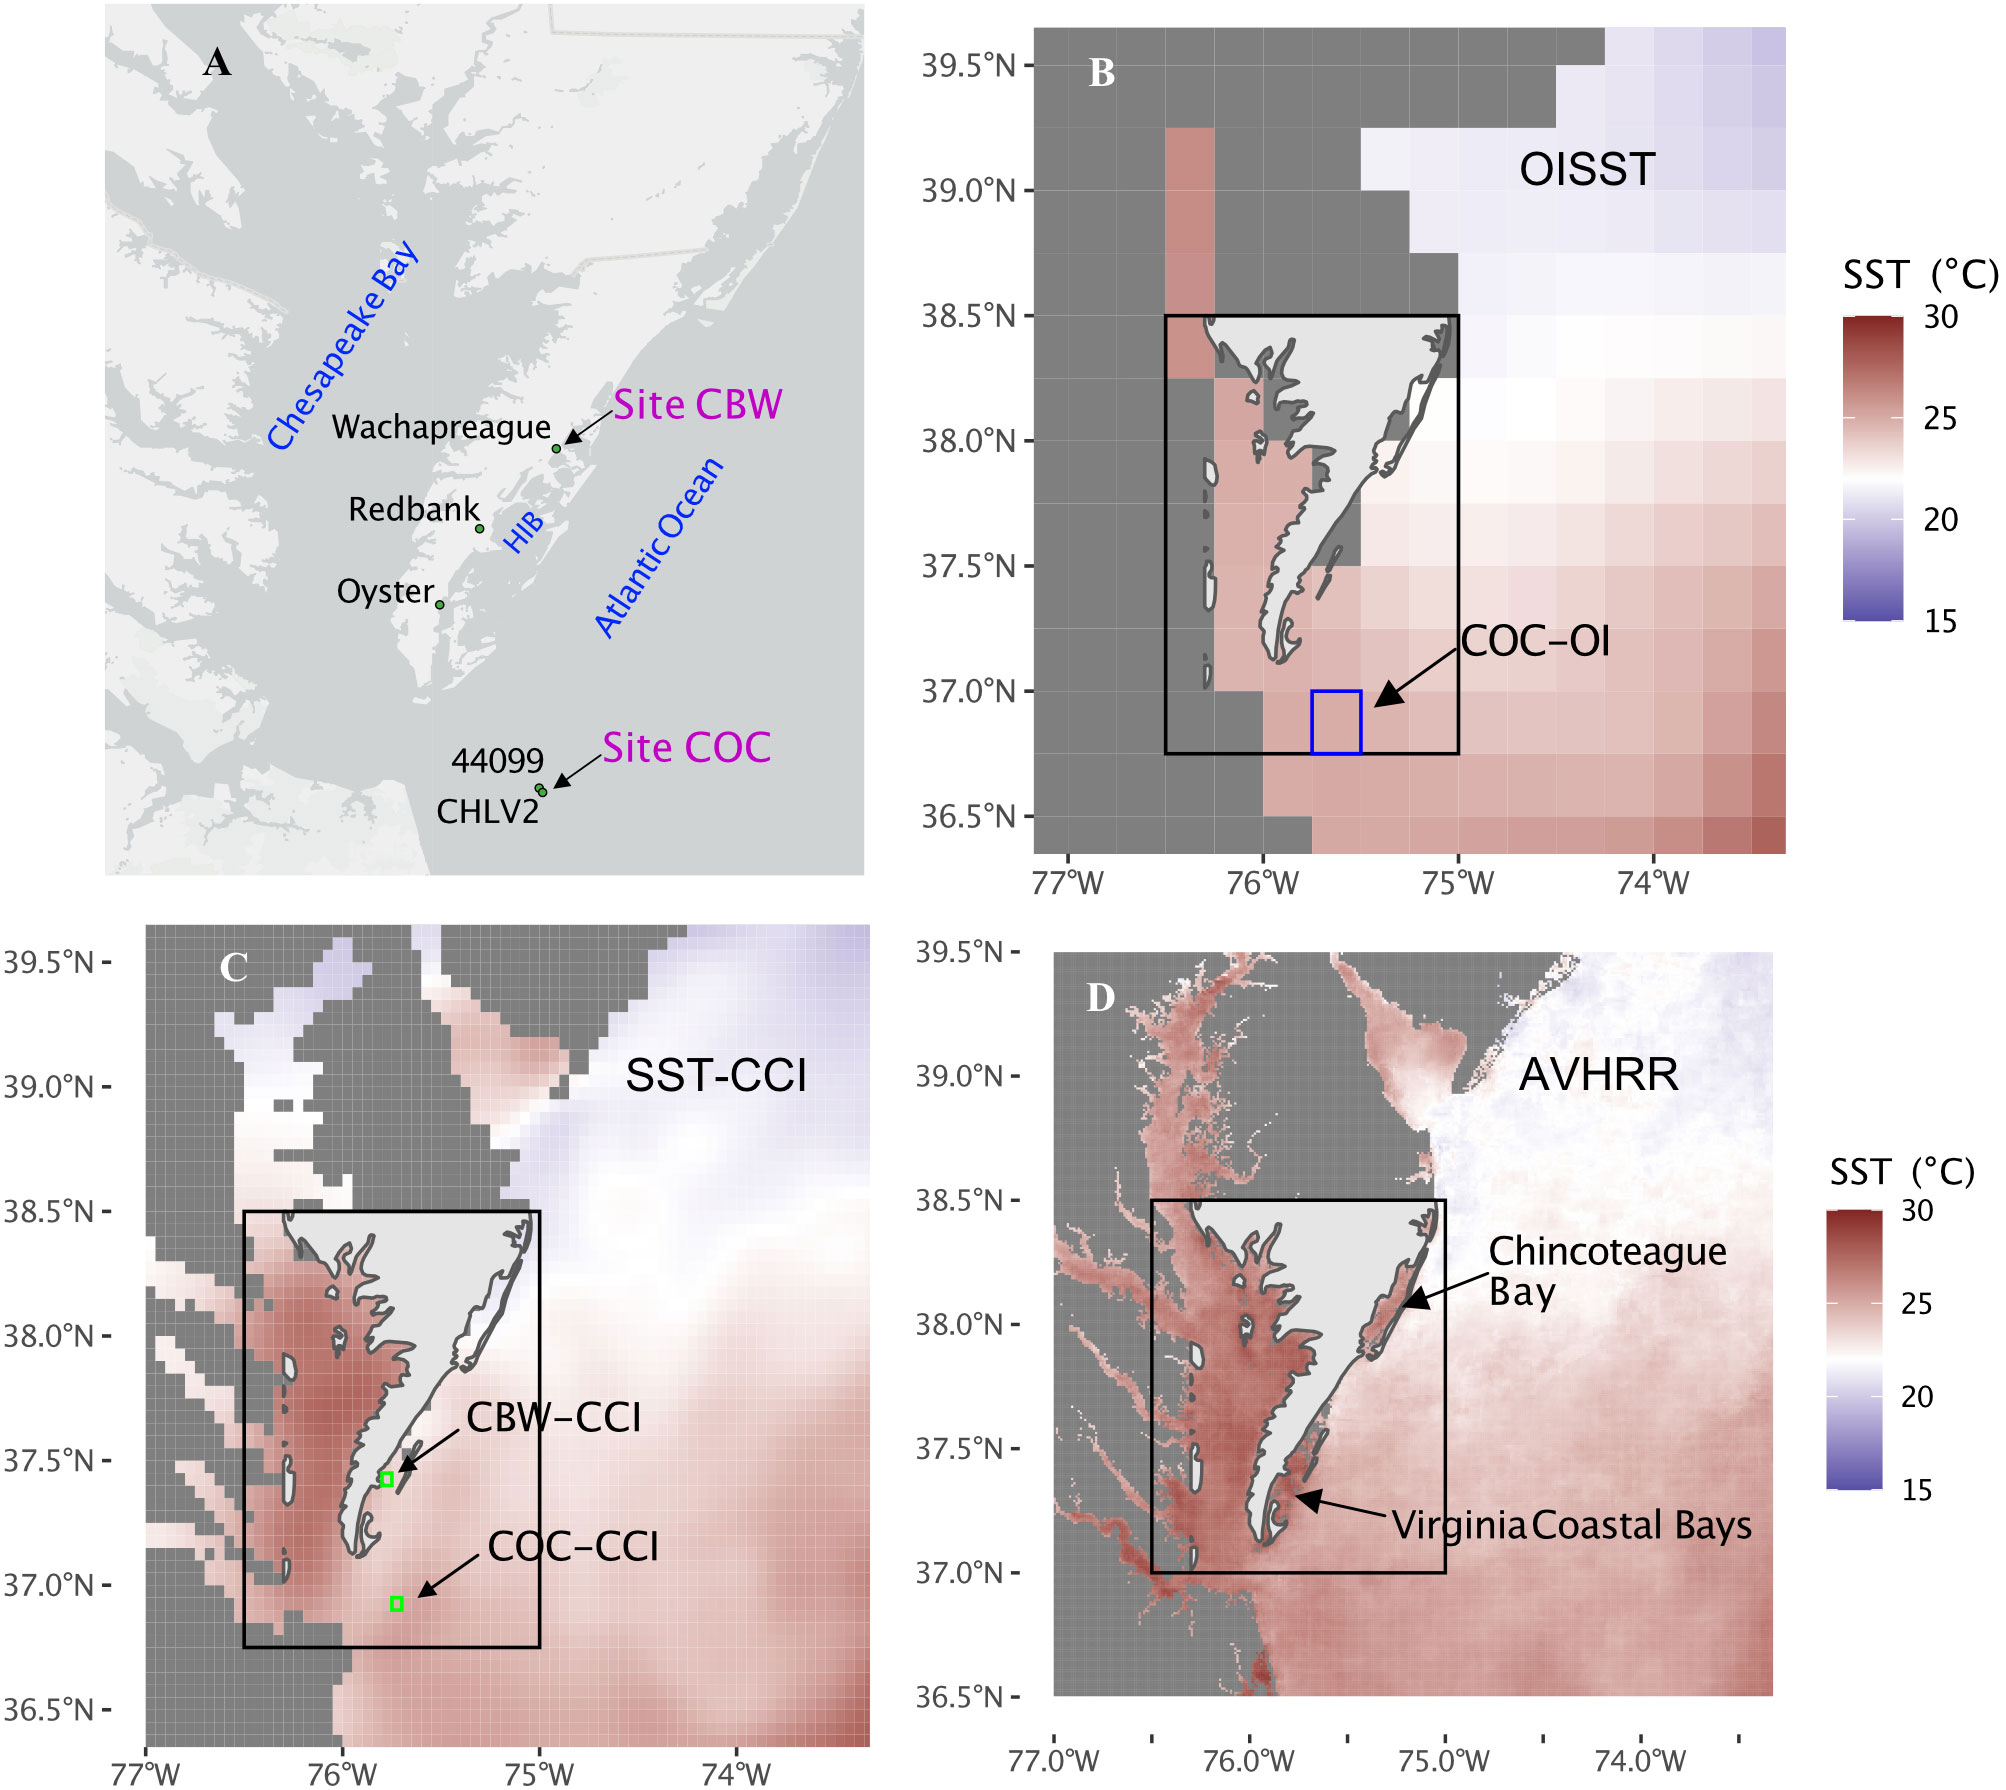
Figure 1 Site map and SST maps for June 2015 MHW in study area. (A) Site map for study area on the mid-Atlantic coast of the U.S. with sites of SST and air temperature records used in the analysis. Spatial distributions of average SST during the 12-26 June 2015 MHW in the study region from (B) OISST-V2 gridded daily SST dataset; (C) SST-CCI/CS3 daily SST gridded dataset; and (D) AVHRR satellite-derived SST. The boxed areas of (B–D) correspond to the study area shown in (A) The blue box in (B) and green boxes in (C) show the cells from which time series (1982-2021) were extracted for the longer-term MHW analysis.
A full analysis of MHWs requires long-term records of daily average water temperature to define climate normals (30-yr records are standard (WMO, 2017)) and episodic significant deviations from those normals. Such long-term instrumental records are relatively rare in shallow coastal systems. In this study, a 40-year record (1982-2021) of daily average water temperature in the study bays was constructed from several sources of measured water temperature. A similar instrumental record was developed for a nearby site in the coastal ocean. An attractive alternative to the lack of availability of long-term instrumental surface water temperature records in marine environments is provided by gridded and gap-free global SST datasets such as the NOAA Optimum Interpolation Sea Surface Temperature Version 2.1 (OISST-V2) 0.25°-resolution dataset of daily SST that spans the period September 1981-present (Reynolds et al., 2007; Huang et al., 2021) and the ESA Sea Surface Temperature Climate Change Initiative SST CCI and CS3 (SST-CCI/CS3) 0.05°-resolution datasets of daily SST, covering the same period of time (Merchant et al., 2019). Other high resolution datasets include OSTIA 0.05°-resolution daily SST (Good et al., 2020), which is available for 2007 – present, and CoralTemp 5-km daily nighttime SST (Liu et al., 2014), which extends from 1985 – present.
These gridded datasets were developed using satellite, buoy, and ship-based water temperature data together with a variety of calibrations and bias corrections to yield best agreement with observed SST (Banzon et al., 2016; Good et al., 2019; Good et al., 2020; Liu et al., 2014). Error estimates provided as part of the OISST-V2 set of data products show an increase in potential error in coastal regions of the ocean. Because many of the world’s most productive and threatened marine ecosystems are found in coastal environments (Millennium Ecosystem Assessment, 2005), the potential for errors in identification and characterization of marine heatwave events in coastal ecosystems associated with errors in gridded SST datasets in these regions is a cause for concern. Comparison with measured temperature records and higher resolution satellite-derived SST data during specific events can provide insight into the accuracy of gridded, gap-free data products at shallow coastal sites.
In this study, long-term (40-year) instrumental records and gridded SST datasets were used to investigate temperature variations and MHWs in a system of shallow coastal bays on the mid-Atlantic coast of the USA, and their relationship to MHWs in the adjacent coastal ocean. A MHW in June 2015, documented to have caused seagrass dieback in one of the coastal bays, provides a useful case study for comparison of datasets across sites and sources. Simulations of SST and MHWs at sites in the bay and coastal ocean from 1982 to 2100 illustrate the challenges temperature-sensitive coastal ecosystems will face in the future as water and air temperatures continue to increase.
2 Methods
2.1 Study area
The focus of this study is a system of shallow coastal bays located along the Virginia, USA, coast of the southern Delmarva Peninsula (Figure 1), which are home to the Virginia Coast Reserve Long Term Ecological Research (VCR LTER) program. Average water depth in the bays is about 1 m relative to mean sea level except for deeper channels connected to tidal inlets that cut through the bays (Safak et al., 2015); tidal range is about 1.2 m (Fagherazzi and Wiberg, 2009). There are no significant sources of freshwater to the bays; salinity averages ~30 ppt. Residence times in the bays vary from tidal time scales near the inlets to weeks in portions of the bay with restricted circulation far from the inlets (Safak et al., 2015). A large-scale restoration project which began in 2001 has resulted in > 3600 ha of seagrass in several of the bays after a 70-y absence (Orth et al., 2020).
2.2 Data sets
This analysis used daily gridded SST and measured water temperature from 1982-2021. Time series of daily average measured water temperature were constructed for a site in one of the Virginia coastal bays (Site CBW (Coastal Bay Wachapreague); 37.61N, 75.69W; water depth 1m) and a site in the coastal ocean just outside the bays (Site COC (Coastal Ocean CHLV2); 36.91N, 75.71W; water depth 15m) (Figure 1A) as described below.
OISST-V2 (psl.noaa.gov/data/gridded/data.noaa.oisst.v2.highres.html), SST-CCI/CS3 (climate.esa.int/en/projects/sea-surface-temperature/), OSTIA (data.marine.copernicus.eu/product/SST_GLO_SST_L4_NRT_OBSERVATIONS_010_001/), and CoralTemp (coralreefwatch.noaa.gov/product/5km/index_5km_sst.php) data were downloaded for the region indicated in Figure 1 for June 2015. Advanced Very High Resolution Radiometer (AVHRR) derived SST for June 2015 (1 km2 resolution; masked to eliminate cloudy regions and locations where the data did not meet data quality criteria) were obtained from the Rutgers Center for Ocean Observing Leadership remote sensing data products (rucool.marine.rutgers.edu/integrated-ocean-technology/remote-sensing/). The spatial resolution of the AVHRR SST images was high enough to resolve the Virginia coastal bays and Chincoteague Bay to the north (Figure 1D). Sixteen largely clear images were available for a MHW during 12-26 June 2015; these were averaged to capture the spatial pattern of SST during the heatwave (Aoki et al., 2021). The generally intermittent availability of clear images and limited time span (~15 years) of AVHRR data for the study area preclude the use of time series derived from the imagery for the long-term analysis presented here; however, future work will use the imagery to investigate seasonal and interannual variations in spatial patterns of SST and MHWs in the coastal bays.
Time series of OISST-V2 and SST-CCI/CS3 data were downloaded for the period 1982-2021 from the grid cell containing Site COC (referred to here as COC-OI and COC-CCI, respectively; Figures 1B, C; Table 1). The OSTIA time series from the same location was also downloaded for the period 2007-2021 (the dataset begins in 2007; referred to here as COC-OSTIA). The CoralTemp time series was not included owing to its focus on nighttime SST, however because CoralTemp and OSTIA SST were very well correlated in June 2015 (see Supplement), the OSTIA results are likely also reflective of the CoralTemp record. The OISST-V2 dataset did not resolve the coastal bays and therefore was not included in the analysis of bay water temperatures. The bay where Site CBW is located (Bradford Bay) is < 4 km (0.04°) in any dimension and therefore too small to be resolved in the SST-CCI/CS3 or OSTIA datasets. The largest of the Virginia coastal bays (Hog Island Bay (HIB in Figure 1A); about 20 km SSW of Site CBW and close to Redbank, VA) is a roughly 10 km x 10 km (0.09° x 0.09°) body of water with one axis oriented NNE (Figure 1A). Tidal and water temperature conditions at Site CBW and Hog Island Bay are similar (Figure S1), therefore SST-CCI/CS3 and OSTIA time series extracted from a cell in Hog Island Bay containing minimal land area (just a small fringe of intertidal salt marsh) was selected as a representative time series for the bays from gridded datasets (referred to here as CBW-CCI and CBW-OSTIA, respectively; Figure 1C; Table 1).

Table 1 Data sources [references and URLs for each are in the main text].
2.2.1 Long-term records of measured water and air temperature in the Virginia coastal bays
The measured water temperature record for the coastal bays used 3 data sources (Figure 1A; Table 1): hourly water temperature measurements at NOAA Station 8631044 in Wachapreague, VA (1994-present; tidesandcurrents.noaa.gov), weekday morning water temperature collected by personnel at the Virginia Institute of Marine Science (VIMS) lab in Wachapreague (1962-2016; R. Snyder personal communication), and hourly water temperature measurements at Redbank, VA (1993-present; maintained by the VCR LTER program (Porter et al., 2022)). The NOAA Wachapreague record is relatively complete (Table 1), however there was a period from 1998-2005 when the data appear inconsistent with portions of the record prior to or after that period (Figure S2). The VIMS morning temperature readings, taken nominally at 8:00AM, are very well correlated with the daily average NOAA Wachapreague temperatures (r2 = 0.98 for 2008-2016, with slope = 1.02 and intercept = 0.46). The Redbank dataset, which has more gaps but included some of the times when Wachapreague data were missing, is also very well correlated with NOAA Wachapreague (r2 = 0.99 for 2008-2018, with slope = 0.99 and intercept = -0.43).
A 40-year times series of daily average measured water temperature at Wachapreague (CBW-Meas) was constructed from the 3 sets of daily water temperature data described above for the period from 1982-2021. Daily average values from Wachapreague were used when available except for the period from 1998-2005. Values during this period and missing values throughout the rest of the record were filled first with VIMS daily morning values, adjusted using the regression above to best agree with daily average water temperature at the NOAA Wachapreague station. Then Redbank daily averages, when available, were used to fill in any remaining missing values in the 40-year time series of daily average water temperature. When filling with Redbank values, two options were considered: 1) using daily average Redbank temperature and 2) adjusting Redbank temperatures using the regression above to best agree with values at Wachapreague. Redbank daily average water temperatures in summer (June-August) were an average of 0.7°C higher than values at Wachapreague, whereas when adjusted, average summer temperatures were the same (27.1°C). In the interest of generating the most internally consistent long-term dataset for the analysis presented here, the time series with adjusted Redbank values was used to represent daily average bay water temperature in subsequent analyses.
Hourly air temperature is available for NOAA Station 8631044 (Wachapreague) from 2008 to present (Table 1). There is also a U.S. Climate Reference Network (USCRN; Diamond et al., 2013) site in Oyster, VA (Figure 1A) that has recorded hourly values of air temperature since 2005 (www.ncei.noaa.gov/access/crn/). Daily average air temperature at Oyster is highly correlated with the NOAA Wachapreague air temperature record (r2 = 0.99 for 2008-2018, with slope = 1.01 and intercept = -0.37). A times series of daily average, maximum and minimum air temperature at Wachapreague was constructed from the Wachapreague and Oyster sets of hourly average air temperature for the period from 2008-2020. Air temperatures from Wachapreague were used when available, and missing values were filled with USCRN Oyster air temperatures, adjusted using the above regression to best agree with daily average air temperatures at the NOAA Wachapreague station.
2.2.2 Long-term records of measured water and air temperature in the nearby coastal ocean
The measured water temperature record for Site COC (COC-Meas; 30 km east of the mouth of Chesapeake Bay; Figure 1A) used 2 data sources (Figure 1A; Table 1): near-surface water temperature recorded at NOAA National Data Buoy Center (NDBC) Station CHLV2 and NDBC Buoy 44099 (B-99 in Figure 1A; ndbc.noaa.gov). Water temperature was recorded hourly at NOAA NDBC Station CHLV2 from 1984-2003; the record is relatively complete (86%). NDBC Buoy 44099 provides a nearly complete source of hourly water temperature data at essentially the same location from 2008 until present. The OISST-V2 time series extracted from the grid location closest to CHLV2 (COC-OI) is very well correlated with daily average water temperature at Buoy 44099 (r2 = 0.99 for 2008-2020, with slope = 0.99 and intercept = 0.28) and with daily average water temperature recorded at CHLV2 (r2 = 0.98 for 1984-2003, with slope = 0.94 and intercept = 1.51). A 40-year times series of daily average water temperature at the CHLV2 site was constructed using the 2 sets of daily average water temperature measurements (CHLV2 and B44099) when available and filling in the remaining time, including the years 2004-2007, with OISST-V2 values (no adjustment).
Hourly air temperature is available for NDBC Station CHLV2 from mid-1984 to mid-2016 when the station was decommissioned; concurrent water temperature was recorded until 2002. There are no current air temperature measurements at that site. A times series of daily average, maximum and minimum air temperature at CHLV2 was developed for the period from 1990-2002, matching the length of the coastal bay air temperature record, though not overlapping in time.
2.3 Data analysis
Seasonal climatologies of daily average surface water temperature and high temperature events, referred to as marine heat waves (MHWs), were identified following the methods described in Hobday et al. (2016; 2018; R package heatwaveR). The method uses a 30-year record (1987-2016 in this analysis) of daily average SST to develop a daily mean climatology and heatwave threshold (most often defined as the 90th percentile) based on daily average temperature within an 11-day sliding window centered on a given day (Hobday et al., 2016). Any period with at least 5 consecutive days above the threshold is flagged as a heatwave. This approach was used to identify MHWs at Sites CBW (coastal bay site) and COC (coastal ocean site) using each of the daily average water temperature time series that spanned the period 1982-2021; the OSTIA record was not included in this analysis because of its limited duration (beginning in 2007). Individual MHWs were characterized by their duration, peak temperature, intensity (maximum SST anomaly relative to climatological mean), and cumulative intensity relative to threshold (CIRT; difference between daily SST and threshold summed over the duration of the heat wave). Following Oliver (2019), annual MHW metrics used here were MHW exposure (MHW days per year; also broken down into number of MHWs per year and their average duration) and MHW intensity (maximum MHW intensity each year). In addition, the number of days with daily average water temperature > 28°C, a threshold for heat stress in some seagrass ecosystems (Berger et al., 2020), was determined for each year.
For each annual MHW metric, the 40-yr mean and trend, with 95% confidence intervals, were calculated using the R functions mean, lm, and t.test. Pairwise comparisons of means among sites were made using the R functions aov and TukeyHSD; significant differences required p values < 0.05. Pairwise comparisons of trends among sites were evaluated using the emtrends function in the R package emmeans. Means, trends and pairwise comparisons of annual mean and variance of SST for each site were calculated using the same methods; annual variance was calculated from the SST anomaly time series obtained by subtracting the seasonal climatology from daily SST. SST trend and confidence interval calculations were tested for autocorrelation using the Durbin-Watson test (R function dwtest in the lmtest package). Annual mean SST passed the test whereas daily and monthly SST anomalies, which had the same trend but smaller confidence limits, did not and were not considered in the trend analysis.
2.4 Simulations of marine heatwave trends
The methods described in Oliver et al. (2021) were used to simulate trends in MHW metrics. Simulations were made using the first-order autoregressive (AR1) model T(t+Δt) = aT(t) + ε(t). The autoregressive parameter a is given by the slope of a linear regression of the SST anomaly time series value at time t+Δt against the value at time t and ε is a random process with a mean of zero and a standard deviation σε, which is given by the standard deviation of the residuals of the regression (see Chatfield, 2004; Oliver et al., 2021). A related memory time scale τ = -1/ln(a) has been used to characterize timescales of ocean SST variability (Oliver et al., 2021). A set of 500 simulations of the SST anomaly time series for 1982-2100 were run based on values of a and σε calculated using the ocean and bay temperature time series (Table 2). MHW events and statistics were calculated for the 500 simulations using the R heatwaveR package after adding back the long-term trend and seasonal climatology. Summary statistics of the 500 simulations are used to evaluate long-term trends in MHWs at the two sites.
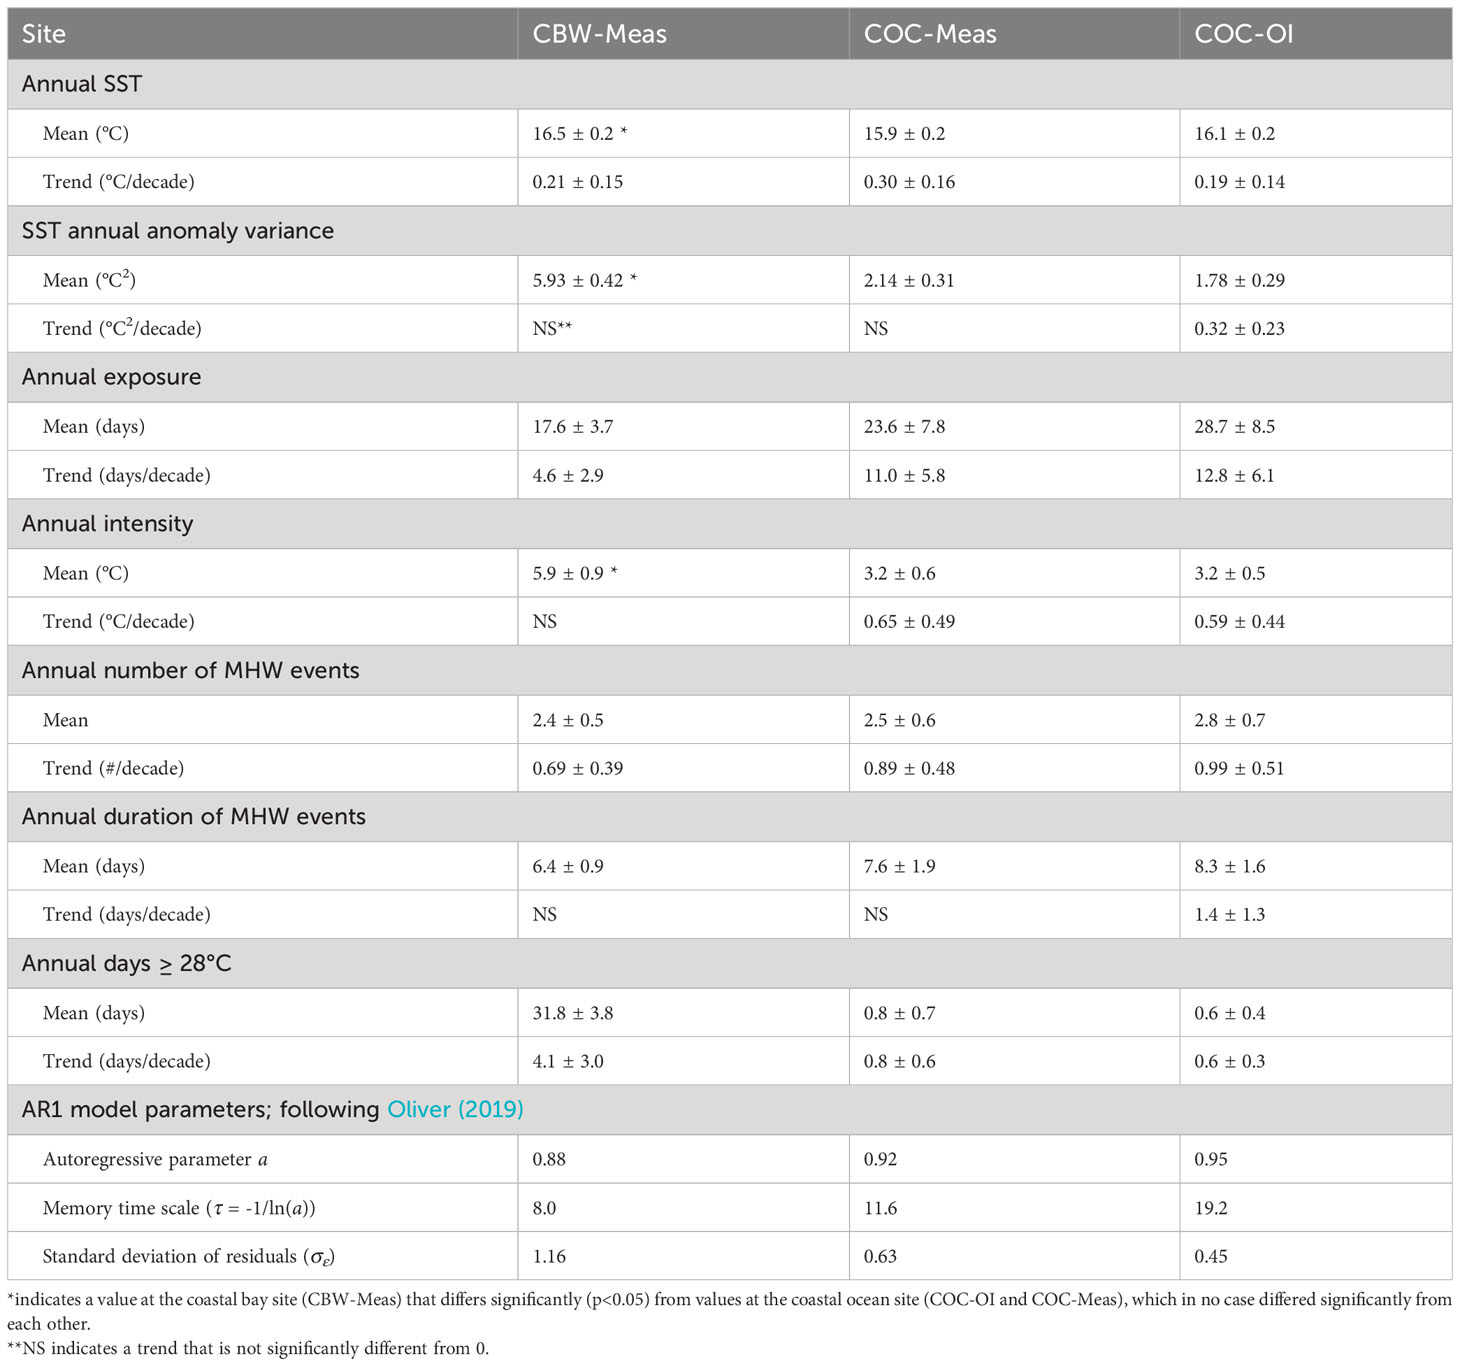
Table 2 Annual SST and MHW metrics 1982-2021; given with ± 95% confidence intervals.
3 Results
3.1 Seasonal and long-term temperature patterns
Daily average seasonal climatology at the bay site was warmer than in the nearby ocean in summer and colder in winter (Figure 2A). Summer measured water temperature at the bay site averaged 2.9°C (August) - 3.8°C (June) warmer than at the ocean site; winter water temperature was 1.7°C (January) - 2.9°C (December) colder. The largest differences in measured mean daily water temperature between the bay and ocean sites occurred in May (3.9°C on 22 May) and December (-3.4°C on 13 Dec) (Table S1). Seasonal climatologies calculated from the gridded datasets at the coastal ocean site (COC-OI and COC-CCI) agree well with each other and with the measured data (COC-Meas) (Figure 2A). OISST-V2 resolution is too coarse to resolve the coastal bays, but summer mean SST from a representative SST-CCI grid location in the bays (CBW-CCI; Figure 1C) was more similar to values at the coastal ocean site than to water temperatures measured at the bay site; winter mean SST in the CBW-CCI record agreed well in magnitude with measured values (CBW-Meas; Figure 2A).
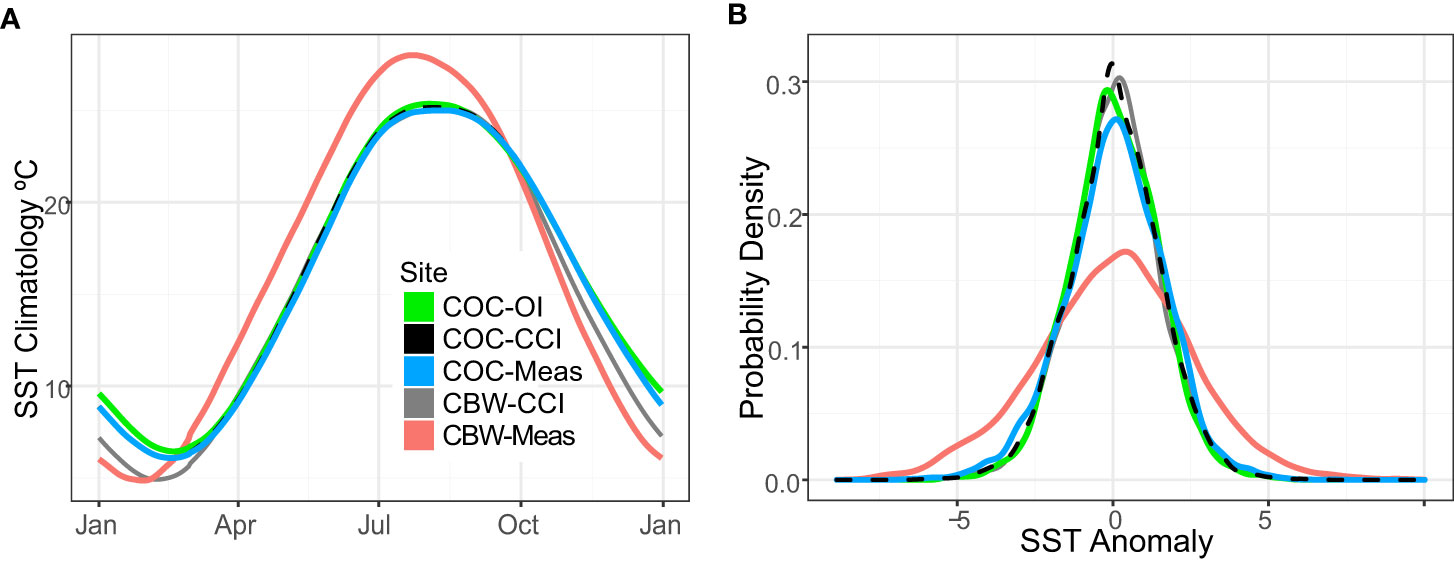
Figure 2 Statistics of SST time series at the bay and coastal ocean sites. (A) 30-year seasonal climatology for gridded (OI, CCI) and measured (Meas) time series at the coastal ocean (COC) and coastal bay (CBW) sites. (B) Probability distribution of SST anomaly for each site; colors as in (A).
In addition to amplification of annual average maximum and minimum water temperature at the coastal bay site compared to the coastal ocean site, the timing of temperature extremes in the bays was shifted to earlier in the year (Figure 2A). Peak summer measured water temperature in the seasonal climatology for the bay site occurred 20 days earlier than at the coastal ocean site; minimum winter measured temperature occurred 19 days earlier (Table S1).
Mean annual SST at the coastal bay and ocean sites increased significantly (p<0.05) between 1982 and 2021 in all records from both sites (Table 2). Trends in annual mean measured (0.30 ± 0.16°C/decade; mean ± 95% confidence limit) and gridded (0.19 ± 0.14°C/decade) SST at the ocean site and annual mean measured (0.21 ± 0.15°C/decade) and gridded (0.16 ± 0.14°C/decade) SST at the bay site did not differ significantly from each other over the 40 years of record. The 40-yr mean measured water temperature at the bay site was ~0.5°C warmer (p < 0.01) than at the coastal ocean site (Table 2).
The distribution (Figure 2B), mean annual variance, and trend in annual variance (Table 2) of the 40-yr SST anomaly time series did not differ significantly among records at the coastal ocean site or among gridded datasets at both sites. In contrast, the variance (Figure 2B; Table 2) of measured water temperature at the bay site (5.9 °C2) was more than twice that at the ocean site (~2°C2; Table 2; p<0.001), with no significant trend in annual variance. Variance in the measured record at the coastal ocean site could be artificially low owing to the use of several years of OISST-V2 values to fill missing periods in the instrumental record (see Methods). Focusing on the more recent, nearly complete parts of the measured records at both sites (2008 - 2021), variance at the coastal bay site was still more than twice that at the coastal ocean site. Daily air temperature differences were also significantly larger at the bay site (Figure S3).
3.2 Marine heat waves at the coastal bay and ocean sites
Thresholds for defining marine heatwaves (90th percentile of 30-yr daily SST climatology) peaked in mid-July with maximum measured threshold temperatures of 30.2°C at the bay site and 27.1°C at the ocean site (Table S1). The bay threshold was higher than the ocean threshold from early February – mid October (Figure S4A), following a pattern similar to that for seasonal climatology (Figure 2A). The difference between threshold temperatures in the bay and coastal ocean sites was greatest (4.9°C) just before the beginning of May and decreased almost linearly through the end of September when the difference was 1.1°C (Figure S4B).
3.2.1 June 2015 marine heatwave
A MHW recorded in the Virginia coastal bays during 12-26 June 2015 (Aoki et al., 2021) illustrates the spatial (Figures 1B–D) and temporal (Figure 3) patterns of SST in the measured and the OISST-V2 and SST-CCI/CS3 gridded records; the mean error index for the OISST-V2 dataset during the same period is provided in Figure S5 and OSTIA and CoralTemp SST are shown in Figure S6. While the patterns of SST in the coastal ocean, including Site COC, were similar in the measured and gridded datasets, distinct differences are evident in the coastal bays. AVHRR SST (Figure 1D) indicated that temperatures in the shallow coastal bays were much warmer than the adjacent ocean during the MHW, whereas none of the gridded datasets (Figures 1B, C, S6) showed warmer temperatures in the bays. In contrast with the shallow coastal bays, MHW SST in the much larger and deeper Chesapeake Bay to the west and Delaware Bay to the north agreed well in the AVHRR (Figure 1D) and OSTIA (Figure S6) datasets; OISST-V2 MHW SST was cooler in lower Chesapeake Bay and in Delaware Bay (Figure 1B) and SST-CCI/CS3 MHW SST (Figure 1C) was cooler in upper Chesapeake Bay compared to AVHRR SST.
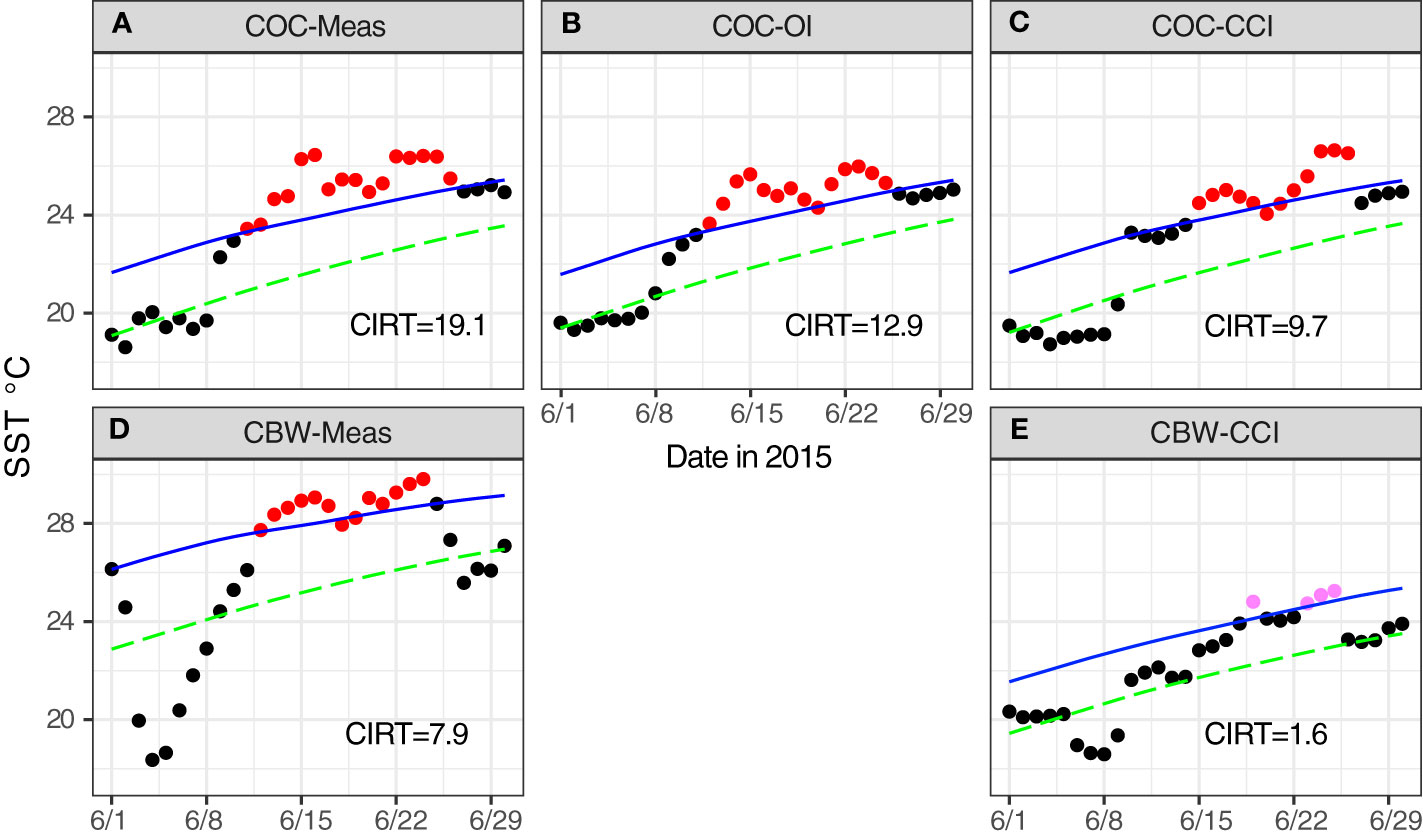
Figure 3 Time series of SST during the 12-26 June 2015 MHW. (A–C) SST at the coastal ocean site COC and (D, E) the coastal bay site CBW (Figure 1A). (A, D) measured SST; (B) OISST-V2 (not resolved at CBW); (C, E) CCI-SST. Red dots indicate MHWs; pink dots for CBW-CCI show SST > threshold but for < 5 days. Solid blue curves are MHW threshold conditions; dashed green curves are the seasonal climatology. Values of cumulative MHW intensity relative to the threshold (CIRT) are provided in each panel.
Measured and gridded June 2015 time series at the coastal ocean site followed a similar pattern, with a roughly 2-week MHW characterized by peak temperatures of 26-27°C (Figures 3A–C). Statistics for this MHW for each site and record are provided in Table S2. The measured time series at Site COC had a 50-100% higher value of cumulative intensity relative to threshold (CIRT; Figure 3A; Table S2) compared to time series from the gridded datasets (Figures 3B, C) owing to a combination of somewhat higher temperatures and longer duration for the MHW. Time series of SST for the bay revealed significant differences between measured (Figure 3D) and gridded (Figure 3E) SST in the bays and between the bay and ocean sites. The measured bay time series recorded the highest peak temperature of all sites while the gridded bay time series CBW-CCI had the lowest. Despite the high water temperatures, CIRT for the measured bay time series was lower than for the measured ocean time series because the MHW threshold for the bay site is about 4°C higher than the threshold for the ocean site in mid-June (Figures 3, S4). In contrast, while SST exceeded threshold conditions in the gridded bay time series for several days (CBW-CCI; Figure 3E), it was not high enough for long enough to qualify as a MHW even though the threshold was much lower.
3.2.2 Long-term characterization of MHWs
The time series for the coastal bay site extracted from the SST-CCI/CS3 gridded dataset (CBW-CCI) did not capture the seasonal climatology (Figure 2A) or the anomaly distribution (Figure 2B) of measured bay water temperatures (CBW-Meas). In addition, there was no MHW in the CBW-CCI record for June 2015 (Figure 3E). The correlation of daily SST anomaly for all pairs of records in the 40-yr record (Table S3) was strongest for the measured and OISST-V2 ocean site time series (COC-Meas vs. COC-OI), and the correlation between measured and SST-CCI/CS3 bay time series (CBW-Meas vs. CBW-CCI) was the lowest among all 5 records considered here (Table S3). Including the OSTIA time series and limiting the analysis to 2007-2021, yields similar results, with good agreement among all 3 gridded datasets and measured SST at the coastal ocean site (COC) but much weaker correlation at the coastal bay site (Table S4). In addition, both the CBW-CCI and CBW-OSTIA datasets underestimate high summer water temperatures in the bays (Table S1; Figure S6). For these reasons, the remainder of the analysis of MHWs focuses on the measured and OISST-V2 gridded temperature records for the coastal ocean site (COC-Meas and COC-OI) and the measured record for the coastal bay site (CBW-Meas).
During the 40-year period of record, there were 86 MHWs identified in the measured record at the coastal ocean site (COC-Meas; Table S5). Of these, 73 were also identified in the gridded ocean record COC-OI; 28 MHWs were identified in COC-OI but not in COC-Meas. There were 90 MHWs identified in the measured record at the bay site; 52 overlapped in time with MHWs identified in the measured ocean record (Table S5), and all except 4 of these were also identified in the gridded ocean time series. Only 5 MHWs identified in the measured and gridded records at the ocean site were not accompanied by at least 1 day of daily average water temperature above the MHW threshold at the bay site. Similarly, only 9 of the MHWs identified at the bay site were not reflected in at least 1 day with SST above the MHW threshold in the COC-Meas record; in 6 of these cases, there was at least 1 day above threshold in the COC-OI record. These results document a close coupling between high SST events at the coastal ocean and coastal bays sites even if the events did not simultaneously rise to the definition of a MHW in about 40% of the cases.
Peak MHW SST at the bay site was an average of 2.8°C (3.4°C in summer) higher than at the ocean site. In fact, during summer (June, July, and August), the highest peak MHW SST at the ocean site (28.8°C) was approximately equal to the lowest peak MHW temperature at the bay site (28.7°C; Figure 4A). The July 2015 MHW does not stand out for having an unusually high peak SST (Figure 4A; Table S5) or cumulative intensity relative to threshold (CIRT; Table S5) at either site relative to other summer MHWs. However, the duration of the June 2015 MHW is in the top 10-20% of summer MHWs at the two sites and is the summer MHW with the simultaneously longest durations at the two sites since 2000 (Figure 4B). (The distribution of durations of all threshold exceedance events is shown in Figure S7). There was a comparably long simultaneous MHW in 1995, prior to the beginning of seagrass restoration in the bays.
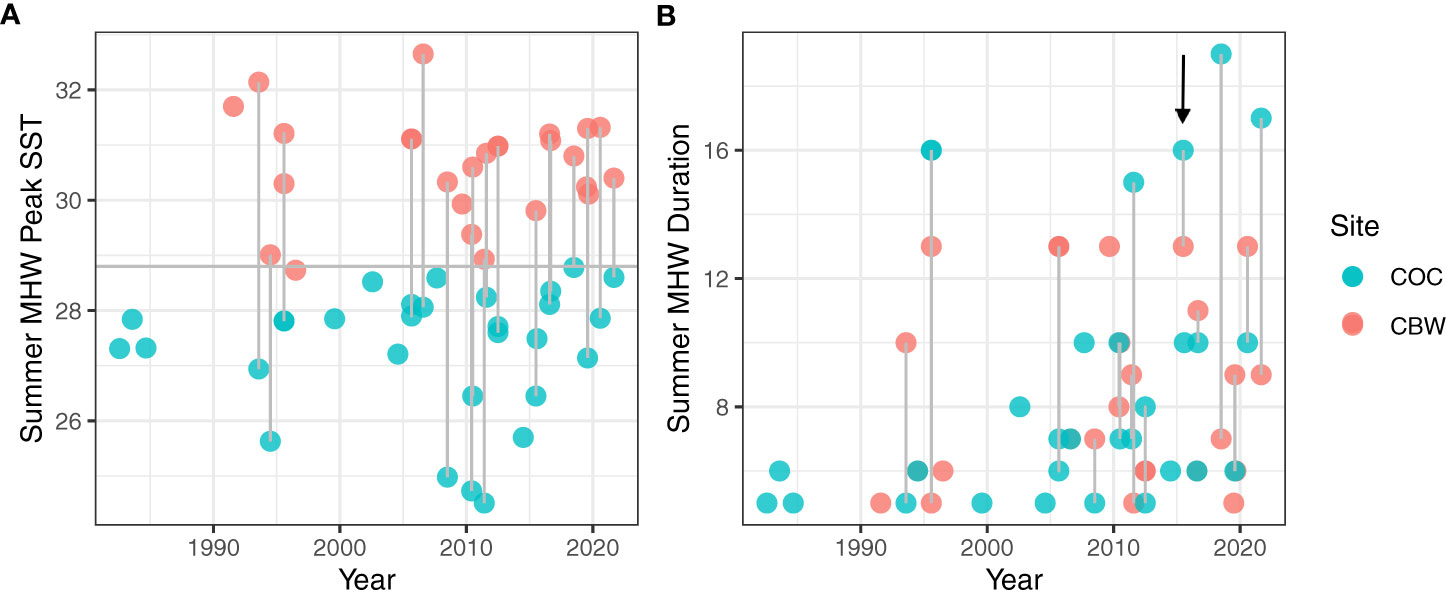
Figure 4 Summer MHW peak SST and duration. (A) Peak MHW SST during summer (June, July, August) and (B) MHW duration for the coastal ocean (COC, blue) and bay (CBW, red) sites. Each pair of points connected by a vertical line represents a MHW that occurred simultaneously at both sites. The horizontal line in (A) at SST=28.8°C separates peak ocean and bay peak MHW temperatures in summer. The black arrow in (B) points to the June 2015 MHW.
Mean annual MHW exposure (the number of MHW days in a year) increased significantly over the 40 years of record at the bay and ocean sites (Table 2; Figure S8A), with no significant differences in mean exposure or trend between sites owing to high interannual variability. MHW exposure depends on the number and duration of MHWs. The number of MHWs increased significantly at both sites over the period of record (increase of roughly 1 MHW/decade; no significant differences between sites; Table 2), whereas the trend in MHW duration was not significant in the measured records from either site. Similar patterns in MHW metrics have been reported for Chesapeake Bay (Mazzini and Pianca, 2022). Annual MHW intensity (annual maximum difference in MHW SST relative to climatology) was higher at the coastal bay site than the coastal ocean site (Figure S8B), reflecting the higher SST variance in the coastal bays (Table 2). MHW intensity significantly increased at the coastal ocean site but not at the coastal bay site (Table 2).
Trends in MHW intensity and exposure are linked to trends in annual mean and variance of SST (Oliver, 2019) Annual mean SST increased significantly in all records; annual SST variance increased significantly in the COC-OI record at the coastal ocean site but not at the coastal bay site (Table 2). Oliver (2019) predicted that a mean SST variance trend of 0.3°C2/decade (average variance trend for both sites) would produce a 0.1-0.6 °C/decade trend in MHW intensity (95% confidence interval). MHW intensity trends calculated from the time series at both sites are on the high side of this range, likely reflecting the additional contribution of the trend in mean SST. Trends in MHW exposure are more sensitive to trends in mean SST than SST variance (Oliver, 2019). For a mean SST trend of 0.25°C/decade (average SST trend for both sites), Oliver (2019) predicted a trend in MHW exposure of 7-20 MHW days/decade, similar to the range of values of MHW exposure trends calculated for the coastal bay and ocean sites.
3.3 Simulations of MHW trends from 1982-2100
Parameters for a first-order autoregressive (AR1) model to simulate SST were calculated from the SST anomaly time series for each site (Table 2). Values of the autoregressive or memory time scale, τ, fell in a range (8-19 days) typical for the global ocean (Oliver et al., 2021) and differed more between the measured and gridded datasets than between sites. Values of the error or residual standard deviation, σε, at the coastal ocean site were also in the range (0.5-0.6°C) of typical global values. However, the value of σε at the coastal bay site was twice as high (1.2°C) and far greater than global values derived from OISST-V2 gridded data (Oliver, 2019), likely because of the high variance of the SST anomaly at the bay site (Table 2).
Annual MHW characteristics derived from 500 simulated time series for 1982-2100 are shown in Figure 5; MHW characteristics for the measured and gridded time series are indicated by colored symbols during the first 40 years of each simulation. The results for the measured (COC-Meas) and gridded (COC-OI) record at the coastal ocean site were similar but reveal some sensitivity to differences in the AR1 parameters for the two records (Table S6), including modestly higher mean intensity and intensity trend for COC-Meas compared to COC-OI. Simulated exposure increased relatively rapidly for both records, with more variability for COC-OI and a higher trend for COC-Meas (Table S6), which was also reflected in the number of events per year; mean MHW duration in 2100 was similar for both records (23-27 days). There have been almost no days with SST > 28°C in the last 40 years in either record for the coastal ocean site, but that appears to be about to change, with simulated values for COC-Meas reaching an average of 37 days/yr by 2100 (Figure 5; Table S6).
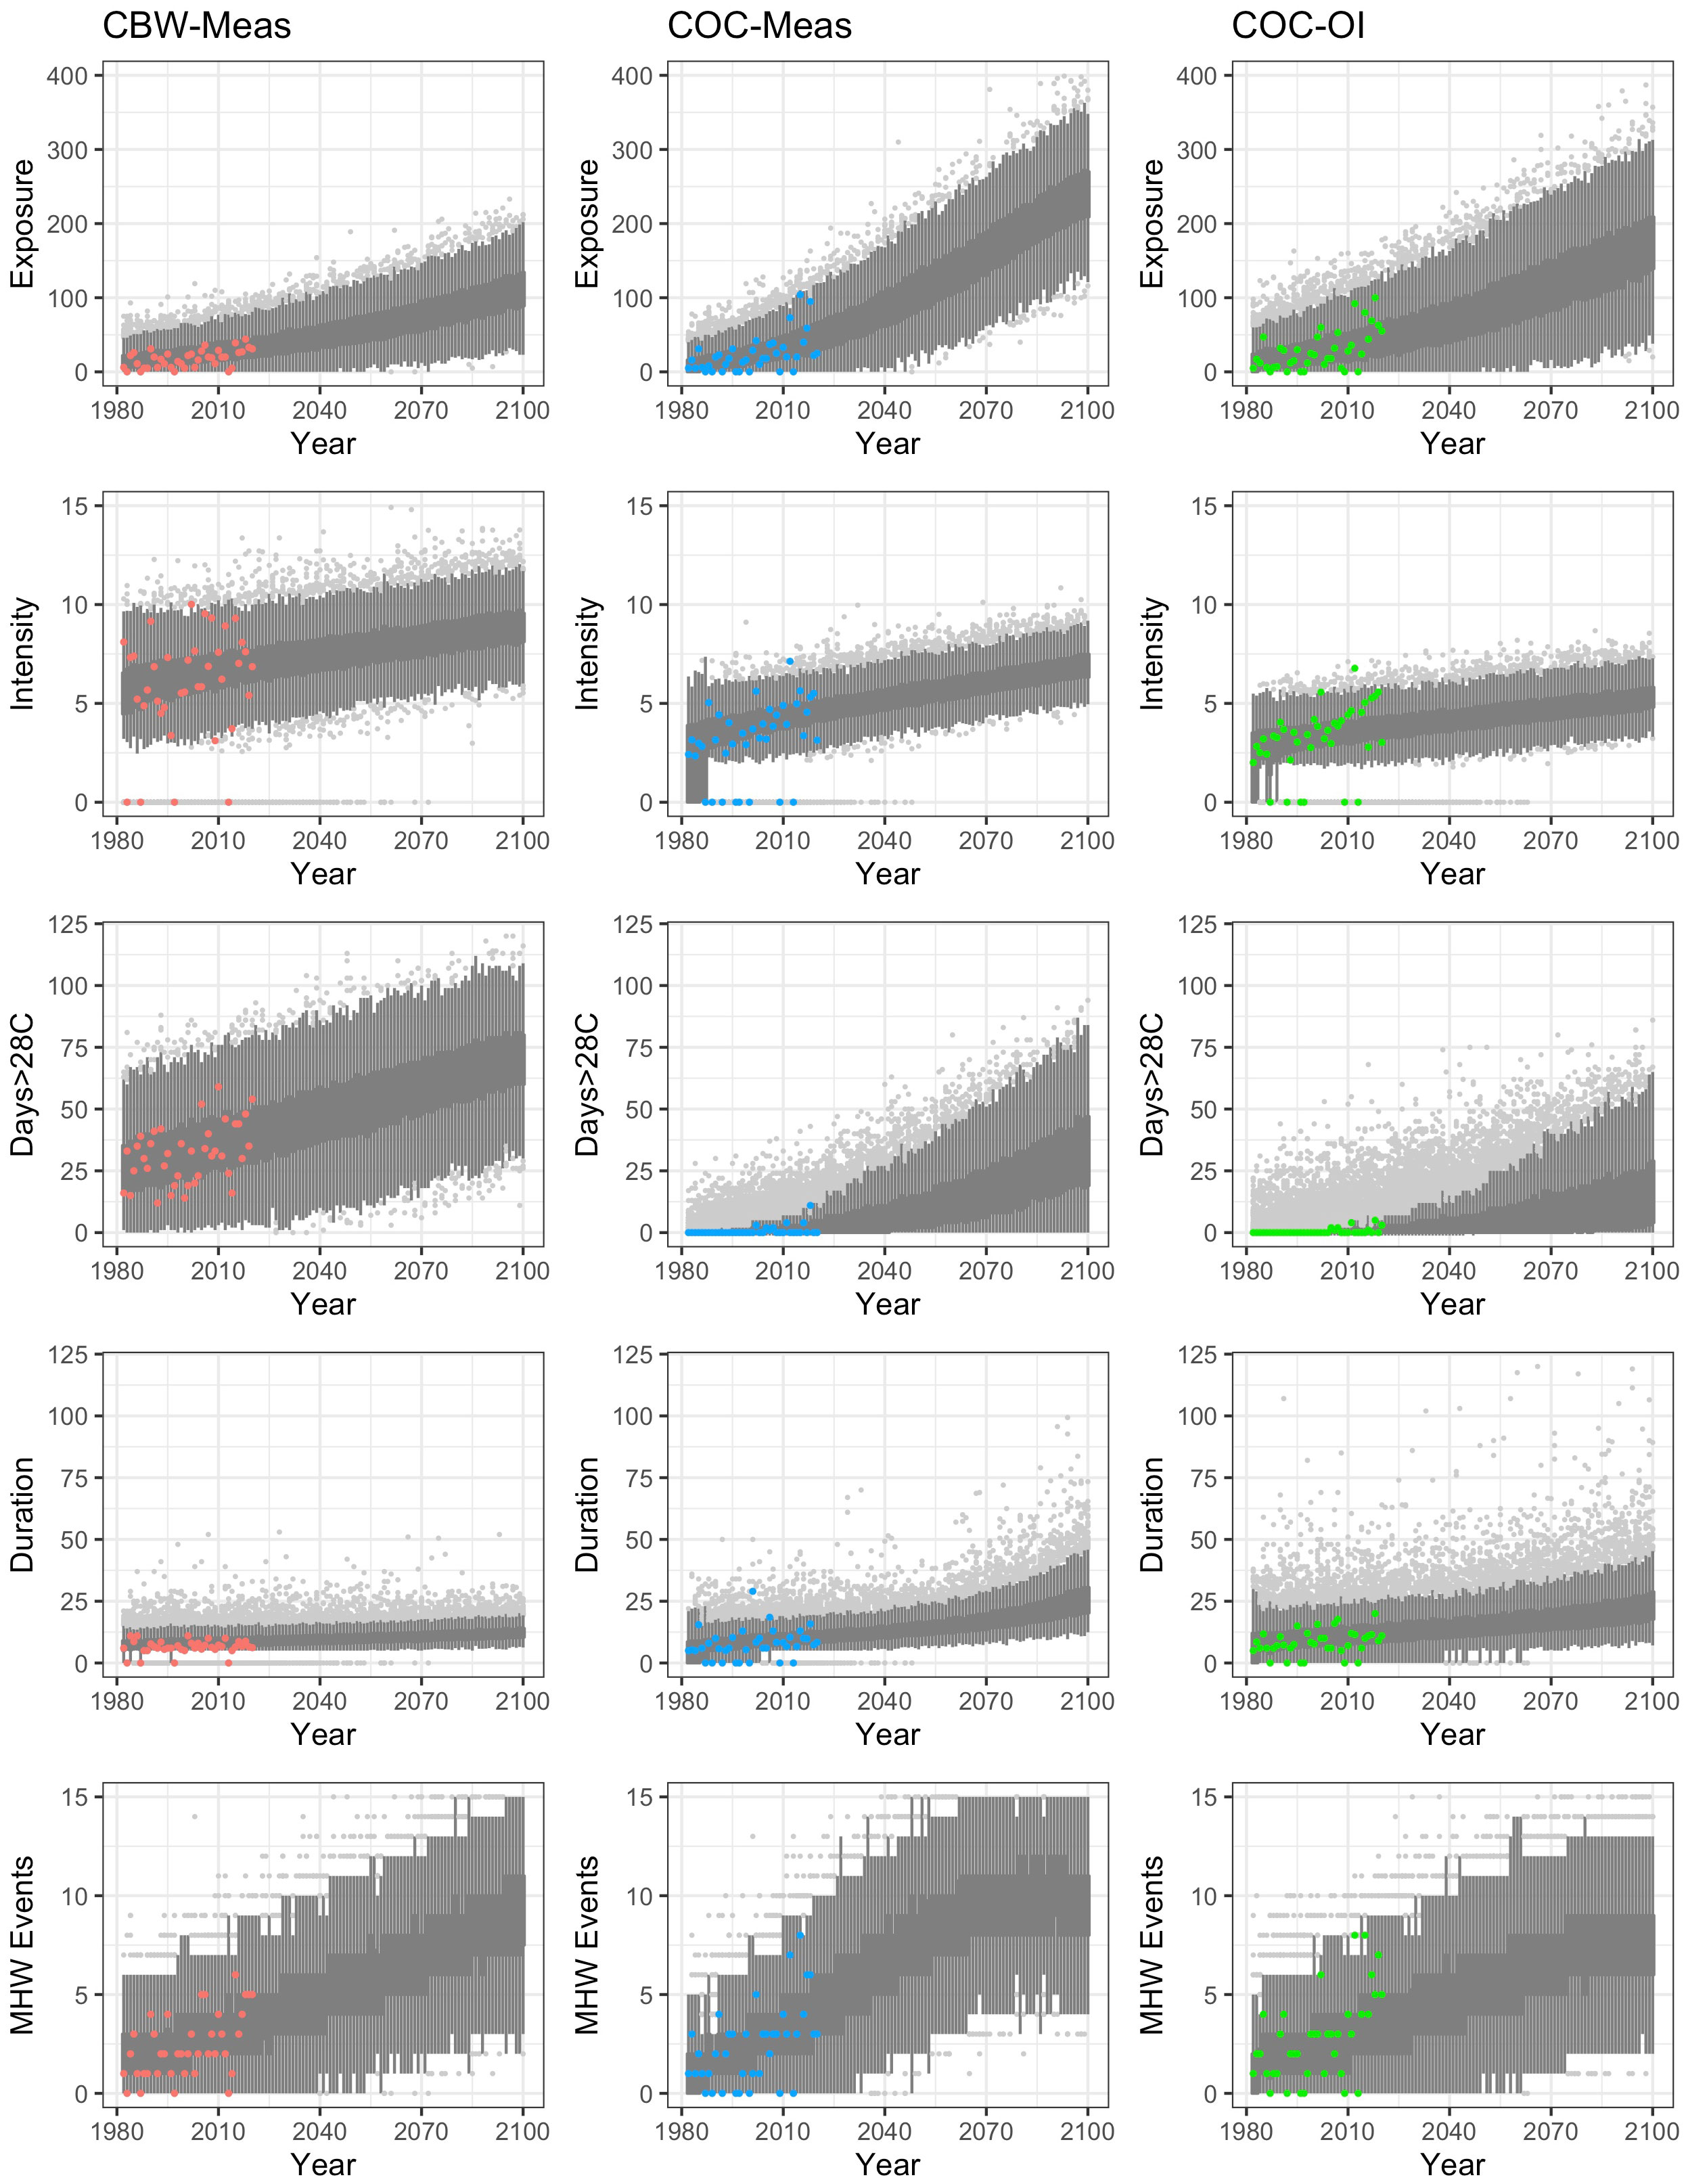
Figure 5 Annual MHW metrics from 500 simulations of SST from 1982-2100. Simulations are based on parameters derived from the measured coastal bay (CBW-Meas) and measured (COC-Meas) and gridded (COC-OI) coastal ocean SST time series (Table 2). The dark central bands of each panel indicate the 25-75 percentiles of simulated values; the bars above and below the central band extend from the 5th to 95th percentiles; the gray dots are outliers. Colored dots show annual MHW metrics from 1982-2021 for each record. Trends and values in year 2100 are provided in Table S6.
Simulated MHW values and trends were generally different for the coastal bay site. MHW intensity was higher and more variable but had a similar trend in the CBW-Meas record compared to COC-Meas, while MHW exposure was lower, less variable, and had a much lower trend (Figure 5; Table S6). MHW duration remained relatively short (mean of 13 days in 2100) owing to the high variance of the SST anomaly at the coastal bay site. Unlike exposure and intensity, the number and trend of MHW events/yr were similar to values at the coastal ocean site. The number of days with SST > 28°C at the bay site averaged 32 days/yr between 1982-2021; simulated values reached an average of 71 days/yr by 2100 (Figure 5; Table S6).
4 Discussion
Long-term, complete, gridded sea surface temperature (SST) datasets have transformed the study of marine heatwaves (MHWs), leading to scores of recent studies; see Oliver et al. (2021) for a recent review. Measured and gridded SST time series at the coastal ocean site were relatively well correlated (Tables S3, S4). Differences in means and trends of SST and MHW metrics derived from the measured (COC-Meas) and OISST-V2 (COC-OI) datasets for the coastal ocean site were not significant and both differed in consistent ways from SST and MHW metrics and trends calculated using the measured time series at the coastal bay site (CBW-Meas) (Table 2; Figure 5).
It is important, however, to recognize the limitations of these datasets. In the context of the present study of marine heatwaves in shallow coastal bays, the resolution of the NOAA OISST-V2 dataset is too coarse to resolve bays that are less than a few hundred km2 in surface area. The SST-CCI/CS3 and OSTIA datasets have a higher resolution, but the results shown in Figures 1, S6 as well as Tables S1–S4 indicate that the SST-CCI and OSTIA datasets did not accurately capture high summer SST in the relatively small, shallow coastal bays characteristic of the study area and many other coastal-barrier systems. This is problematic because shallow coastal bays and lagoons are home to many important coastal ecosystems, some of which are known to be sensitive to heat stress (e.g., seagrasses (Berger et al., in review) and oysters (Donelan et al., 2021)). Few coastal bay sites have the long-term records of water temperature necessary to quantify MHW metrics and trends, making available gridded datasets an obvious alternative. The results presented here indicate use of these long-term high-resolution gridded datasets may significantly underestimate summer SST and lead to errors in identification of MHWs in relatively small, shallow coastal bays.
The 40-yr record of measured water temperatures constructed in this study for a site in the Virginia coastal bays illustrates the persistent, large differences in SST that can be present between shallow coastal bays and the adjacent coastal ocean. Water temperatures in the bays averaged several degrees warmer in summer and colder in winter than in the coastal ocean and temperature extremes were reached several weeks earlier (Figure 2A). The trend in SST was in the range of 0.2-0.3°C/decade at both sites (Table 2), but the variance in daily average SST anomaly was twice as large at the coastal bay site (Table 2; Figure 2B). These differences reflect a greater responsiveness of water temperature in the coastal bays to changes in air temperature, as would be expected given their shallow depths. In addition, despite their proximity, air temperature at the coastal bay site, which is on the landward margin of the bays, was more variable than at the coastal ocean site, with an average summertime daily maximum-minimum air temperature difference of 6.5°C compared to a daily maximum-minimum difference of 1.5°C at the coastal ocean site (Figure S3). The daily temperature metric most similar between summer air temperature and SST at the coastal ocean site was daily minimum while for the coastal bay site it was daily maximum (Figure S3) suggesting that maximum daily air temperatures may be the primary control on water temperature in the shallow bays in summer whereas minimum daily air temperature is more important for SST in the coastal ocean.
Marine heatwaves are defined relative to local conditions. Higher temperatures in shallow coastal bays produce higher seasonal climatologies and MHW threshold conditions than those that apply to the coastal ocean site (Figures 2A, S4). As a result, values of MHW exposure and intensity do not reflect the mean temperature difference between the sites. Annual MHW exposure was relatively similar at both sites from 1982-2021, although for 4 of the last 10 years, the coastal ocean site experienced dramatically higher annual exposure than in the previous 30 years (Figure S8), mostly due to an increase in the frequency of events rather than their duration (Figure 4). Annual intensity was consistently higher at the coastal bay site (Table 2; Figure S8) because of the higher variance of the SST anomaly at that site. The high variance also affected the durations of exceedance events. Heatwave thresholds are typically defined such that, on average, 10% of days exceed the threshold temperature. Most exceedance events were not long enough to qualify as MHWs at either site (Figure S7), but the fraction of events lasting 1-4 days was higher in the measured (75%) than the gridded (63%) coastal ocean record and higher in the bay (82%) than the coastal ocean, consistent with differences in variance among the records (Table 2). By the same token, 5% of exceedance events in the ocean records lasted more than 20 days (measured and gridded), but just 1 of 417 exceedance events in the bay record was longer than 20 days (Figure S7).
The maximum MHW threshold SST was 3°C higher at the bay site than the coastal ocean site (Figure S4). The summer (June-August (JJA)) threshold difference was such that bay water temperature exceeded the ocean site MHW threshold for most of each summer: 78% of JJA, 71% of May – Sep. This was true even for relatively cool summers with no MHWs at the coastal bay or ocean sites. In contrast, ocean SST never exceeded the JJA bay MHW threshold during 1982-2021. This leads to the striking separation of peak summer MHW SST at the ocean and bay sites at a daily average temperature of 28.7-28.8°C (Figure 4A). This is close to the threshold temperature that has been associated with thermal stress in seagrass meadows (28.6°C) (Berger et al., in review). Because coastal ocean SST has been below this threshold even during MHWs, ocean water entering the bays through tidal inlets has provided some thermal relief to ecosystems proximal to the inlets (Berger et al., in review). For example, the June 2015 MHW caused significant dieback in the center of a seagrass meadow in one of the Virginia coastal bays (South Bay), while portions of the meadow closest to the inlet either experienced no dieback or recovered faster than portions further from the inlet (Aoki et al., 2021).
The temperature disparity between the bays and coastal ocean is also evident in the number of days each year when daily average SST ≥ 28°C (Figure 5). Until the early 2000s, daily average SST never exceeded 28°C at the coastal ocean site; since then, there have been an average of less than 1.5 days/yr with SST ≥ 28°C. In contrast, the coastal bay site has averaged 32 days/year with daily average SST ≥ 28°C. As temperatures increase in the ocean, the predicted number of 28°C exceedance days also increases. Simulations of SST to the year 2100 give a mean of 18 and 37 exceedance days for the COC-OI and COC-Meas datasets, respectively (Table S6). Simulations for the coastal bay site predict an average of 71 days/yr with SST ≥ 28°C in 2100 and a 5% chance that there could be 100 exceedance days in a year (Figure 5). This would place the coastal bays in thermal stress conditions for most of the summer, with limited relief from lower temperature ocean water exchange through the tidal inlets. In a system otherwise hospitable to productive seagrass (Orth et al., 2020) and oyster communities (Smith et al., 2022), thermal stress associated with unrelenting high water temperatures may be the greatest threat to these ecosystems.
All annual MHW metrics are trending upward in the simulations to 2100 (Figure 5; Table S6) primarily because of the positive trend in annual SST in all records (Table 2). A MHW analysis of detrended SST time series at the coastal bay and ocean sites yields no significant trends in MHW metrics for the 40-yr records or the longer-term simulations. As discussed by Oliver et al. (2021), the choice of a fixed (as used here) vs. moving baseline analysis of MHWs depends on the questions motivating the study. If ecosystem vulnerability to heat stress is the main concern, especially when there appears to be a temperature tolerance threshold, then a fixed baseline analysis is valuable for considering the potential for future increases in temperature stress. In the simulations run here, the increase is greatest for MHW exposure and number of events, both of which increase about five-fold from 1982-2100. The MHW simulations did not explicitly account for connectivity between coastal bay and ocean water, although the record of MHWs from 1982-2021 for both sites in this study revealed a considerable degree of coupling between these systems, with high SST events generally occurring simultaneously at both sites even if they did not last long enough to qualify as a MHW (Table S5). This coupling could affect future MHW characteristics in the coastal bays, particularly if trends in SST inside and outside the coastal bays are such that differences in seasonal climatology and threshold temperatures decrease with time. This reinforces the need for developing and maintaining long-term measurements of water temperature in shallow coastal systems in order to identify changes in conditions and trends as global ocean temperatures warm.
Data availability statement
Publicly available datasets were analyzed in this study. This data can be found here: https://portal.edirepository.org/nis/mapbrowse?packageid=knb-lter-vcr.393.2, https://psl.noaa.gov/data/gridded/data.noaa.oisst.v2.highres.html, https://climate.esa.int/en/projects/sea-surface-temperature/, https://rucool.marine.rutgers.edu/integrated-ocean-technology/remote-sensing/, https://data.marine.copernicus.eu/product/SST_GLO_SST_L4_NRT_OBSERVATIONS_010_001/description, https://coralreefwatch.noaa.gov/product/5km/index_5km_sst.php, https://tidesandcurrents.noaa.gov/, https://www.ncei.noaa.gov/access/crn/, https://www.ndbc.noaa.gov/, https://portal.edirepository.org/nis/mapbrowse?scope=knb-lter-vcr&identifier=61. Code used to calculate temperature and marine heatwave statistics can be found here: https://github.com/plwiberg/MarineHeatwaveDataCode.
Author contributions
The author confirms being the sole contributor of this work and has approved it for publication.
Funding
Funding for this study was provided by the National Science Foundation through the VCR LTER award 1832221.
Conflict of interest
The author declares that the research was conducted in the absence of any commercial or financial relationships that could be construed as a potential conflict of interest.
Publisher’s note
All claims expressed in this article are solely those of the authors and do not necessarily represent those of their affiliated organizations, or those of the publisher, the editors and the reviewers. Any product that may be evaluated in this article, or claim that may be made by its manufacturer, is not guaranteed or endorsed by the publisher.
Supplementary material
The Supplementary Material for this article can be found online at: https://www.frontiersin.org/articles/10.3389/fmars.2023.1129295/full#supplementary-material
References
Aoki L. R., McGlathery K. J., Wiberg P. L., Oreska M. P. J., Berger A. C., Berg P., et al. (2021). Seagrass recovery following marine heat wave influences sediment carbon stocks. Front. Mar. Sci. 7, 576784. doi: 10.3389/fmars.2020.576784
Arias-Ortiz A., Serrano O., Masqué P., Lavery P. S., Mueller U., Kendrick G. A. (2018). A marine heatwave drives massive losses from the world’s largest seagrass carbon stocks. Nat. Clim. Change 8, 338–344. doi: 10.1038/s41558-018-0096-y
Banzon V., Smith T. M., Liu C., Hankins W. (2016). A long-term record of blended satellite and in situ sea-surface temperature for climate monitoring, modeling and environmental studies. Earth Syst. Sci. Data 8, 165–176. doi: 10.5194/essd-8-165-2016
Berger A. C., Berg P., McGlathery K. J., Delgard M. L. (2020). Long-term trends and resilience of seagrass metabolism: A decadal aquatic eddy covariance study. Limnol. Oceanogr. 65, 1423–1438. doi: 10.1002/lno.11397
Cavanaugh K. C., Reed D. C., Bell T. W., Castorani M. C. N., Beas-Luna R. (2019). Spatial variability in the resistance and resilience of giant kelp in southern and Baja California to a multiyear heatwave. Front. Mar. Sci. 6, 413. doi: 10.3389/fmars.2019.00413
Chatfield C. (2004). The analysis of time series: an introduction. 6th Ed (Boca Raton, FL: CRC Press). 333 pp.
Diamond H. J., Karl T. R., Palecki M. A., Baker C. B., Bell J. E., Leeper R. D. (2013). U.S. Climate Reference Network after one decade of operations: status and assessment. Bull. Amer. Meteor. Soc 94, 489–498. doi: 10.1175/BAMS-D-12-00170.1
Donelan S. C., Breitburg D., Ogburn M. B. (2021). Context-dependent carryover effects of hypoxia and warming in a coastal ecosystem engineer. Ecol. Appl. 31, e02315. doi: 10.1002/eap.2315
Fagherazzi S., Wiberg P. L. (2009). Controls on fetch, wind waves and wave-generated shear stresses in a shallow coastal lagoon. J. Geophys. Res. 114, F03022. doi: 10.1029/2008JF001139
Good S. A., Embury O., Bulgin C. E., Mittaz J. (2019). ESA Sea Surface Temperature Climate Change Initiative (SST_cci): Level 4 Analysis Climate Data Record, version 2.1 (Centre for Environmental Data Analysis). doi: 10.5285/62c0f97b1eac4e0197a674870afe1ee6
Good S., Fiedler E., Mao C., Martin M. J., Maycock M., Reid R., et al. (2020). The current configuration of the OSTIA system for operational production of foundation sea surface temperature and ice concentration analyses. Remote Sens. 12, 720. doi: 10.3390/rs12040720
Hobday A. J., Alexander L. V., Perkin S. E., Smale D. A., Straub S. C., Oliver E. C. J., et al. (2016). A hierarchical approach to defining marine heatwaves. Prog. Oceanogr. 141, 227–238. doi: 10.1016/j.pocean.2015.12.014
Hobday A. J., Oliver E. C. J., Sen Gupta A., Benthuysen J. A., Burrows M. T., Donat M. G. (2018). Categorizing and naming marine heatwaves. Oceanography 31, 162–173. doi: 10.5670/oceanog.2018.205
zHuang B., Liu C., Freeman E., Graham G., Smith T., Zhang H.-M. (2021). Assessment and intercomparison of NOAA daily optimum interpolation sea surface temperature (DOISST) version 2.1. J. Climate 34, 2923–2939. doi: 10.1175/JCLI-D-20-0166.1
Liu G., Heron S. F., Eakin C. M., Muller-Karger F. E., Vega-Rodriguez M., Guild L. S., et al. (2014). Reef-Scale thermal stress monitoring of coral ecosystems: New 5-km global products from NOAA Coral Reef Watch. Remote Sens. 6, 11579–11606. doi: 10.3390/rs61111579
Mazzini P. L., Pianca C. (2022). Marine heatwaves in Chesapeake Bay. Front. Mar. Sci. 8, 750265. doi: 10.3389/fmars.2021.750265
Merchant C. J., Embury O., Bulgin C. E., Block T., Corlett G. K., Fiedler E., et al. (2019). Satellite-based time-series of sea-surface temperature since 1981 for climate applications. Sci. Data 6, 223. doi: 10.1038/s41597-019-0236-x
Millennium Ecosystem Assessment (2005). Ecosystems and Human Well-being: Synthesis (Washington, DC: Island Press).
Oliver E. C. J. (2019). Mean warming not variability drives marine heatwave trends. Clim. Dyn. 53, 1653–1659. doi: 10.1007/s00382-019-04707-2
Oliver E. C. J., Benthuysen J. A., Darmaraki S., Donat M. G., Hobday A. J., Holbrook N. J., et al. (2021). Marine heatwaves. Annu. Rev. Mar. Sci. 13, 313–342. doi: 10.1146/annurev-marine-032720-095144
Orth R. J., Lefcheck J. J., McGlathery K. J., Aoki L., Luckenbach M. L., Moore K. A., et al. (2020). Restoration of seagrass habitat leads to rapid recovery of coastal ecosystem services. Sci. Adv. 6, eabc6434. doi: 10.1126/sciadv.abc6434
Porter J. H., Krovetz D. O., Spitler J., Williams T., Overman K. M (2022). Tide Data for Hog Island (1991-) Redbank (1992-) Oyster (2007-) ver 37. Environmental Data Initiative. doi: 10.6073/pasta/ce3d3fc977fce7cff678da2d121714a2
Reynolds R. W., Smith T. M., Liu C., Chelton D. B., Casey K. S., Schlax M. G. (2007). Daily high-resolution-blended analyses for sea surface temperature. J. Climate 20, 5473–5496. doi: 10.1175/2007JCLI1824.1
Safak I., Wiberg P. L., Kurum M. O., Richardson D. L. (2015). Controls on residence time and exchange in a system of shallow coastal bays. Cont. Shelf Res. 97, 7–20. doi: 10.1016/j.csr.2015.01.009
Smale D. A., Wernberg T., Oliver E. C. J., Thomsen M., Harvey B. P., Staub. S. C., et al. (2019). Marine heatwaves threaten global biodiversity and the provision of ecosystem services. Nat. Clim. Change 9, 306–312. doi: 10.1038/s41558-019-0412-1
Smith R. S., Lusk B., Castorani M. C. N. (2022). Restored oyster reefs match multiple functions of natural reefs within a decade. Conserv. Lett., e12883. doi: 10.1111/conl.12883
Keywords: marine heatwaves, shallow coastal bays, sea-surface temperature, seagrass, ocean warming
Citation: Wiberg PL (2023) Temperature amplification and marine heatwave alteration in shallow coastal bays. Front. Mar. Sci. 10:1129295. doi: 10.3389/fmars.2023.1129295
Received: 21 December 2022; Accepted: 07 August 2023;
Published: 07 September 2023.
Edited by:
Ivica Vilibic, Rudjer Boskovic Institute, CroatiaReviewed by:
John Lehrter, University of South Alabama, United StatesYulong Yao, Chinese Academy of Sciences (CAS), China
Copyright © 2023 Wiberg. This is an open-access article distributed under the terms of the Creative Commons Attribution License (CC BY). The use, distribution or reproduction in other forums is permitted, provided the original author(s) and the copyright owner(s) are credited and that the original publication in this journal is cited, in accordance with accepted academic practice. No use, distribution or reproduction is permitted which does not comply with these terms.
*Correspondence: Patricia L. Wiberg, cHczY0B2aXJnaW5pYS5lZHU=