
95% of researchers rate our articles as excellent or good
Learn more about the work of our research integrity team to safeguard the quality of each article we publish.
Find out more
ORIGINAL RESEARCH article
Front. Mar. Sci. , 23 February 2023
Sec. Marine Pollution
Volume 10 - 2023 | https://doi.org/10.3389/fmars.2023.1124580
This article is part of the Research Topic Plastic Pollution in a Changing Marine Environment: Effects and Risk View all 7 articles
 David Vanavermaete1*
 Katrien Verlé1
 Lisa I. Devriese2
 Karien De Cauwer3
 Coline De Schrijver3
 Els Torreele1
 Loes Vandecasteele1
 Milica Velimirovic4Kristof Tirez4
 Kris Hostens1
 Bavo De Witte1
Marine litter is recognized as a global environmental concern. Seafloor litter can provide important information to help assess the status of the marine ecosystem and is relatively easy to collect on a regular basis. The Belgian fisheries area covers different parts of the OSPAR Greater North Sea region and the Celtic Seas. In these regions, seafloor litter data were gathered by quantifying the litter items caught in the trawl net during two different fisheries surveys to investigate litter distribution on both regional and local scales. In the international beam trawl survey (BTS), covering essentially the OSPAR Greater North Sea and Celtic Seas, an average of 2.2 ± 0.05 items.ha-1 were caught with a median of 1.4 items.ha-1. In the environmental monitoring survey (EMS) only the Belgian part of the North Sea was covered and a smaller cod-end mesh size was used, resulting in 12.7 ± 1.7 litter items.ha-1 in the coastal zone (< 12 nm) and 2.8 ± 0.2 items.ha-1 in the more offshore zone (> 12 nm). In both surveys plastic items were predominant, representing up to 88% of the collected litter in the Belgian part of the North Sea. The impact of human activities at sea such as fisheries, sand extraction, wind farms and dredge disposal was investigated. A significant correlation was found between fishing activities and the amount of litter registered in the Belgian part of the North Sea, but not for the OSPAR Greater North Sea and Celtic Seas.
Marine litter consists of man-made solid waste materials that end up in the marine environment. An estimated nine to 14 million tons of marine litter enters the oceans each year and by 2040, this amount is expected to rise above 23 million tons (United Nations Environment Programme, 2021). Marine litter mainly consists of plastic (61% – 87%) (Bergmann et al., 2017; Sheppard, 2018) and the main source is land-based (United Nations Environment Programme, 2021). Nevertheless, marine litter has also been associated with fisheries and mariculture (Buhl-Mortensen and Buhl-Mortensen, 2017; Gutow et al., 2018). A link between litter distribution and fishing intensity was observed on a regional scale (Buhl-Mortensen and Buhl-Mortensen, 2018). However, hydrodynamic and geomorphological processes can influence the spatial distribution of marine litter (Koutsodendris et al., 2008; Ramirez-Llodra et al., 2013) resulting in its accumulation in all habitats of the world’s oceans, even in the most remote areas such as the Arctic (Browne et al., 2011; Bergmann and Klages, 2012). Human activities at sea could also affect the seafloor litter distribution. Sand extraction and dredge disposal activities may disturb the seabed resulting in hydrodynamic accumulation of seafloor litter (Fakiris et al., 2022), whereas, for offshore wind farms, no clear link has been reported so far (Abramic et al., 2021).
Depending on the density of the material, marine litter can sink to the sea floor, drift in the water column or float in surface water (OSPAR, 2014; Cózar et al., 2015). Marine litter can impact the benthic habitat and reduce photosynthesis and the movement of organisms, gases and nutrients (OSPAR, 2017b). Additionally, marine litter can be swallowed and can entangle organisms, which may injure them, reduce mobility, or even result in their death (Foekema et al., 2013). In combination with other stressors such as climate change, a negative synergistic effect is observed on the marine ecosystem (Ford et al., 2022). Therefore, marine litter has been recognized as a global concern and a major environmental challenge (Law, 2017; Laufkoetter et al., 2020).
The European Marine Strategy Framework Directive (MSFD) states that marine litter should be contained to a level where it does not harm the coastal and marine environment with specification of the different compartments to be evaluated (MSFD, 2008/56/EC; 2017/848/EU; Descriptor 10, criterion 2). Additionally, the zero pollution action plan aims to improve water quality by reducing plastic litter at sea by 50% by 2030 (European Commission, 2021). As a consequence, documentation and follow-up of the state of litter pollution is necessary. A possible way to monitor seafloor litter, is by assessing the litter content in a fishing haul. Within fisheries campaigns of the International Council for the Exploration of the Sea (ICES) such as the International Bottom Trawl Survey (IBTS) and Beam Trawl Survey (BTS), joined protocols to record litter in a standardized manner have been defined (Moriarty et al., 2016; ICES, 2018b; ICES, 2022). This approach has the advantage of combining fisheries and environmental monitoring.
Between 2007 and 2017, no change in plastic pollution on the seafloor was observed in the North Sea (Maes et al., 2018), whereas in the Baltic Sea, a slight increase was observed (Zablotski and Kraak, 2019). Kammann et al. (2018) reported a mean seafloor litter abundance of 0.17 items.ha-1 and 0.05 items.ha-1, respectively for the North Sea and Baltic Sea (mesh size of 20 mm). In the German part of the North Sea, seafloor litter was detected in 70 out of 122 bottom trawls with a mean of 13.1 (SD= 33.5) items.ha-1 (mesh size of 10 mm) (Gutow et al., 2018). In France, a decreasing trend was observed from 2000 to 2013 followed by an increasing trend towards 2017 (Gerigny et al., 2019). Although the amount of litter found in many coastal areas remained steady over the years, the total amount of marine litter increased. Remote areas can act as reservoirs in which litter accumulates over time making it challenging to predict the overall effect of marine litter on the marine ecosystem by only monitoring coastal and nearshore areas (Galgani et al., 2021).
The main goal of this study is to assess the distribution of litter on a regional scale (OSPAR Greater North Sea and Celtic Seas) and a local scale (Belgian part of the North Sea) based on data from the BTS and from a local environmental monitoring survey (EMS). Because the EMS applied a net with a smaller cod-end mesh size (20 mm) compared to the BTS (40 mm), smaller litter fragments were detected, resulting in a more profound assessment. The spatial distribution of litter was mapped and linked to possible sources at sea such as fishing activities, offshore wind farms, sand extraction, and dredge disposal activities.
To assess seafloor litter in the OSPAR Greater North Sea and Celtic Seas, BTS data were extracted from the ICES DATRAS database that contains the haul information from 2011 to 2019 submitted by Belgium, Germany, the Netherlands and Great Britain (Dataset ICES, 2021a). Data were collected using a beam trawl of 4 to 8 m and a net with a cod-end mesh size of 40 mm (stretched). To assess seafloor litter on a local scale, data were collected within the EMS conducted by the Flanders Research Institute for Agriculture, Fisheries and Food (ILVO-Marine) from 2013 to 2019. The EMS data covers the Belgian part of the North Sea, an area of 345,400 ha situated along the Belgian coast in Western Europe. Data were collected in spring (March) and fall (October) using a beam trawl of 8 m and a net with a cod-end mesh size of 20 mm (stretched). A complete overview of the different hauls collected during the EMS is reported in the Supplementary Material Table S2. In both campaigns (EMS and BTS), seafloor litter was collected according to OSPAR (2017a) and MSFD (JRC, 2013) guidelines.
A total of 2800 observations (hauls) were obtained from the BTS database. The measured haul length was compared with the calculated haul length (D):
with rethe radius of the earth, Ls the shoot latitude, Lh the haul latitude, ls the shoot longitude, and lh the haul longitude. In the BTS data, the length of 12 hauls was missing and the length of 24 hauls deviated by more than 20% when compared to the calculated haul length. For these 36 hauls, the calculated haul length (D) was used instead of the measured haul length. Observations that were labelled as invalid were excluded, as were the hauls with missing or inconsistent data and three outliers with over 100 items. In total 2695 observations were maintained including 324 tracks with no litter. A detailed description of the data cleaning is given in the Supplementary Material.
From the EMS, a total of 467 observations (hauls) were included in the dataset. After removing six hauls with (partially) missing data, a total of 461 observations were retained, including 29 hauls with no litter. If no length was available, the distance between the shoot and haul of the track was calculated according to Eq. 1. For both surveys, the data were standardized by dividing the number of items by the surface area swept by each haul (length of the haul times length of the beam).
Data processing was performed in R (version 4.1.2). For the BTS, seafloor litter data were visualized using grid cells of 0.5×0.5 degrees, while for the environmental survey (EMS) data in the Belgian part of the North Sea, grid cells of 0.05×0.05 degrees were used. The midpoint of each haul was used to allocate the haul to a grid cell. All observations within the same grid cell were pooled. The number of hauls per grid cell is illustrated in Figure 1. The midpoints of each haul were also linked to the sediment type using the EMODnet-Geology substrate map (scale 1:250.000) (Version October 2016) (Van Lancker et al., 2008). The Folk classification was used to make a distinction between the percentage of mud (<63μm), sand (63μm – 2mm) and gravel (>2mm). In total four sediment types were encountered (muddy sand, sand, coarse substrate and mixed sediment). Because mixed sediment was only encountered in one haul, it was not included in this study.
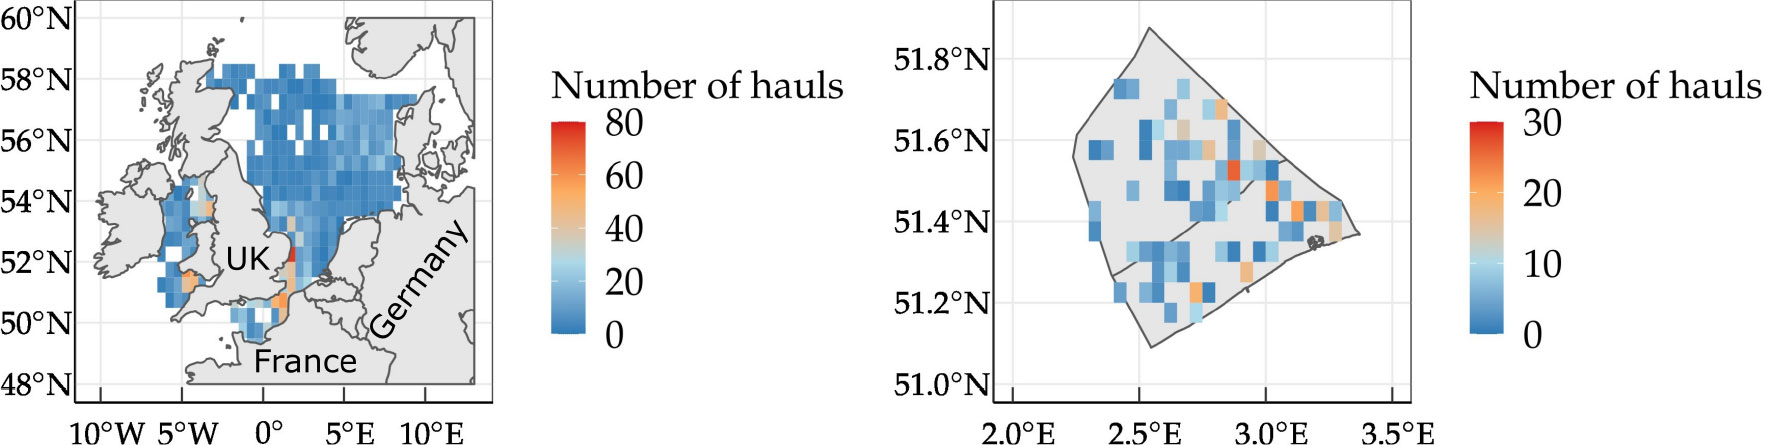
Figure 1 Left panel: spatial overview of the number of hauls per grid cell (0.5 × 0.5) (2011-2019 combined) for BTS in the OSPAR Greater North Sea and Celtic Seas (N = 2695). Right panel: spatial overview of the number of hauls per grid cell (0.05 × 0.05) (2013-2019 combined) for the EMS in the Belgian part of the North Sea (N = 461).
Litter was divided into categories: plastic (A), metals (B), rubber (C), glass and ceramics (D), natural products (E), and miscellaneous objects (F) (JRC, 2013). Each category can further be divided into subtypes. To study litter originating from fishing activities, subtypes monofilament fishing line (A5), entangled monofilament fishing line (A6), fishing net (A8), fishing related metal (B3) and fishing related rubber bobbins (C3) were combined. This remains indicative as, on the one hand, not all monofilaments (A5-A6) will originate from fisheries, and on the other hand synthetic ropes (A7) can also originate from fishing activities. A full overview of the litter categories is reported in the Supplementary Material in Table S1. In this text, the mean amount of litter is reported with its standard error (SE) unless otherwise stated.
The effect of fisheries was further studied by assessing the fishing intensity in the North Sea. Data on bottom fishing (beam trawler, dredge, demersal seine and otter trawl) was retrieved from OSPAR special request to ICES (ICES, 2018a). over a period of 2011 to 2019. The data were aggregated and mapped in Figures S2 and S3 in Supplementary Material. Three parameters can be distinguished: fishing hours, surface swept area ratio (SAR) (penetration depth of gear components < 2 cm), and sub-surface SAR (penetration depth of gear components ≥2 cm). The fisheries data were allocated to grid cells of 0.05 × 0.05 degrees. The BTS data were reallocated to a 0.05 × 0.05 degrees grid, allowing for both datasets to be merged.
Locations of other human activities that take place in the Belgian part of the North Sea such as dredge disposal, sand extraction and offshore wind farms are shown in Figure 2. Within the EMS, to assess the effect of each activity on the litter contamination, litter was collected in the area where the activity took place (impact), in the surrounding area (nearby) and at reference locations (reference). Dredged material is disposed of over five dredge disposal sites that are located in the Belgian part of the North Sea (LNP, Br&WOO, Br&WZE, Br&WS1 and Br&WS2).
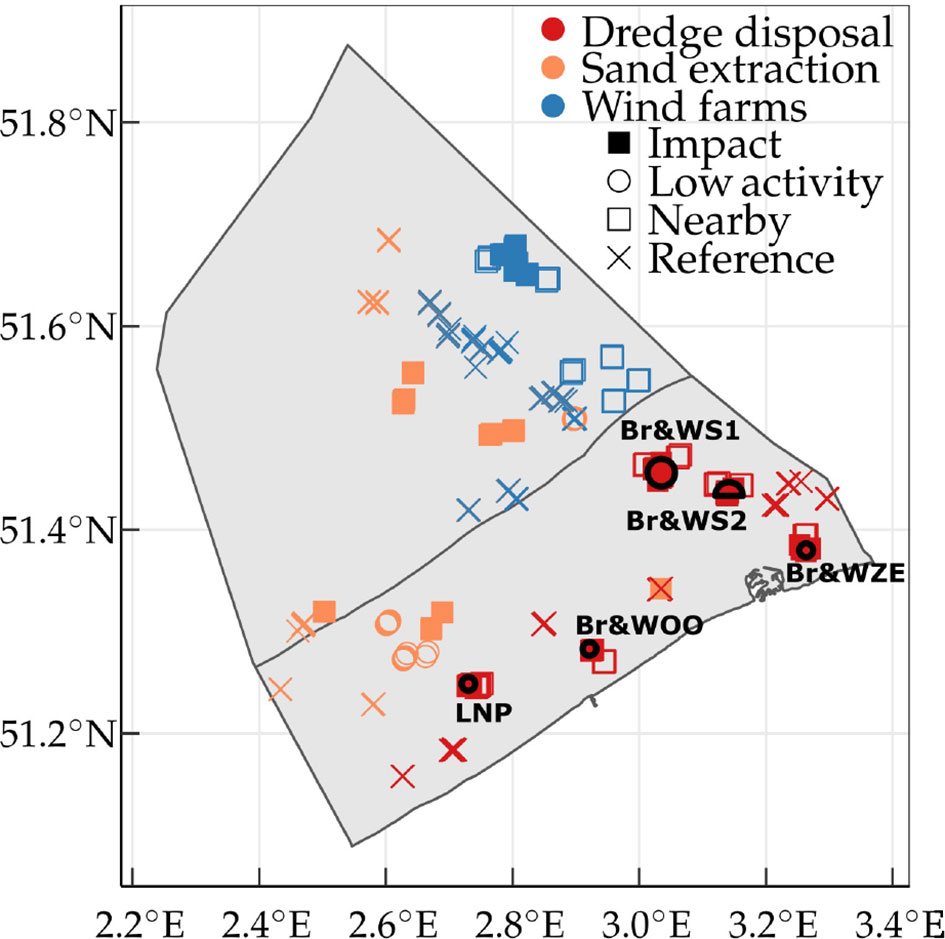
Figure 2 Spatial overview of the monitoring sites in the Belgian part of the North Sea according to specific human activities at sea sampled between 2013 and 2019 (differentiating between the location of the activity, close to the activity and reference site). The 12 nm line separating the coastal area and offshore area has also been drawn. Note: some reference sites were used as a reference for several activities and may therefore be included more than once.
The polymer type of plastic seafloor litter collected during the spring EMS of 2021 was identified as described by Velimirovic et al. (2022) using a Nicolet iSTM 10 FTIR Spectrometer (Thermo Fisher Scientific, United States). Before analysis, all samples were carefully cleaned with Milli-Q water and dried. The spectra were recorded in the region 4000 to 400 cm-1 with a resolution of 4 cm-1 averaging 32 scans for each measurement. The recorded FTIR spectra were processed using the OMNIC Specta software and compared to the reference spectra available in the FTIR Spectral Library (Thermo Fisher Scientific, United States) including (i) Polymers, (ii) the Hummel Polymer and Additives, (iii) Polymer Additives and Plasticisers, (iv) Polymers and Plasticisers. Before starting and after every 20 consecutive measurements a background spectrum was recorded to reduce the noise in the spectra and receive the most accurate match with the assigned reference spectra. Samples with a match less than 75% were reported as undefined.
The litter data of the EMS and BTS were not normally distributed (Shapiro-Wilk test; p< 0.05). Therefore, a generalized linear mixed-effect model using a Poisson distribution was fitted between the log-transformed number of litter items and the litter type, litter subtype, sediment type and distance towards the coast. The sample locations (stations) were included as a random effect. The Poisson distribution uses counts, and hence differences in haul lengths are not incorporated. However, histograms revealed that the majority (90%) of the haul lengths deviated less than 30% for the BTS and 20% for the EMS. A boxplot representing the haul lengths has been included in the Supplementary Materials (Figure S1). The model was constructed using the glmer function in R and group dependency was calculated using lsmeans. For the fishery intensity data (fishing hours, SARs, subSARs), for each sample location, the total sum of litter items was calculated and the number of observations was included as an offset variable. The model was constructed using the glm function in R. The statistical reports generated in R were included in the Supplementary Materials. The spatial distribution of the different litter types was analyzed using non-metric multidimensional scaling (NMDS) using the metaMDS function.
The number of litter items caught in nets within the BTS (2011-2019) is shown in the left panel of Figure 3. All BTS hauls were located outside the 12 nm zone. An average of 2.2 ± 0.05 items.ha-1 were caught with a median of 1.4 items.ha-1. This was in line with what was found in the EMS (2013-2019) for which 2.8 ± 0.2 items.ha-1 were found offshore (> 12 nm zone) and 12.7 ± 1.7 litter items.ha-1 in the coastal zone. The BTS covers a large area allowing to assess the effect of fisheries on litter contamination. However, the BTS does not cover coastal or nearshore areas where other human activities such as offshore wind farms and dredge disposal sites occur. The EMS could, therefore, further complement the assessment of marine litter in these areas. In the coastal zone, a four to five times significantly higher (glmer; p≈3.05e-12) litter abundance was observed which can possibly be explained by the proximity of land-based activities such as tourism, industry, etc. (Löhr et al., 2017).
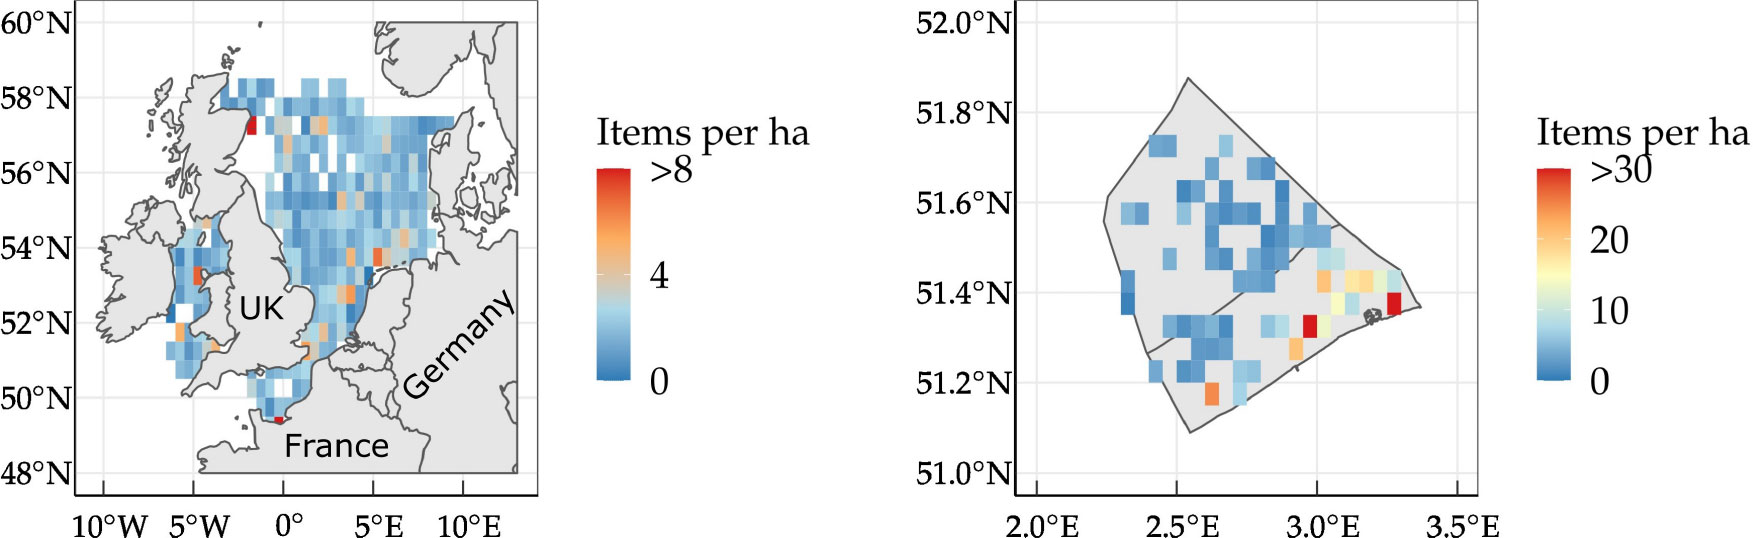
Figure 3 Left panel: average number of litter items per grid cell for the BTS, pooled over a period of 2011 to 2019 (n = 2695). Right panel: The mean number of litter items per grid cell for the Belgian part of the North Sea, pooled over a period of 2013 to 2019 (n = 461).
No clear spatial trend was observed for the OSPAR Greater North Sea and Celtic Seas, although a slightly higher number of litter was observed nearby the Dutch coast (see left panel of Figure 3). This is in contrast to the OSPAR intermediate assessment, where an increasing north-south gradient was observed in the OSPAR Greater North Sea and Celtic Seas which was linked to different inputs such as human activities, rivers, sea currents, and winds (OSPAR, 2017b; OSPAR, 2022). Within the EMS, a higher abundance of litter was observed in the eastern coastal zone of the Belgian part of the North Sea (see right panel of Figure 3). The deposition of litter mainly occurs in the area of the Belgian part of the North Sea where the velocity of water decreases and coincides with the sedimentation of muddy to muddy sand soil particles (Fettweis et al., 2009). This is reflected in the left panel of Figure 4, where a higher abundance of litter was associated with these mud to muddy sand areas. The litter abundance of coarse substrate and sand were not significantly different and resulted in a predicted litter abundance of respectively 4.70 items.ha-1 and 5.48 items.ha-1. For mud to muddy sand areas, a significantly higher (glme; p< 0.001) litter abundance of 10.94 items.ha-1 was observed.
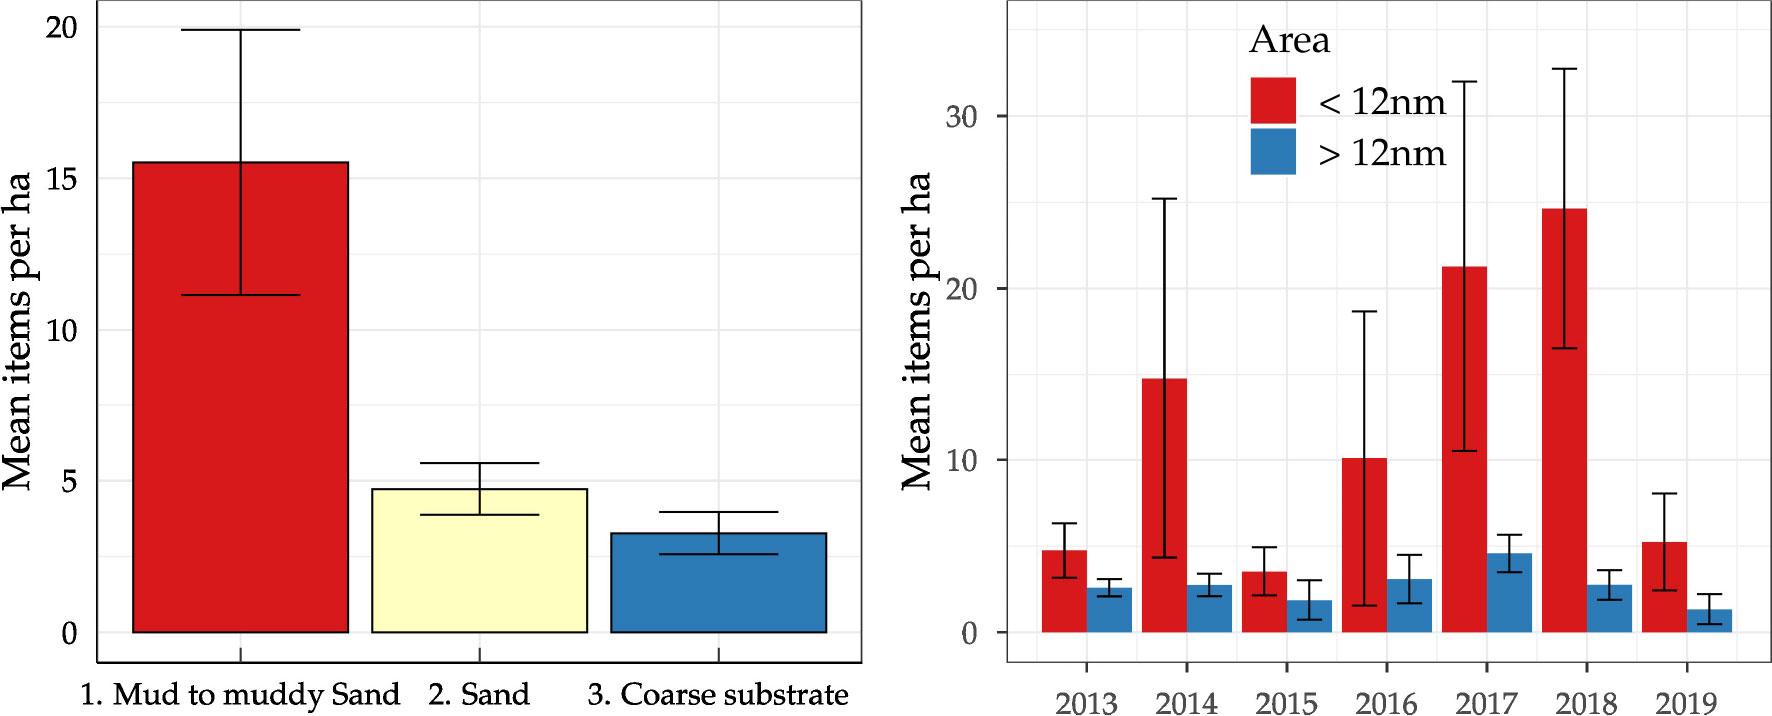
Figure 4 Left panel: The mean number of litter items.ha-1 according to sediment type per substrate material based on the Folk classification (EMS, 2013-2019). Error bars show the 95% confidence interval. Right panel: mean number of litter items.ha-1 within and beyond 12 nm of the Belgian coast, per year between 2013 and 2019 for the EMS. Error bars show the 95% confidence interval.
The variability in litter contamination for the EMS between consecutive years is illustrated in the right panel of Figure 4. In the coastal zone (<12 nm), the variability in litter collection was high. In 2013, 2015, and 2019, a maximum yearly average (spring and fall surveys) of 5.3 ± 1.3 litter items.ha-1 was observed within the 12 nm zone, whereas, in 2014, 2016, 2017, and 2018, the annual averages observed started from 10.1 ± 4.0 up to 24.6 ± 4.0 litter items.ha-1 in the same area. This can be caused by natural variability. Next, the collection of seafloor litter is often a secondary objective in fisheries surveys, and thus, the interpretation, attention and interest depend upon the observer, possibly resulting in high variability between different surveys and between consecutive years (Kammann et al., 2018; Maes et al., 2018; ICES, 2021b).
Within the BTS, 77% of the items were plastic, followed by miscellaneous (6.4%), rubber (6.0%) and natural products (5.5%). Within the plastic litter category, dominant items were plastic sheets (A2, 25%), monofilament (A5, 11%), synthetic rope (A7, 11%), entangled fishing lines (A6, 6%), and fishing nets (A8, 2%). These results were in line with the EMS in which 88% of the litter was plastic, with 87% of plastic in coastal areas and 92% of plastic in offshore areas (see Table 1). This was also coherent with the literature in which plastic was estimated to account for 80% of the global marine litter items (UNEP, 2016). Within the international bottom trawl surveys (IBTS), plastic percentages of 58%, 68% and 98% were recorded respectively for the Celtic Seas, Greater North Sea and Eastern Bay of Biscay (OSPAR, 2017b). Moreover, according to OSPAR (2022), the most commonly found plastic litter items in the OSPAR Greater North Sea were sheets, synthetic rope, bags, entangled and monofilaments and fishing nets.
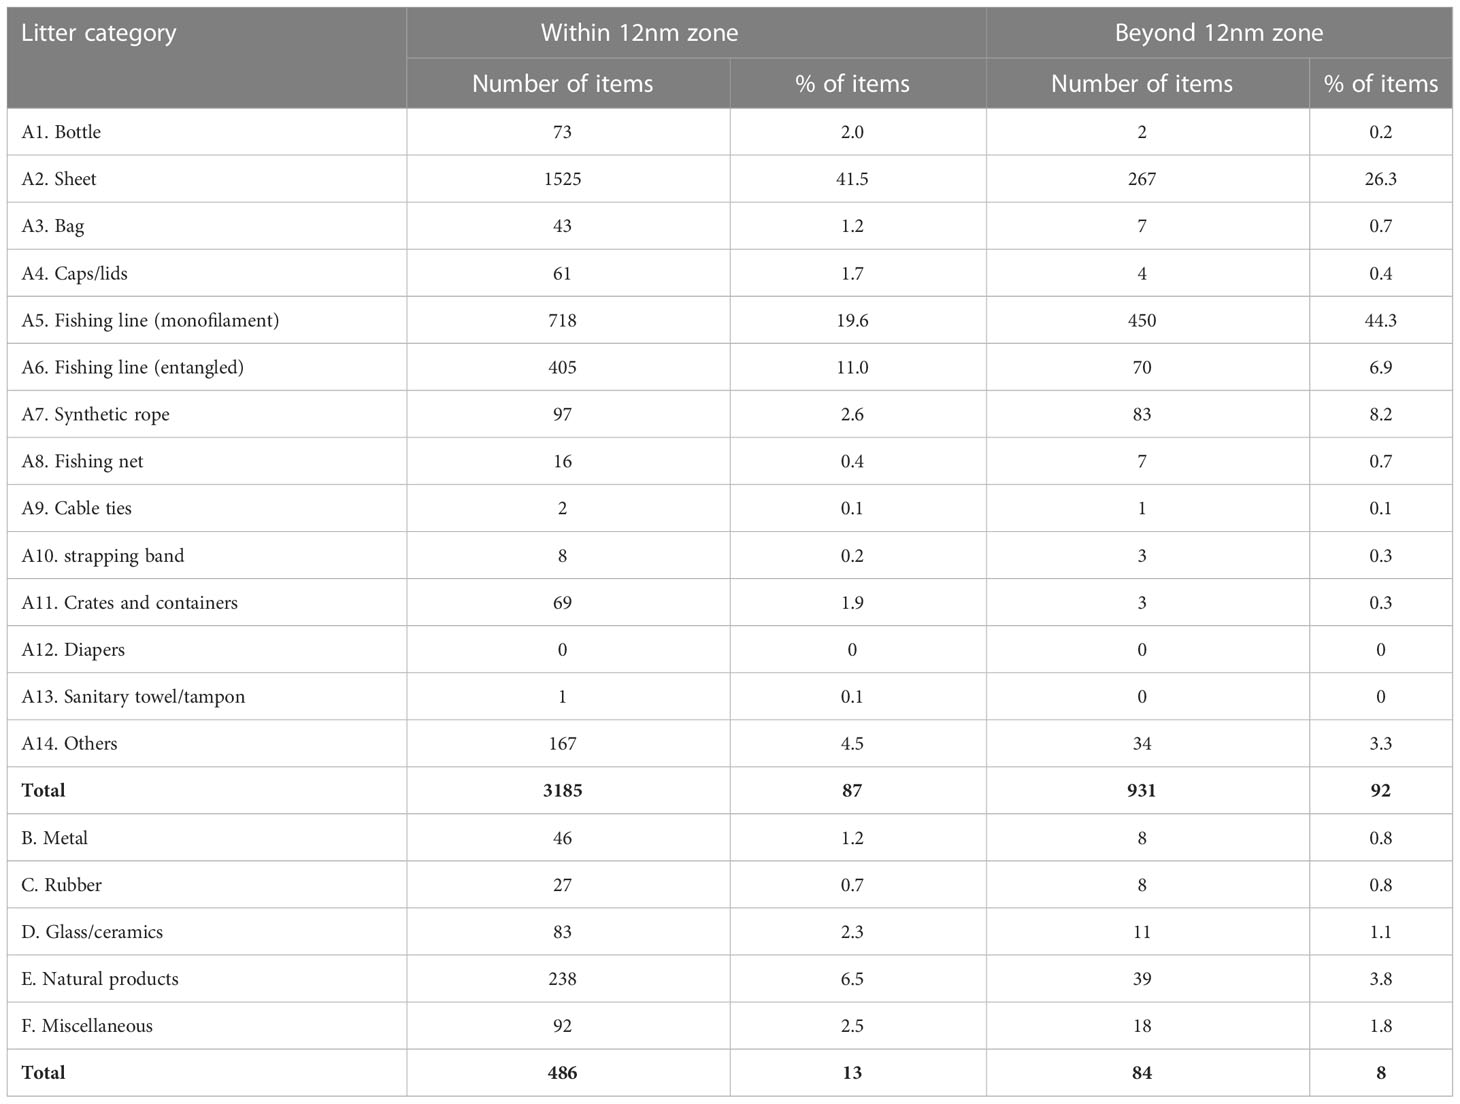
Table 1 Overview of litter items from the EMS within and beyond the 12 nm zone in the Belgian part of the North Sea. % is expressed as items of this category relative to the total number of litter items within this zone.
On the North-West side of the BTS area (near Scotland), a higher abundance of non-plastic items such as metals, rubber, glass/ceramic, natural products and miscellaneous products was recorded compared to the OSPAR greater North Sea. This is also illustrated in Figure 5, where sample locations situated between 56N – 58N and 1W – 2E were clustered separately. Based on an observational analysis, plastic-based litter was recorded in high abundance near the Dutch coast and consisted mainly of ropes and filaments (A5, A6, and A7), but did not cluster separately in an NMDS plot. Within the plastic category (A) of all BTS data, sheets (A2) and filament lines (A5 and A6) were most abundant which was in accordance with the observation made by Kammann et al. (2018).
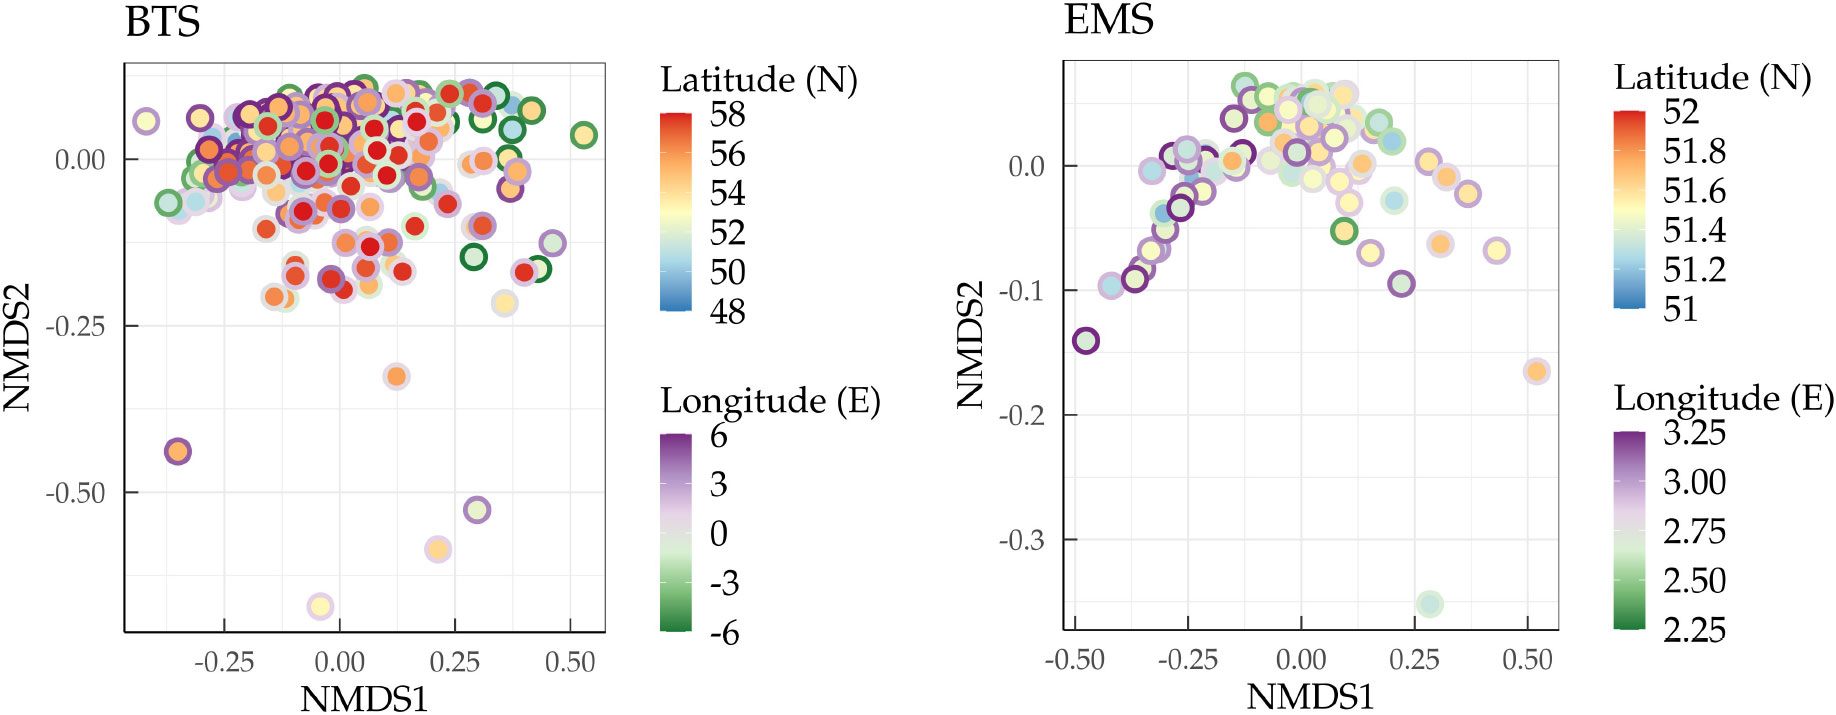
Figure 5 A nonmetric multi-dimensional scaling assessing the difference in composition between the different sample locations for the BTS and EMS. The fill colour represents the latitude and the stroke colour represents the longitude of each datapoint.
Within the EMS, relatively more sheets (A2), bottles (A1), crates and containers (A11) and caps and lids (A4) were found in coastal areas compared to offshore areas (>12nm). These items may be associated with a land-based origin. While in offshore areas, more monofilaments (A5) were encountered compared to other items. Monofilaments are often low-density polyethylene (Bekaert et al., 2015) and can thus be transported over longer distances before sinking to the seafloor. For non-plastic litter, natural products such as processed wood had the highest occurrence followed by the miscellaneous group and glass/ceramics. In contrast to plastic litter, no clear spatial pattern could be found in relative abundance for the different non-plastic categories.
In the plastic category (A), 8 to 10 independent subtype groups are detected in both BTS and EMS data (see Table 2). Only certain subtypes such as cable ties (A9) and bands (A10) resulted in a similar contamination pattern. Type B to F litter can be divided into two or three similar groups, with different subtypes resulting in similar contamination patterns. For example, for the BTS, the spread of beverage cans (B2) revealed a different pattern than contamination by other metal items, whereas for the EMS, beverage cans (B2) had a similar contamination pattern compared to other metal subcategories (B1 to B7).
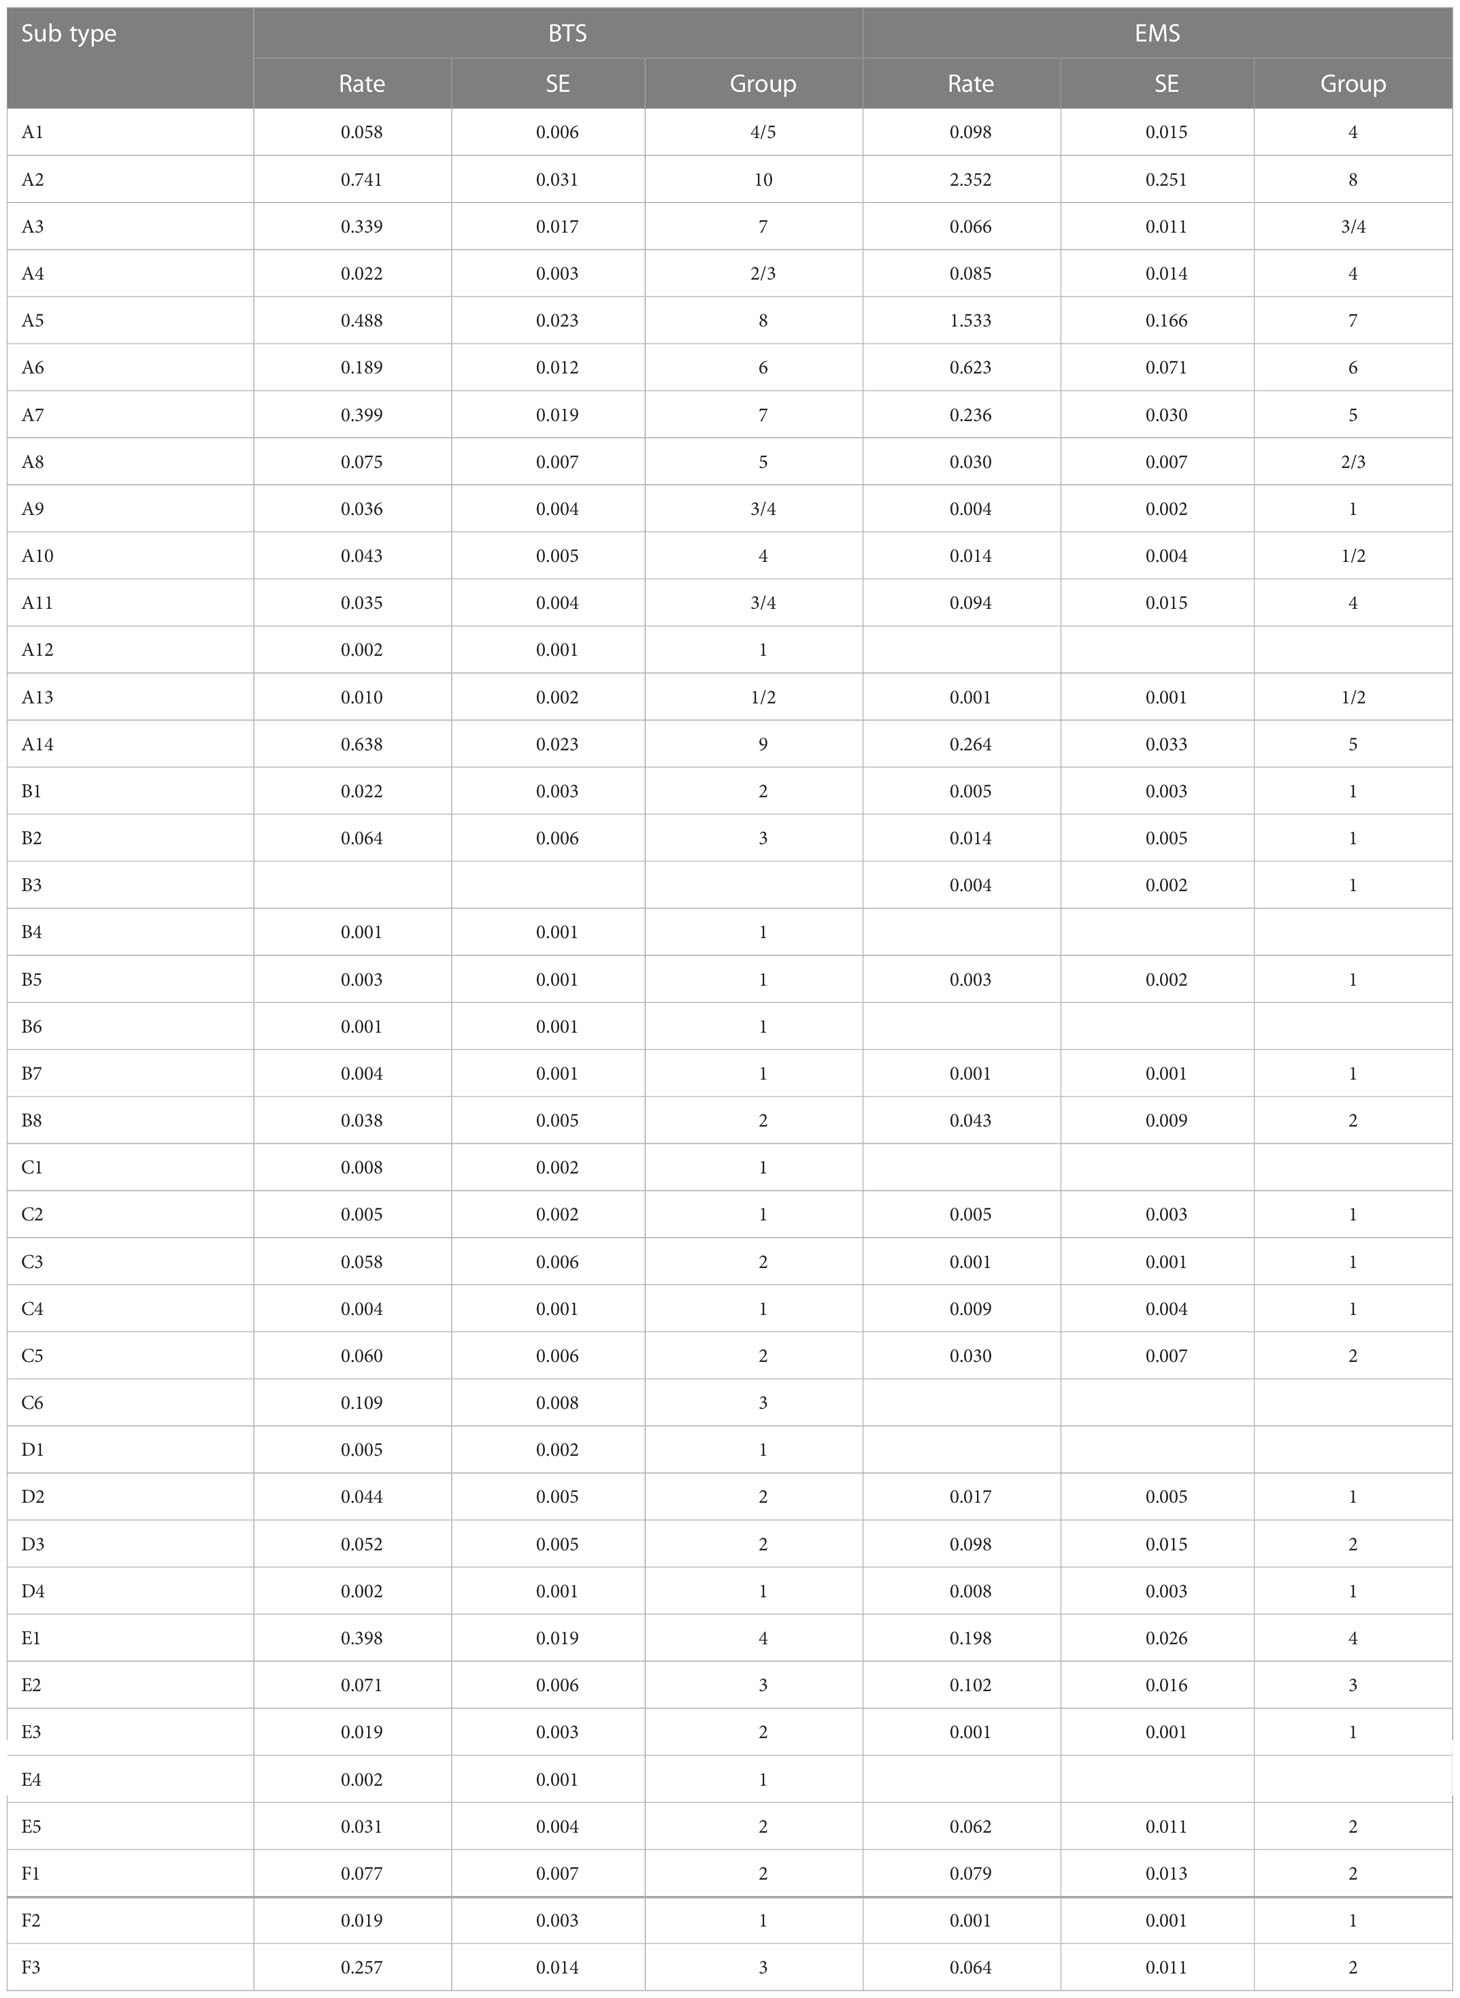
Table 2 Independence of subtype litter per type for the BTS and EMS.
Examination of the polymer composition of plastic litter in the EMS in the Belgian part of the North Sea showed that (high density) polyethylene (36%) and polypropylene (20%) were the most abundant. This was expected as these two polymers make up for more than 50% of the total plastic production (Birch et al., 2020). About 25% of the items resulted in an inconclusive FTIR result, mainly due to weathering processes. A complete overview of the results is presented in Table S3 in the Supplementary Material.
It has been demonstrated that fisheries are a source of marine litter (García-Alegre et al., 2020). Fishery-related litter consists of fishing lines (A5 and A6), fishing nets (A8), fishery-related metals (B3), and rubber bobbins (C3). According to Hermans (2021), a higher share of plastic filaments was observed in the North Sea compared to the Scheldt estuary and may be linked to the use of dolly rope during fishing activities. Although in our study a higher abundance of fishing gear was detected in coastal areas compared to offshore, its relative share was lower, being 31% in coastal areas compared to 52% in offshore areas.
In the area covered by the BTS (N = 962), no correlation at all was observed between the litter contamination and the number of fishing hours (glm; p ≈1), surface SAR (glm; p ≈1), and subsurface SAR (glm; p ≈1). Within the EMS, a significant correlation (N = 66) was detected between the litter contamination associated with fishing activities and the number of fishing hours (glm; p< 2e-16), subsurface SAR (glm; p< 2e-16) and surface SAR (glm; p< 0.005). The area with the highest fishing intensity was situated closest to the coast. This was also the area where most litter items were found. However, other effects such as sedimentation may also affect the litter contamination. Sedimentation areas can act as a reservoir in which litter that was transported in the water column sinks to the seafloor. This often coincides with mud to muddy areas in which silt particles are also deposited from the water column.
A low correlation between fishing activities and marine litter has also been reported by other authors (Buhl-Mortensen and Buhl-Mortensen, 2018; García-Alegre et al., 2020) and may be explained by different factors. First, the number of recorded litter is often low with high variability resulting in a lack of power and hampering the detection of correlations. Second, the spread of litter is not only related to its source, but also to hydrodynamic and geomorphological characteristics (Koutsodendris et al., 2008), resulting in the accumulation of litter even in remote areas. Third, fishing activities can delocalize litter during fishing operations, reducing the litter density (Lopez-Lopez et al., 2017). The latter was also observed by Erüz et al. (2022) who found that the litter abundance was lower in trawl zones compared to no-trawl zones. The litter caught in fishing nets is often thrown back overboard, resulting in a drift of the litter items according to the currents.
The effect of other human activities in the Belgian part of the North Sea is illustrated in Figure 6. No significant difference was observed between impact, reference and low activity areas for sand extraction (glme; p = [0.61−0.96]) and between impact, reference and nearby for offshore wind farms (glme; p = [0.35−0.95]). For sand extraction areas, an average of 2.4 ± 0.3 litter items.ha-1 was observed at impact locations compared to 2.7 ± 0.3 litter items.ha-1 at reference locations. Also the presence of offshore wind farms did not affect litter contamination, with respectively 2.6 ± 0.6 and 2.2 ± 0.2 items.ha-1 at impact and reference locations. These areas were mainly located offshore and were exempted from other activities such as shipping and fishing.
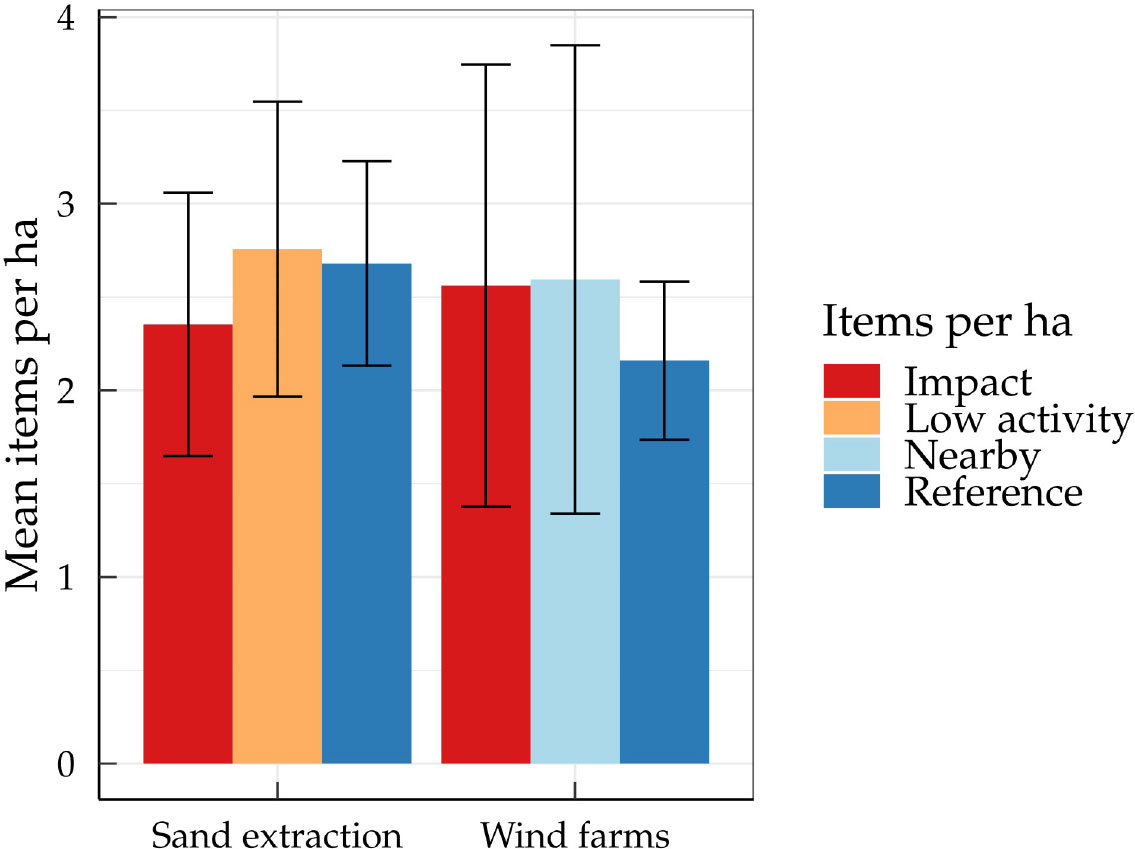
Figure 6 The average number of litter items.ha−1 at sand extraction and offshore wind farm areas and corresponding reference areas between 2013 and 2019 with 95% confidence interval.
The effect of dredge disposal can be observed at five dredge disposal sites located within the 12 nm zone (see Figure 2). A higher amount of litter was observed at dredge disposal sites (21.6 ± 5.2 items.ha-1) compared to reference locations (in the coastal area (<12 nm)) (11.5 ± 1.5 items.ha-1) (glme; p< 2e-16). There was a variation in litter contamination between dredge disposal sites. The highest contamination was observed at Br&WZE (61.4 ± 26.4 litter items.ha-1), whereas the lowest contamination was observed at LNP (6.4 ± 1.1 litter items.ha-1). This coincides with the dumping intensity at both sites, where a higher amount of dredge was disposed of at Br&WZE (1.84 ton dry matter (DM.m−2.year−1) compared to LNP (0.08 ton DM.m−2.year−1) in the period between 2007 and 2017 (Lauwaert et al., 2019). Nevertheless, each dredge disposal site has a different sediment composition and is exposed to different currents and sedimentation conditions, which can also influence the contamination by litter. To minimize these environmental effects, impact locations, as well as nearby and further away reference locations, were compared. Only at Br&WZE a substantially higher litter contamination was observed compared to nearby locations (15.0 ± 6.0 litter items.ha-1) and reference location (11.5 ± 2.9 litter items.ha-1). This indicates that a high degree of litter contamination can be caused by dredge disposal activities when dredge disposal intensities are high.
Marine litter was assessed on the seafloor in the OSPAR Greater North Sea and Celtic Seas, by collecting trawling data from two different surveys: the BTS (2011-2019) and the EMS (2013-2019). The BTS data allows for the assessment of litter on a large scale whereas the EMS offers a unique dataset with a high density of hauls in coastal and offshore areas in the Belgian part of the North Sea. Especially in the coastal area, a four to five times higher litter contamination was observed compared with offshore areas.
Litter mainly consisted of plastic (88%). Heavier litter items with land-based sources such as bottles or crates and containers were especially found in the coastal area of the Belgian part of the North Sea, whereas low-density filament fishing lines were more equally distributed over the Belgian part of the North Sea. In the area covered by the BTS, filament fishing lines had the highest densities in front of the Dutch coast. Different factors may impact distribution patterns, as not only the location of the source plays a role, but also hydrodynamic and geomorphological characteristics impact litter distribution. As a consequence, correlations between litter distribution and human activities are difficult to make. No increased number of litter items was observed at sand extraction and offshore wind farm areas. A hotspot marine litter location was identified at dredge disposal site Br&WZE, at the eastern coastal zone of the Belgian part of the North Sea. Although, in this area too, the effects of dredge disposal cannot be unambiguously differentiated from the effect of hydrodynamic processes such as sedimentation. A significant correlation was found between fishing activities and the amount of litter registered in the Belgian part of the North Sea, but not for the OSPAR Greater North Sea and Celtic Seas. Nevertheless, up to 52% of the collected litter in the offshore area of the Belgian part of the North Sea can be linked to fishing activities.
The BTS data is publicly available through the ICES DOME database. The raw EMS data supporting the conclusions of this article are publicly available. This data can be found here: https://github.com/dmvaverm/EnvironmentalMonitoringSurvey.git.
DV: investigation, formal analysis, writing original draft, writing - review and editing; KV: conceptualization, formal analysis, investigation, methodology, data curation, writing original draft, writing - review and editing; LD: investigation, methodology, data curation, writing - review and editing; KC: writing - review and editing; CS: writing - review and editing; ET: investigation, data curation, writing - review and editing; LV: investigation, methodology, data curation, writing - review and editing; MV: investigation, methodology, data curation, writing - review and editing; KT: conceptualization, investigation, methodology, data curation, writing - review and editing; KH: conceptualization, investigation, methodology, writing - review and editing; BW: conceptualization, investigation, methodology, data curation, writing original draft, writing - review and editing. All authors contributed to the article and approved the submitted version.
This research was funded by the European Maritime and Fisheries Fund (EMFF). MV acknowledges the Research Foundation - Flanders (FWO project number 12ZD120N).
We want to thank the scientists, sea-going observers, technicians and lab-technicians of the Marine Biology group and the Aquatic Environment and Quality group of ILVO for sampling and litter registration. Hauls of the EMS were taken on-board the research vessel Belgica (operated by the Belgian Navy under charter of RBINS).
The authors declare that the research was conducted in the absence of any commercial or financial relationships that could be construed as a potential conflict of interest.
All claims expressed in this article are solely those of the authors and do not necessarily represent those of their affiliated organizations, or those of the publisher, the editors and the reviewers. Any product that may be evaluated in this article, or claim that may be made by its manufacturer, is not guaranteed or endorsed by the publisher.
The Supplementary Material for this article can be found online at: https://www.frontiersin.org/articles/10.3389/fmars.2023.1124580/full#supplementary-material
Abramic A., Mendoza A. G., Haroun R. (2021). Introducing offshore wind energy in the sea space: Canary islands case study developed under maritime spatial planning principles. Renew. Sust. Energ. Rev. 145, 111119. doi: 10.1016/j.rser.2021.111119
Bekaert K., Devriese L., Vandendriessche S., Vanderperren E. (2015). Spekvis–op zoek naar duurzame alternatieven voor spekking. ILVO mededeling 192, 54.
Bergmann M., Klages M. (2012). Increase of litter at the arctic deep-sea observatory hausgarten. Mar. Pollut. Bull. 64, 2734–2741. doi: 10.1016/j.marpolbul.2012.09.018
Bergmann M., Tekman M., Gutow L. (2017). “Litterbase: an online portal for marine litter and microplastics and their implications for marine life,” in MICRO 2016 (Amsterdam: Elsevier), 106–107.
Birch Q. T., Potter P. M., Pinto P. X., Dionysiou D. D., Al-Abed S. R. (2020). Sources, transport, measurement and impact of nano and microplastics in urban watersheds. Rev. Environ. Sci. Bio 19, 275–336. doi: 10.1007/s11157-020-09529-x
Browne M. A., Crump P., Niven S. J., Teuten E., Tonkin A., Galloway T., et al. (2011). Accumulation of microplastic on shorelines worldwide: Sources and sinks. Environ. Sci. Technol. 45, 9175–9179. doi: 10.1021/es201811s
Buhl-Mortensen L., Buhl-Mortensen P. (2017). Marine litter in the nordic seas: Distribution composition and abundance. Mar. pollut. Bull. 125, 260–270. doi: 10.1016/j.marpolbul.2017.08.048
Buhl-Mortensen P., Buhl-Mortensen L. (2018). Impacts of bottom trawling and litter on the seabed in norwegian waters. Front. Mar. Sci. 5, 42. doi: 10.3389/fmars.2018.00042
Cózar A., Sanz-Martín M., Martí E., González-Gordillo J. I., Ubeda B., Gálvez J.Á., et al. (2015). Plastic accumulation in the mediterranean sea. PLoS One 10, 1–12. doi: 10.1371/journal.pone.0121762
Dataset ICES. (2021a) Data portal used by the international council for the exploration of the sea datras. Available at: https://datras.ices.dk/Data_products/Download/Download_Data_public.aspx (Accessed 22nd of January 2021).
Erüz C., Terzi Y., Öztürk R.Ç., Karakoç F. T., Özşeker K., Şahin A., et al. (2022). Spatial pattern and characteristics of the benthic marine litter in the southern black sea shelf. Mar. pollut. Bull. 175, 113322. doi: 10.1016/j.marpolbul.2022.113322
European Commission (2021). “Communication from the commission to the european parliament, the council, the european economic and social committee and the committee of the regions,” in Pathway to a healthy planet for all EU action plan: Towards zero pollution for air, water and soil (Brussels: European Union).
Fakiris E., Papatheodorou G., Kordella S., Christodoulou D., Galgani F., Geraga M. (2022). Insights into seafloor litter spatiotemporal dynamics in urbanized shallow mediterranean bays. an optimized monitoring protocol using towed underwater cameras. J. Environ. Manage. 308, 114647. doi: 10.1016/j.jenvman.2022.114647
Fettweis M., Houziaux J.-S., Du Four I., Van Lancker V., Baeteman C., Mathys M., et al. (2009). Long-term influence of maritime access works on the distribution of cohesive sediments: Analysis of historical and recent data from the belgian nearshore area (southern north sea). GEO-MAR Lett. 29, 321–330. doi: 10.1007/s00367-009-0161-7
Foekema E. M., De Gruijter C., Mergia M. T., van Franeker J. A., Murk A. J., Koelmans A. A. (2013). Plastic in north sea fish. Environ. Sci. Technol. 47, 8818–8824. doi: 10.1021/es400931b
Ford H. V., Jones N. H., Davies A. J., Godley B. J., Jambeck J. R., Napper I. E., et al. (2022). The fundamental links between climate change and marine plastic pollution. Sci. Total Environ. 806, 1–11. doi: 10.1016/j.scitotenv.2021.150392
Galgani F., Brien A.S.-o., Weis J., Ioakeimidis C., Schuyler Q., Makarenko I., et al. (2021). Are litter, plastic and microplastic quantities increasing in the ocean? Microplastics Nanoplastics 1, 1–4. doi: 10.1186/s43591-020-00002-8
García-Alegre A., Román-Marcote E., Gago J., González-Nuevo G., Sacau M., Muñoz P. D. (2020). Seabed litter distribution in the high seas of the flemish pass area (nw atlantic). Sci. Mar. 84, 93–101.
Gerigny O., Brun M., Fabri M.-C., Tomasino C., Le Moigne M., Jadaud A., et al. (2019). Seafloor litter from the continental shelf and canyons in french mediterranean water: Distribution, typologies and trends. Mar. pollut. Bull. 146, 653–666. doi: 10.1016/j.marpolbul.2019.07.030
Gutow L., Ricker M., Holstein J. M., Dannheim J., Stanev E. V., Wolff J.-O. (2018). Distribution and trajectories of floating and benthic marine macrolitter in the south-eastern north sea. Mar. Pollut. Bull. 131, 763–772. doi: 10.1016/j.marpolbul.2018.05.003
Hermans T. (2021). “The elemental composition of different plastic items potentially present in the marine environment,” in Master’s thesis (Leuven: UC Leuven).
ICES (2018a). “Manual for the international bottom trawl surveys,” in Series of ices survey protocols (Copenhagen, Denmark: ICES: International Council for the Exploration of the Sea), vol. sisp 1-ibts viii. , 66 pp.
ICES (2018b) Spatial data layers of fishing intensity/ pressure per gear type for surface and subsurface abrasion, for the years 2009 to 2017 in the ospar regions ii and iii (ver. 2, 22 january 2019): Ices data product release. Available at: doi: 10.17895/ices.data.4686.
ICES (2021b). Working group on marine litter (wgml; outputs from 2020 meeting). ICES Sci. Rep. 3, 1–97. doi: 10.17895/ices.pub.8185
ICES (2022). ICES manual for seafloor litter data collection and reporting from demersal trawl samples. ICES Techniques Mar. Environ. Sci. (TIMES) 67, 1–16. doi: 10.17895/ices.pub.21435771.v1
JRC (2013). “Guidance on monitoring of marine litter in european seas. jrc scientific and policy reports,” in Msfd technical subgroup on marine litter (Brussels: European Union), 128p.
Kammann U., Aust M.-O., Bahl H., Lang T. (2018). Marine litter at the seafloor–abundance and composition in the north sea and the baltic sea. Mar. pollut. Bull. 774–780, 127. doi: 10.1016/j.marpolbul.2017.09.051
Koutsodendris A., Papatheodorou G., Kougiourouki O., Georgiadis M. (2008). Benthic marine litter in four gulfs in greece, eastern mediterranean; abundance, composition and source identification. Estuar. Coast. Shelf Sci. 77, 501–512. doi: 10.1016/j.ecss.2007.10.011
Laufkoetter C., Lang K., Benedetti F., Onink V., Vogt M. (2020). Marine plastic waste input between 1990-2015 and potential beaching scenarios. In EGU Gen. Assembly Conf. Abstracts., 1. doi: 10.5194/egusphere-egu2020-18476
Lauwaert B., Fettweis M., De Witte B., Van Hoey G., Timmermans S., Hermans L. (2019). Vooruitgangsrapport (juni 2019) over de effecten op het mariene milieu van baggerspeciesstortingen (vergunningsperiode 01/01/2017-31/12/2021).
Law K. L. (2017). Plastics in the marine environment. Ann. Rev. Mar. Sci. 9, 205–229. doi: 10.1146/annurev-marine-010816-060409
Löhr A., Savelli H., Beunen R., Kalz M., Ragas A., Van Belleghem F. (2017). Solutions for global marine litter pollution. Curr. Opin. Environ. sustainability 28, 90–99. doi: 10.1016/j.cosust.2017.08.009
Lopez-Lopez L., González-Irusta J., Punzón A., Serrano A. (2017). Benthic litter distribution on circalittoral and deep sea bottoms of the southern bay of biscay: Analysis of potential drivers. Cont. Shelf Res. 144, 112–119. doi: 10.1016/j.csr.2017.07.003
Maes T., Barry J., Leslie H., Vethaak A., Nicolaus E., Law R., et al. (2018). Below the surface: Twenty-five years of seafloor litter monitoring in coastal seas of north west europe, (1992–2017). Sci. Total Environ. 630, 790–798. doi: 10.1016/j.scitotenv.2018.02.245
Moriarty M., Pedreschi D., Stokes D., Dransfeld L., Reid D. (2016). Spatial and temporal analysis of litter in the celtic sea from groundfish survey data: Lessons for monitoring. Mar. pollut. Bull. 103, 195–205. doi: 10.1016/j.marpolbul.2015.12.019
OSPAR (2014). Intersessional correspondence group on marine litter (icg-ml), ospar, convention for the protection of the marine environment of the north-east atlantic (London: OSPAR commission), 11–12 november 2014. 12 icg ml, vigo (14/4/7-e(l)).
OSPAR (2017a). “Cemp guidelines on litter on the seafloor. ospar agreement 2017-006,” in Ospar commission (London: OSPAR commission), 11p.
OSPAR (2017b). “Composition and spatial distribution of litter on the seafloor. ospar intermediate assessment 2017,” in Ospar commission (London: OSPAR commission). Available at: www.ospar.org/assessments.
Ramirez-Llodra E., De Mol B., Company J., Coll M., Sardà F. (2013). Effects of natural and anthropogenic processes in the distribution of marine litter in the deep mediterranean sea. Prog. Oceanogr. 118, 273–287. doi: 10.1016/j.pocean.2013.07.027
Sheppard C. (2018). World seas: An environmental evaluation: Volume III: Ecological issues and environmental impacts (University of Warwick UK: Academic Press).
UNEP (2016). “Marine plastic debris and microplastics - global lessons and research to inspire action and guide policy change,” in United nations environment programme (Nairobi: United Nations Environment Programme (UNEP)), 252 pp.
United Nations Environment Programme (2021). From pollution to solution: A global assessment of marine litter and plastic pollution (Nairobi: United Nations Environment Programme (UNEP)).
Van Lancker V., Du Four I., Fettweis M., Van den Eynde D., Devolder M., Francken F., et al. (2008). “Quantification of erosion/sedimentation patterns to trace the natural versus anthropogenic sediment dynamics (quest4d),” in Annual scientific report year 1. science for sustainable development (Brussels: Federal Science Policy).
Velimirovic M., Teunkens B., Ghorbanfekr H., Buelens B., Hermans T., Van Damme S., et al. (2022). What can we learn from studying plastic debris in the sea scheldt estuary? Sci. Total Environ. 851, 158226. doi: 10.1016/j.scitotenv.2022.158226
Keywords: bottom trawl survey, dredge disposal, fishing activities, litter contamination, North Sea, offshore wind farms (OWFs), sand extraction, seafloor litter
Citation: Vanavermaete D, Verlé K, Devriese LI, De Cauwer K, De Schrijver C, Torreele E, Vandecasteele L, Velimirovic M, Tirez K, Hostens K and De Witte B (2023) Distribution and sources of macrolitter on the seafloor in Belgian fisheries areas. Front. Mar. Sci. 10:1124580. doi: 10.3389/fmars.2023.1124580
Received: 15 December 2022; Accepted: 31 January 2023;
Published: 23 February 2023.
Edited by:
Farhan R. Khan, Norwegian Research Institute (NORCE), NorwayReviewed by:
Xia Zhu, University of Toronto Scarborough, CanadaCopyright © 2023 Vanavermaete, Verlé, Devriese, De Cauwer, De Schrijver, Torreele, Vandecasteele, Velimirovic, Tirez, Hostens and De Witte. This is an open-access article distributed under the terms of the Creative Commons Attribution License (CC BY). The use, distribution or reproduction in other forums is permitted, provided the original author(s) and the copyright owner(s) are credited and that the original publication in this journal is cited, in accordance with accepted academic practice. No use, distribution or reproduction is permitted which does not comply with these terms.
*Correspondence: David Vanavermaete, ZGF2aWQudmFuYXZlcm1hZXRlQGlsdm8udmxhYW5kZXJlbi5iZQ==
Disclaimer: All claims expressed in this article are solely those of the authors and do not necessarily represent those of their affiliated organizations, or those of the publisher, the editors and the reviewers. Any product that may be evaluated in this article or claim that may be made by its manufacturer is not guaranteed or endorsed by the publisher.
Research integrity at Frontiers
Learn more about the work of our research integrity team to safeguard the quality of each article we publish.