 Hung-Jie Tang
 Ray-Yeng Yang
 Hao-Cheng Yao2
- 1Tainan Hydraulics Laboratory, National Cheng Kung University, Tainan, Taiwan
- 2Department of Hydraulic and Ocean Engineering, National Cheng Kung University, Tainan, Taiwan
The failure of mooring lines in net cages could lead to the death or escape of farmed fish, which causes huge economic losses and immeasurable ecological impacts. Therefore, it is very important to ensure the safety of the cage mooring system in practical applications. This study experimentally and numerically investigates the hydrodynamic behaviors of the mooring line failure on a net cage in irregular waves and currents. For the model test, a 1:25 scaled net cage model with eight-point mooring is installed in a wave tank. The two load cells in its upstream mooring lines and a gyroscope on its floating collar are used to measure the mooring force and the rotational motions, respectively. A cutting device equipped with a pneumatic cylinder and a blade is used to cut the line. A self-developed numerical model is specifically established for the model test for cross-validation. Both experimental and numerical results are analyzed and compared in the time and frequency domains. The results show that the mooring load in the remaining line significantly increases as one of the upstream mooring lines is disconnected. Meanwhile, a significant yaw rotation of the floating collar is observed. The results indicate that the maximum tension, drift displacement, and rotational angles significantly increase as the current velocity increases.
1 Introduction
Marine cage culture is becoming an important part of the fishing industry in many countries near oceans (FAO, 2022). In Taiwan, although the cage culture industry has developed well over the past two decades, mooring line failure still happens (Tang et al., 2020). When a mooring line fails, the floating collars collide with each other, and the fish net becomes entangled. Massive amounts of farmed fish may die in the net or escape from the cage. This kind of event can result in considerable economic losses and immeasurable ecological impacts. Moreover, a strong tidal current occurs in the Taiwan Strait every day, and more than three typhoons on average hit Taiwan every year. In addition, the development of the cage culture toward the far deep ocean is inevitable due to conflict with other ocean activities. Therefore, it is essential to study mooring line failures on net cages in irregular waves and currents for future development.
In recent decades, the hydrodynamic characteristics of marine net cage systems had been extensively investigated via laboratory experiments, numerical simulations, and field measurements. Tsukrov et al. (2003) employed a finite element model with consistent net elements to simulate the hydrodynamic responses of net panels and evaluated the performance of a tension-leg net cage. Fredriksson et al. (2003) used a stochastic approach to analyze the motion of a central-spar net cage and the tension generated in the anchor lines by the waves. The results provided valuable insights into the net cage dynamics in open waters. DeCew et al. (2005) investigated the dynamics of a modified gravity cage subjected to regular and random waves in a wave tank. Huang et al, 2006; Huang et al, 2007) conducted a series of experiments to investigate the mooring forces on a net cage subjected to waves and currents. Zhao et al. (2007) applied a lumped mass numerical model to simulate the motion of a gravity cage subjected to the simultaneous actions of waves and currents. Their results were consistent with the experimental data. Dong et al. (2010) developed a numerical model to simulate the mooring line tension and the body motion of a net cage subjected to irregular waves and validated it against their experimental results. Huang et al. (2010) developed a numerical model for a single-point mooring net cage in irregular waves and currents and validated it against field measurements. Kristiansen and Faltinsen (2015) used a numerical and experimental model to investigate the mooring loads of an aquaculture net cage with a floater in waves and currents. Moe-Føre et al. (2016) studied the structural responses of high-solidity net cage models in uniform flow. For good reviews on the research development of net cages, the readers can refer to Guo et al. (2020) and Xu and Qin (2020).
Recently, studies on the mooring line failure of net cages have attracted much attention. Yang et al. (2020) developed a time domain numerical model to investigate the effects of the mooring line failure on a net cage under various waves and currents. Tang et al. (2020) explored the mooring line failure-induced dynamic responses of net cages in irregular waves and currents and found significant changes in the tension spectra in both the wave- and lower-frequency regions. Subsequently, they conducted a laboratory experiment to verify their numerical model for a net cage suffering from the mooring line failure in currents (Tang et al., 2021). Cheng et al. (2021) studied the effect of mooring line breakage on the dynamic responses of grid-moored fish farms subjected to currents. They showed that the breakage at one mooring line is unlikely to immediately cause a progressive collapse of the fish farm at a current velocity of less than 0.5 m/s; however, it may cause a structural collapse, and fish may escape when the current and waves increase. Hou et al. (2022) investigated the reliability of the mooring system of net cages with one damaged mooring line and indicated that the failure of one mooring line significantly affects the failure probability for the remaining mooring lines. Tang et al. (2022a) assessed the two potential disasters of mooring line failure and anchor sinking regarding the seabed sand waves in an offshore wind farm area in Taiwan. Tang et al. (2022b) investigated the dynamic responses of the successive failure of two mooring lines on a net cage through numerical simulations and model tests. Results showed that the mooring tension, cage movement, and remaining cage volume responses were higher after the second failure than after the first.
In this study, a model test is performed, and a numerical model is used to investigate the dynamic responses of the mooring line failure on a net cage subjected to irregular waves and currents. First, the influence of the mooring line failure on the remaining line tensions and the floating collar rotations is estimated by comparing it to the intact mooring state. The influence of the current velocity on the mooring line failure is then obtained by increasing the inflow velocity with the same incident irregular waves. All results are analyzed in both the time and frequency domains. The power spectral density and linear transfer functions of tensions and motions are also analyzed. The remainder of this paper is structured as follows: Section 2 describes the model test; Section 3 introduces the numerical model; Section 4 compares the mooring tension and the rotational motion under the intact and failed states of mooring; Section 5 investigates the influence of increasing the current velocity on the mooring line failure of a net cage in irregular waves and currents, and Section 6 draws the conclusions and recommendations for future work.
2 Experimental method
2.1 Experimental setup
Figures 1, 2 present the net cage model adopted in this study. Table 1 lists its specifications. The wave tank size is 50 m in length, 7 m in width, and 1.2 m in depth. The position of the model is about 30 m to the wave maker, 20 m to the end wall, and 3.5 m to the side wall. The wave and current directions were set similarly to the x-axis direction; thus, the mooring system was symmetrical to the environmental force. The full-scale net cage had a 30 m-diameter inner floating collar and a 12.5 m-deep net installed in water with a 20 m constant water depth. Froude scaling with a geometric similarity was adopted in the model test. The model scale was 1:25. Table 1 also presents the corresponding full-scale values. However, duplicating the geometric similarity, especially netting, was almost impossible. Thus, the corresponding full-scale values listed in Table 1 were provided only for reference (Huang et al., 2006; Kristiansen and Faltinsen, 2015).
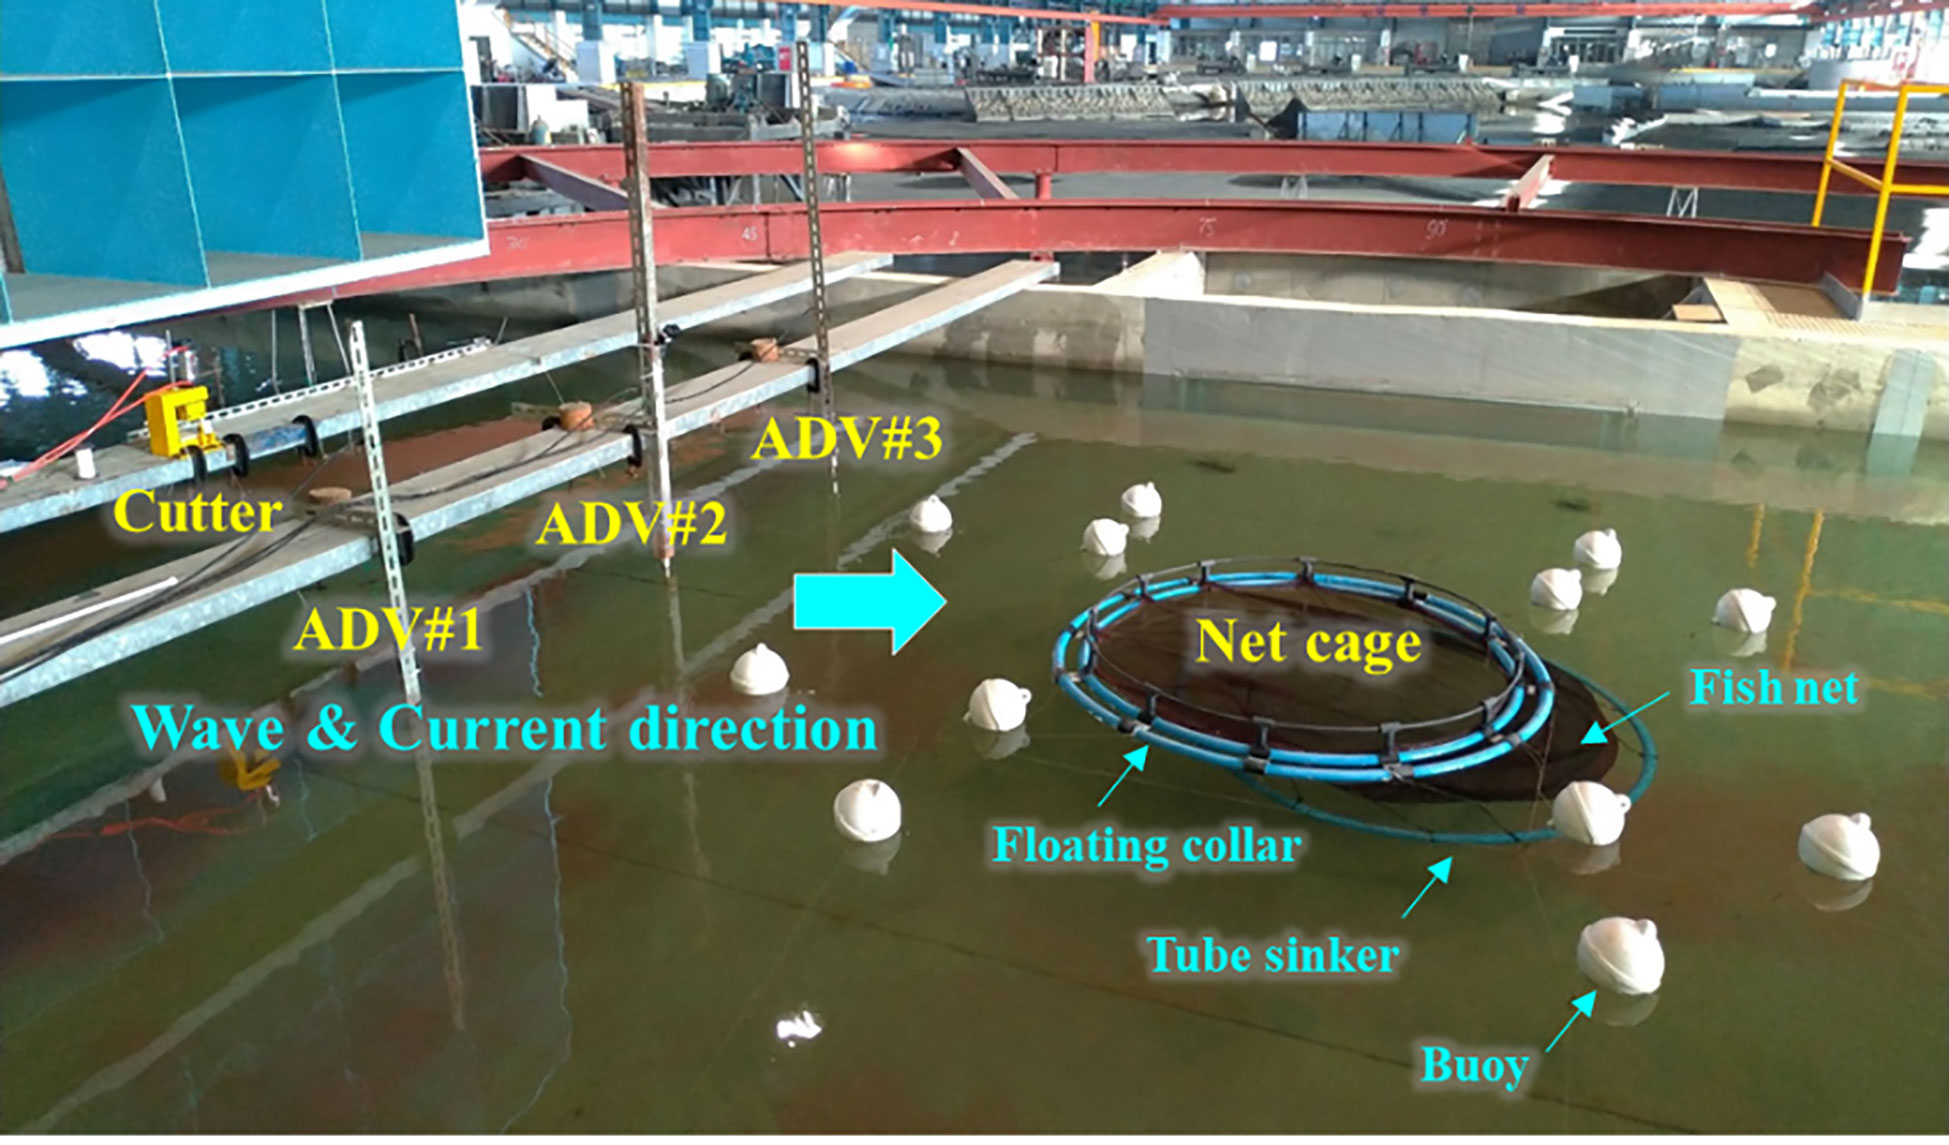
Figure 1 Photo of the net cage model installed in a wave tank.
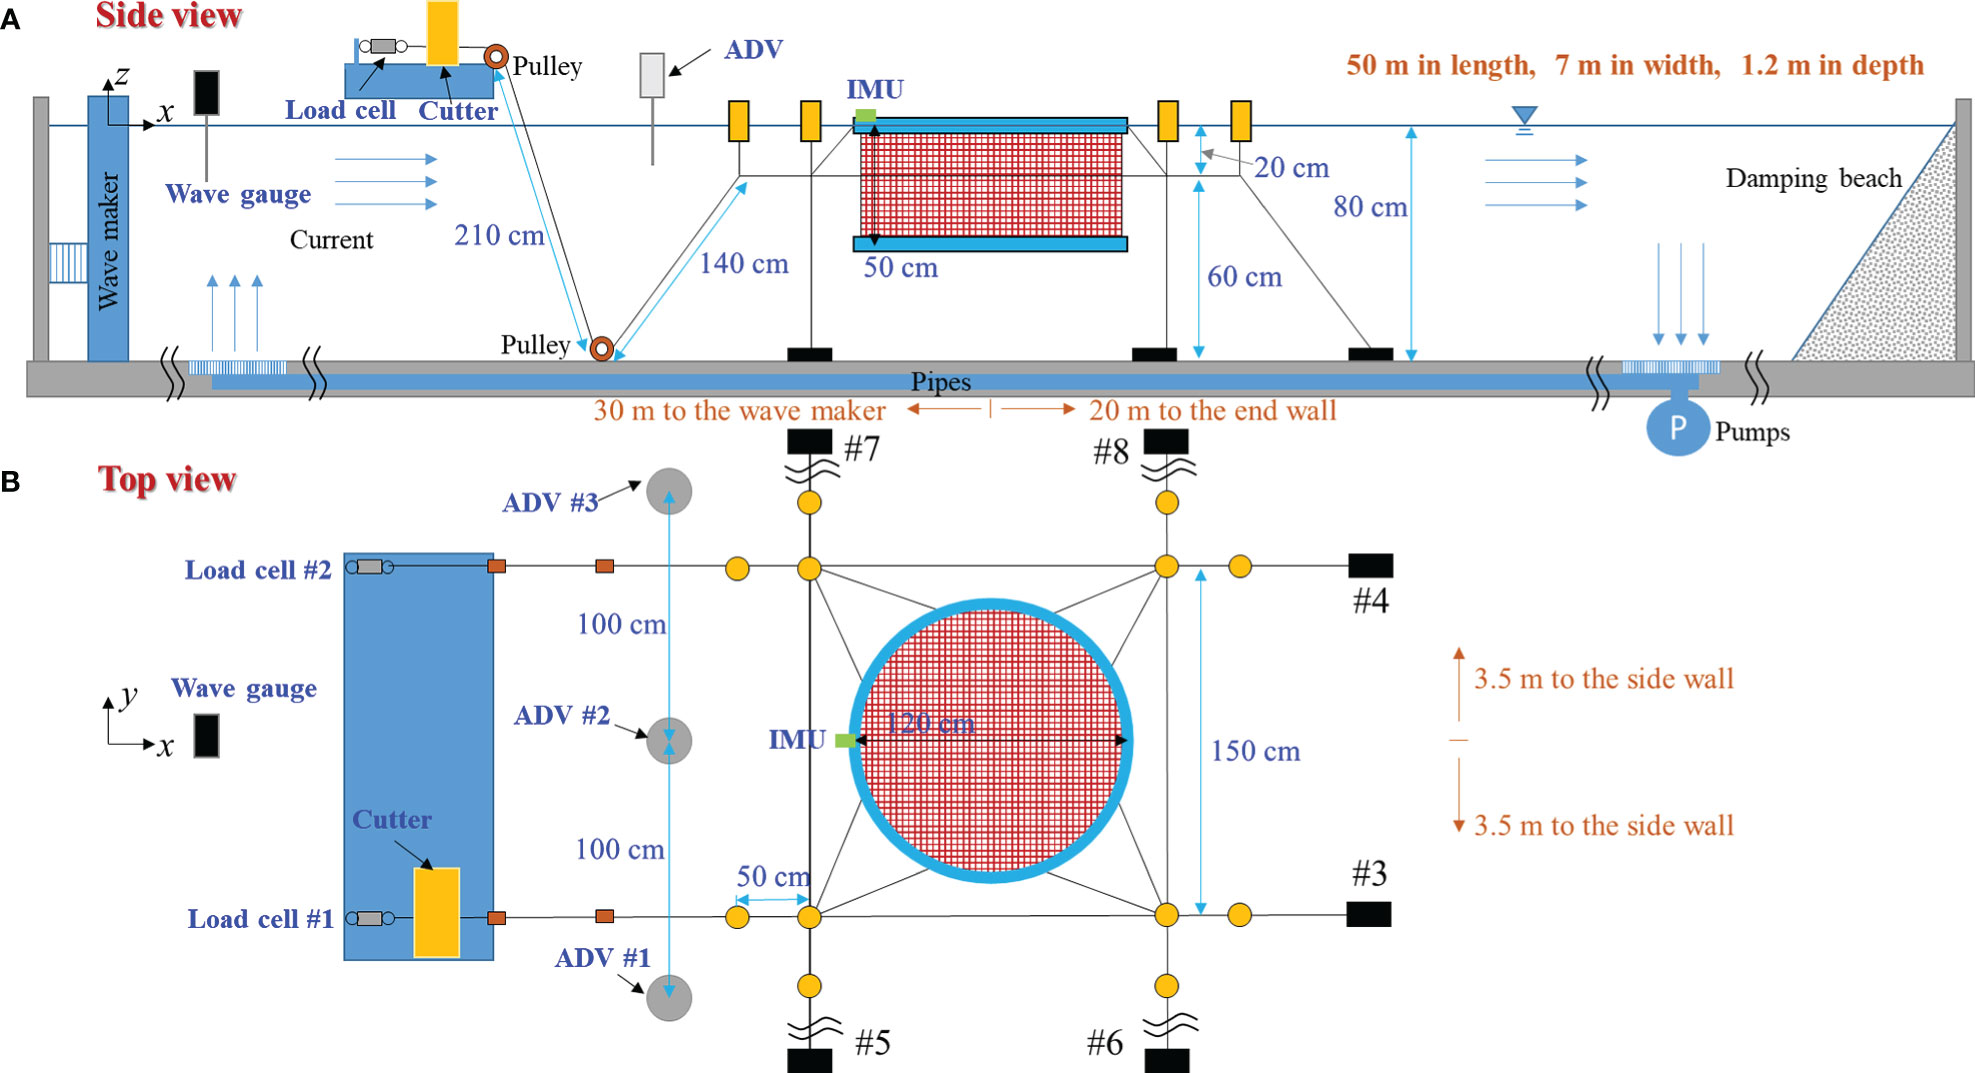
Figure 2 Schematic diagram of the model test.
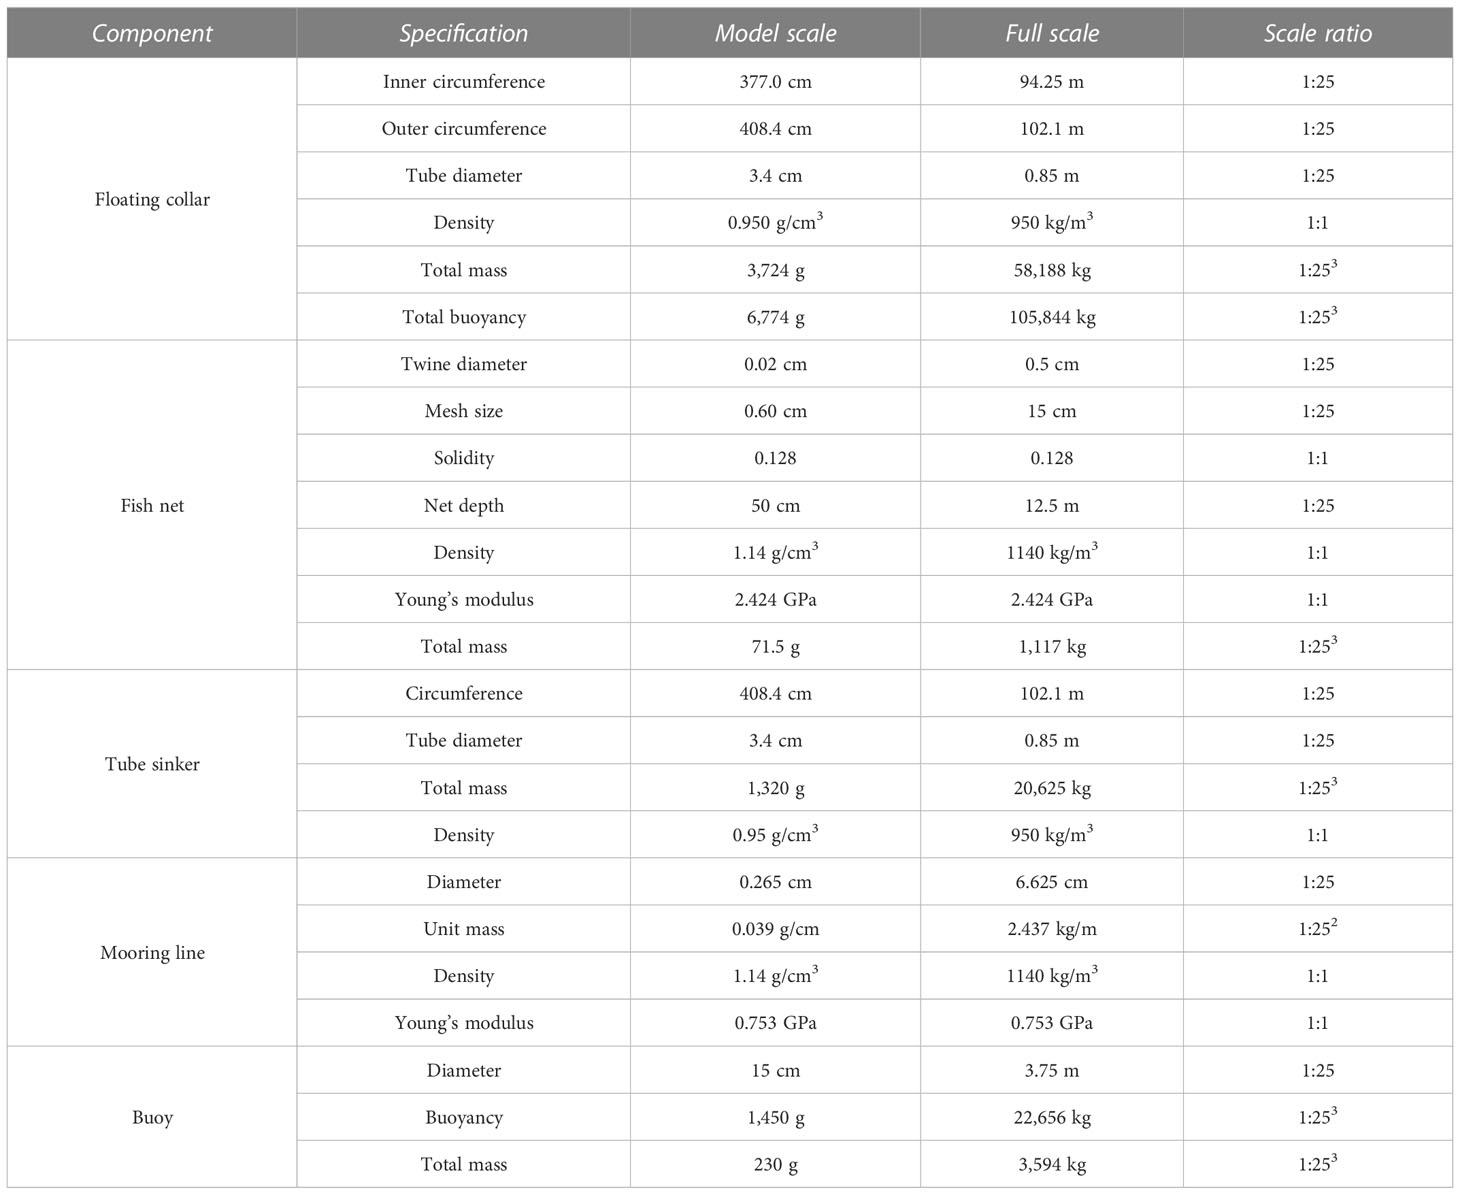
Table 1 Specifications of the net cage model.
The net cage model consisted of a floating collar, a net chamber, a tube sinker, a buoy, and a mooring line attached to the wave tank bottom. Two upstream mooring lines were deployed through two pulleys connected to two load cells fixed to a plate laid on the tank wall. Both load cells were an LT6-5 type (SSK Company, Japan) with 0.2% FS reproducibility, 0.2% FS linearity, 0.05% RO/°C temperature characteristic, ±10 V output voltage, 500 Ω input and output resistance, and between −15 and 75°C operating temperature range. The maximum force recorded during the test was 49.05 N. An IMU (MTW2-3A7G6, Xsens, The Netherlands) was installed on the floating collar edge to measure the rotational motions. Three acoustic Doppler velocimeters (ADVs, Nortek, Norway) were installed on the front of the net cage model to simultaneously measure the inflow velocity. The three ADVs were evenly spaced at 100 cm intervals, with the mean measurement value taken as the inflow velocity. We installed two LED markers on the center of the floating collar and the tube sinker to try to measure the surge and heave motions following Tang et al. (2022b). However, the wave tank bottom was a sandy bed covered with an iron plate, and the wave-generating process made the water quality so muddy that the image processing method was not applicable. Therefore, only the rotational motion results were available for the experiment.
Two methods presented in existing studies can make the mooring line failure happen in a laboratory environment. The first method is the usage of the line cutting device (Figure 1) proposed by Tang et al. (2021). The device composes of a blade and a pneumatic cylinder that provides cutting power by means of an air compressor. The second approach is the electromagnet described by Tang et al. (2022b), wherein power can be turned off to disconnect the mooring line. The first method was adopted herein because the second method was proposed after this experiment.
2.2 Experimental procedure
Figure 3 illustrates the experimental procedure flowchart. The no-load offset readings of the load cells, wave gauges, gyro, and ADVs were initially recorded. The pre-tension of the two mooring lines was then checked using the measurements of two load cells and by adjusting the difference between them to less than 5%. This was done to ensure that the forces in the mooring system were symmetrical. The current velocity was then increased to a predetermined value. A 30 min elapse was allowed for the flow field stabilization. Irregular waves were generated by the wave maker according to the JONSWAP spectrum. The steps comprising the main part of the experiment are presented here. First, the measurements were collected from the load cells and the ADVs of the mooring system in intact condition for 5 min (300 s). The mooring line cutting test was then conducted, and recording started. The button was pressed after 40 s to cut the mooring line linked to load cell #1. The remaining recording length was 260 s. Finally, the test data were checked, and the wave and current generators were stopped if found to be in order.
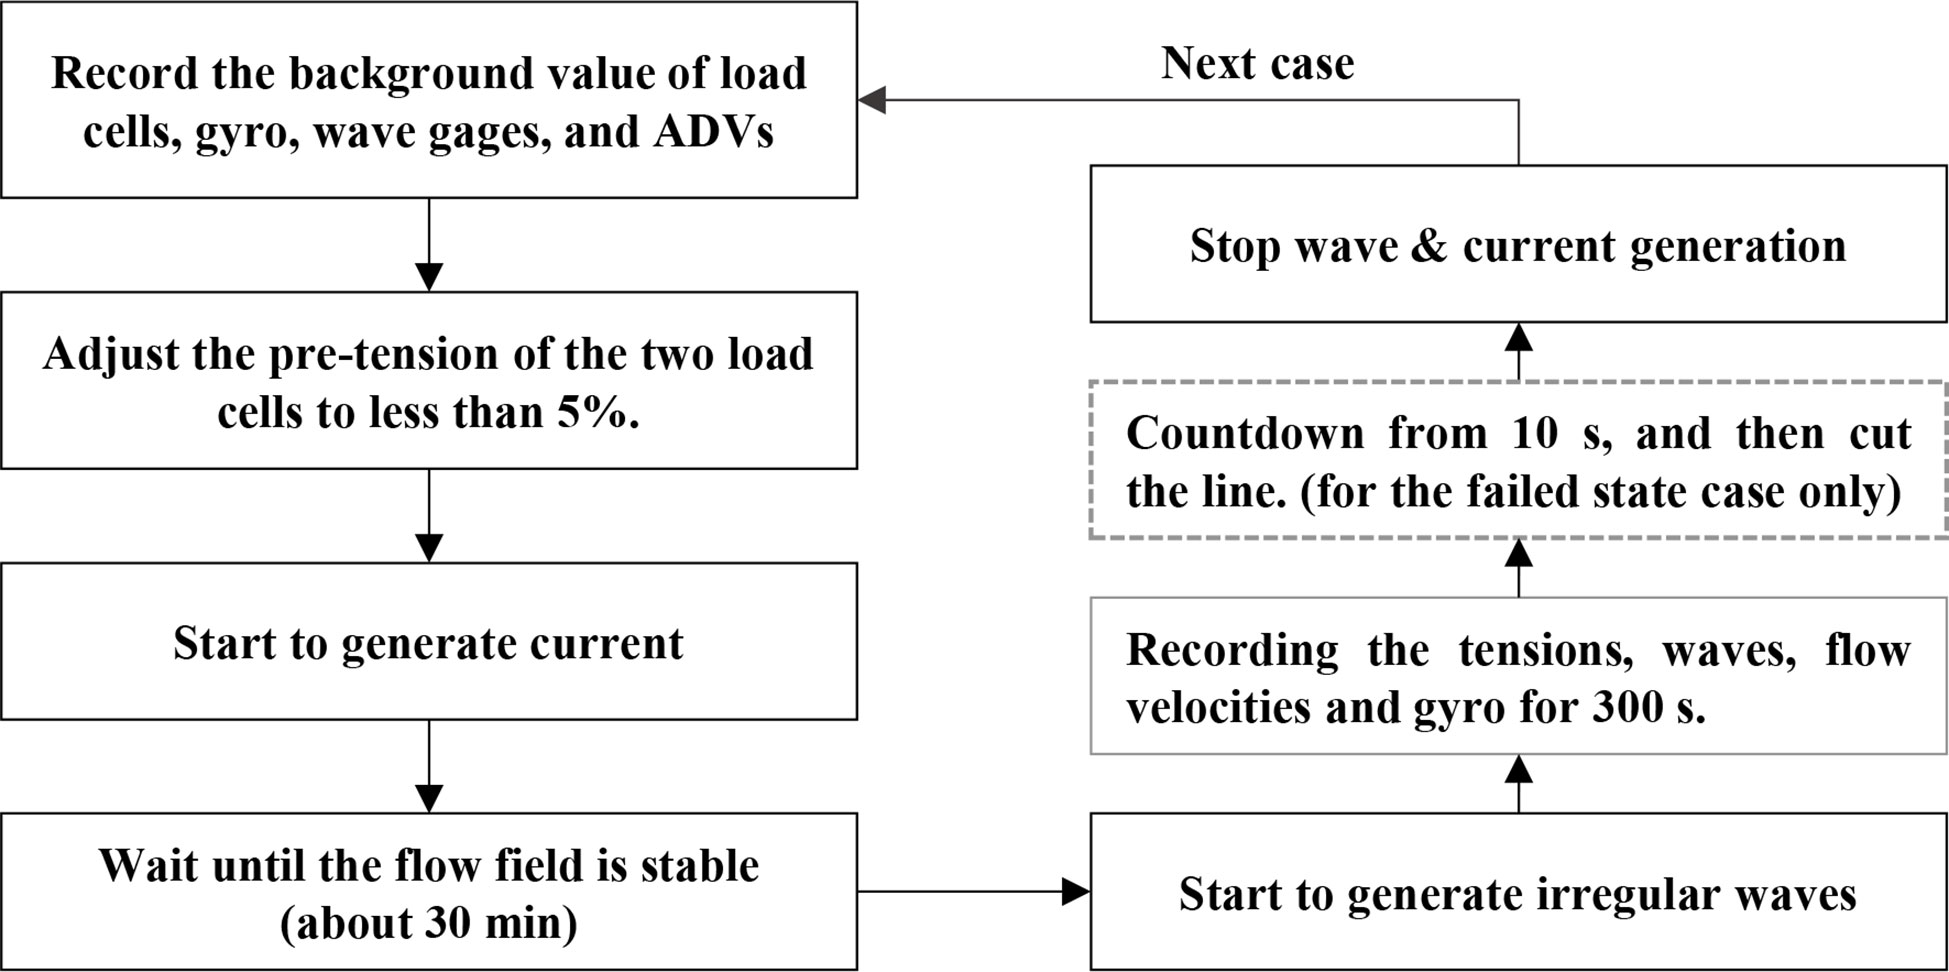
Figure 3 Flowchart of a single experimental case.
As for the duration time for the irregular wave measurements, the typical 15–30-min sample duration in the natural sea is generally considered a reasonable compromise considering the battery life and the deployment time. For example, a wave-measuring buoy may be used for a year deployment with three hourly records using 15 min sample durations or a 2 month deployment reporting every hour using 30 min sample durations (Pecher and Kofoed, 2017). In previous studies, a 20 min duration time was commonly adopted in a full-scale net cage in the natural sea (e.g., Fredriksson et al., 2003; Fredriksson et al., 2005; Huang et al., 2010). This time duration includes 120–200 waves for 6 to 10 s wave periods. The long duration of irregular waves in the wave tank can cause wave reflections that must be considered. According to that, the recording time for the model test is scaled down from 20 to 4 min based on the scale ratio of time. Moreover, the total measurement time is extended to 5 min to sufficiently capture the dynamic responses after the failure.
3 Numerical model
The numerical model aimed to cross-check the experimental results. Therefore, the numerical simulations used the same input parameters of the net cage model listed in Table 1. The subsequent sections will provide a brief introduction to the numerical method.
3.1 Environmental loads
The numerical domain was considered herein as a three-dimensional (3D) space with a uniform bottom and adopted a superposition principle of linear velocity potential functions to represent a flow field, including a steady uniform current and an irregular progressive wave, given as
where Ux and Uy are the components of a uniform current in the x and y directions, respectively; (x,y,z) is a position coordinate; Nw is the total number of wave components; Ai is the i-th wave amplitude; ωi is the i -th wave angular frequency; ωei=ωi−(kxiUx+kyiUy) is referred to as the i-th apparent wave angular frequency; ki is the i-th wave number; kxi=kkcosα is the component of the wave number in the x-direction ; kyi=kisinα is the component of the wave number in the y-direction , where α is an apparent angle defined as the angle between the irregular wave and current directions; ϵi is the i-th wave phase angle randomly distributed between 0 and 2 π ; g is gravity; t is time; and h is the water depth. The water surface elevation η is calculated as
The correspondent dispersion relation for the wave/current coexisted field is given as
We obtain a 3D velocity field, where velocity is defined as V=−∇ϕ , by taking the derivative of Eq. (1) with respect to (x,y,z)
Similarly, the local accelerations for the 3D field are obtained as follows by taking the derivative of Eq. (4) with respect to t
Velocity and acceleration fields are then applied to the Morison equation based on the lumped mass method to obtain the hydrodynamic forces acting on the net cage (Huang et al., 2006; Huang et al., 2007; Huang et al., 2010).
The incident wave spectrum S(f) obtained from the wave gauge records in the experiment (Figure 4) was applied to the numerical simulation to better fit with the experiment. For computational efficiency, the exponential frequency cutoff method (Hsu et al., 2007) was used to decompose the incident wave spectrum S(f) into 100 wave components. Let the lowest and highest cutoff frequencies be fmin and fmax , respectively. The frequency of each wave component is then given as
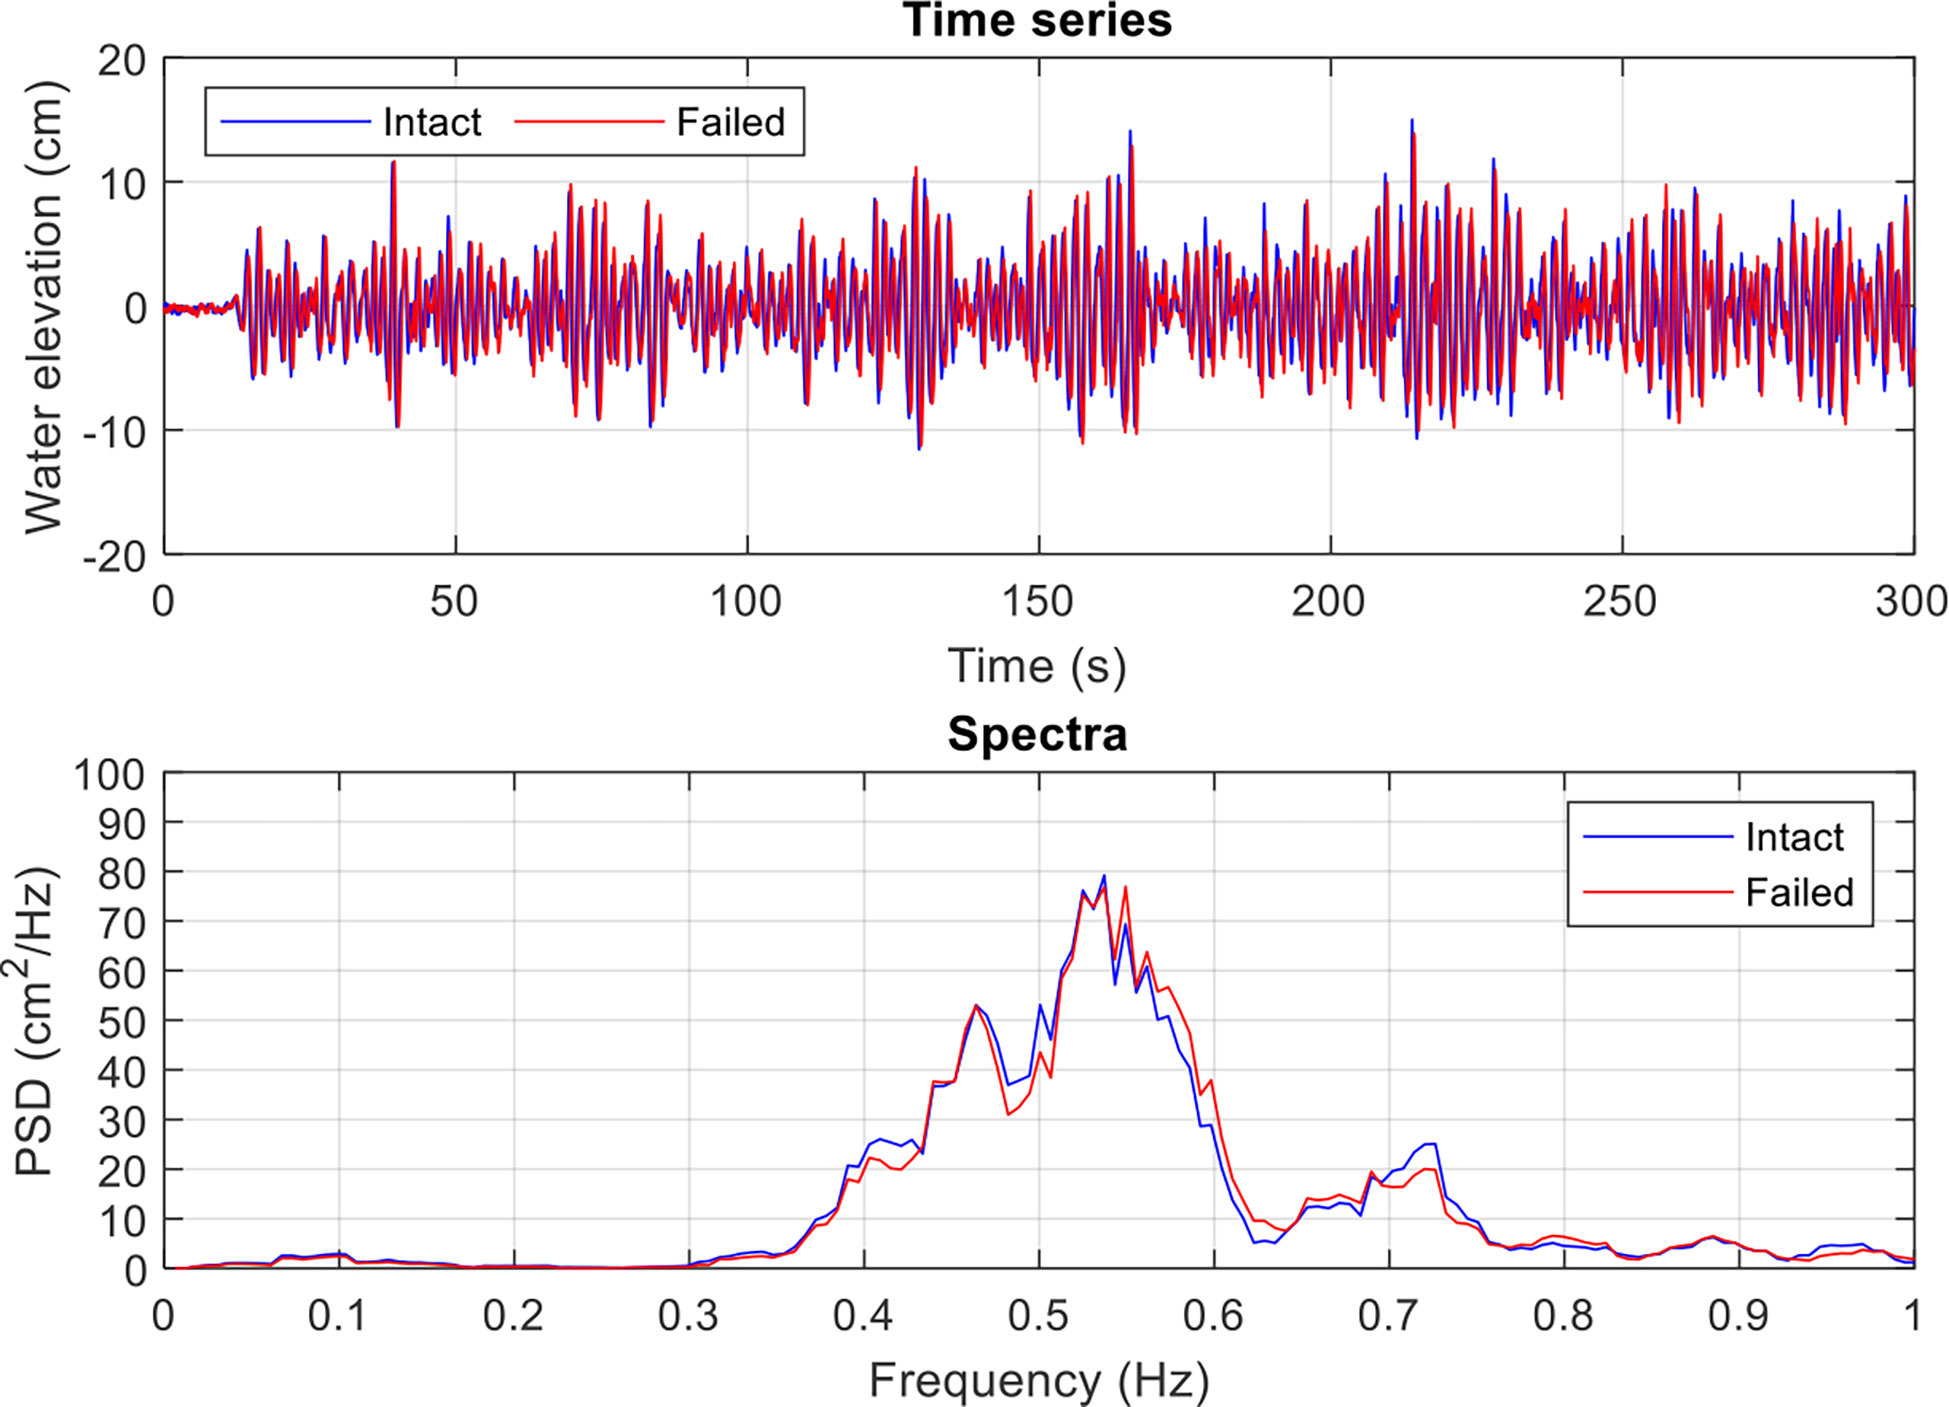
Figure 4 Time series and power spectral density of the incident waves.
where Nw is the number of wave components. Typically, fmin=0.1fp and fmax=5fp are adopted in the numerical simulation, where fp is the peak frequency. The wave amplitude and the angular frequency of each wave component are written as
When irregular waves are generated in the numerical model, random phase angles will appear in the water elevation, velocity, and acceleration, as shown by Eqs. (2), (4), and (5), respectively. Therefore, a phase difference between the numerical and experimental results is ineluctable.
In order to reduce transient responses and prevent numerical instabilities, there is usually a build-up stage in which wave dynamics and object motions are ramped up smoothly to their full value. In this study, the duration of the build-up stage was set to 20 seconds.
3.2 Equation of motion
In this study, the net cage model was assumed to be deployed in water at a uniform depth and subjected to irregular waves and uniform currents. To calculate the hydrodynamic forces acting on the cage system, the whole system was divided into small elements according to the lumped mass method. These elements were chosen to be relatively small compared with the characteristic wavelength to simplify the numerical calculations. In this manner, the scattering effect between any element and the flow field can be neglected. We appropriately applied the Morison equation to the net cage components. All net cage model components were divided into two categories: deformable and rigid. The deformable parts included the fish nets and the mooring lines, whereas the rigid parts included the nondeformable floating collar and the tube sinker.
In this study, each deformable component comprised several elements and nodes assigned with numbers. For each element, the external forces were calculated, and the resultant force was evenly distributed among the corresponding nodes. Thus, each node contained the lumped mass of all neighboring elements and their corresponding forces. Its equation of motion is expressed as follows:
where subscript k denotes the node number, j = 1, …; Ne denotes all neighboring elements associated with node k; Ne represents the total number of neighboring elements; mj is the mass matrix; x is the position vector; and FDj , FIj , FBj , FWj , and FTj represent the vectors of the drag, inertia, buoyant, gravity, and tension forces, respectively, on element j. Details on the external force modeling of the cage components can be found in the previous works of Huang et al, 2006; Huang et al, 2007.
The motion of the rigid components of the net cage system, including the floating collar and the tube sinker, can be resolved by the rigid body motion with six degrees of freedom (DOF) in a 3D space. The three translation motions can be expressed as
and the three rotational motions can be expressed as
where subscripts 1 to 3 and x, y, and z correspond to the body and global coordinate systems, respectively; ( xG , yG , zG ) are the coordinates of the center of gravity; ( ω1 , ω2 , ω3 ) are the angular velocities along the principal axes; mG is the body mass; ( Fxk , Fyk , Fzk ) and ( M1k , M2k , M3k ) are the components of the resultant forces and moments acting at the lumped mass node k; Nn is the number of nodes in the body; and ( I1 , I2 , I3 ) are the principal moments of the rigid body inertia. For the floating collar and the tube sinker, I1=0.5mGR2 , I2=0.5mGR2 , and I3=mGR2 , where R is the rigid body radius.
We can obtain a solution with a short time increment by applying the fourth-order Runge–Kutta method to the equation of motion in the net cage system [Eqs. (10)–(12)]. The path of each node, including the mass center of the rigid body, is accordingly depicted herein. By computing the neighboring node distance, the tension force of the flexible part is obtained and used as the input tension data for the next time step until the required time interval is spent.
In this work, the net cage model was divided into 844 elements and 791 nodes, and the time step for the numerical integration was 0.0001 s. The number of nodes and elements and the time step in the preliminary stage were determined through time domain convergence tests. The total number of elements on the fish net was 480, including 24 and 20 in the circumferential and depth direction of the net, respectively. The element on each mooring line was 25.
3.3 Force on the net
The hydrodynamic forces on the netting were calculated using the screen model (Huang et al., 2006; Kristiansen and Faltinsen, 2012). In the algorithm, the whole netting structure was divided into many small screens (or elements), with each screen containing many mesh twines. The tension, buoyancy, and gravity forces acting on each screen represented the sum of the forces exerted on the twines in the screen. Finally, the total forces on the screen were assumed to be evenly distributed among the nodes. The drag CD(β) and lift CL(β) coefficients depended on the flow attack angle β . They can be determined using the experimental results by Løland (1991).
The solidity ratio Sn is the ratio between the area covered by the twines in the screen and the total area of the screen. It is expressed as follows for a knotless net:
where D is the twine diameter and λ is half of the mesh size. The fluid particle velocity was slightly retarded after entering the net cage. This phenomenon is known as the shielding effect. A velocity reduction coefficient of 0.85 was adopted for the rear part of the nets (Løland, 1991).
3.4 Simulation of the mooring line failure
All anchor points in the intact mooring state were considered as fixed nodes to simulate the net cage dynamics. To do that, the equation of motion of all anchor points was set to . It is to ensure all anchor points will not move. In contrast, anchor point #1 was changed to a free node and allowed to move freely according to the equation of motion to simulate the mooring line failure (Yang et al., 2020). In the other word, we can lift the restriction of the anchor point ( , then it will move freely in the next time step depending on the external forces as shown in Eq. (8). In this study, a predetermined time of 40 s after the start of the simulation was set as the moment of failure occurrence. The experimental setup showed a total simulation time of 300 s. The results were then compared with those in the experiments.
4 Influence of the mooring line failure on dynamic responses
4.1 Model test A
Table 2 lists the input wave and current conditions, where A1 is the intact mooring condition and A2 is the mooring line failure condition implemented according to the flowchart shown in Figure 3. The significant wave height (Hs) and wave period (Tz) were obtained from the wave gauge recordings using the zero up-crossing analysis method. The current velocity (U) was taken from the average of the three ADVs. The difference in the input conditions between the two test cases was less than 1.10%. Figure 4 shows the time history and the power spectral density (PSD) of the incident irregular waves. The two PSDs were obtained using the fast Fourier transform (FFT) analysis with 212 = 4096 data points ranging from 50 to 213.84 s (approximately 91 wave periods). The sampling rate was 25 Hz. The PSDs were then smoothed by the moving average method with seven points. The two cases showed great agreement in both the time and frequency domains. The wave spectra under the intact and failed states were very close, having a similar 0.54 Hz peak frequency. However, a minor peak response was observed near 0.73 Hz, which may have resulted from the reflected waves caused by the limited wave tank length. Overall, the repeatability of the irregular waves and current generation in the experiment was excellent. For comparison reasons, these two wave spectra were used to generate irregular waves in the time series for the numerical model in the case of the intact and failed mooring states, respectively.
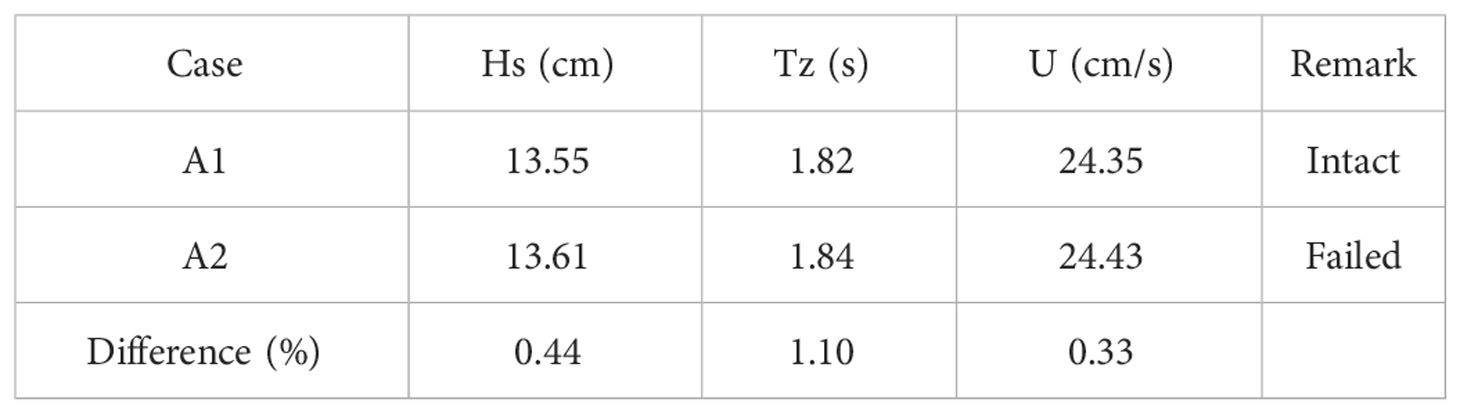
Table 2 Input irregular wave and current conditions in model test A.
4.2 Tension responses caused by the mooring line failure
Figure 5 shows the time series of the tension response of Line 2 under the intact and failed states of mooring and compares the difference between the experiment and simulation. The intact condition was used to quantify the actual influence of the mooring line failure. The comparison revealed that the tension in Line 2 greatly increased after Line 1 failed at 40 s in both the experiment and simulation. In the experiment, the maximum tensions for the intact and failed states were 13.2 and 20.9 N, respectively. The mean values were 4.9 and 10.2 N, and the standard deviations were 2.0 and 3.0 N, respectively. In the simulation, the maximum tensions for the intact and failed states were 23.1 and 27.1 N, respectively. The mean values were 7.2 and 12.1 N, and the standard deviations were 3.1 N and 3.5 N, respectively. Both results showed that the mooring line failure increased the tension response not only in magnitude but also in amplitude. However, the simulation results were overestimated. The difference between the experiment and simulation should be caused by the limitation of the numerical models that ignored the wave–body interactions. Moreover, numerically perfect symmetric mooring and uniform water current is nearly impossible to reproduce in an experimental setting. The shielding effect within the net and the damping effect of the wave–body interactions may lead to reduced mooring loads in the model tests. It is also difficult and sometimes impossible to accurately deploy the mooring system to ensure its symmetry in a model test. This will cause an asymmetrical cage movement and produce unexpected results. The motion of the floating collar induced by the asymmetric mooring will be described in the next section.
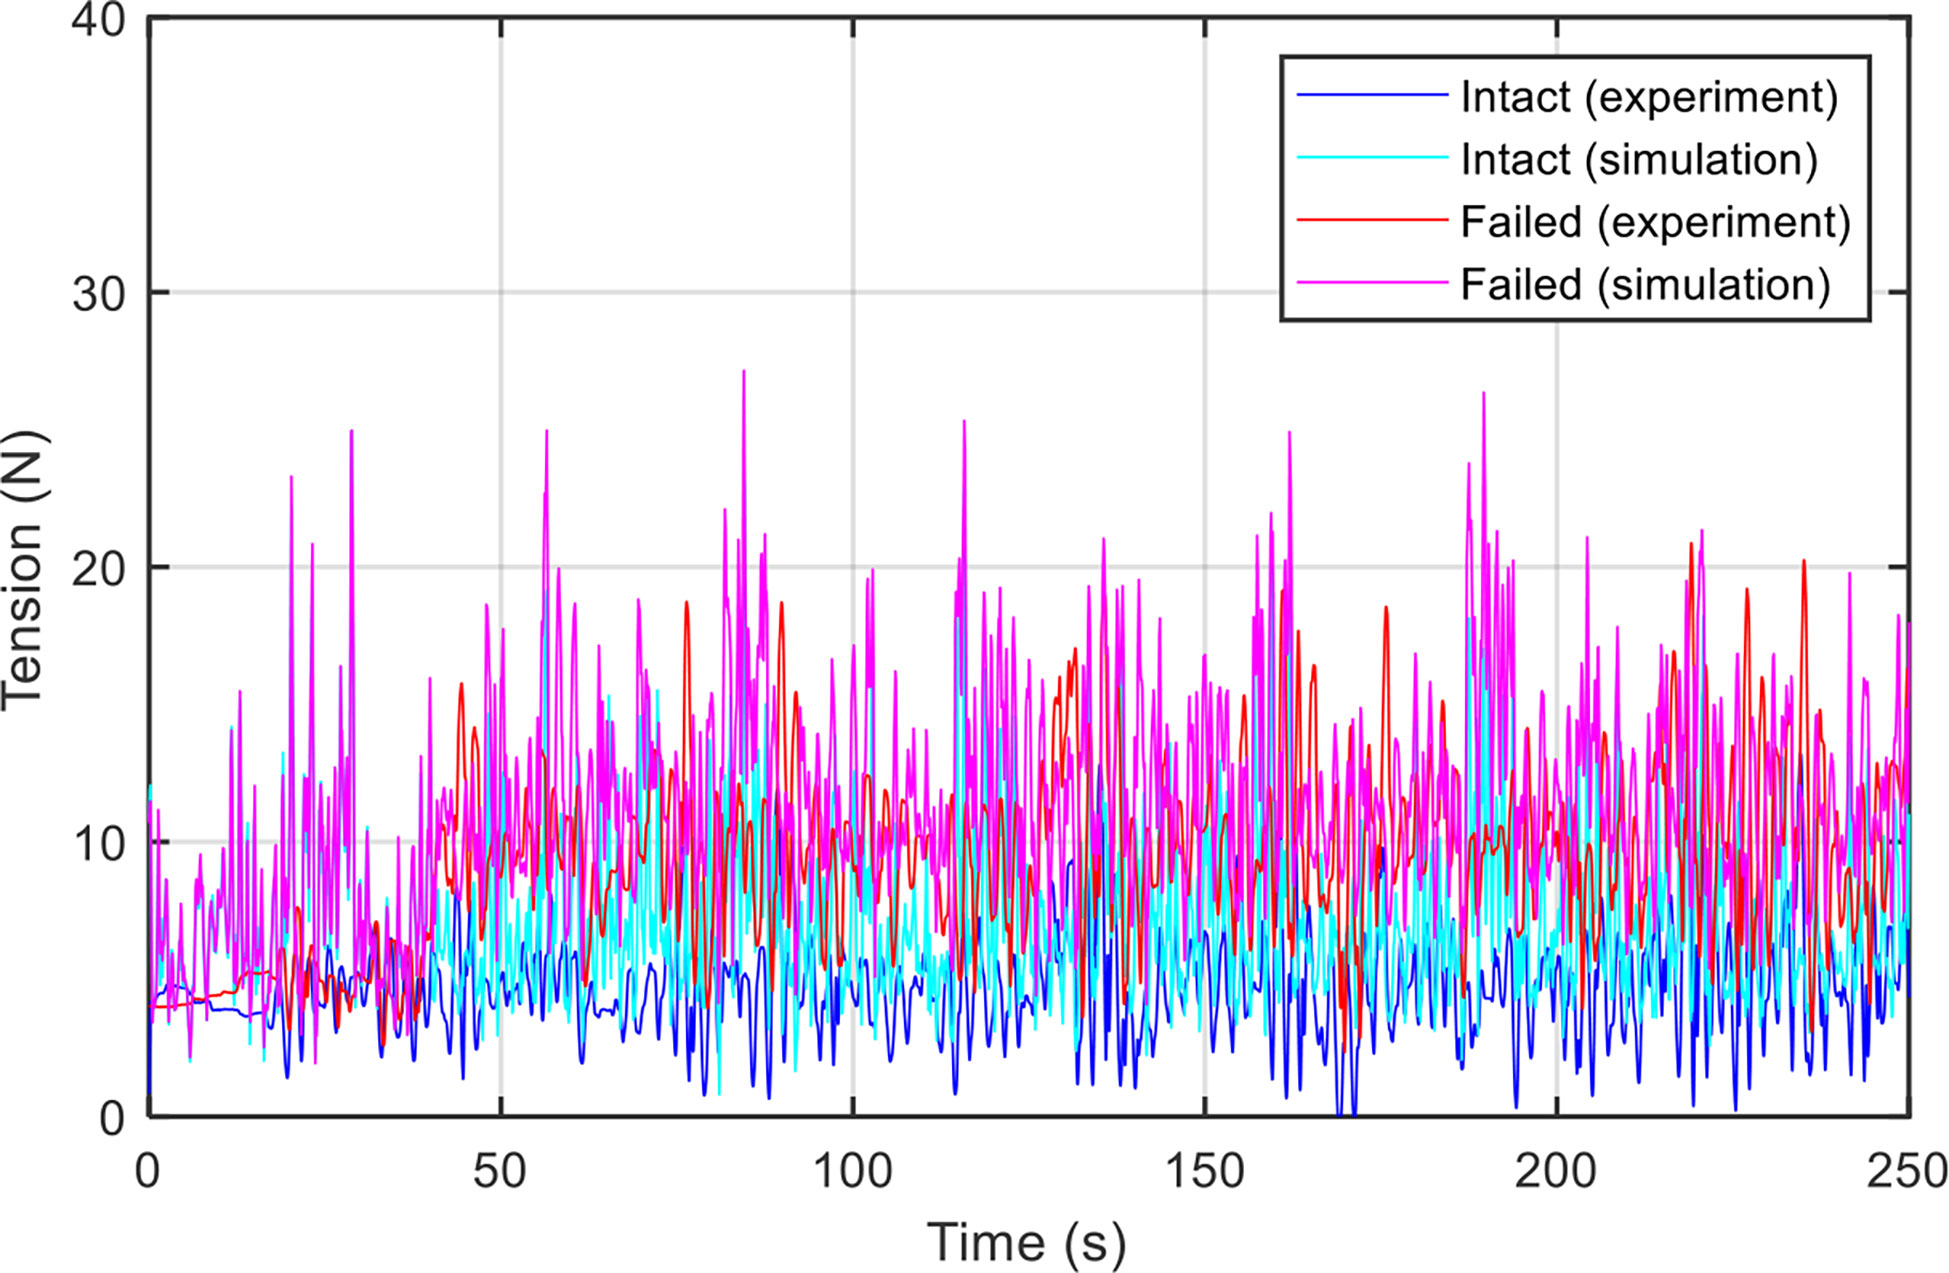
Figure 5 Time series tension responses of Line 2 under the intact and failed states of mooring.
Figure 6 compares the PSD of tension of Line 2 in the frequency domain for both the experiment and simulation under intact and failed moorings. All PSDs were obtained using the FFT analysis based on the consideration mentioned earlier. The results of both intact and failed moorings between the experiment and simulation were comparable, except for the higher-frequency (within 0.6 and 1.0 Hz) and lower-frequency (close to 0.1 Hz) regions. The tension PSD for both the experiment and simulation showed a significant increase in both the wave- and low-frequency regions compared to the intact mooring. The former was related to the wave force, whereas the latter was related to the restoring force of mooring. In other words, the mooring line failure caused a more significant tension response in both wave- and lower-frequency regions. The peak frequency of the tension PSD was different from the wave PSD, which may be due to the complex coupling effect between the cage motion and its mooring.

Figure 6 Power spectral density of the mooring tension in Line 2.
The linear transfer function of the tension Htension(f) of the net cage using the auto-spectral technique was applied to better understand the frequency response of the tension under irregular waves (Fredriksson et al., 2003; Dong et al., 2010; Huang et al., 2010).
where Stt(f) is the auto-spectra of the mooring tension and Sηη(f) is the auto-spectra of the incident waves.
Figure 7 compares the transfer function of tension in Line 2 for the experiment and simulation under the intact and failed mooring states. The resonant frequency of the tension response was found within 0.2–0.3 Hz for both the experiment and simulation. The response amplitude in the resonant frequency region turned into two peaks when the mooring line failure happened. The comparison results also showed that the numerical model can precisely simulate the response frequency but overestimate its response amplitude. The discrepancy between the experiment and simulation was mentioned earlier. Overall, the numerical simulation results are acceptable for the engineering feasibility analysis purpose.
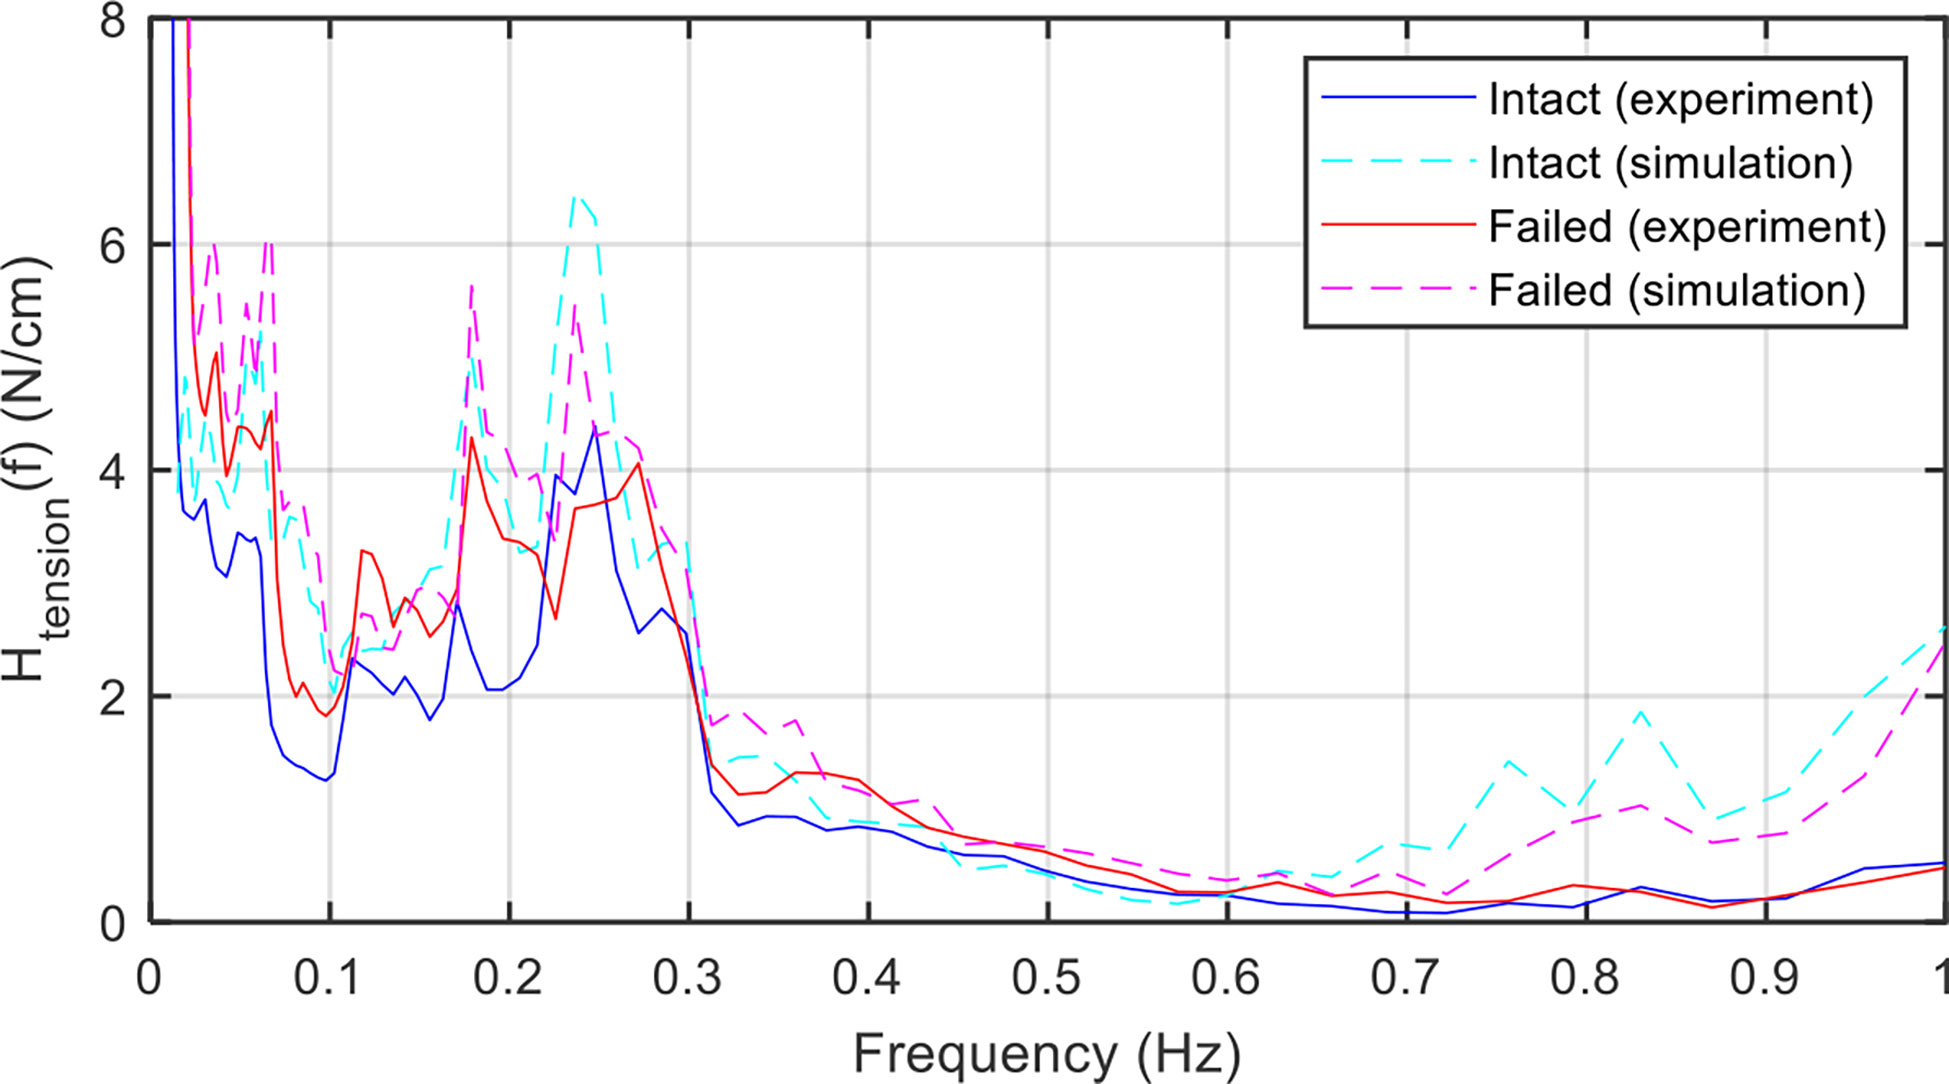
Figure 7 The transfer function of the mooring tension in Line 2.
4.3 Rotational motion response due to the mooring line failure
According to existing studies (Tang et al., 2020; Yang et al., 2020), a significant yaw motion can be observed after cutting an upstream mooring line. Therefore, we deployed an IMU on the floating collar to measure its rotational motions, including the roll, pitch, and yaw. However, we did not record the translational motions (i.e., surge, sway, and heave) because the IMU was not installed at the gravity center of the floating collar. Table 2 lists the test conditions in this case.
The incident direction of the waves and currents was aligned in the x -axis direction symmetric to the net cage model layout (Figures 1, 2). Therefore, the surge, heave, and pitch of the floating collar under the intact condition were the major responses, and its roll and yaw motions were minor and negligible. Thus, if the mooring layout is not exactly symmetric, some unwanted or unexpected motion components will occur. However, this was hard, even impossible, to prevent in the experiment.
Figure 8 compares the time series of the experimental and simulated roll, pitch, and yaw motions under intact and failed mooring conditions. In the intact state of the experiment, the roll and yaw were small compared to the pitch, but still visibly vibrated compared to the simulated ones because the mooring system was not perfectly symmetrical, thereby leading to differences in the motion response and the resulting mooring response between the experiment and simulation. In the failed state of the experiment, a significant increase in the yaw motion above 20° was observed after cutting the line at 40 s. It then started to balance and reach a stable value. Its amplitude was much smaller than the pitch amplitude. A similar yaw motion was also observed compared to the simulation, but only by approximately 8°. This difference could have been caused by the tightened bridle in the simulation, but not fully tightened in the experiment (Tang et al., 2022b). The fully symmetrical and tightened mooring in the simulation could also be the source of discrepancy in the roll and pitch responses compared to the experiment.
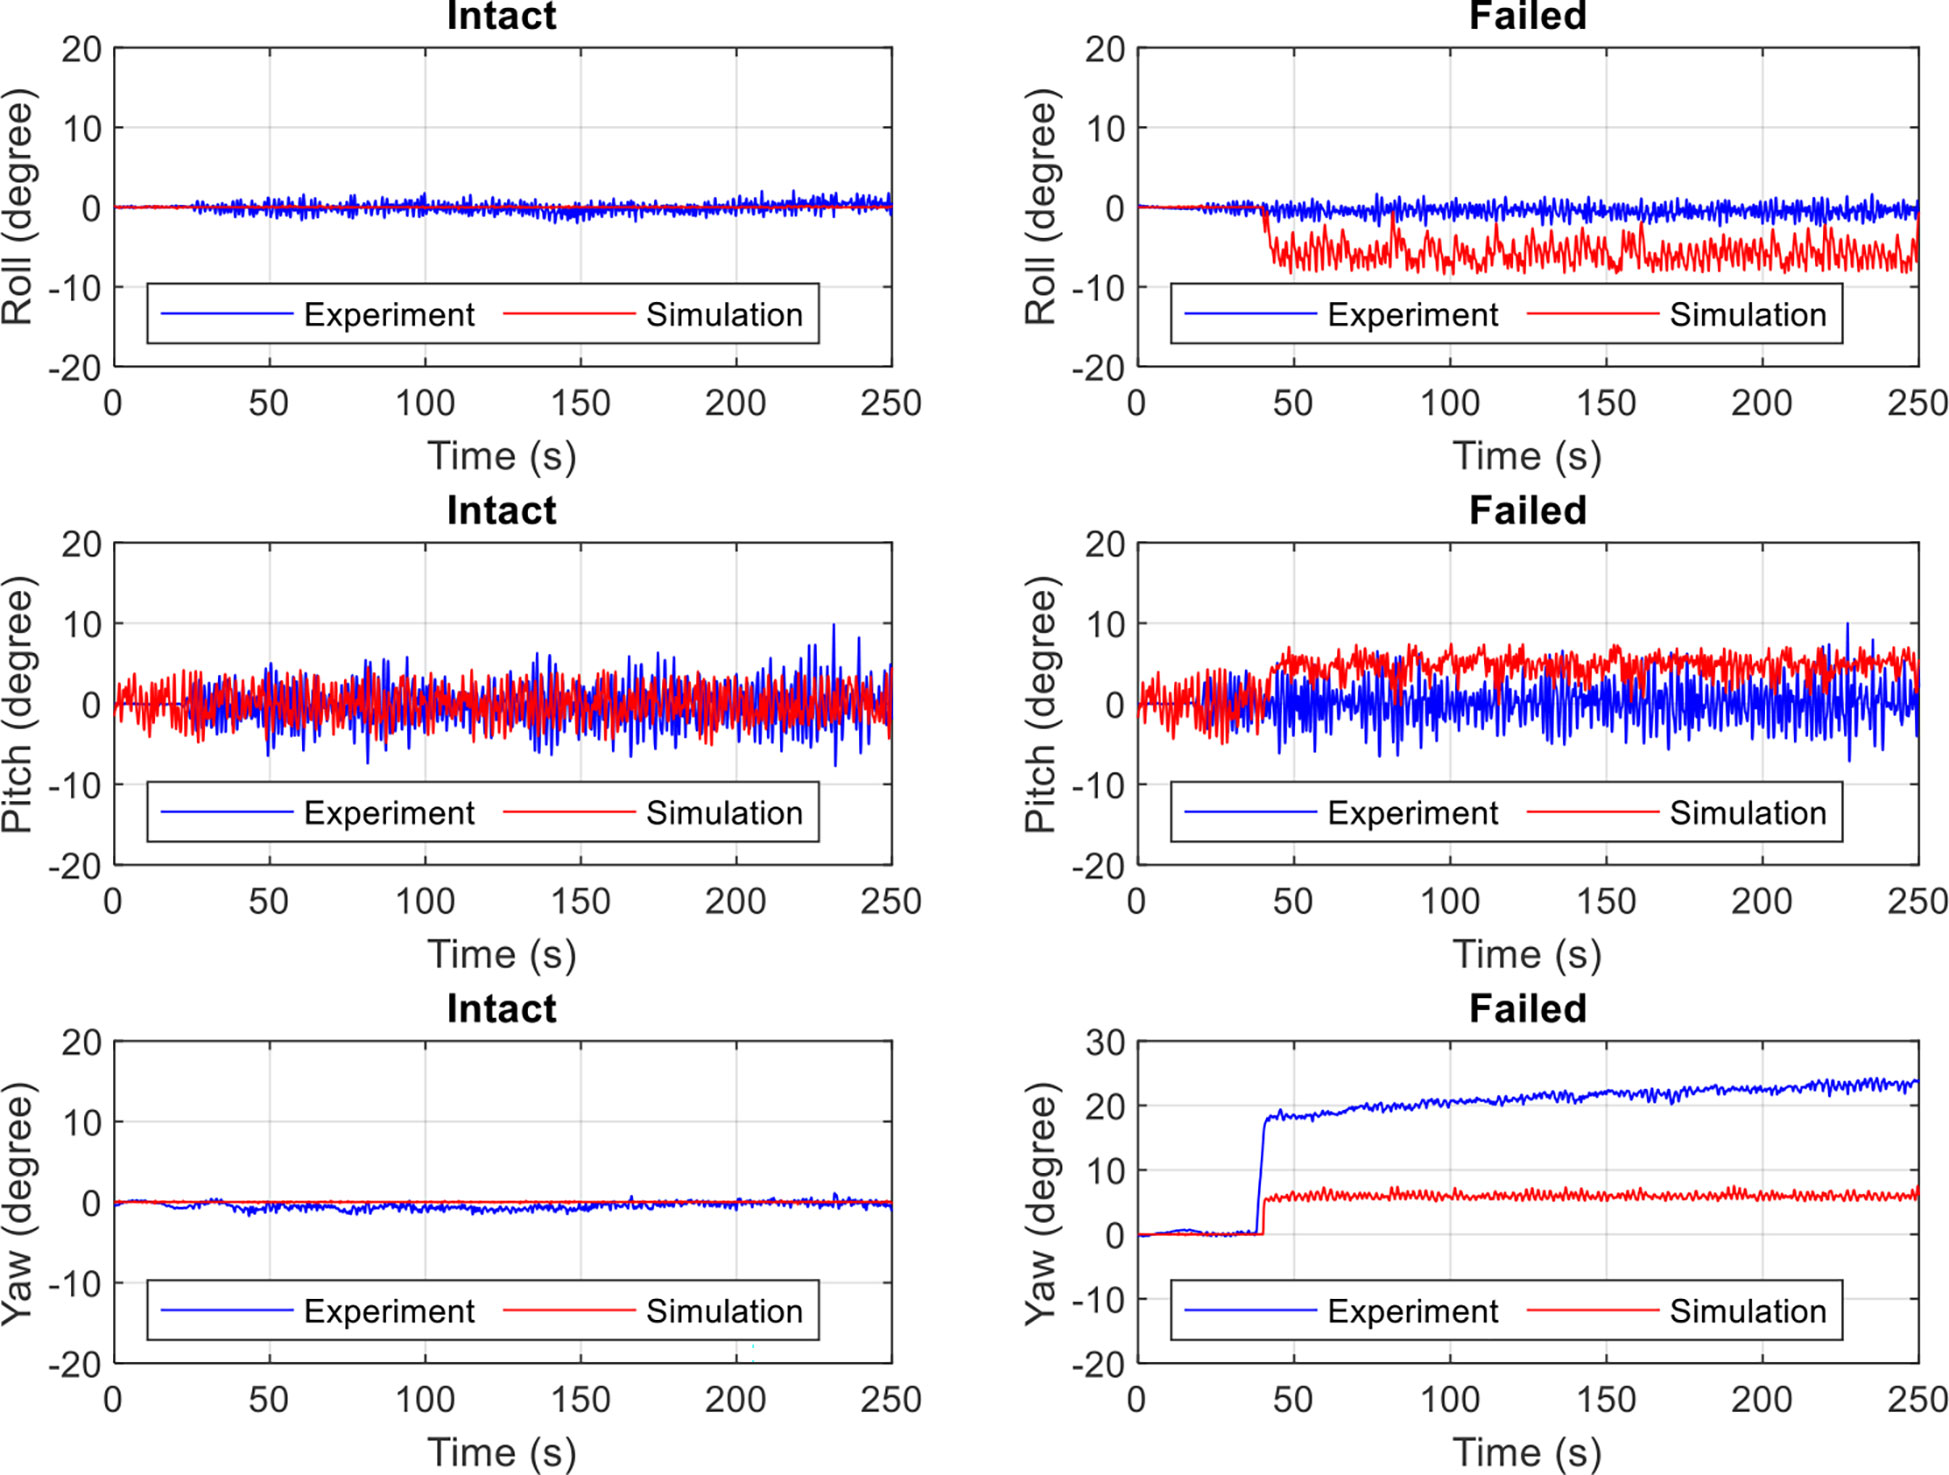
Figure 8 Time series of the roll, pitch, and yaw rotations of the floating collar in the experiment and simulation under the intact and failed states.
Similarly, the linear transfer function of the motion response of the net cage under irregular waves was calculated as follows using the auto-spectral technique:
;
where Srr(f) , Spp(f) , and Syy(f) are the auto-spectra of the roll, pitch, and yaw motions of the floating collar, respectively.
Figure 9 compares the linear transfer functions of the experimental and simulated roll, pitch, and yaw rotations under intact and failed mooring conditions. The intact state showed almost no response of the roll and yaw in the simulation. By contrast, the low- and resonant frequency (0.2–0.3 Hz) responses of the roll and yaw were observed in the experiment. The differences were caused by the fully symmetrical and tightened mooring lines. Nevertheless, the transfer functions of the pitch were close to each other. The experimental peak values of the roll, pitch, and yaw within 0.2–0.3 Hz slightly decreased in the failed state than in the intact state. However, the simulated peak values of the three rotations significantly increased when their intact and failed states were compared. This difference may be the error source of the higher transfer function response of the mooring tension in Figure 7.

Figure 9 Transfer functions of the roll, pitch, and yaw motions of the floating collar in the experiment and simulation under the intact and failed states.
4.4 6 DOF motion response due to the mooring line failure
The experimental results were considered to be more representative and referenceable. However, the three translational motions (i.e., surge, sway, and heave) of the floating collar were not available in the experiment. Therefore, in this section, we will only discuss the 6 DOF motions in the numerical simulations.
Figure 10 compares the transfer function of the 6 DOF motions of the floating collar under the intact and failed mooring conditions. Comparing the translational motions, the pitch and heave responses within the resonant frequency of 0.2–0.3 Hz decreased with the mooring line failure, while the low-frequency response increased. The transfer function of sway significantly increased as the mooring system transitioned from an intact to a failed state. Comparing the rotational motions, the transfer functions of the roll and yaw became significant, while the pitch frequency shifted to a lower frequency. The low-frequency response significantly increased.
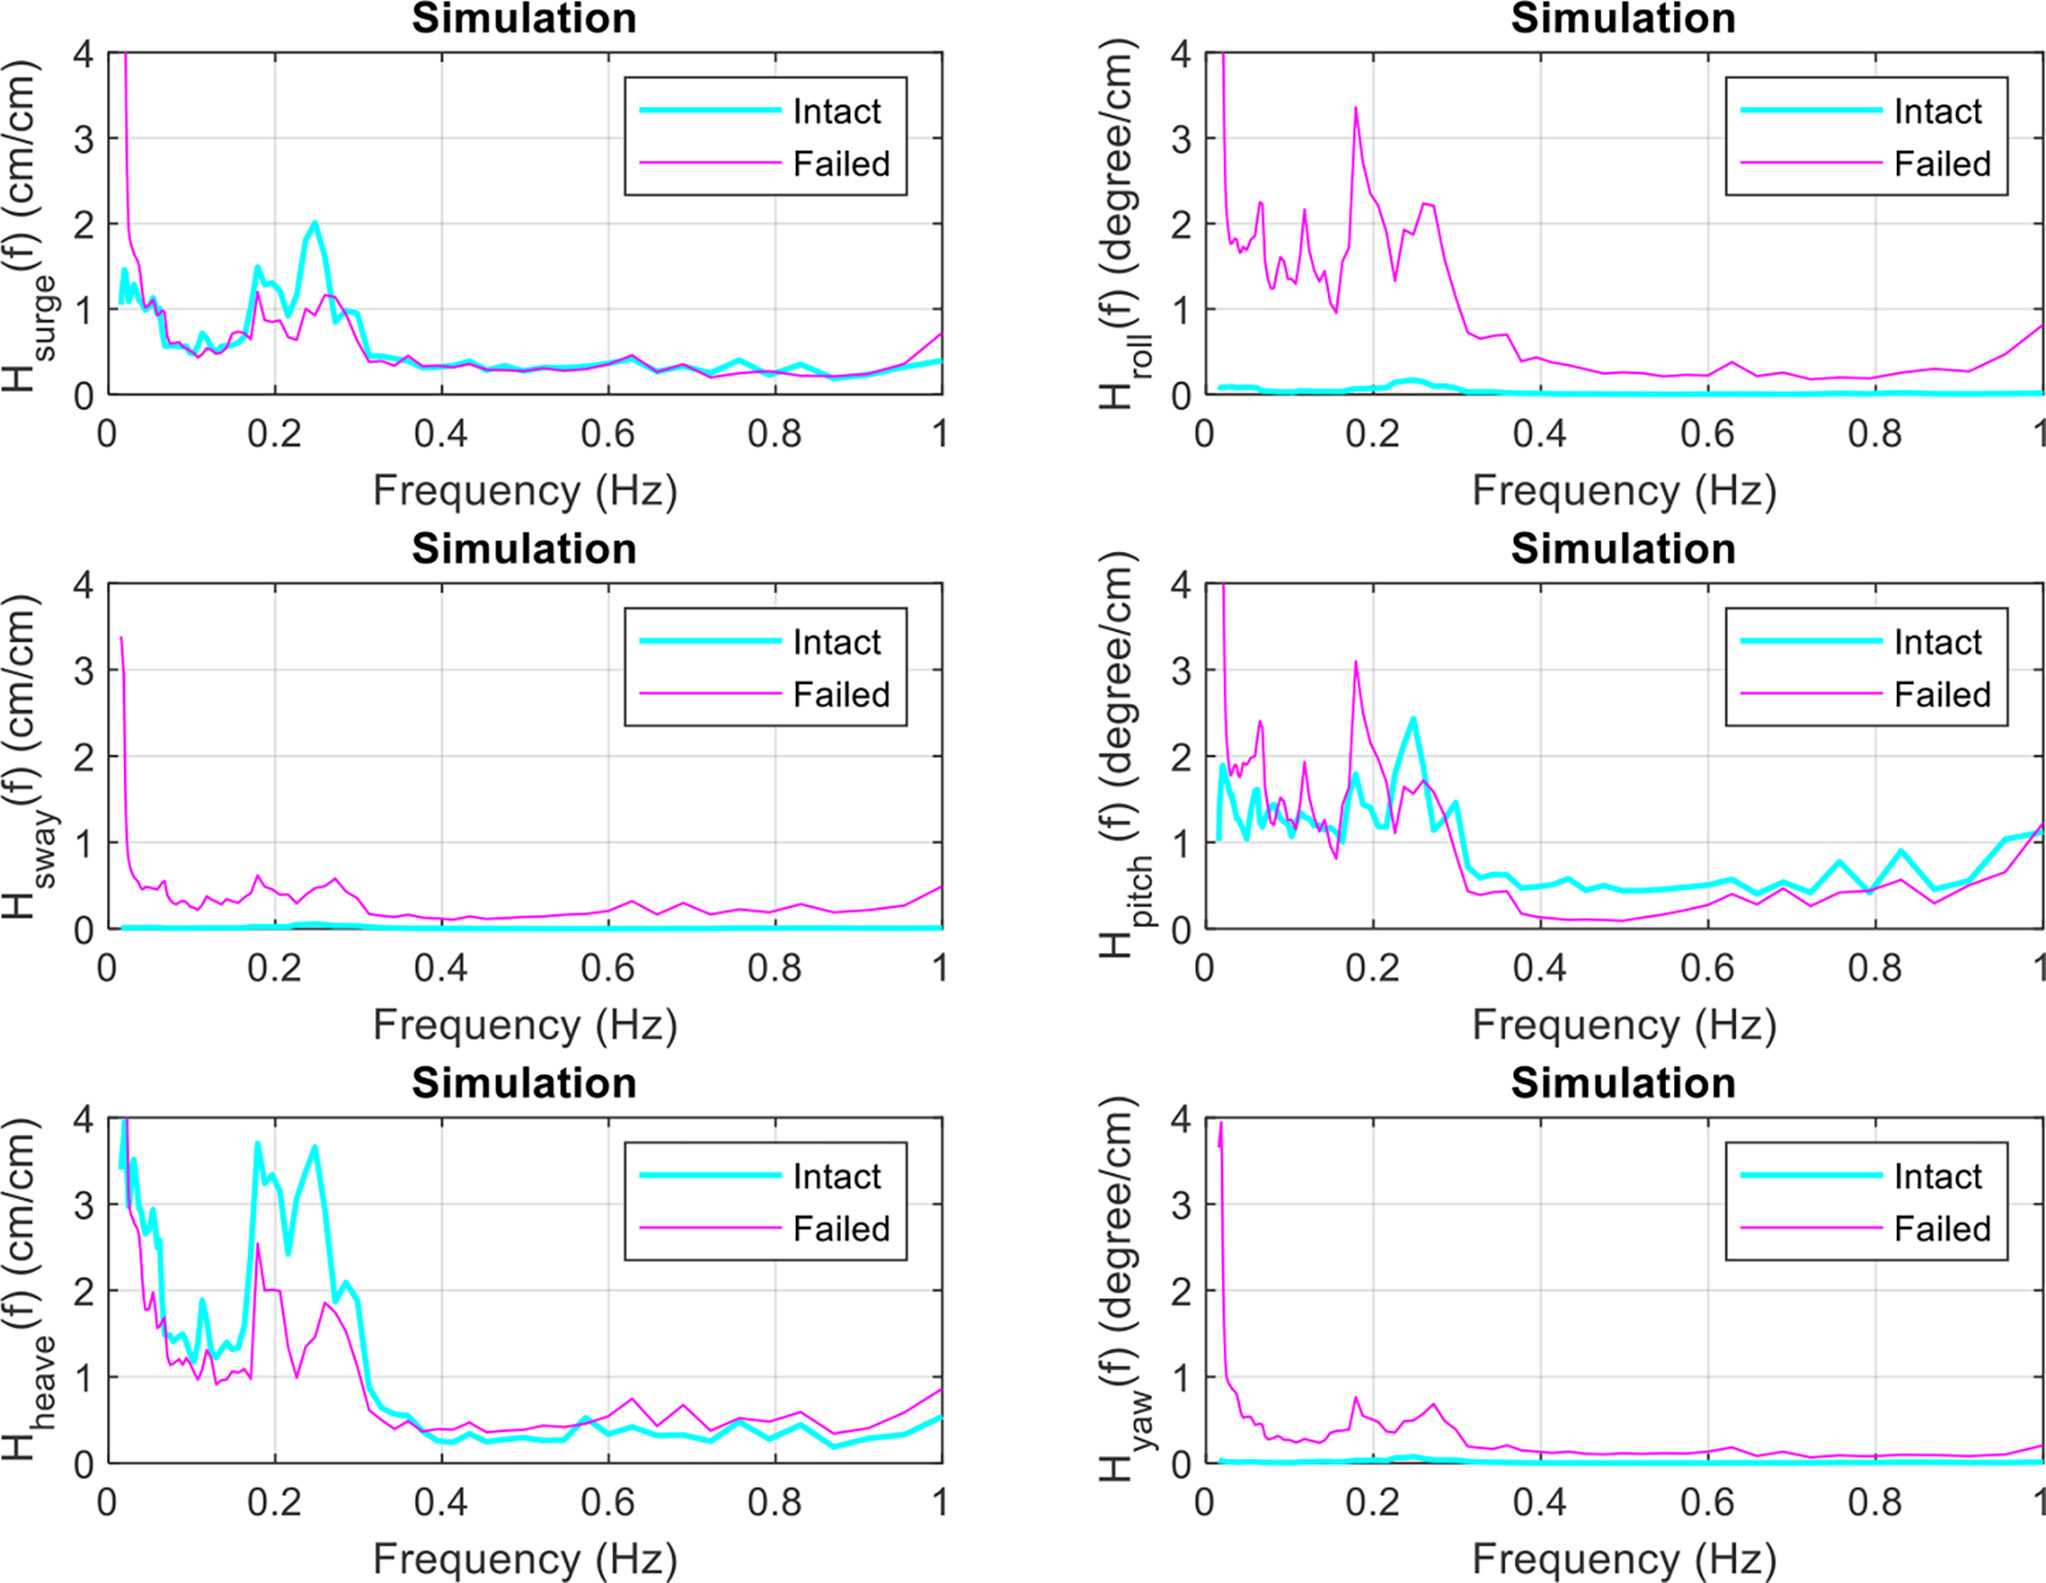
Figure 10 Transfer functions of the 6 DOF motions of the floating collar under intact or failed mooring (numerical simulation).
5 Influence of the current velocity on the mooring line failure
5.1 Model test B
The current forces can play a more important role than the waves due to the drag force dominant characteristic of the netting structure (Huang et al., 2007). Therefore, it is important to study the influence of increasing the current velocity on the mooring line failure. In this case study, three different current velocities traveling with the same irregular waves (cases B1 to B3) toward the x-axis direction were used (Table 3). The significant wave height and period were obtained by using the zero up-crossing analysis method (see Section 4.1). The current velocity was the average value of the three ADVs. The input parameters used in the wave-generating procedure of the experiment for the three cases were identical. Results showed that the wave period slightly increased when the current velocity was increased. By contrast, the wave height significantly decreased. Figure 11 compares the wave spectra for cases B1 to B3. The wave amplitude changed as the current velocity increased. This is known as the characteristics of the wave–current interaction (Thomas, 1981; Ryu et al., 2003).
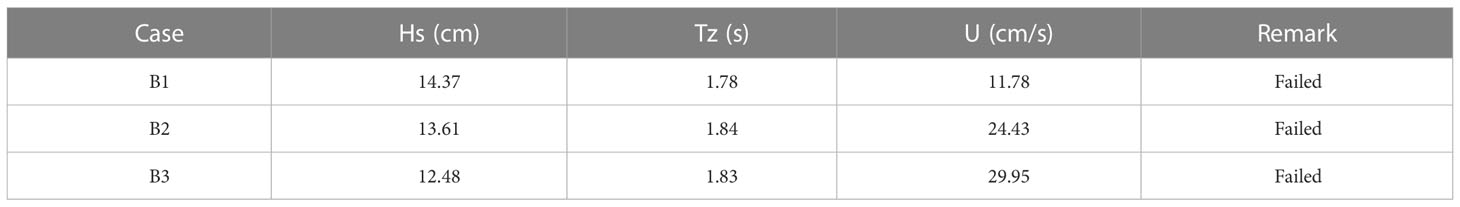
Table 3 Input irregular wave and current conditions in model test B.
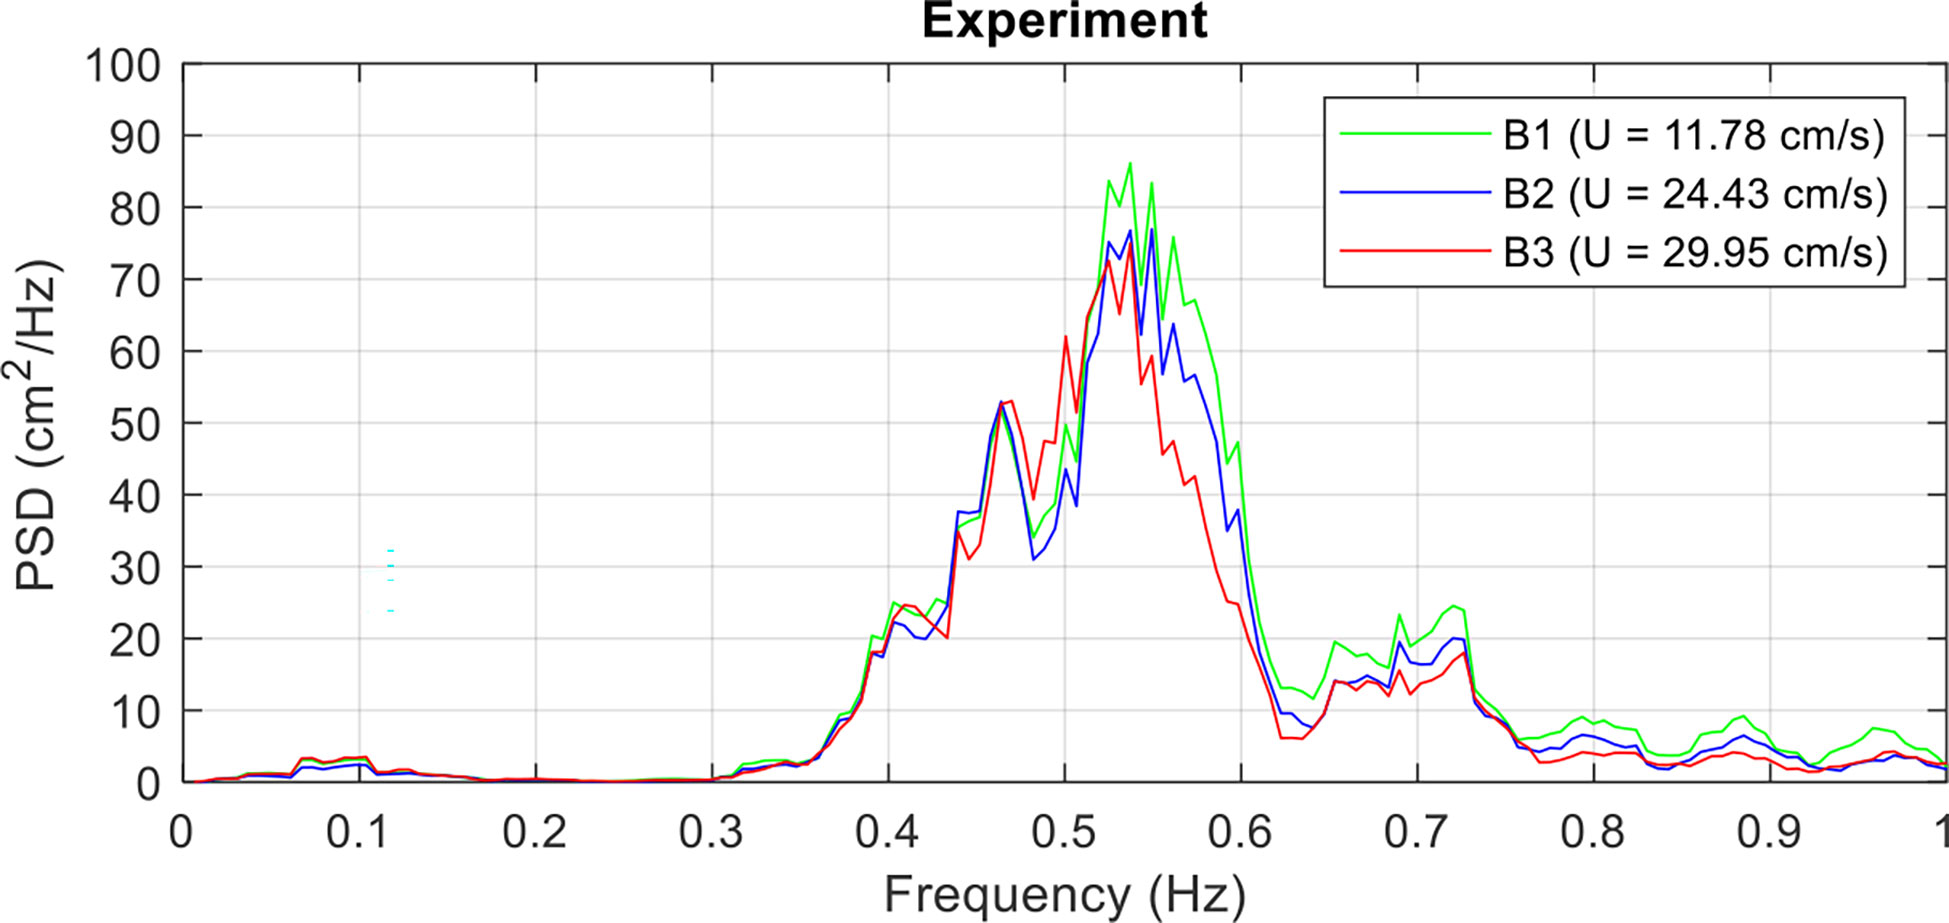
Figure 11 Power spectral density of the irregular waves with different coplanar current velocities.
5.2 Influence on the tension response
Figure 12 compares the experimental and numerical time series of the mooring forces for cases B1 to B3. The results indicated a significant increase in tension before and after the mooring line failure at 40 s with an increasing inflow velocity. However, the response was stronger in the numerical results, which may be due to the mooring lines being fully tightened in the numerical model. In Figure 13, the experimental and simulated maximum tension and standard deviation increased with the increasing inflow velocity. The numerical results were higher than the experimental ones. The difference decreased with the increasing inflow velocity.
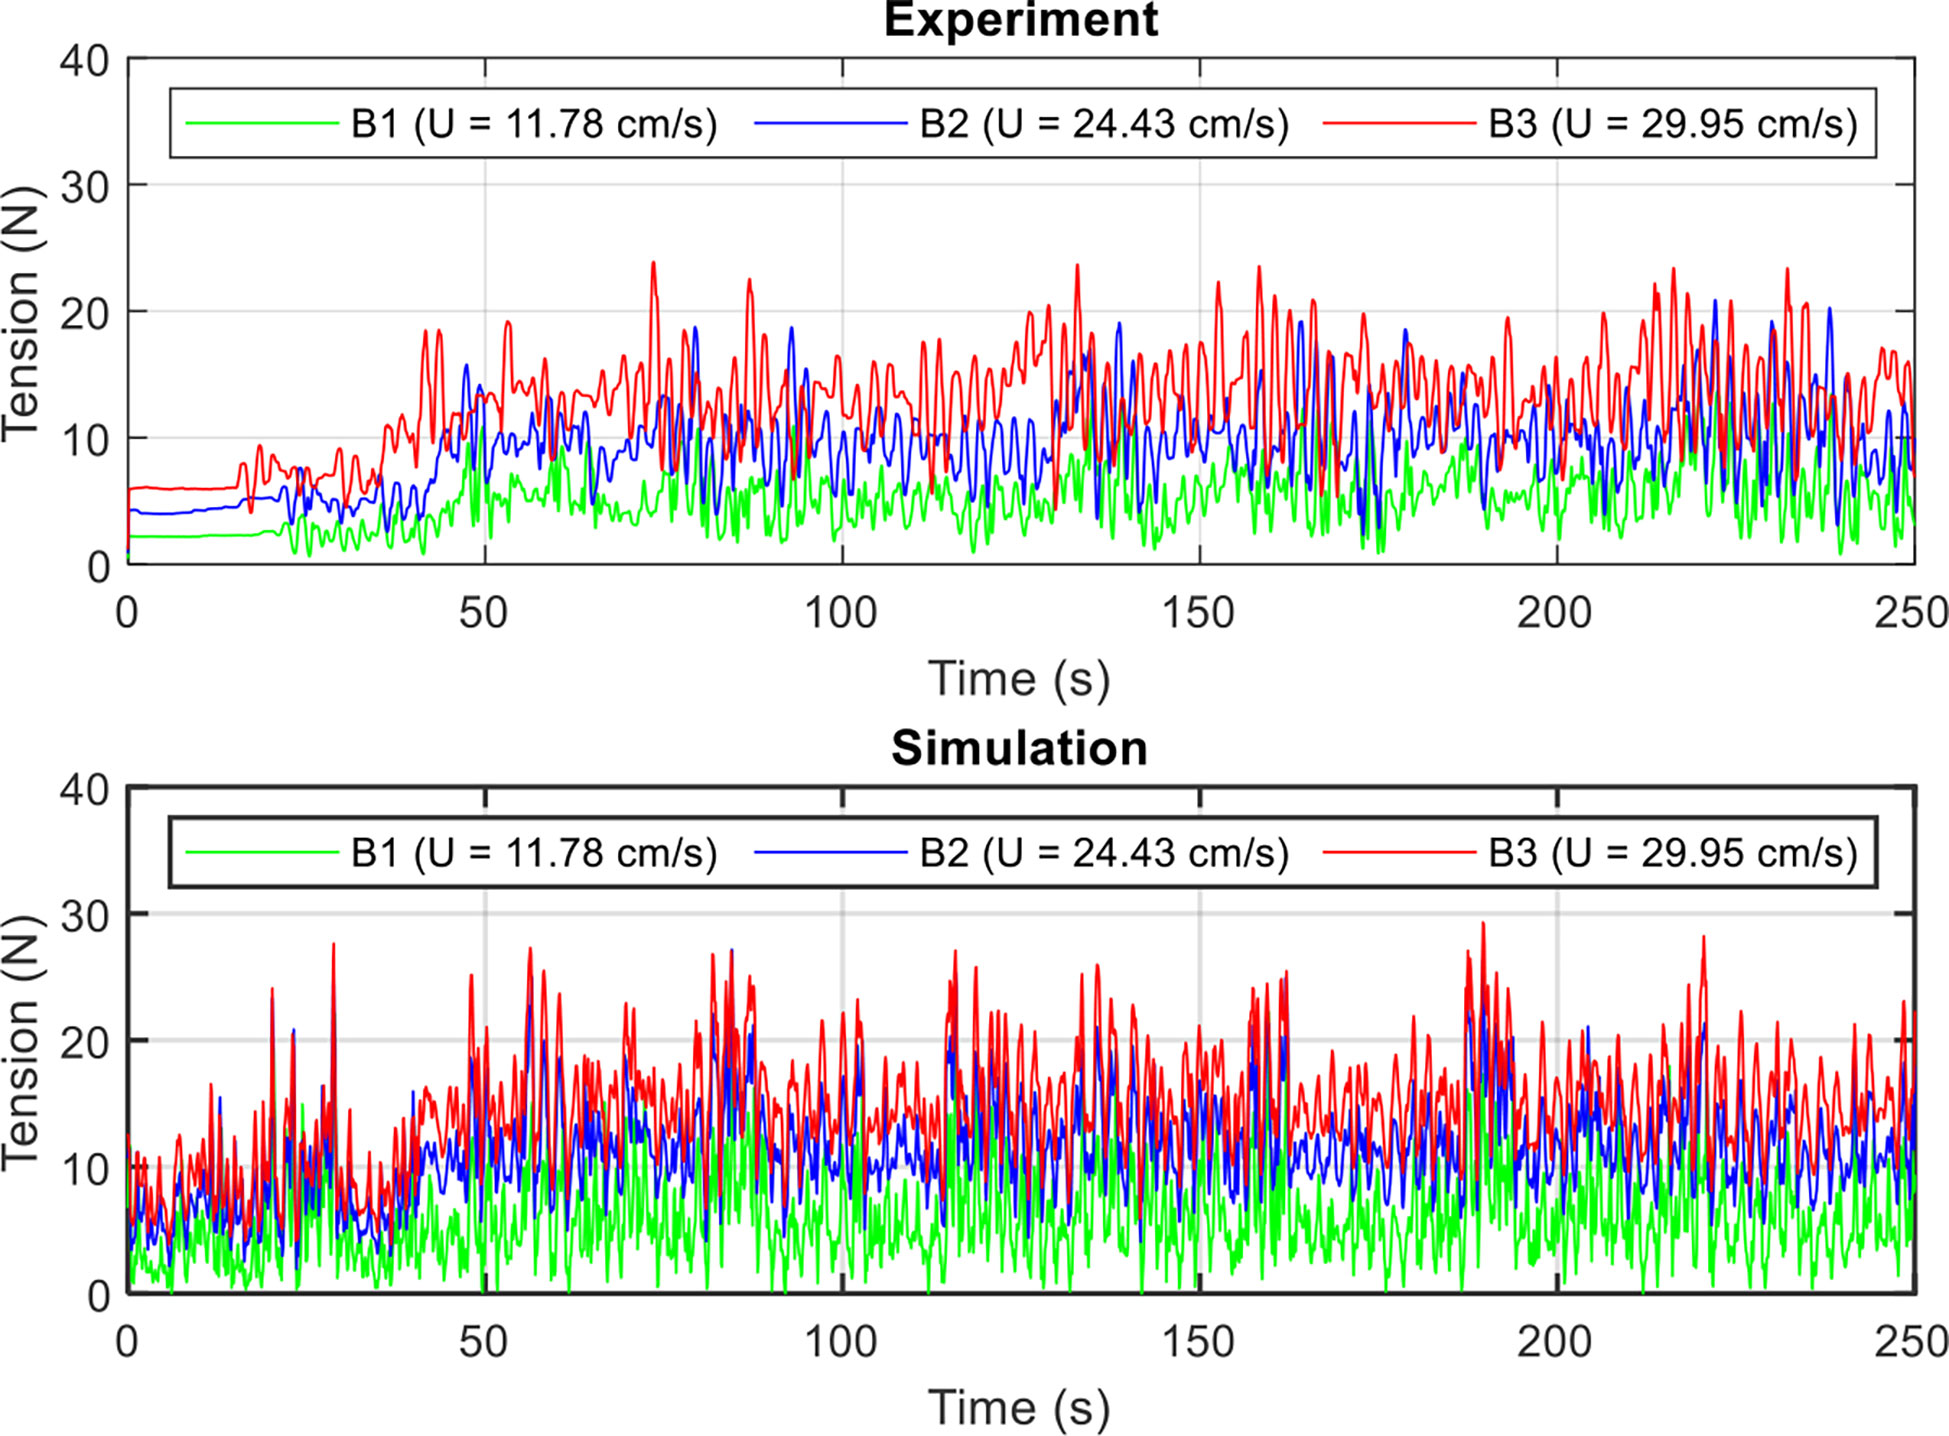
Figure 12 Influence of the current velocity on the time series mooring force under the mooring line failure of a net cage in irregular waves and currents.
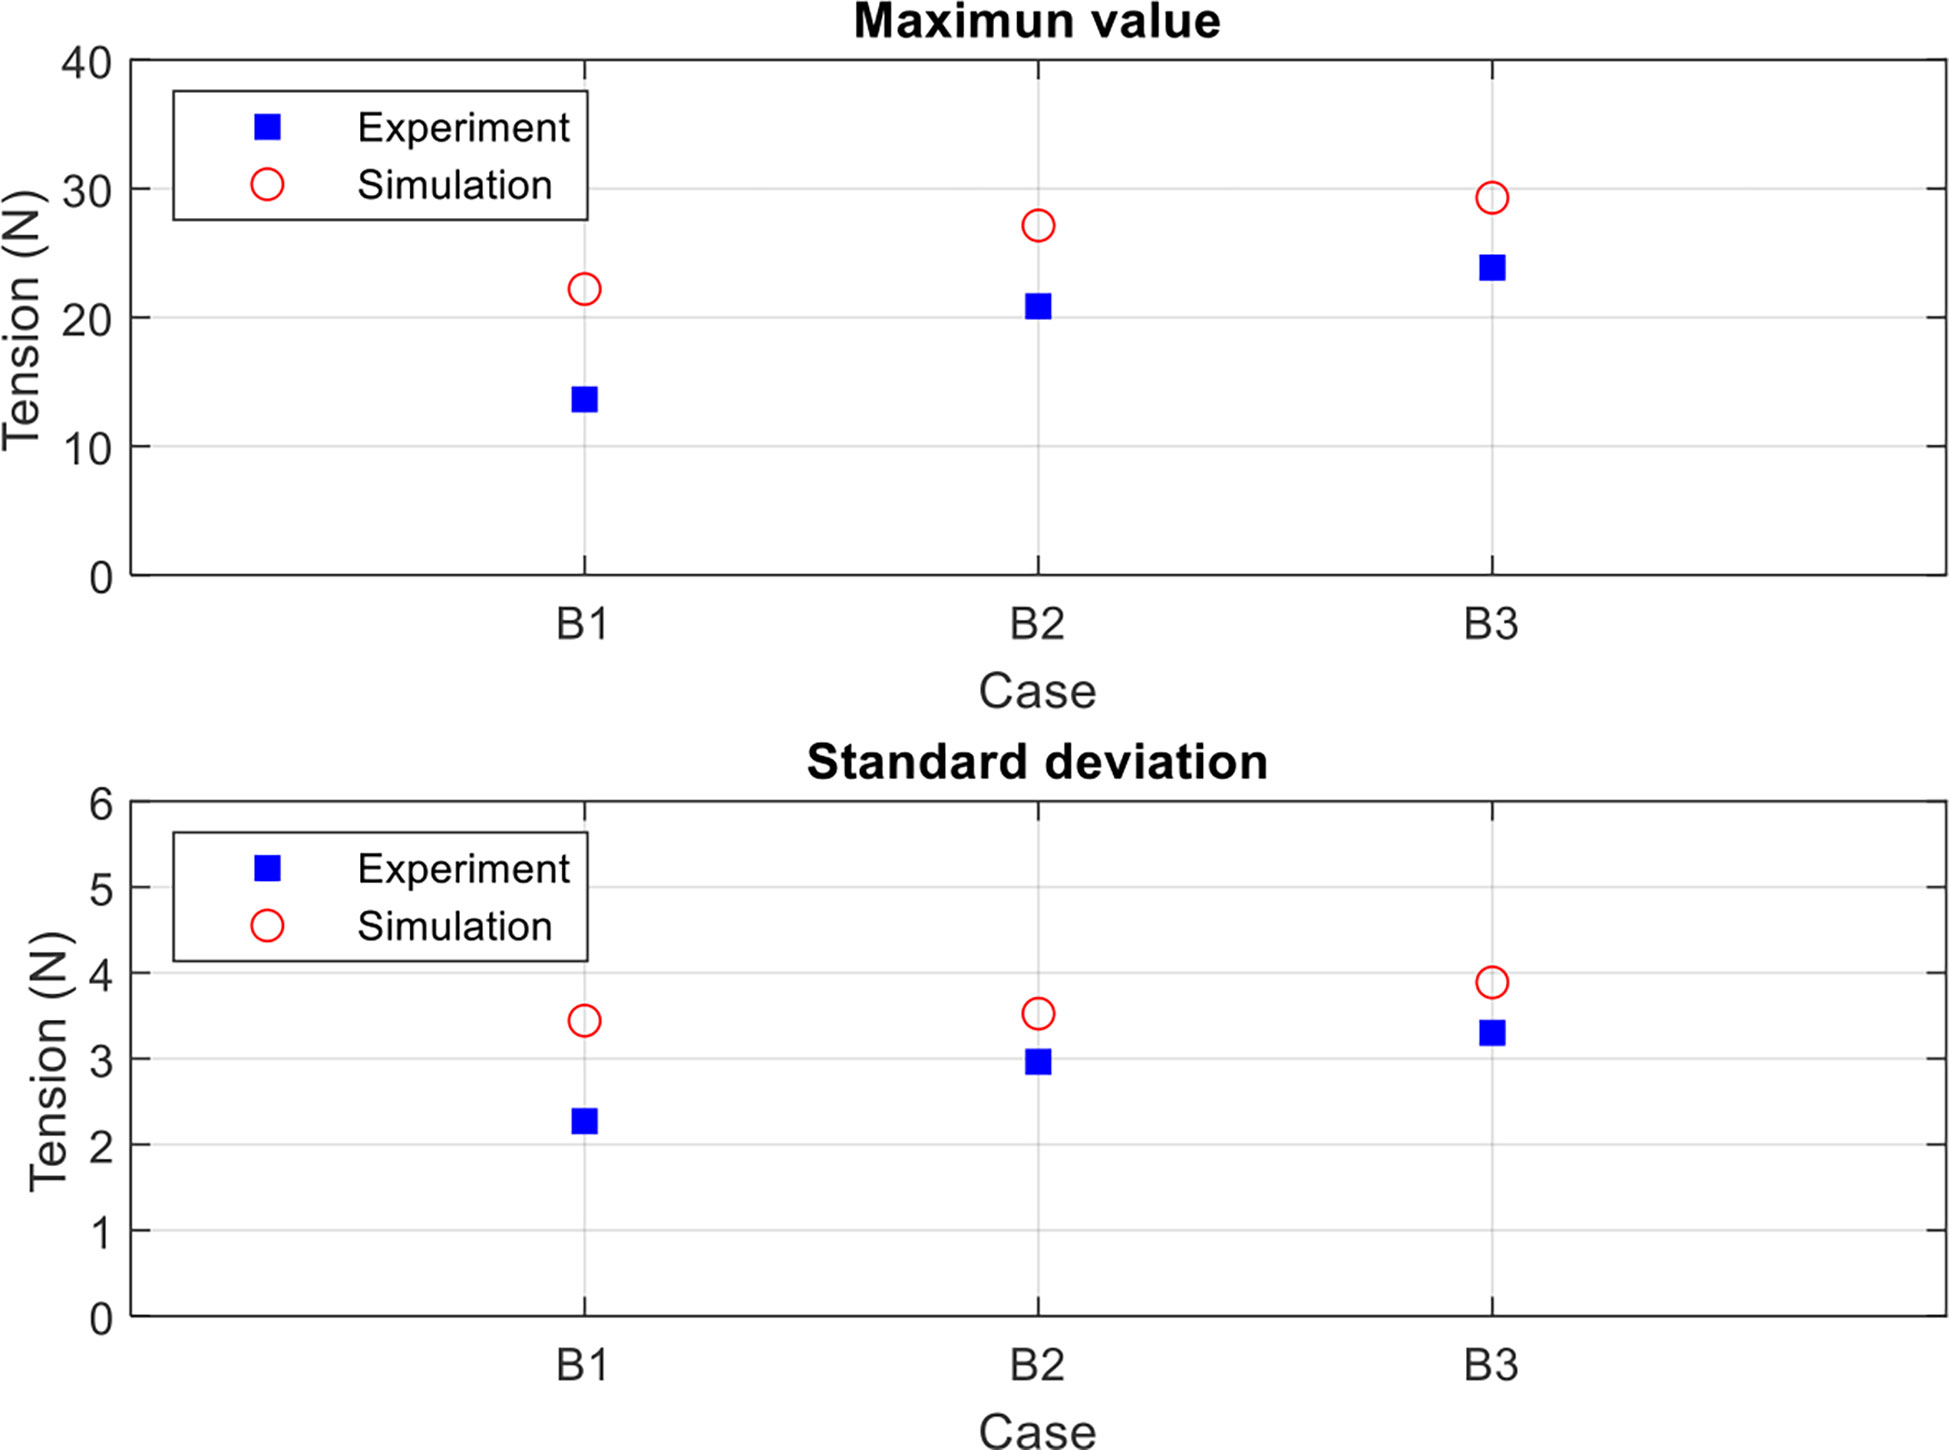
Figure 13 Influence of the current velocity on the maximum, mean, and minimum values and the standard deviations of the mooring force under the mooring line failure of a net cage in irregular waves and currents.
Figure 14 compares the effects of increasing the current velocity on the tension spectrum after the mooring line failure. Although the wave height was suppressed by increasing the current velocity (Table 3), the tension spectrum in the wave-frequency region can still be significantly increased. However, increasing the current velocity did not have an obvious effect in the low-frequency region. The comparison revealed that the numerical tension spectrum was not very smooth and showed some response in the high-frequency region, which may be due to the strong motion of the floating collar with tightened mooring lines.
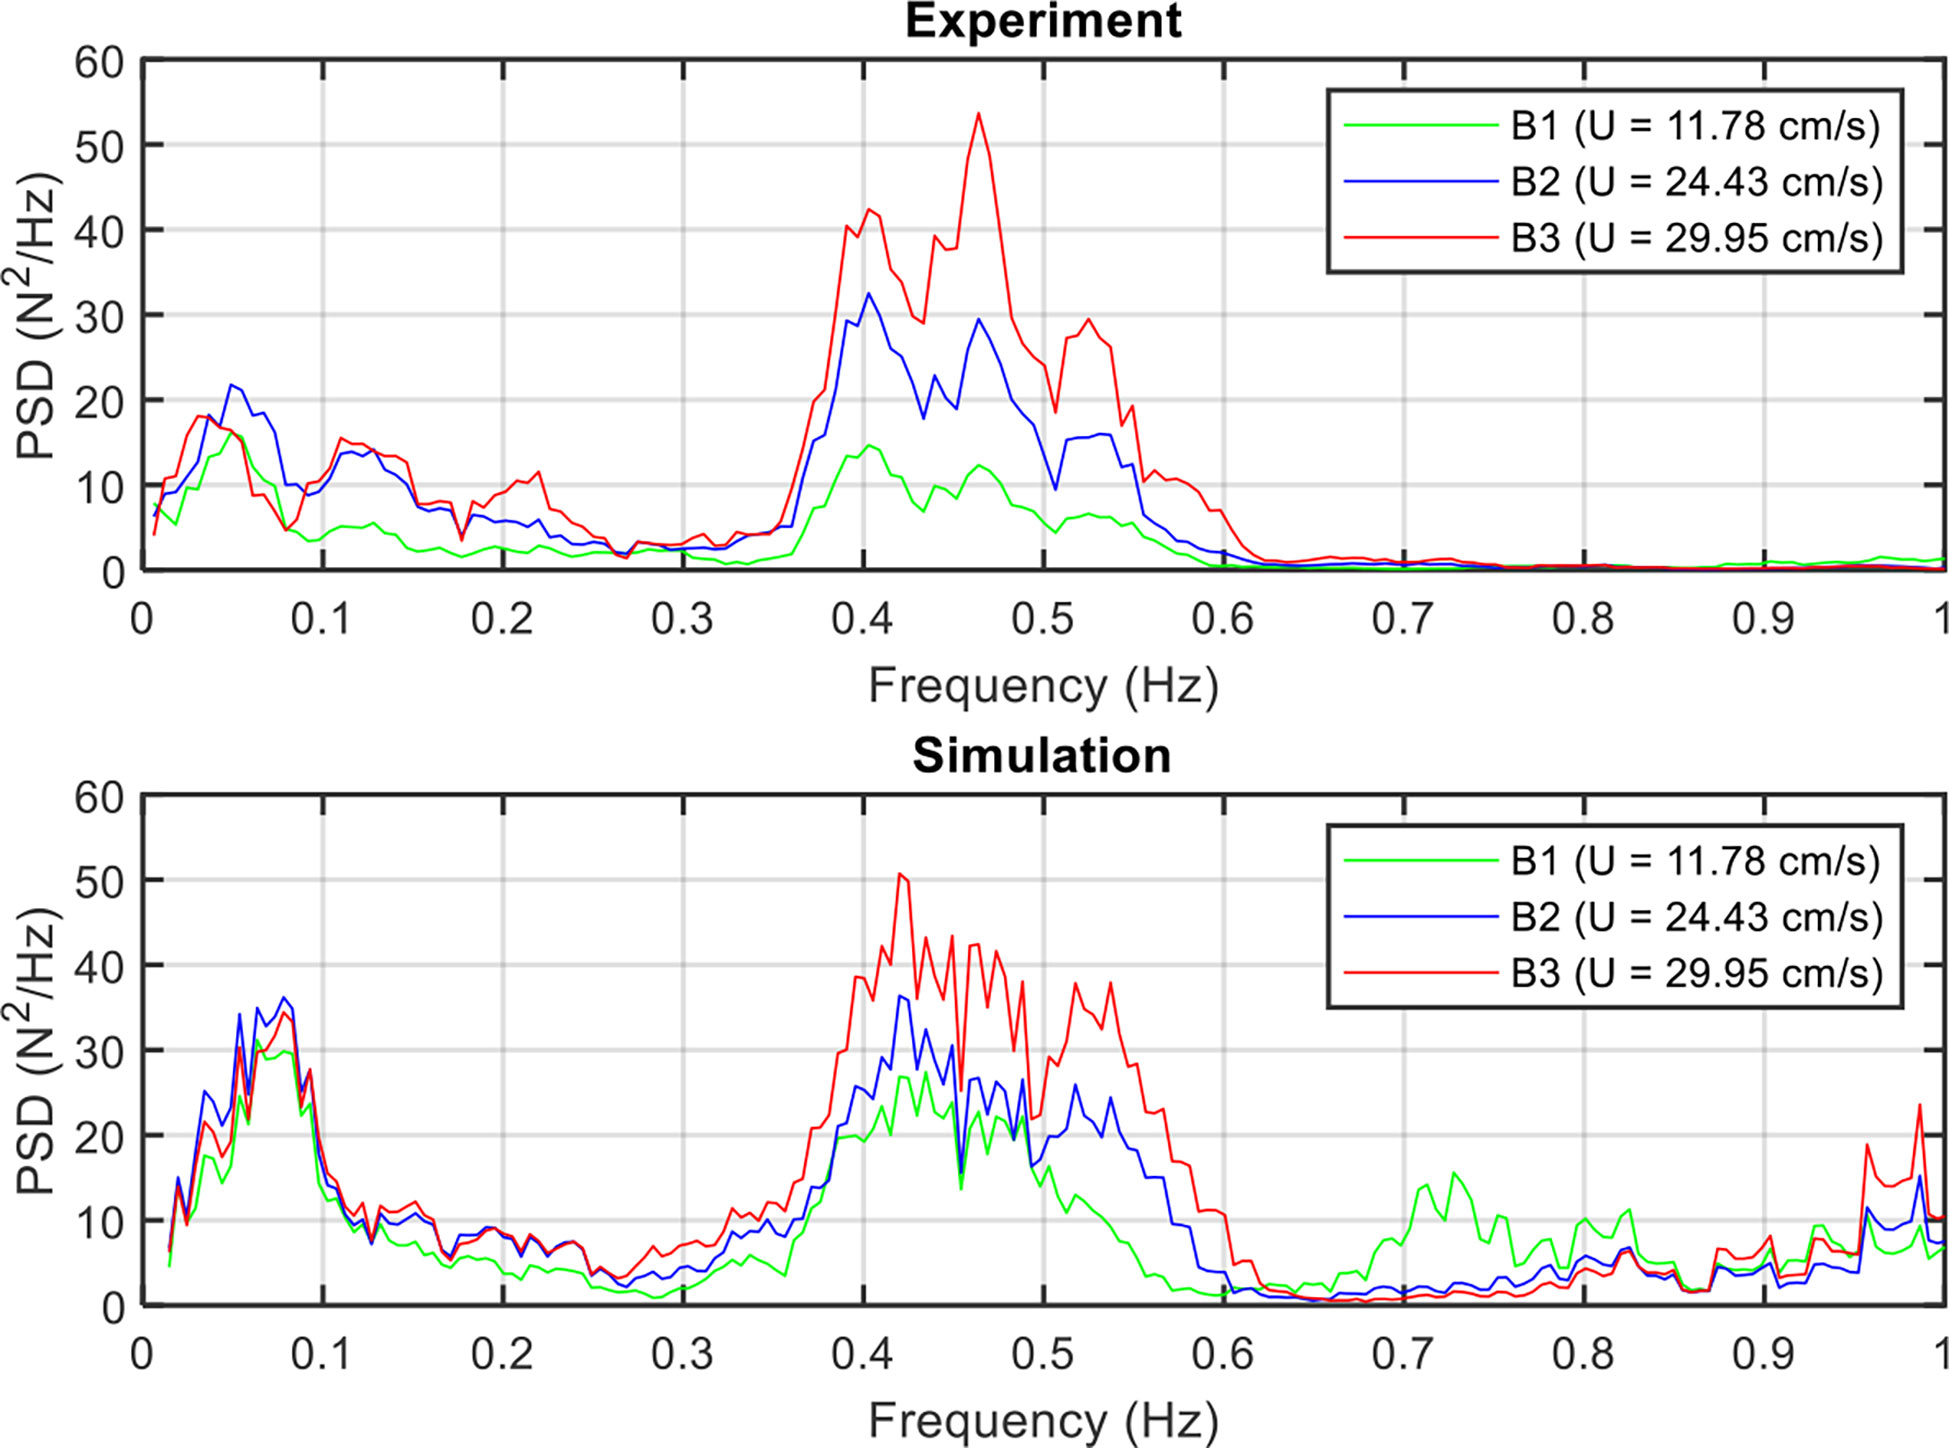
Figure 14 Influence of the current velocity on the power spectral density of the mooring force under the mooring line failure of a net cage in irregular waves and currents.
Figure 15 compares the effect of increasing the current velocity on the linear transfer function of tension after the mooring line failure. The tension spectrum was normalized by the wave spectrum; hence, the linear transfer function of tension showed a different trend than the tension spectrum. The comparison results illustrated similar trends between the experiment and simulation. The peak occurring in the resonant frequency region (0.2–0.3 Hz) increased as the velocity increased from U = 11.78 to U = 24.43 cm/s, but decreased as the velocity increased from U = 24.43 to U = 29.95 cm/s. This may be due to the increased rate of tension being slowed down when the velocity increased from U = 24.43 to U = 29.95 cm/s (Figure 13). After being normalized by the wave spectrum, the line transfer function of case B3 became lower than that of case B2.
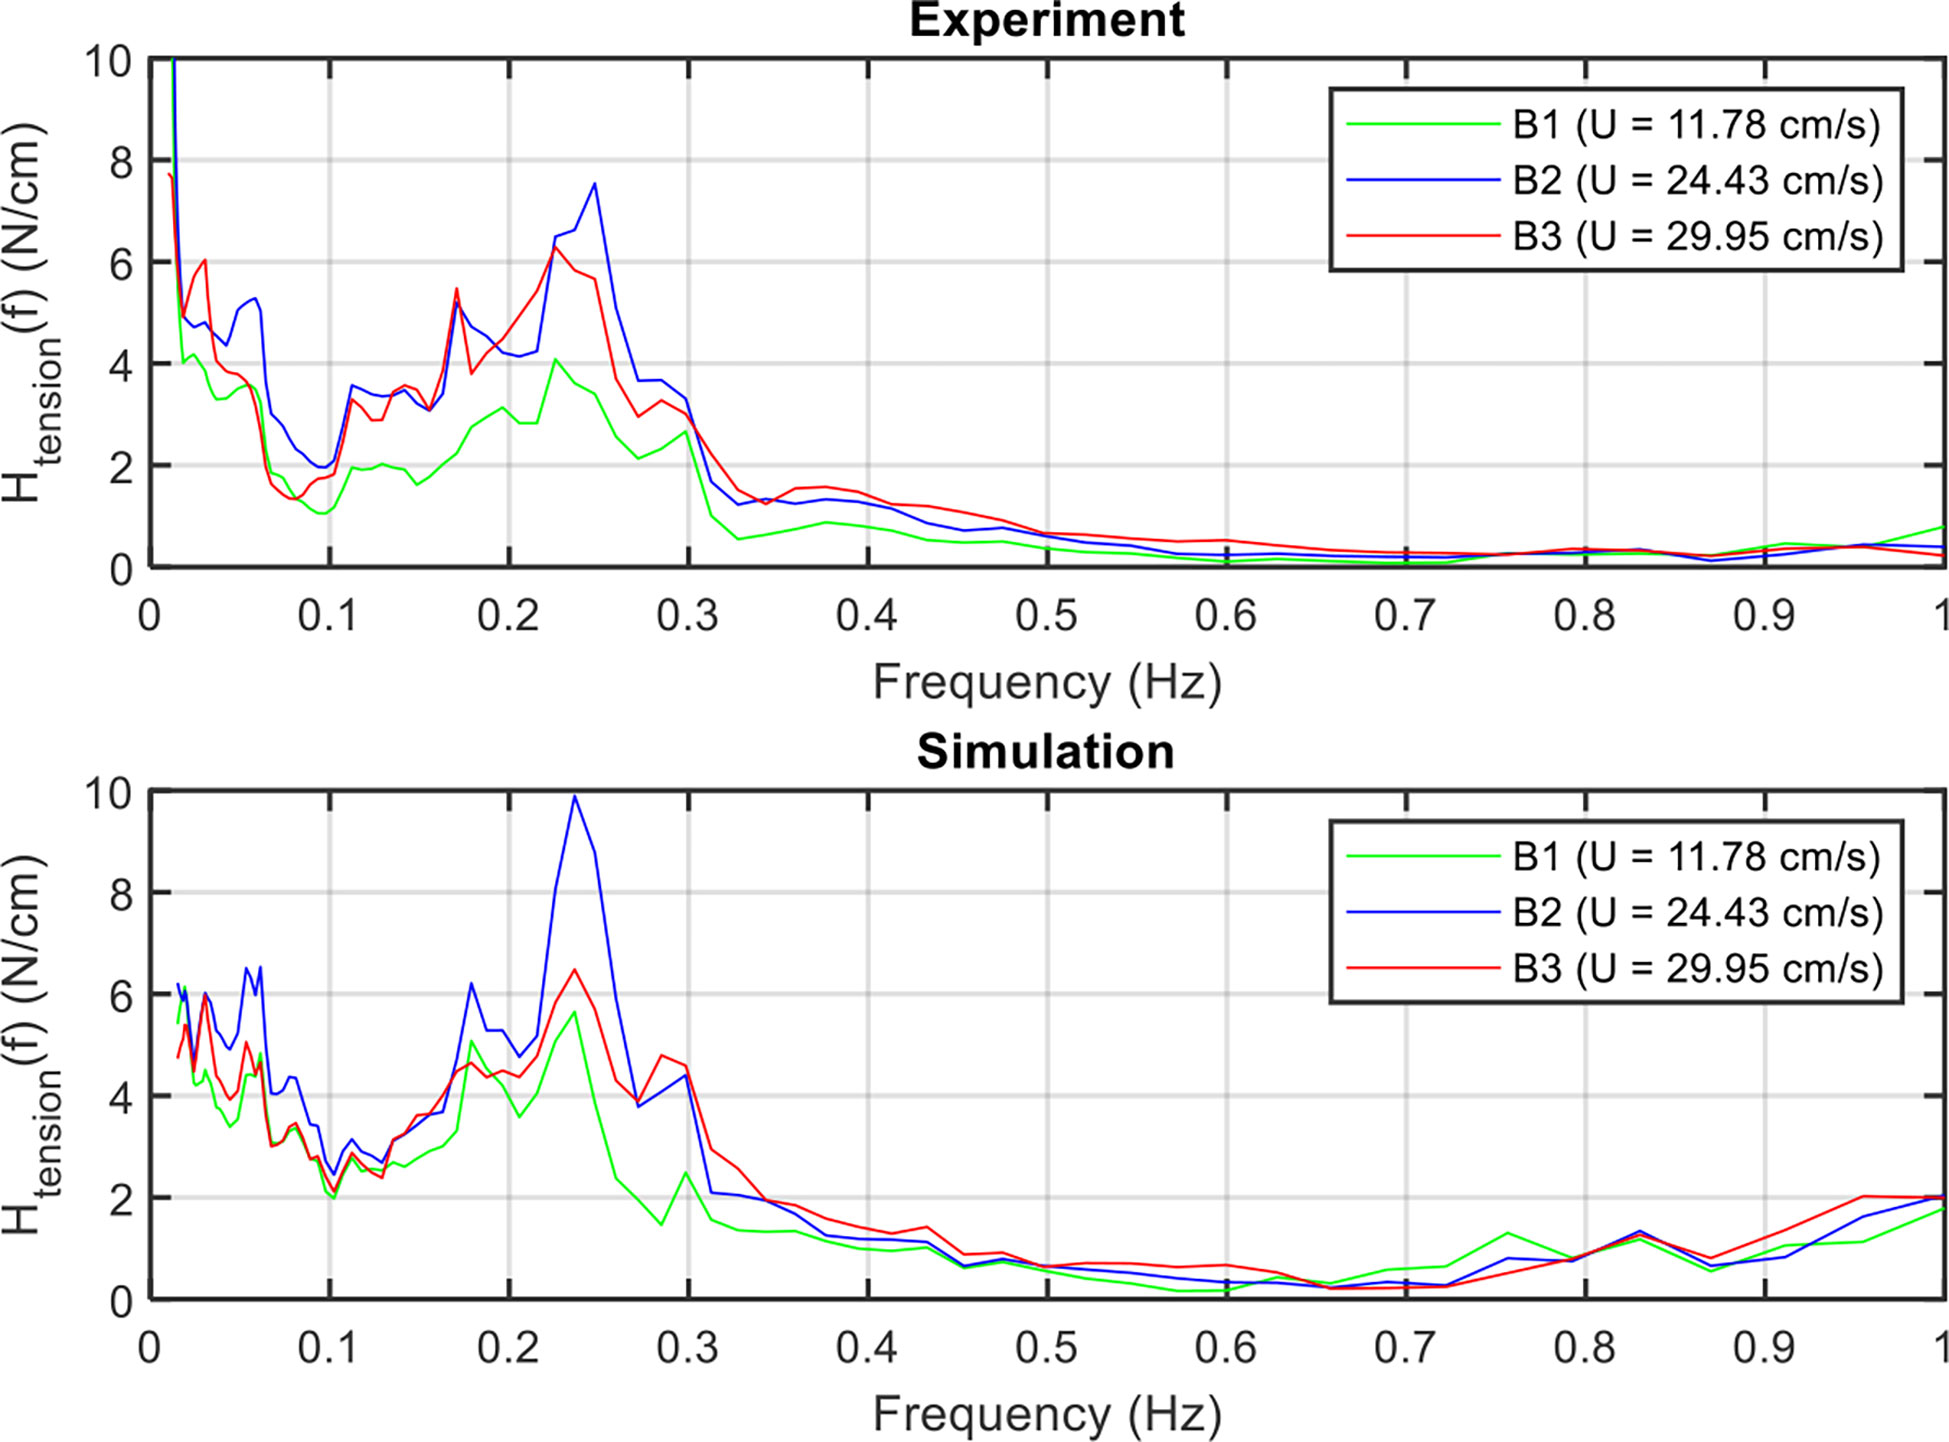
Figure 15 Influence of the current velocity on the linear transfer function of the mooring force under the mooring line failure of a net cage in irregular waves and currents.
5.3 Influence on the motion response
The influence of increasing the current velocity on the 6 DOF motion of the floating collar resulting from the mooring line failure was investigated through numerical simulations. Figure 16 compares the time series of the 6 DOF motion of the floating collar for cases B1 to B3. Prior to failure, the increased current velocity significantly affected the surge, heave, and pitch, but only slightly affected the sway, roll, and yaw because the waves and currents were symmetrical with respect to the cage’s mooring system. The mooring system becomes asymmetrical when a failure occurs, which can have significant effects on the sway, roll, and yaw. Consequently, the 6 DOF motion of the floating collar increased as the current velocity increased. Figure 17 compares the linear transfer function of the 6 DOF motion of the floating collar for cases B1 to B3. Results showed that the resonant frequency responses of the surge, sway, heave, roll, and yaw decreased as the current velocity increased. However, the pitch response increased from B1 to B2 and decreased from B2 to B3. The reason for this may be similar to that in Figure 15. Overall, the influence of increasing the current velocity can cause larger drift displacement and rotational angle, but a lower response amplitude.
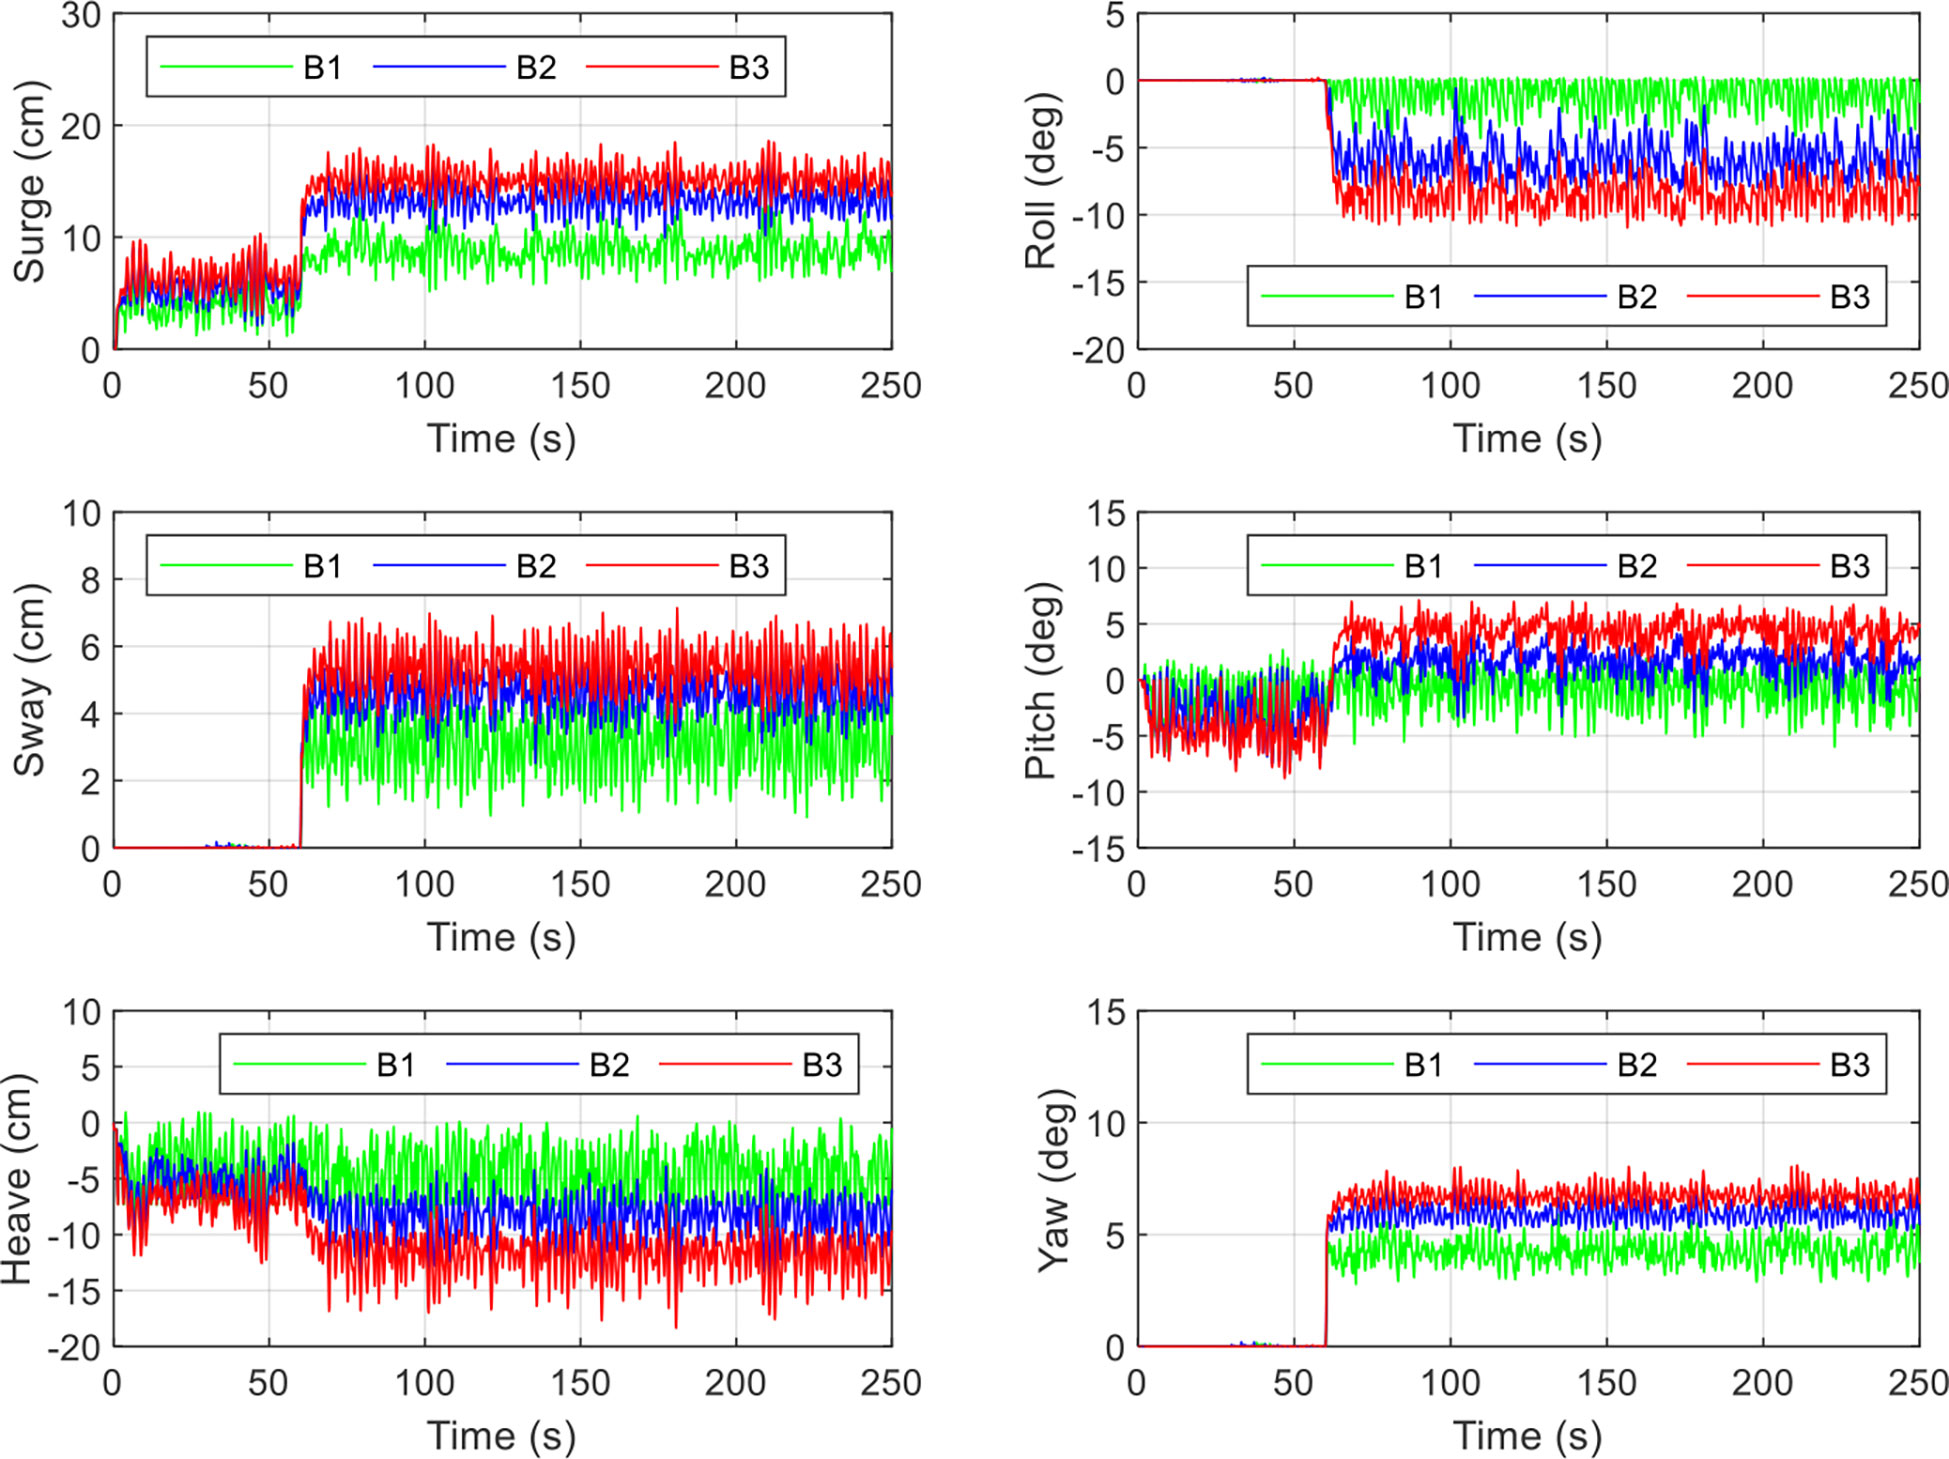
Figure 16 Influence of the current velocity on the time series 6 DOF motions of the floating collar under the mooring line failure of a net cage in irregular waves and currents (numerical simulation).
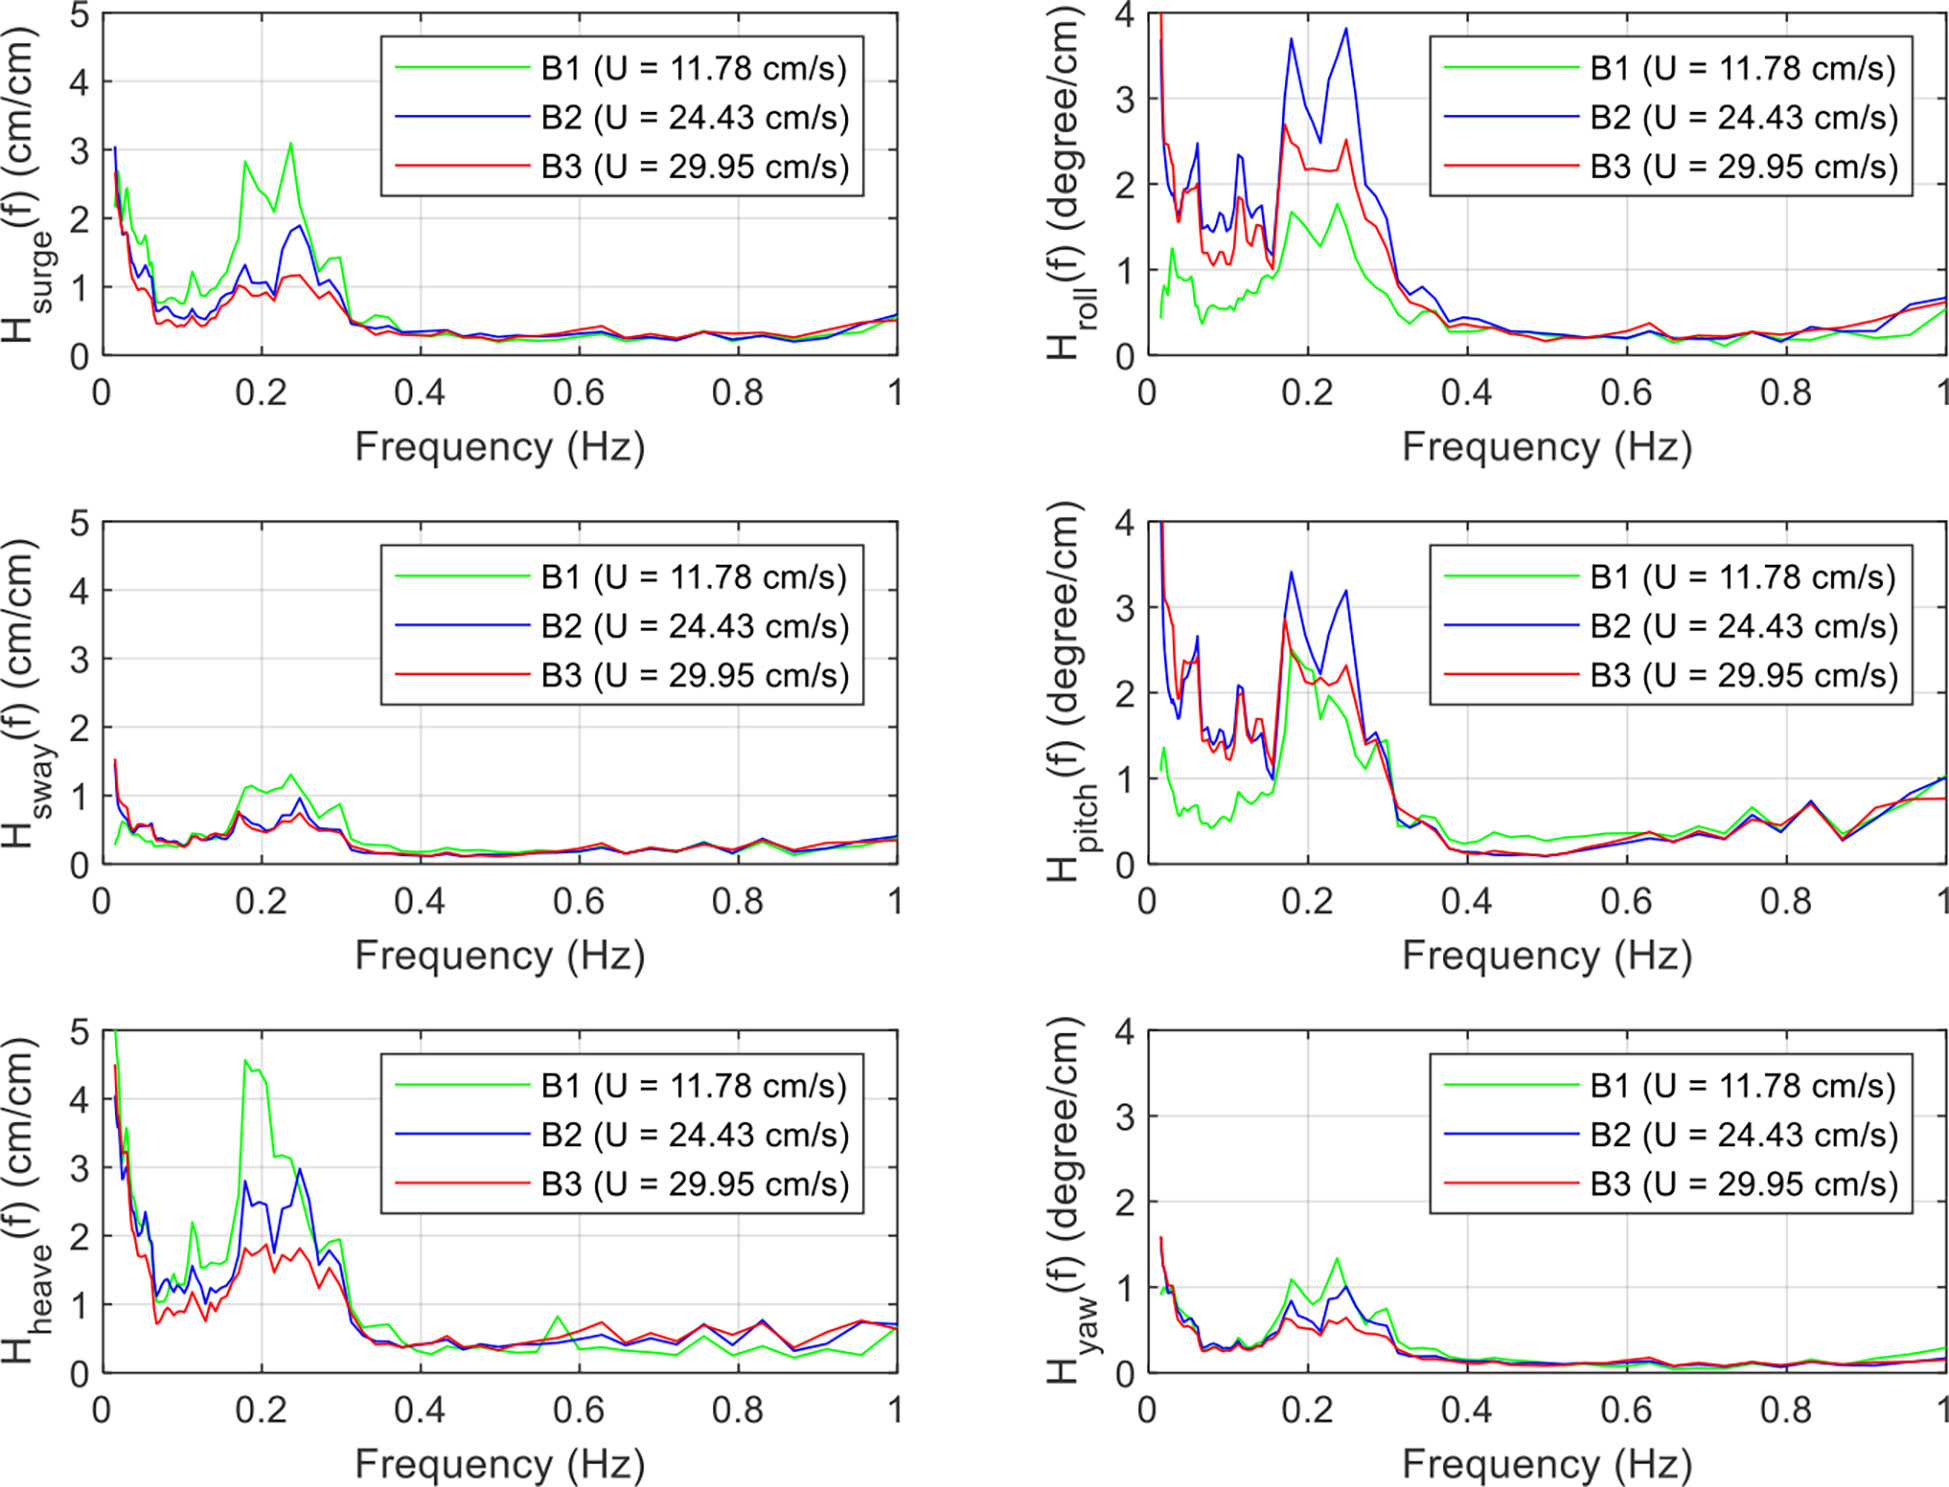
Figure 17 Influence of the current velocity on the linear transfer function of the 6 DOF motions of the floating collar under the mooring line failure of a net cage in irregular waves and currents (numerical simulation).
6 Conclusion
In this study, a net cage model was tested in a wave tank to study the effect of the mooring line failure on its dynamic response. A self-developed numerical model for the model test was used for cross-validation. Two cases of the mooring line failure for the net cage in irregular waves and currents were investigated. The first case involved a comparative study of the intact and failed cage moorings. Results showed that the mooring line failure leads to a higher mooring tension in the remaining line, a higher spectral response in the wave- and low-frequency regions, and a significant yaw motion of the floating collar. The second case showed the effect of increasing the current velocity on the mooring line failure. Increasing the velocity led to an increase in the mooring tension, drift displacement, and rotation angle.
However, the numerical model overestimated the mooring line tension, and the experimental and numerical results of the floating collar rotation motion were inconsistent. Therefore, future work is recommended to improve the mooring system symmetry for the model test and the numerical model accuracy by considering the wave–body interactions.
Data availability statement
The raw data supporting the conclusions of this article will be made available by the authors, without undue reservation.
Author contributions
H-JT: Conceptualization, methodology, software, validation, investigation, writing–review and editing, visualization, project administration, funding acquisition. H-CY: Conceptualization, methodology, validation, investigation. R-YY: Conceptualization, methodology, resources, writing–review and editing, supervision, project administration, funding acquisition. All authors contributed to the article and approved the submitted version.
Funding
This work was financially supported by the National Science and Technology Council of Taiwan, Project No. 109-2222-E-006-003-MY2 and 111-2218-E-019-001.
Conflict of interest
The authors declare that the research was conducted in the absence of any commercial or financial relationships that could be construed as a potential conflict of interest.
Publisher’s note
All claims expressed in this article are solely those of the authors and do not necessarily represent those of their affiliated organizations, or those of the publisher, the editors and the reviewers. Any product that may be evaluated in this article, or claim that may be made by its manufacturer, is not guaranteed or endorsed by the publisher.
References
Cheng H., Li L., Ong M. C., Aarsæther K. G., Sim J. (2021). Effects of mooring line breakage on dynamic responses of grid moored fish farms under pure current conditions. Ocean Eng. 237, 109638. doi: 10.1016/j.oceaneng.2021.109638
DeCew J., Fredriksson D. W., Bougrov L., Swift M. R., Eroshkin O. and Celikkol B. (2005). A case study of a modified gravity type cage and mooring system using numerical and physical models. IEEE J. Oceanic Eng. 30 (1), 47–58. doi: 10.1109/JOE.2004.841400
Dong G. H., Xu T. J., Zhao Y. P., Li Y. C., Gui F. K. (2010). Numerical simulation of hydrodynamic behavior of gravity cage in irregular waves. Aquacultural Eng. 42, 90–101. doi: 10.1016/j.aquaeng.2009.12.004
FAO (2022). The state of world fisheries and aquaculture 2022 – towards blue transformation (Rome, Italy: Food and Agriculture Organization of the United Nations).
Fredriksson D. W., Swift M. R., Eroshkin O., Tsukrov I., Irish J. D., Celikkol B. (2005). Moored fish cage dynamics in waves and currents. IEEE J. Oceanic Eng. 30 (1), 28–36. doi: 10.1109/JOE.2004.841412
Fredriksson D. W., Swift M. R., Irish J. D., Tsukrov I., Celikkol B. (2003). Fish cage and mooring system dynamics using physical and numerical models with field measurements. Aquacultural Eng. 27, 117–146. doi: 10.1016/S0144-8609(02)00043-2
Guo Y. C., Mohapatra S. C., Guedes Soares C. (2020). Review of developments in porous membranes and net-type structures for breakwaters and fish cages. Ocean Eng. 200, 107027. doi: 10.1016/j.oceaneng.2020.107027
Hou H. M., Liu Y., Dong G. H., Xu T. J. (2022). Reliability assessment of mooring system for fish cage considering one damaged mooring line. Ocean Eng. 257, 111626. doi: 10.1016/j.oceaneng.2022.111626
Hsu T. W., Hsiao S. C., Ou S. H., Wang S. K., Yang B. D., Chou S. E. (2007). An application of boussinesq equations to Bragg reflection of irregular waves. Ocean Eng. 34, 870–883. doi: 10.1016/j.oceaneng.2006.02.005
Huang C. C., Tang H. J., Liu J. Y. (2006). Dynamical analysis of net cage structures for marine aquaculture: Numerical simulation and model testing. Aquacultural Eng. 35 (3), 258–270. doi: 10.1016/j.aquaeng.2006.03.003
Huang C. C., Tang H. J., Liu J. Y. (2007). Modeling volume deformation in gravity-type cages with distributed bottom weights or a rigid tube-sinker. Aquacultural Eng. 37 (2), 144–157. doi: 10.1016/j.aquaeng.2007.04.003
Huang C. C., Tang H. J., Wang B. S. (2010). Numerical modeling for an in situ single-point-mooring cage system. IEEE J. Oceanic Eng. 35 (3), 565–573. doi: 10.1109/JOE.2010.2050351
Kristiansen T., Faltinsen O. M. (2012). Modelling of current loads on aquaculture net cages. J. Fluids Structures 34, 218–235. doi: 10.1016/j.jfluidstructs.2012.04.001
Kristiansen T., Faltinsen O. M. (2015). Experimental and numerical study of an aquaculture net cage with floater in waves and current. J. Fluids Structures 54, 1–26. doi: 10.1016/j.jfluidstructs.2014.08.015
Løland G. (1991). Current forces on and flow through fish farms. Doctoral Thesis. (Trondheim, Norway: The Norwegian Institute of Technology).
Moe-Føre H., Lader P. F., Lien E., Hopperstad O. S. (2016). Structural response of high solidity net cage models in uniform flow. J. Fluids Structures 65, 180–195. doi: 10.1016/j.jfluidstructs.2016.05.013
Pecher A., Kofoed J. P. (2017). “Handbook of ocean wave energy,” in Ocean engineering & oceanography (Springer), 7, 67–68. doi: 10.1007/978-3-319-39889-1
Ryu S., Kim M. H., Lynett P. J. (2003). Fully nonlinear wave-current interactions and kinematics by a BEM-based numerical tank. Comput. Mechanics 32, 336–346. doi: 10.1007/s00466-003-0491-7
Tang H. J., Chiang W. S., Nan F. H. (2022a). Engineering feasibility assessment of cage aquaculture in offshore wind power generation areas in Taiwan. Sustainability 14 (18), 11705. doi: 10.3390/su141811705
Tang H. J., Yang R. Y., Yao H. C. (2021). Experimental and numerical investigations of a mooring line failure of an aquaculture net cage subjected to currents. Ocean Eng. 238, 109707. doi: 10.1016/j.oceaneng.2021.109707
Tang H. J., Yao H. C., Yang R. Y. (2022b). Experimental and numerical studies on successive failures of two mooring. Ocean Eng. 266, 113243. doi: 10.1016/j.oceaneng.2022.113243
Tang H. J., Yeh P. H., Huang C. C., Yang R. Y. (2020). Numerical study of the mooring system failure of aquaculture net cages under irregular waves and current. Ocean Eng. 216, 108110. doi: 10.1016/j.oceaneng.2020.108110
Thomas G. P. (1981). Wave-current interaction: An experimental and numerical study. part 1. linear waves. J. Fluid Mechanics 110, 457–474. doi: 10.1017/S0022112081000839
Tsukrov I., Eroshkin O., Fredriksson D., Swift M. R., Celikkol B. (2003). Finite element modeling of net panels using a consistent net element. Ocean Eng. 30 (2), 251–270. doi: 10.1016/S0029-8018(02)00021-5
Xu Z., Qin H. (2020). Fluid-structure interactions of cage based aquaculture: From structures to organisms. Ocean Eng. 217, 107961. doi: 10.1016/j.oceaneng.2020.107961
Yang R. Y., Tang H. J., Huang C. C. (2020). Numerical modeling of the mooring system failure of an aquaculture net cage system under waves and currents. IEEE J. Oceanic Eng. 45 (4), 1396–1410. doi: 10.1109/JOE.2019.2941768
Keywords: mooring line failure, net cage, irregular waves, flume experiment, numerical simulation
Citation: Tang H-J, Yang R-Y and Yao H-C (2023) Experimental and numerical study on the hydrodynamic behaviors of mooring line failure on a net cage in irregular waves and currents. Front. Mar. Sci. 10:1122855. doi: 10.3389/fmars.2023.1122855
Received: 13 December 2022; Accepted: 30 January 2023;
Published: 13 February 2023.
Edited by:
Zhao Yunpeng, Dalian University of Technology, ChinaReviewed by:
Peng Li, Harbin Engineering University, ChinaShuxue Liu, Dalian University of Technology, China
Copyright © 2023 Tang, Yang and Yao. This is an open-access article distributed under the terms of the Creative Commons Attribution License (CC BY). The use, distribution or reproduction in other forums is permitted, provided the original author(s) and the copyright owner(s) are credited and that the original publication in this journal is cited, in accordance with accepted academic practice. No use, distribution or reproduction is permitted which does not comply with these terms.
*Correspondence: Hung-Jie Tang, aGp0YW5nQHRobC5uY2t1LmVkdS50dw==