 Fahui Gong1,2
 Yafeng Zhang3
 Wei Xie1,2
 Xiuqin Wu1,2
 Han Zhang4Suixuan Huang1,2
 Jun Gong1,2*
 Kedong Yin1,2*
- 1School of Marine Sciences, Sun Yat-Sen University & Southern Marine Science and Engineering Guangdong Laboratory (Zhuhai), Zhuhai, China
- 2Guangdong Provincial Key Laboratory of Marine Resources and Coastal Engineering, Zhuhai, China
- 3Eco-Environmental Monitoring and Research Center, Pearl River Valley and South China Sea Ecology and Environment Administration, Ministry of Ecology and Environment of the People’s Republic of China, Guangzhou, Guangdong, China
- 4Dongguan Maternal and Child Health Care Hospital, Postdoctoral Innovation Practice Base of Southern Medical University, Dongguan, China
In oligotrophic seas such as South China Sea, the subsurface or deep chlorophyll maximum (DCM) is always present. The surface planktonic community receives sufficient light, but is short of nutrients. The DCM layer is under light limitation, but frequent supply of nutrients. Therefore, vertical mixing becomes critical in determining their community composition and drives their changes by responding to light and nutrients. In this study, we conducted an onboard experiment by collecting seawater samples at surface and the DCM layer and adding nutrients, and incubated them under full sunlight and 10% light, and examined the diversity of bacterial and eukaryotic communities and their cell abundance using 16/18S high throughput sequencing and FCM approaches. Our study found large differences in bacterial and eukaryotic community structure and cell abundance between the surface and DCM. After 72 hours of culture, taxonomically the incubated surface water was dominated by pico-eukaryotic phytoplankton, while the incubated DCM layer water is dominated by diatoms, which suggests diatoms are the main functional group of phytoplankton bloom after a vertical mixing event. These findings indicate that phytoplankton at the DCM respond to enhanced light and frequent supplied nutrients due to vertical mixing and thus maintain primary productivity in the otherwise oligotrophic oceans.
1 Introduction
Marine microbial organisms play important functions in marine ecosystems and influence the biogeochemical recycling of carbon and nutrients (York, 2018). Pico- and nano-planktons (cell size 0.22-20 µm) are the most abundant component of plankton community and largely contribute to total microbial plankton biomass in open oceanic waters (Espinoza-González et al., 2012). Due to their small size and conspicuous morphology, their diversity started to be explored as a result of the wide application of molecular methods, especially the high throughput sequencing (López-García et al., 2003; de Vargas et al., 2015), which allows to examine their community structure and spatial-temporal distribution patterns in various marine environments including estuaries (Piwosz et al., 2018; Varkey et al., 2018), coastal waters (Hu et al., 2016; Gran-Stadniczeñko et al., 2019; Ramond et al., 2019), upwelling systems (Hernández-Ruiz et al., 2018; Gong et al., 2020; Gong et al., 2022), deep sea and the polar regions (Metfies et al., 2016; Clarke et al., 2019).
In oligotrophic seas, the planktonic community receives sufficient light at surface, but is short of nutrient supply. The subsurface (e.g., DCM) layer is under light limitation, but receives frequent supply of nutrients. This makes the abundance and community structure of plankton significantly different in the two layers (Casey et al., 2013; Giner et al., 2020). Moreover, pulsed supply of nutrients and elevated light penetration into the upper ocean are associated with vertical mixing caused by typhoons/internal waves and can significantly change microbial biomass, species composition and community succession (e.g., Chung et al., 2012). For instance, the measurements of Chl a during the Pabuk and Sepat typhoon events Morakot in the Northeast of Taiwan and in the Philippine Sea showed enhancements of up to 5.6–12 times compared with those before typhoon passage due to nutrients supply (Huisman et al., 2006; Chen et al., 2009b). In Lake Ammer, internal wave motions caused vertical displacement and community structure of phytoplankton (Hingsamer et al., 2014). Yet, few studies have comparatively investigated the microbial dynamics and more importantly their succession after the surface and subsurface waters mixing caused by physical dynamics, as the surface microbes receives sufficient nutrient supply and the subsurface microbes receives sufficient light, as it is very difficult to observe.
The South China Sea is a tropical-subtropical oligotrophic area with sufficient sunlight and stable stratified water structure (Wong et al., 2007). This area is characterized by complex physical and biological dynamics, strong seasonality and regional structuring of biophysical processes (Liu et al., 2002; Nan et al., 2015). The surface ocean currents are mainly driven by monsoons and changes in seasons. In winter, currents flow northeast to southwest, but summer currents flow in the opposite direction. The seawater circulates cyclonically in winter but anticyclonically in summer (Deng and Zhao, 2020). Meanwhile, the Kuroshio Current carries the northwestern Pacific water flows northward along the east Philippine coast. When it reaches the Luzon Strait, the Kuroshio branch water can deeply intrude into the SCS, especially in winter (Liang et al., 2008; Nan et al., 2015; Wu et al., 2017). Although strong stratification leads to nutrient limitation of phytoplankton growth in the surface waters, a large of algal blooms have been reported after the physical events such as typhoon or internal wave in these area (Chen et al., 2009b; Bauer and Waniek, 2013). In this study, we conducted an onboard experiment by collecting seawater samples at surface and the DCM layer, adding nutrients, and incubated them under full sunlight or 10% light, then we investigated the bacterial and eukaryotic community diversity and their cell abundance using 16/18S high throughput sequencing and FCM approaches. Our aims are to examine the responses and their succession of the microbial community to the episodic input of nutrients and light. This is of great help to the understanding of the responses of microbial populations to vertical mixing and help us to better predict the biological response to the physical mixing in future climate change.
2 Materials and methods
2.1 Study area and sampling
During a research cruise in the period of 6–12 March 2018, the station B6 (117.59°N, 21.89°E) was investigated. The study station (B6) was well stratified and located to the south of Taiwan Strait in the South China Sea (Figure 1). The region is influenced by the Zhejiang-Fujian Coastal Current, the South China Sea Warm Current and the intruding Kuroshio. At the station, CTD SBE911 with the rosette bottle samplers was deployed to read the vertical profile of environmental data including salinity, temperature, pH, concentrations of dissolved oxygen (DO), and in vivo fluorescence chlorophyll. The depth of the DCM layer was determined and sampled according to the vertical distribution of the fluorescence (Figure 2A). We collected water samples from the surface (1 m) and DCM layer (50 m) water and conducted incubation experiments on board of the ship.
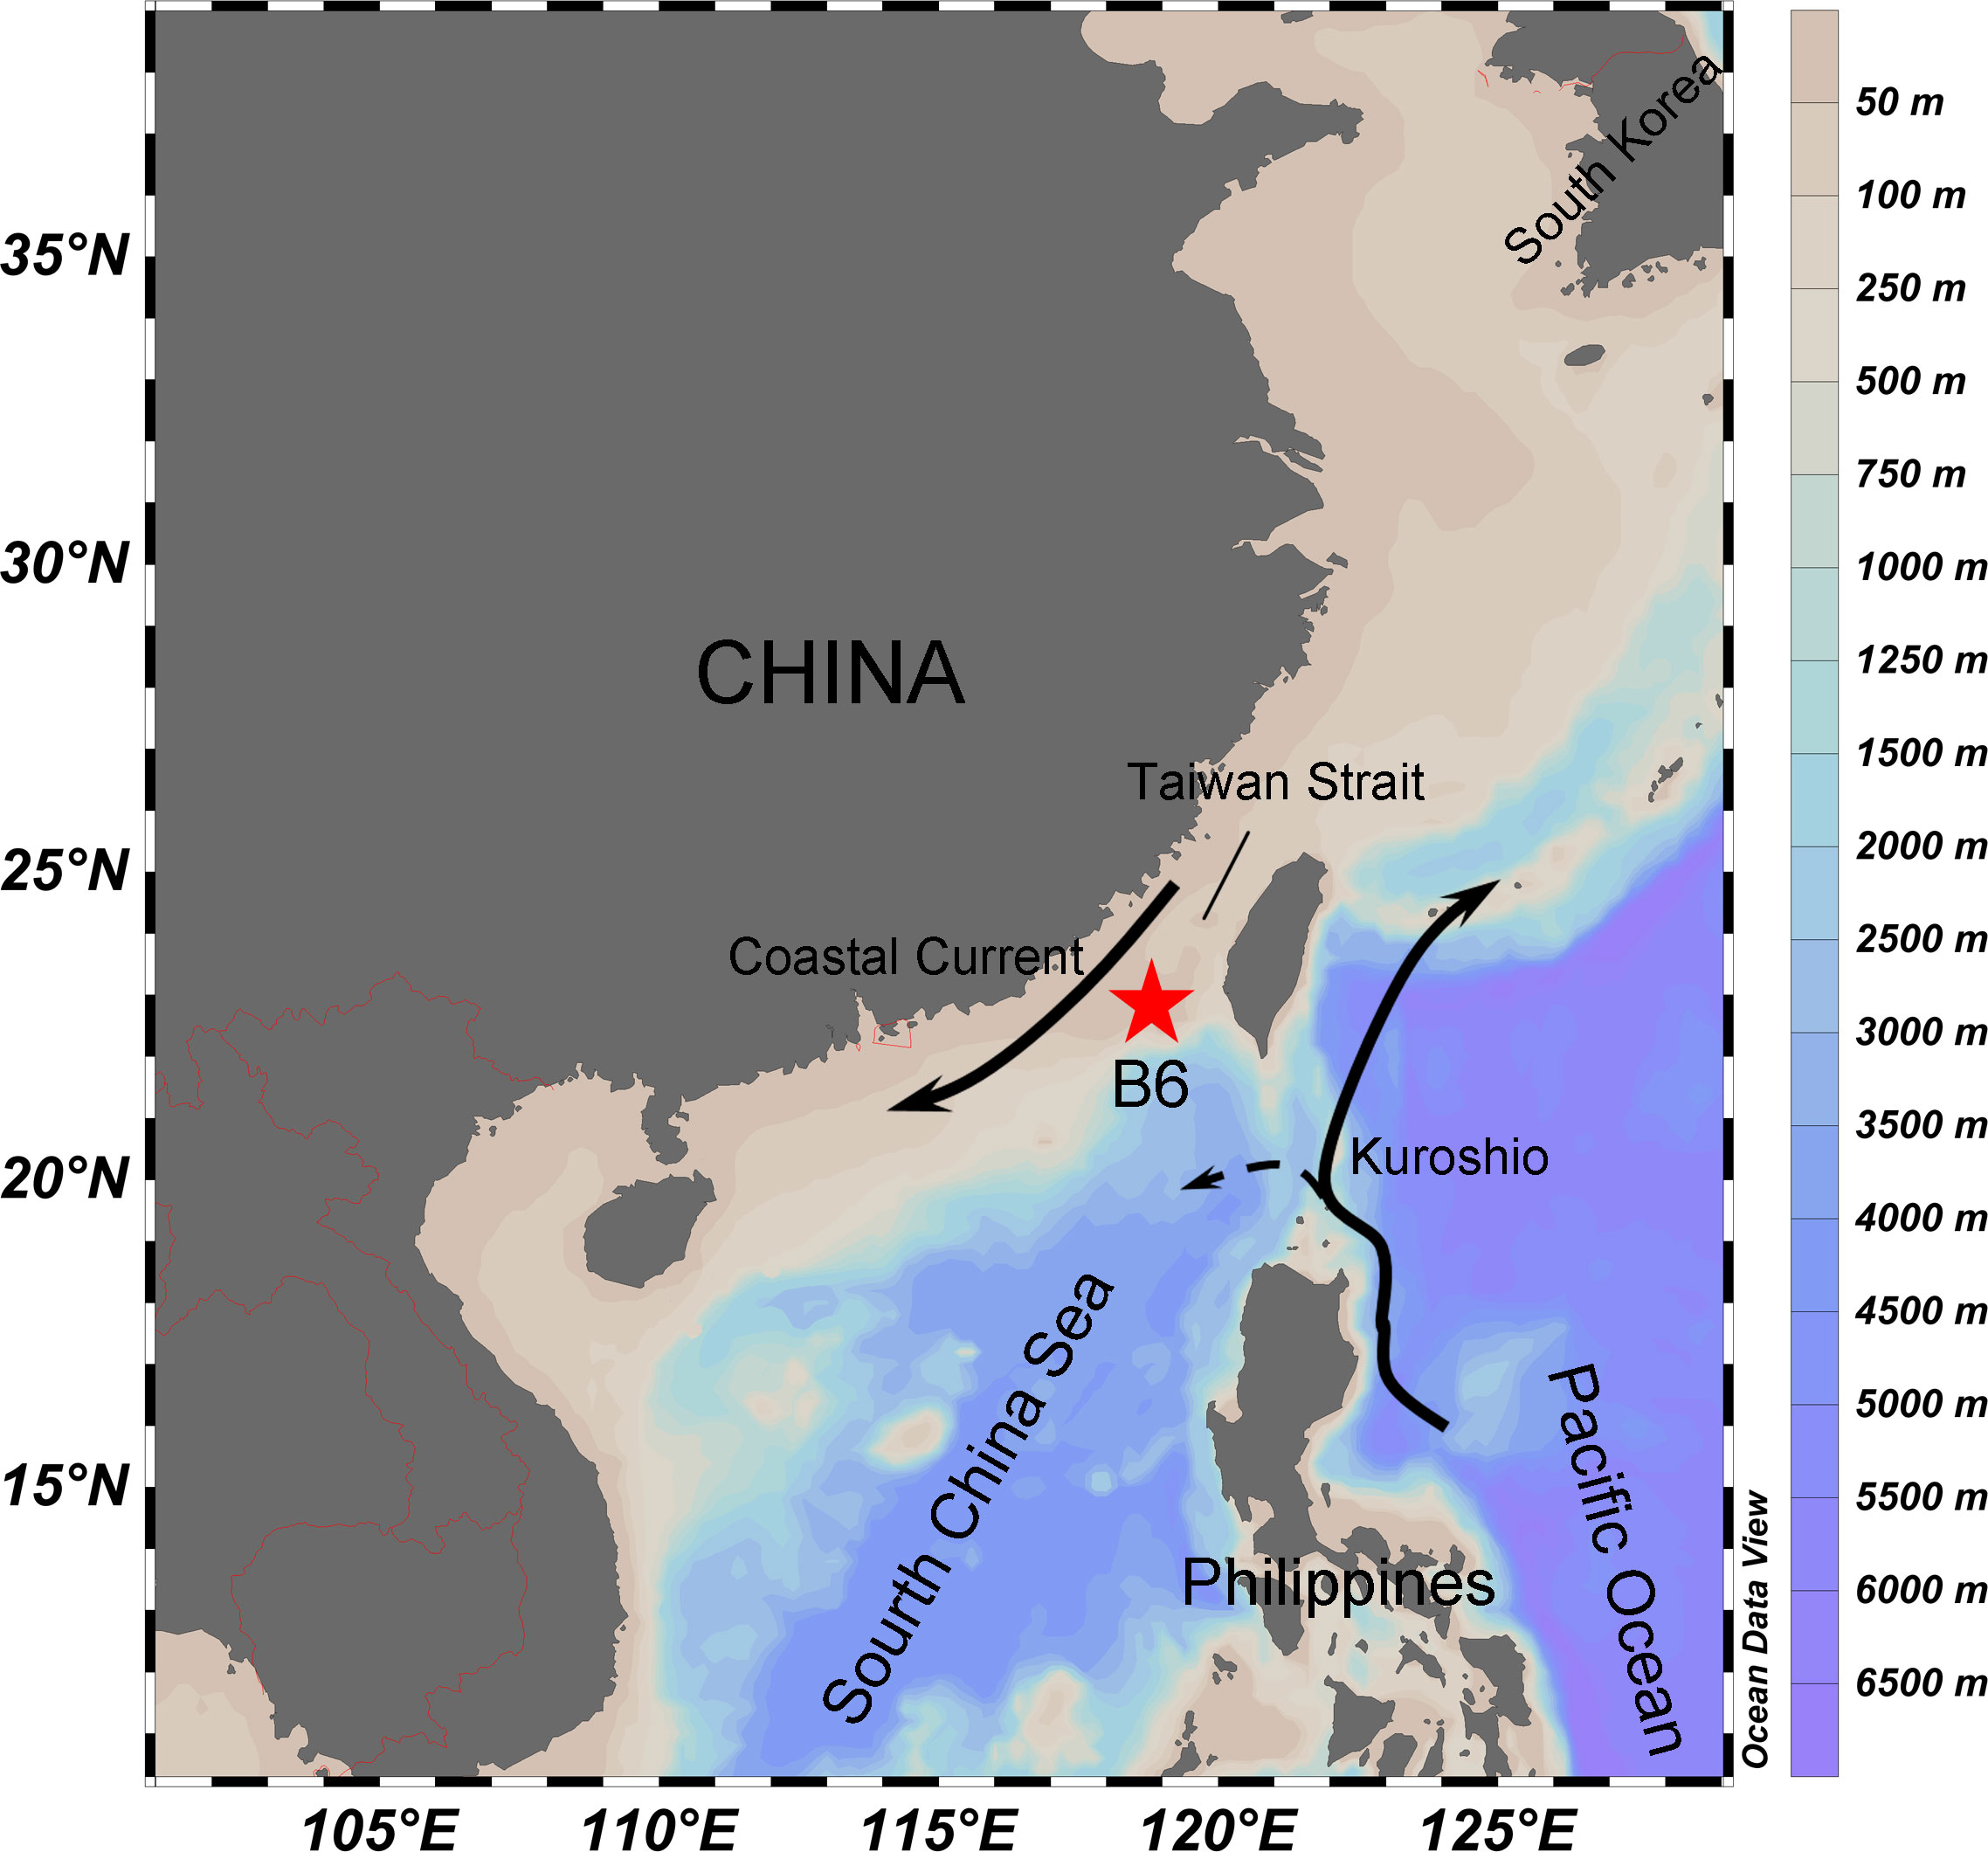
Figure 1 Map of sampling area. The study station (B6) was located in the southern of Taiwan Strait, off the west coast of Guangdong province, China.
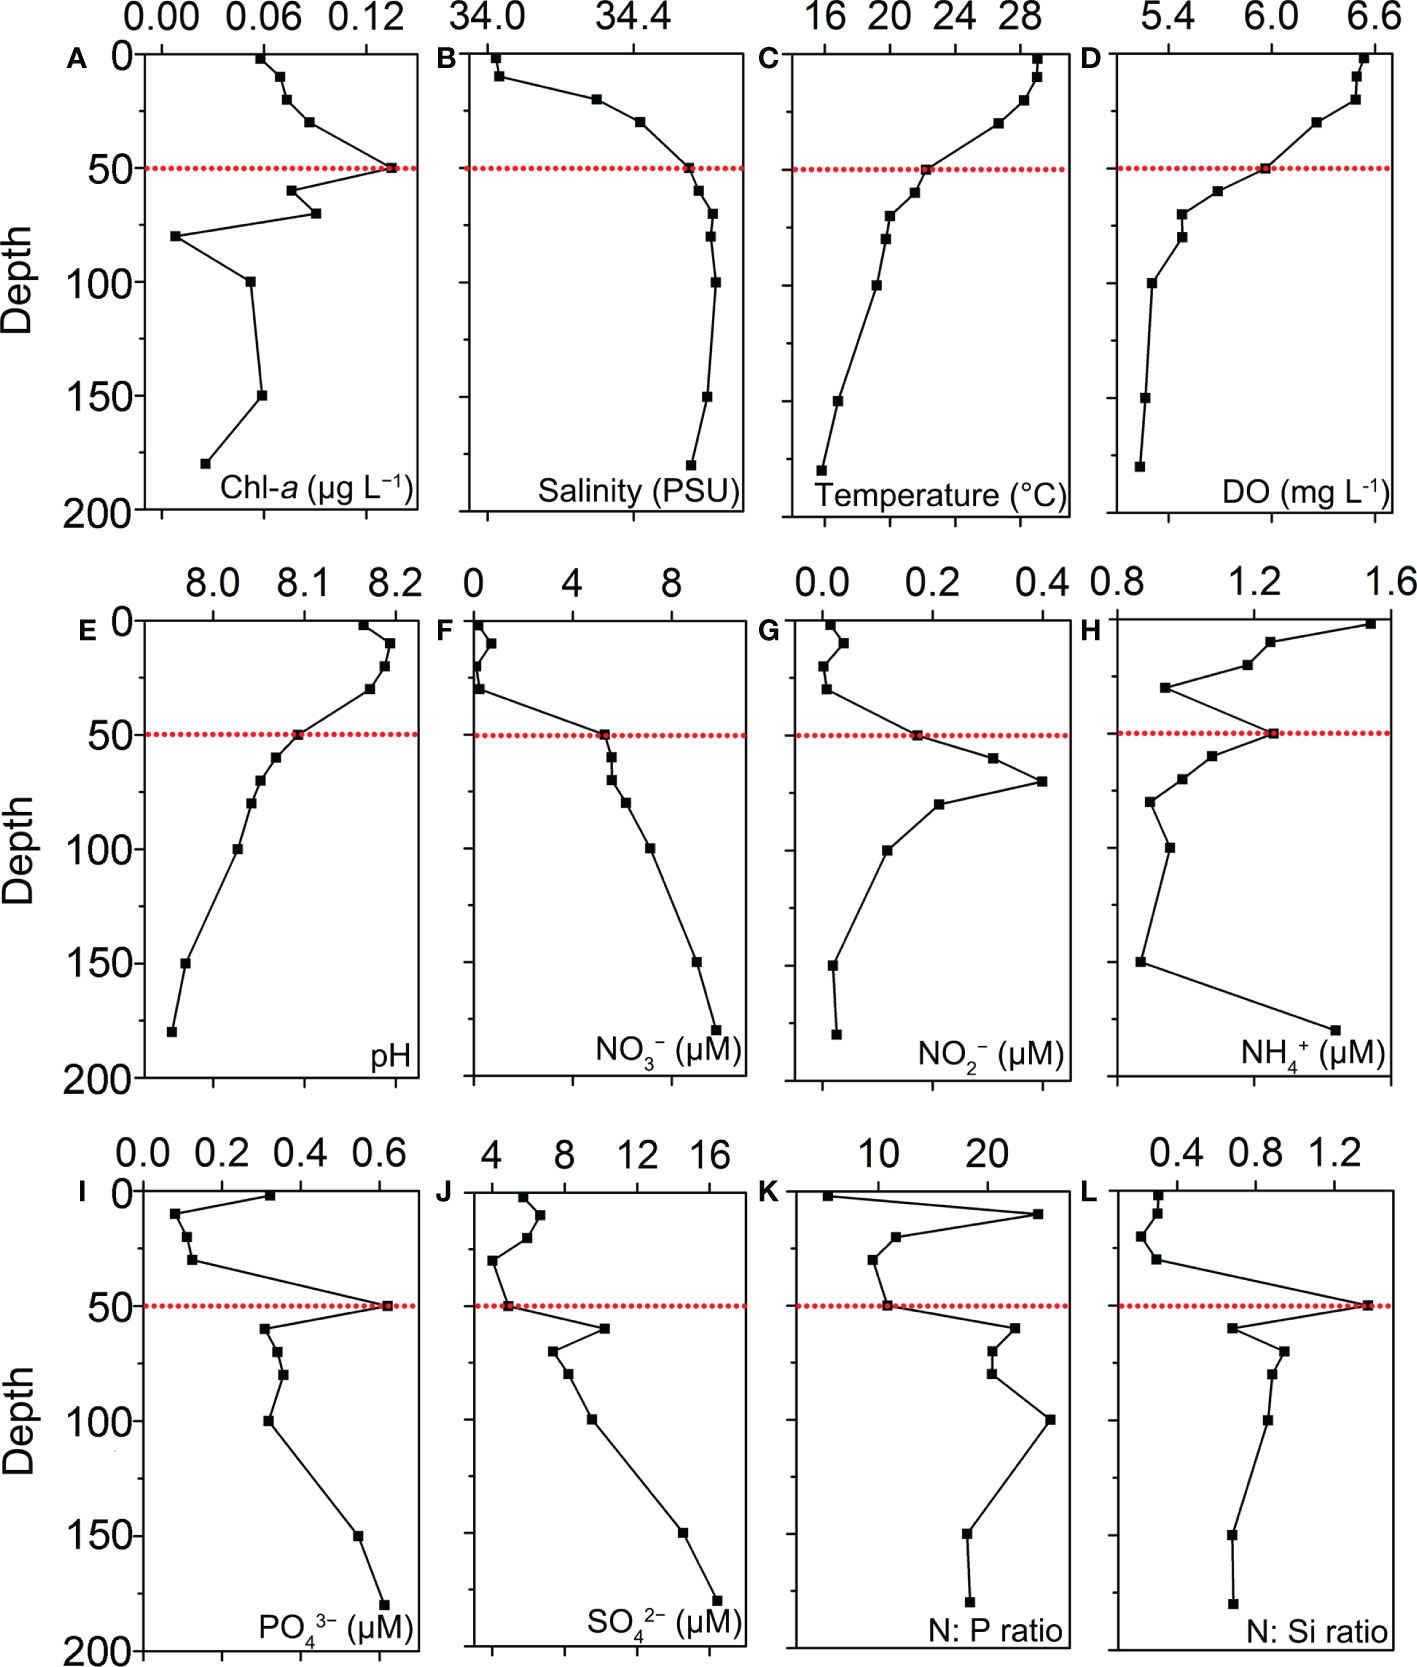
Figure 2 Vertical profiles of chemical and physical parameters in station B6: (A) total Chl-a concentration; (B) Salinity; (C) Temperature; (D) Dissolved oxygen; (E) pH; (F) NO3−; (G) NO2−; (H) NH4+; (I) PO43−; (J) SiO42−; (K) N:P ratio; (L) N:Si ratio.
2.2 Field incubation experiments
The water samples of the surface layer (1 m) and the DCM layer (50 m) at station B6 were pre-filtered through 200 μm nylon mesh to remove large zooplankton and debris, then dispensed into 45 acid-cleaned 2 L plastic bottles (totally 5 groups, 9 bottles per group). The experiment was designed in 5 treatments (groups) shown as Figure 3. For surface water, treatment (1) is Control: water sample + natural light; (2) water sample + nutrients + natural light. For the DCM layer water, treatment (3) is Control: water sample + 10% light; (4) DCM layer water + natural light; (5) DCM layer water + nutrients + natural light.
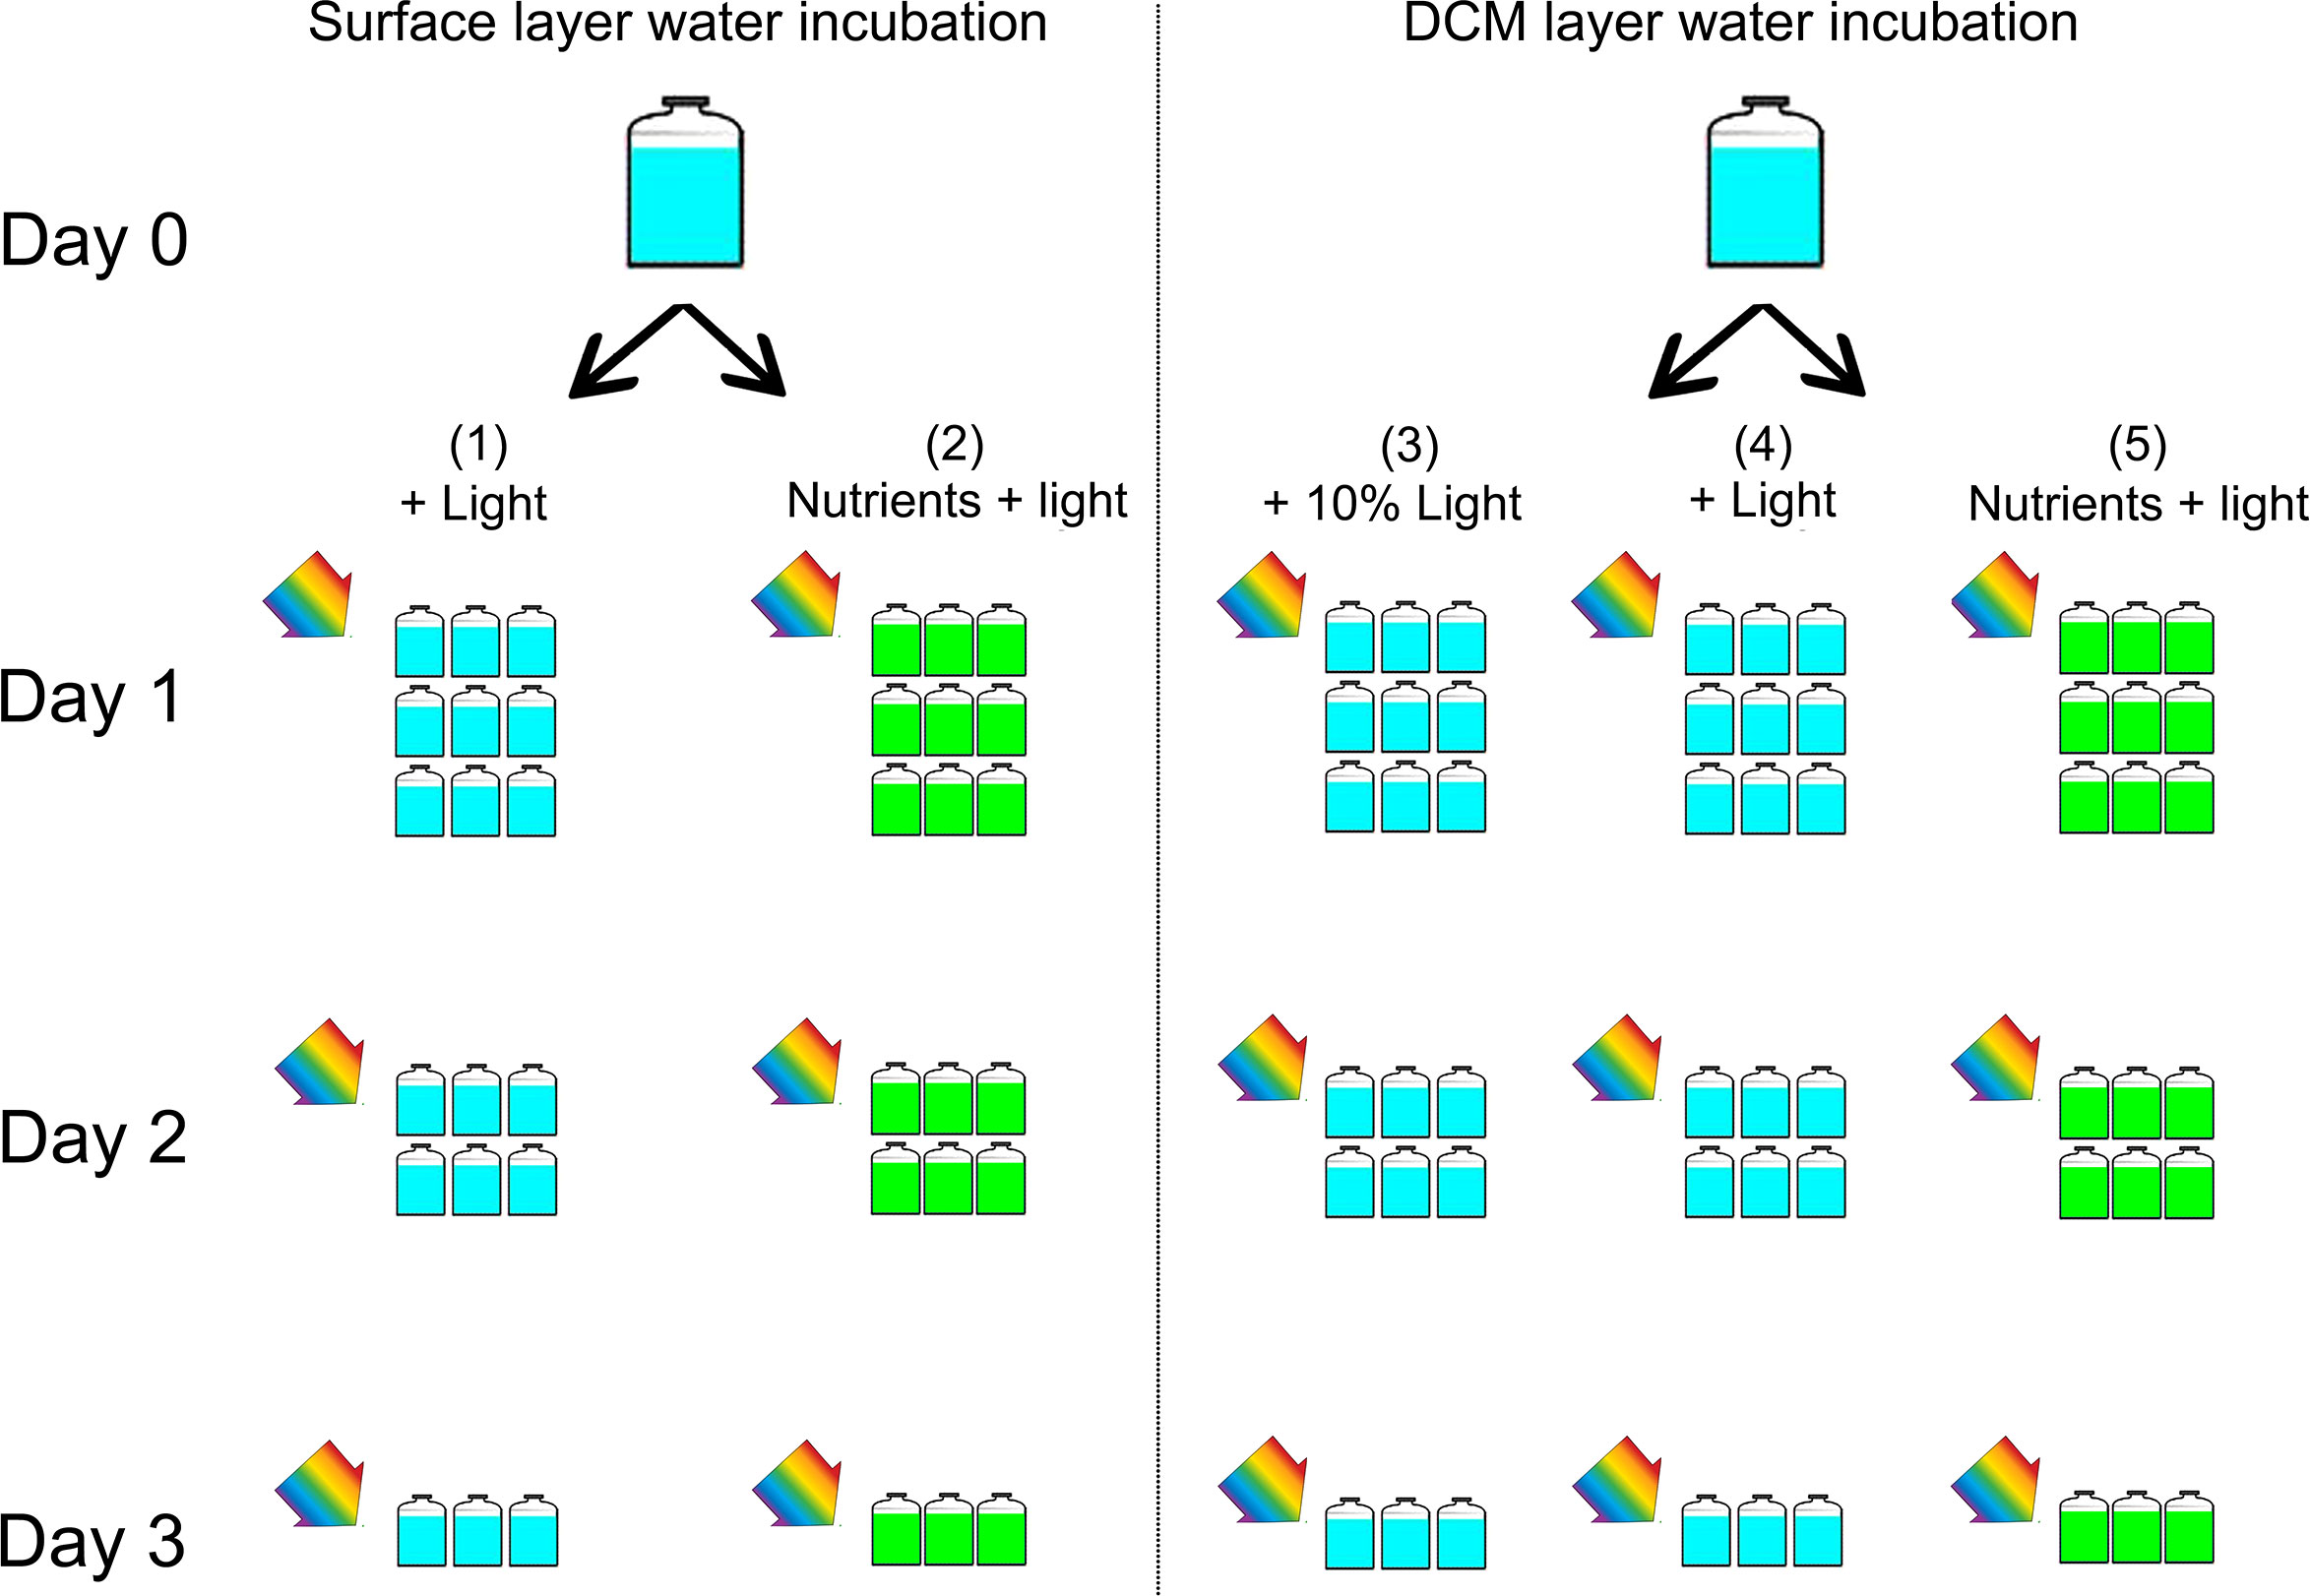
Figure 3 Experimental setup. The water samples of the surface layer (1 m) and the DCM layer (50 m) at station B6 were pre-filtered through 200 μm nylon mesh. For surface water, (1) Control: water sample + light; (2) water sample + nutrients + light. For the DCM layer water, (3) Control: water sample + 10% light; (4) DCM layer water + light; (5) DCM layer water + nutrients + light. In the group (3), the tank was covered with several layer of neutral density screens in order to reduce the ambient light by 90%, simulating the weak light of DCM layer. All bottles were placed in a water tank with surface seawater flowing to ensure that the incubation temperature was consistent with the surface water temperature of the ocean with a light-dark cycle of 12 h: 12 h. Incubation started at 7:00 in the morning, and ended at 3 days later. The samples during the incubation were taken at T=0, 24, 48, and 72 hours. During each sampling time, we consume three bottles (replicates) of each group for analysis of nutrients, counts of cell abundance, analysis of DNA for microbial community, and continue to incubate the rest bottles until the end.
The added nutrients were from F/2 medium nutrient stocks and the final concentrations of NO3−, and were ~40 uM, ~2 uM and ~10 uM, respectively. All bottles were placed in water tanks with surface seawater flowing to ensure that the incubation temperature was consistent with the surface water temperature of the ocean with a light-dark cycle of 12 h: 12 h. In the group (3), the tank were covered with several layer of neutral density screens in order to reduce the ambient light by 90%, simulating the weak light of DCM layer. Experiments started at 7:00 in the morning, and ended at 3 days later. The samples during the incubation were taken at T=0, 24, 48, and 72 hours. During each sampling time, we consume three bottles (replicates) of each groups for analysis of nutrients, counts of cell abundance, analysis of DNA for microbial community, and continue to incubate the rest bottles until the end (Figure 3). Concentrations of ammonium (NH4+), nitrite (NO2−), and nitrate (NO3−), dissolved active phosphate (PO43−), silicate () were determined with an autoanalyzer (Seal, Germany).
2.3 Flow cytometry
Samples for cytometric analyses were pre-filtered through 200 μm meshes, and fixed with formaldehyde (2% final concentration) in 2 ml tubes, and quickly frozen in liquid nitrogen until flow cytometry (FCM) analysis in the laboratory. Abundances of bacteria (Cyanobacteria, heterotrophic bacteria) and small (pico and nano-plankton) photosynthetic eukaryotes were determined on a BD FACSCanto II flow cytometer (BD Biosciences, San Jose, CA, USA) equipped with 488 nm laser excitation and standard filter setup as previously described in (Marie et al., 2000). First, we differentiated PPE (photosynthetic pico-eukaryotes) and PNE (photosynthetic nano-eukaryotes) based on orange fluorescence (FL2) versus red fluorescence (FL3) and side scatter versus FL3 signatures. Cyanobacteria (Prochlorococcus and Synechococcus) cell counts were determined from unstained samples, based on natural fluorescence from phycoerythrin (orange) and chlorophyll (red; Casotti et al., 2003). Heterotrophic bacteria were enumerated as in (Balestra et al., 2011) after staining with SYBR Green I (Lonza, final concentration 10−3 of stock solution) for 15 min in the dark at room temperature prior to analysis. Heterotrophic bacteria were identified in plots of red fluorescence versus green fluorescence and side scatter versus green fluorescence. The 1 μm fluorescent polystyrene calibration beads (Polysciences Co., USA) were added to all samples as an internal standard. Data were collected, saved, and analyzed with the Cell QUEST software.
2.4 DNA extraction, PCR and high throughput sequencing
Molecular analyses of microbial community (bacteria and eukaryotes) were performed for cultivation seawater samples (three replicates pooled together for one sample). Samples of 2 L were filtered through a 0.2 μm pore-sized membrane (Millipore, Billerica, MA, USA) under low light and vacuum pressure (< 100 mm Hg). All filter membranes were frozen in liquid nitrogen onboard until laboratory analysis. The DNA was extracted using a FastDNA Spin Kit (MP Biomedical, USA) according to the manufacturer’s instructions. The concentrations of purified DNA were measured using a spectrophotometer Nanodrop 2000c (ThermoFisher, USA).
The hypervariable regions V4 of 16S and V4 of 18S rRNA genes, respectively, were amplified for further sequencing. Amplification of V4 region of 16S rRNA genes was performed using 515f and 806r primer pairs (Walters et al., 2016) and V4 region of 18S rRNA genes using the 528F and 706R primer pairs (Elwood et al., 1985). The 20 μL reaction solution contained 1 unit Taq polymerase (Life Technologies, Carlsbad, CA, USA), 1× reaction TransGen buffer, 0.2 mM dNTPs, 1.5 mM MgCl2 and 0.2 μM of each primer. The PCR program was as follows: an initial denaturation step at 95°C for 5 min; 30 cycles of 94°C for 30 s, 47°C for 45 s and 72°C for 1 min; and a final extension at 72°C for 5 min. The PCR products from triplicate reactions for each sample were pooled together and sequenced on the MiSeq System (Illumina, San Diego, CA, USA) in a commercial company (Novogene, China).
2.5 Data processing and statistical analysis
Data were processed using the Quantitative Insights into Microbial Ecology (Qiime) pipeline for 16S rRNA and 18S rRNA data sets (http://qiime.org/tutorials/index.html; Caporaso et al., 2010). In brief, the sequences with a quality score below 25 and 200 bp in length were trimmed and then assigned to water samples based on unique 10 bp barcodes. For the 16S rRNA gene, after a first assignment against Silva v119 (Quast et al., 2013), chloroplast and mitochondria sequences were removed. In the case of 18S rRNA gene, Metazoa sequences were removed after a first assignment against the PR2 database (Guillou et al., 2013). OTUs at 97% similarity were generated using default settings and clustering was performed with furthest neighbor algorithm. OTUs formed by 10 or less sequences in the case of 16S rRNA gene and 5 or less sequences in the case of 18S rRNA gene, were removed from further analysis. Singletons (OTUs containing a single read across all samples) were excluded prior to further analysis. Rarefaction curves and diversity indexes were obtained with Mothur.
For calculating alpha diversity estimators (i.e., OTU richness, Shannon, Simpson, and Chao1) of bacteria and eukaryotes, the reads were rarefied by randomly re-sampling 50000 reads per sample for 10 times, which minimized bias associated with sequencing depths and allowed for comparison of diversities for all samples. The bacterial and eukaryotic variations during the incubations based on Bray-Curtis similarities were visualized using NMDS ordination implemented within PRIMER package V5.0 (Primer-E, UK).
3 Results
3.1 Water column stratification and conditions of nutrients at station B6
The vertical profiles of physical and chemical variables at station B6 were shown in Figure 2 and Supplementary Table S1. The water column was highly stratified with the strong thermocline between 10 m and 50 m (Figure 2). From the surface to the depth of 180 m, temperature dropped from 29.05°C to 15.81°C (Figure 2C), and salinity increased slightly from 34.02 PSU to 34.56 PSU (Figure 2B). The DCM layer occurred around 50 m, and chlorophyll was 0.13 μg L−1, being much higher than the surface layer (0.06 μg L−1, Figure 2A). In the DCM layer, the concentrations of DIN, PO43− and were 6.73, 0.62 and 4.90 μM (Figure 2).
3.2 Nutrient variation during the incubation experiment
On-deck incubation experiments showed the different responses of surface and DCM microbial communities to light and nutrients. For the surface water incubation experiments, in the control, initial NO3− and PO43− were low and remained near depletion levels during the incubation, but SiO42− decreased to 3.80 ± 1.11 µM in 24 h, and increased to 6.85 ± 2.20 µM at the end of the experiment (Supplementary Figure S1A). In contrast, in the nutrient addition treatment, ambient NO3− and PO43− were drawn down from 41.4 ± 3.15 to 30.67 ± 3.20 µM and from 1.67 ± 0.20 to 0.98 ± 0.24 µM, respectively, while initial remained relatively stable (Supplementary Figure S1C).
For the DCM water incubation experiments, in the control (10% light addition group), ambient NO3− and decreased from 5.30 ± 1.06 to 3.50 ± 0.68 µM, and from 0.63 ± 0.15 to 0.51 ± 0.14 µM, as increased little during the incubation (Supplementary Figure S1E). More rapid uptake of ambient nutrients (NO3−, SiO42− and PO43−) took place as the nutrients decreased dramatically after 72 h incubation in the nutrients + light addition and the light addition groups (Supplementary Figures S1B, D).
3.3 Cell abundances during the incubation experiments
The cell abundance of different microbial taxa changed dramatically in different incubation treatments (Figure 4). For the surface water incubation experiments, in the control (the light addition group), the density of bacterial cells was decreasing as fluorescence PPE and PNE increased little (Figures 4A, B). In contrast, in nutrients + light addition group, the microbial cells increased rapidly after 72 h incubation, especially for the heterotrophic bacteria and PPE (from 0.65 ± 0.16 to 1.72 ± 0.3 × 10⁴ cells ml−1, and from 0.69 ± 0.07 to 3.40 ± 0.67 × 10³ cells ml−1, respectively, Figures 4C, D).
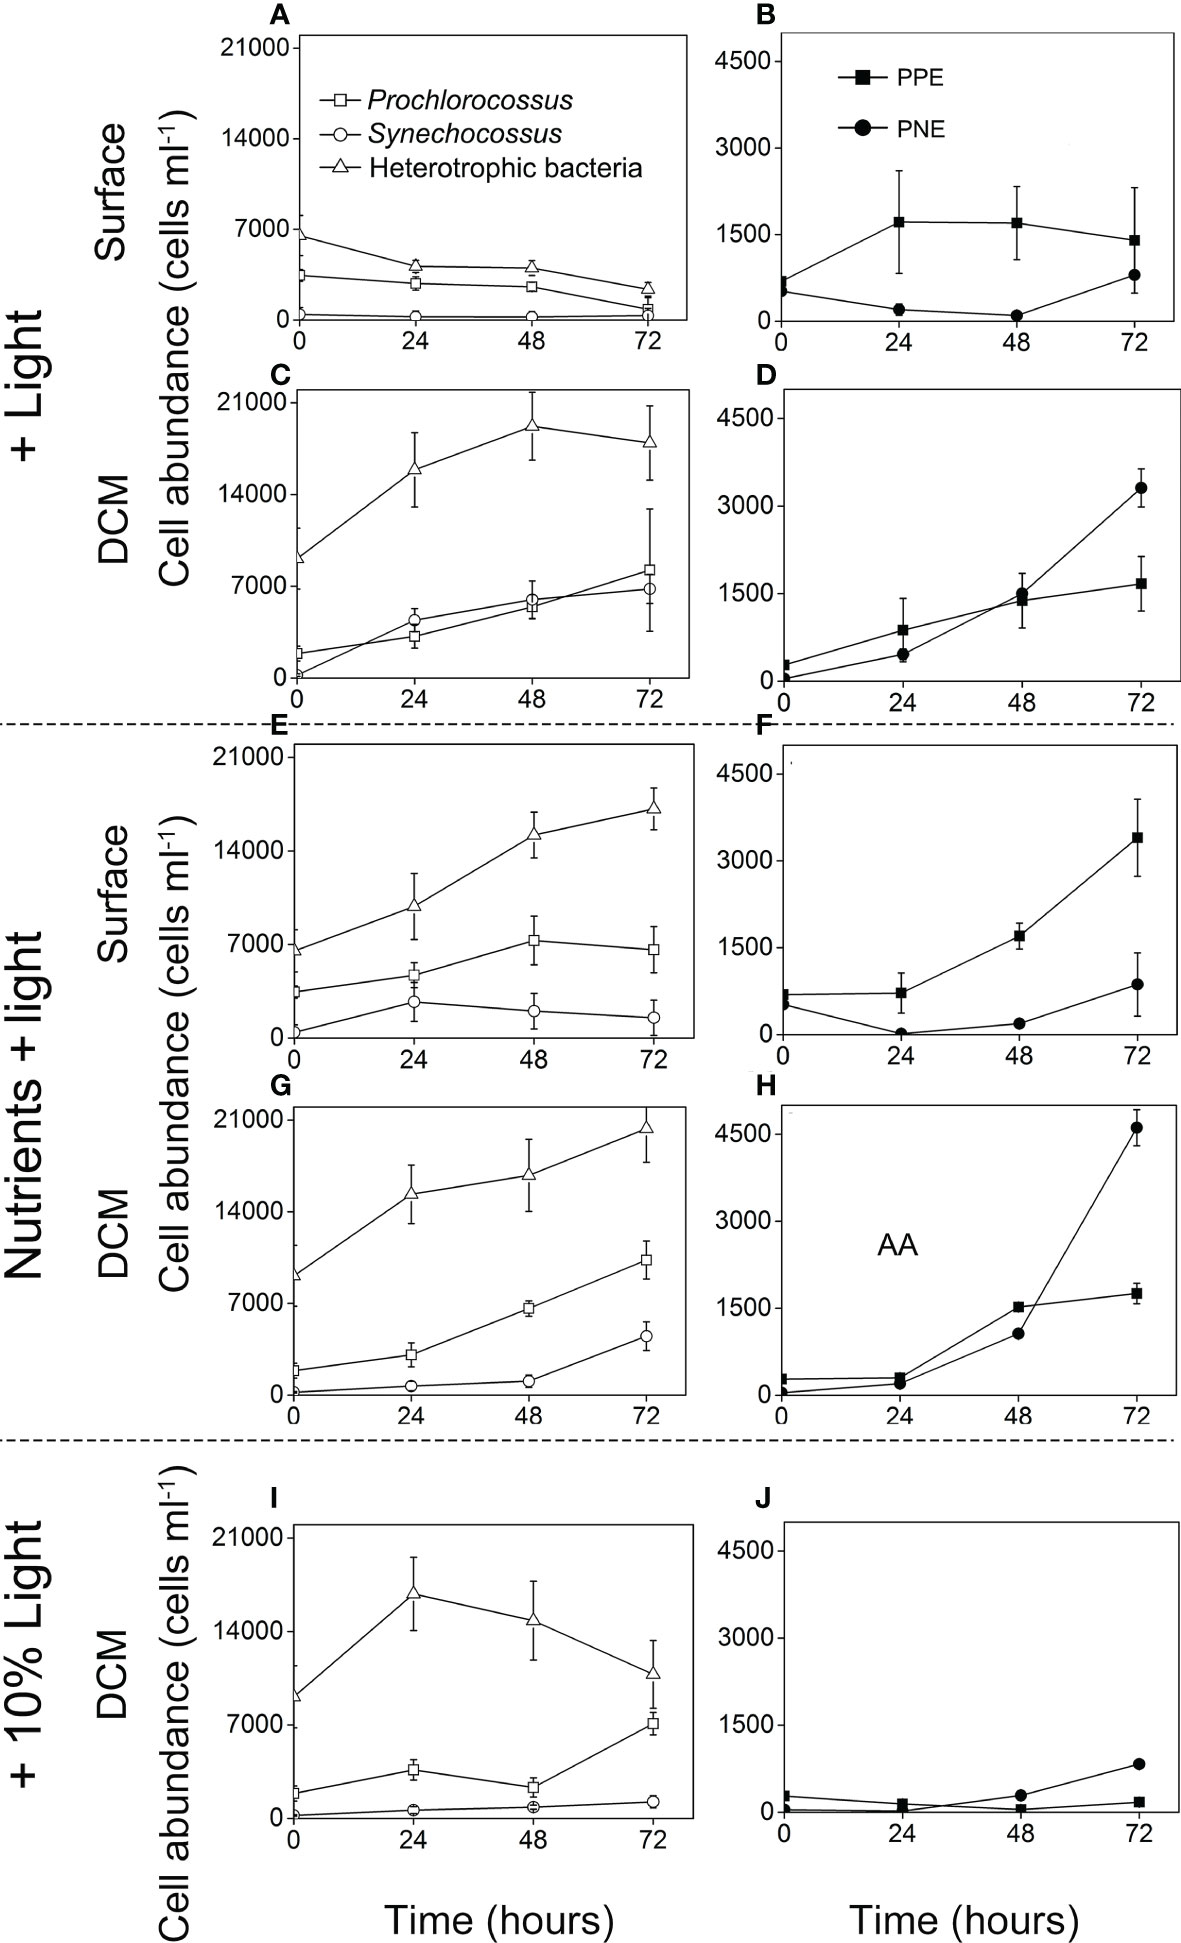
Figure 4 Time course of cell abundance of heterotrophic bacteria, Cyanobacteria (Prochlorococcus and Synechococcus), PPE (photosynthetic pico-eukaryotes) and PNE (photosynthetic nano-eukaryotes) during the field incubation experiments: the + light groups (A–D), the + nutrients + light groups (E–H), the + 10% light group (I–J).
For the DCM water incubation experiments, in the control (the 10% light addition group), heterotrophic bacteria and Prochlorococcus maintained a higher cell density (1.08 ± 0.25 × 10⁴ cells ml−1, 0.71 ± 0.08 × 10⁴ cells ml−1) after 72h, while other microorganisms maintained a relatively low cell concentration (Figures 4I, J). Compared with the control, microbial cells in the nutrients + light addition group increased sharply, especially for PNE. The abundance of PNE increased to 4.61 ± 0.31 × 10³ cells ml−1 after 72 h incubation (Figure 4H). In the light addition group, similar phenomenon was observed (from 0.04 ± 0.01 to 2.31 ± 0.12 × 10³ cells ml−1, Figure 4D).
3.4 Microbial diversity, community composition and succession
Overall, 16S rRNA (Bacteria) and 18S rRNA (eukaryotes) genes sequencing generated 1,685,903 and 1,730,235 sequences, respectively. During the 3 days incubation, the microbiome changed rapidly (Figure 5). Ecological indices showed that, in general, bacterial and eukaryotic communities are richer and more diverse in the initial than the end of the incubation experiments (Supplementary Tables S4, S5). The total number of OTUs, defined at a 97% similarity, ranged from 708 to 1,667 for bacteria and ranged from 430 to 1,463 for eukaryotes (Supplementary Tables S4, S5). In case of bacterial communities, Chao1 index was 921–1,532, Shannon index was 4.24–9.14 (Supplementary Table S4). For the surrounding eukaryote community, Chao1 index was 524–1,622 and Shannon index was 1.69–7.98 (Supplementary Table S5).
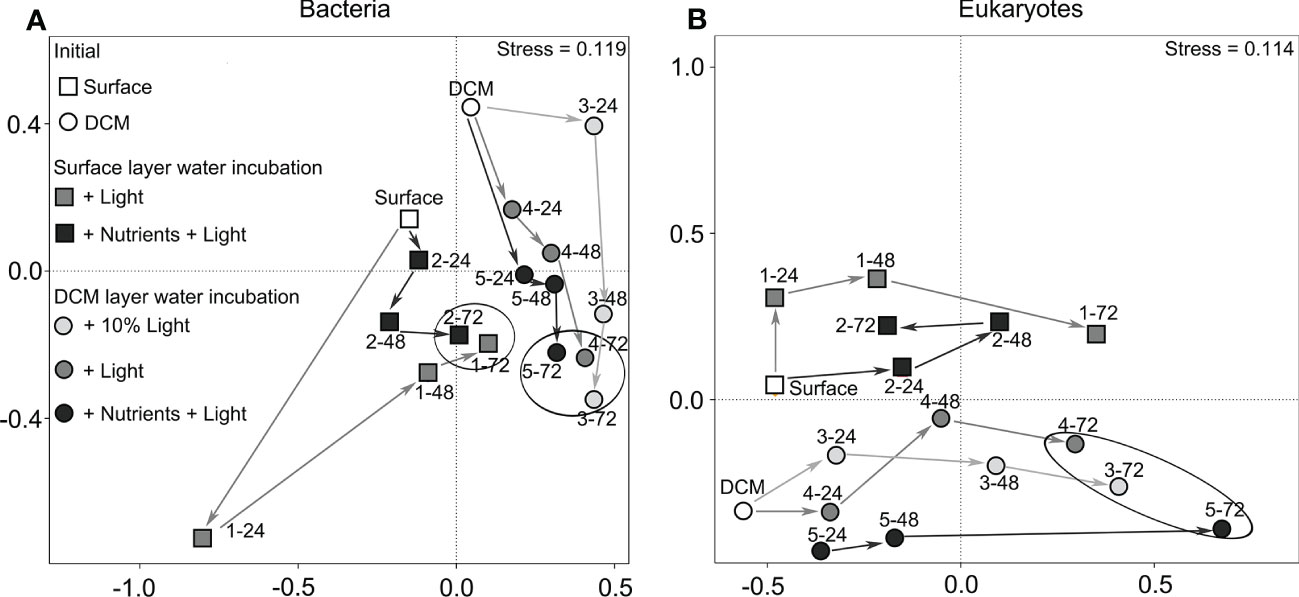
Figure 5 Non-metric multidimensional scaling (NMDS) ordination showing the community structure of bacteria (A) and eukaryotes (B) differentiated on the time course: surface water incubation (circle), DCM layer water incubation (square), + 10% light group (in light gray), the + light group (in gray), the + nutrients + light group (in dark gray). The white circle/square marks represent the initial. There were large differences among the incubation samplings.
A total of 25 bacterial phyla were detected in the incubation experiments. The relative abundance varied greatly, ranging from 15.15 to 57.59% for Gammaproteobacteria, 10.15%–48.00% for Alphaproteobacteria, 1.18%–47.86% for Cyanobacteriia, 0.01%–24.45% for Thermoplasmata. Bacteroidia were less abundant (0.42%–7.10%), Acidimicrobiia (0.30%–6.43%), Bacilli (0.03–5.16%), Actinobacteria (0.02–2.51%) and others were relatively minor components of the communities (Figure 6A). In case of eukaryotes (Figure 6B), overall, the community of eukaryotes was dominated by Diatomea (4.89–95.85%) with Chlorophyta being 0.27–64.45%, Dinophyceae 0.30–34.36%, Protalveolata 0.29–31.56%, MASTs 0.31–11.37%.
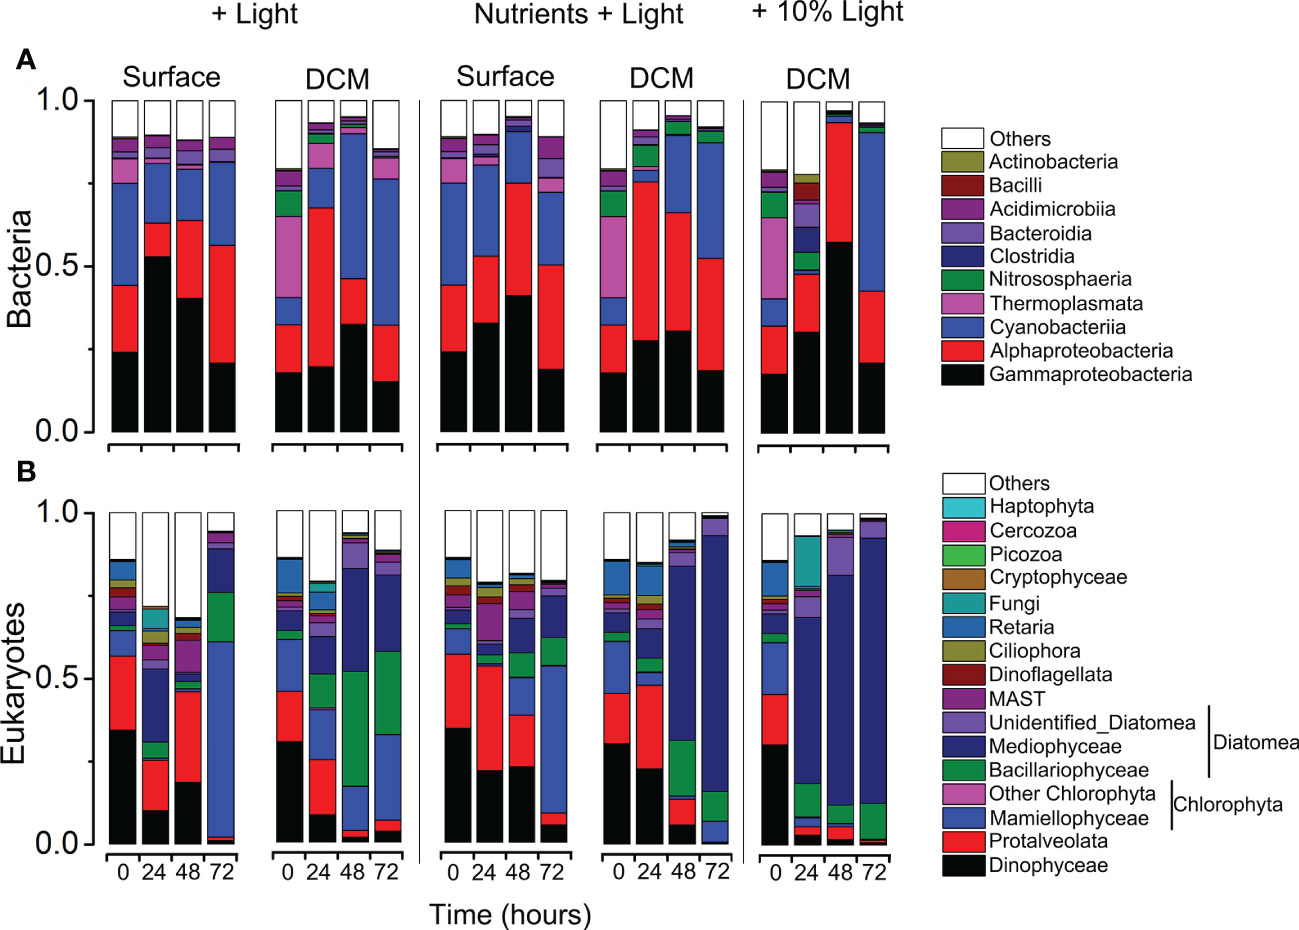
Figure 6 Variations in community composition and structure of bacteria (A) and eukaryotes (B) revealed using MiSeq sequencing of 16S/18S rRNA genes during the incubation experiment experiments.
Comparisons of the relative abundance of major microbial lineages in the incubation experiments provided information on how the community structurally shifted over a temporal scale of the incubation (Figure 6). For surface water incubations, in nutrients + light addition group, in the case of bacteria community, after 72 h incubation, the read proportions of Bacteroidia (5.79% vs. 1.81%), Alphaproteobacteria (31.49% vs. 20.15%) and Acidimicrobiia (6.43% vs. 3.94%) were significantly higher than the initial. However, the relative abundance of Cyanobacteriia slightly decreased (30.69% vs. 21.92%, Figure 6A; Supplementary Table S6). As for the eukaryotic community, in the nutrients + light addition group, the read proportions of Mamiellophyceae accounted for approximately 50.27%, which was about seven times higher than that in the initial (Supplementary Table S7). On the contrary, the proportions of Protalveolata and Dinophyceae were significantly decreased during the incubation experiments (Figure 6B; Supplementary Table S7).
For the DCM water incubation experiments, in case of bacteria, after 48h incubation, Cyanobacteria increased from 8.19% to 47.86% in 10% light addition group, from 8.19% to 44.08% in light addition group, from 8.19% to 34.93% in nutrients + light addition group, respectively, and the proportion of Thermoplasmata decreased dramatically (Figure 6A; Supplementary Table S6). In case of eukaryote community, diatoms (mostly the Mediophyceae and Bacillariophyceae) was significantly more abundant in the three groups, after 72h incubation, the relative abundance of diatom taxa accounted for the 95.85%, 51.97%, and 91.41% in the 10% light addition, light addition and nutrients + light addition groups, respectively (Figure 6B; Supplementary Table S7). More interestingly, the proportions of Dinophyceae and Protalveolata were significantly lower in the three groups after incubation (Figure 6B; Supplementary Table S7).
4 Discussion
4.1 Different communities between the surface and DCM layer at station B6
At station B6, microbial abundance and composition were significantly different in different water layers where there were gradients of vertical distribution of sunlight and nutrients in the water column. This agreed with the other observations (Liu et al., 2012; Casey et al., 2013; Giner et al., 2020). In our FCM data, the heterotrophic bacterial cells dominated the microbial cell assemblages in the surface and DCM waters. This is a common phenomenon that the heterotrophic bacteria dominate in oligotrophic seas in comparison to the phytoplankton groups (Cotner et al., 1992). In the upper layer of the oligotrophic sea, the growth of the heterotrophic bacteria is mainly supported by dissolved organic compounds produced by the photosynthetic taxa, and the remineralization of inorganic nutrients by the heterotrophic bacteria stimulates the growth of the photosynthetic groups (Linacre et al., 2015). The abundance of the Retaria groups increased in relative abundance with depth (Supplementary Table S7), as reported in earlier studies (e.g., Edgcomb et al., 2002; Giner et al., 2020). Previous studies found these groups likely have many rDNA operon copies (Massana, 2011), which might give an overestimate their abundance.
4.2 Different responses of microbial community to the additions in the surface and DCM water incubations
Compared to DCM water incubations, surface water incubations showed that the relative abundance of photosynthetic pico-eukaryotes (PPE) increased significantly. For instance, in the nutrients + light addition group, the read proportions of Mamiellophyceae (this taxa is typically PPE) accounted for approximately 50.27%, which was about seven times higher than that in the initial (7.59%; Figure 6B; Supplementary Table S7). The PPE cell abundance response patterns are coherent with those of eukaryote community composition (Figure 4F), which suggests that the Mamiellophyceae were the main responders to the surface water incubations after adding the nutrients. This typical pico-algae are globally distributed in aquatic environments, and can also increase under specific conditions in oceanic waters (Treusch et al., 2012) or Polar Regions (Li et al., 2009). The increasing in the surface water incubations of these taxa can be attributed to their enormous ecotypes, which may display specific photoacclimation strategies (Hanschen and Starkenburg, 2020).
At end of the DCM water incubations, cells of nano-sized phytoplankton became very high, indicating the occurrence of a bottled phytoplankton bloom (Figures 4D, H). It is interesting that the relative abundance of diatoms (mainly the Mediophyceae and Bacillariophyceae) was particularly high and the concentration of decreased dramatically in the DCM water incubation experiments after 72 h (Figure 6B; Supplementary Figures S1B, D). Considering that diatoms are generally close or above to the nano size, we extrapolate the cells of diatoms were dominant in the incubation bottles. This result is not surprising, given that diatoms are often observed to be dominant during phytoplankton blooms after the typhoon events or other physical mixing, as shown in Table 1. In the SCS, Li et al. (2009) reported the dominance of diatoms in the “Kaemi” typhoon induced blooms in 2016. In the coast of Western Gulf of Mexico, diatoms cell abundance were observed to be dominant after the four super tropical cyclones (Anglès et al., 2015). According these, phytoplankton blooms likely occur after a physical mixing event such as typhoon or IW, due to seed phytoplankton and nutrients in the DCM layer being brought to the ocean surface to receive sufficient sunlight. Furthermore, previous researchers found that the surface layer has a higher zooplankton grazing rate than the DCM layer (Chen et al., 2009a), given that zooplankton may prefer to consume smaller phytoplankton (such as Mamiellophyceae) than bigger preys (such as larger diatoms; Gaul et al., 1999). The typical heterotrophic taxa such as Ciliophora and MASTs were found to be more abundant in the surface layer than in DCM in our study (Supplementary Table S7), which may imply stronger grazing rate at the surface than DCM layer during the incubations.
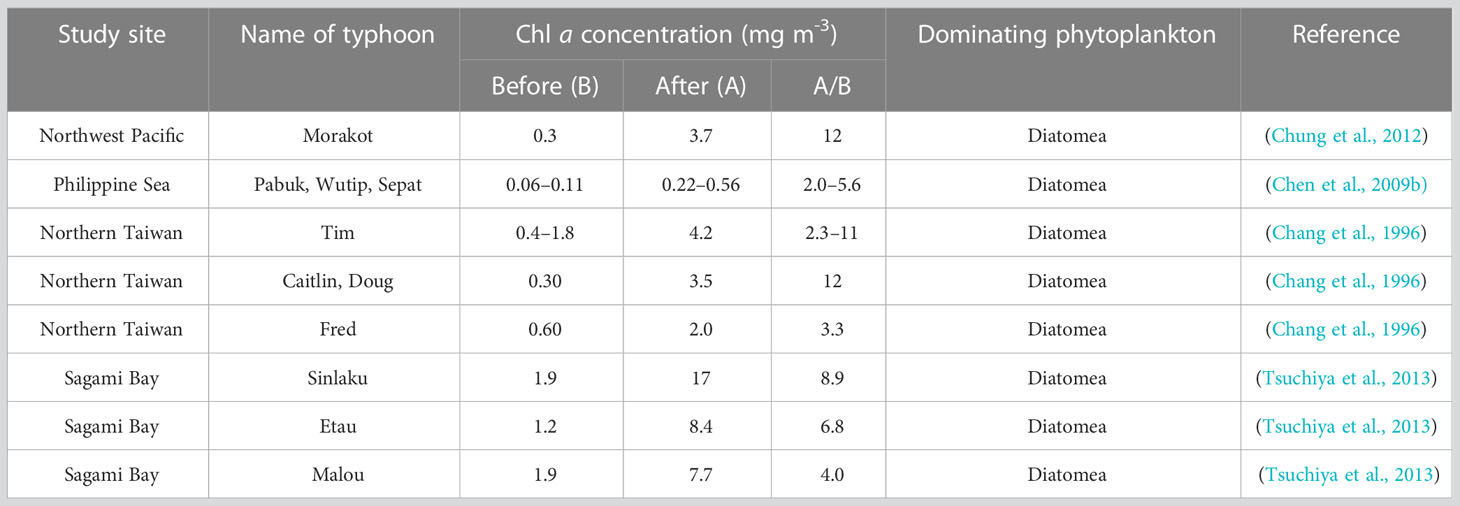
Table 1 Summary of Chl a concentrations and the dominanting phytoplankton after 11 typhoon passages.
In our observations, Cyanobacteria (Prochlorococcus and Synechococcus) declined or increased slightly in cell abundance for all treatments (Figure 4). These results are not surprising, as in other studies abrupt decrease in Cyanobacteria abundance was observed both in mesocosm experiments and field observations (Cunliffe et al., 2009). Considering Cyanobacteria having a higher cell surface area/volume ratio, abnormally low nutritional requirements, cyanobacteria are better adapted to oligotrophic stratified conditions (Partensky et al., 1999). Moreover, the presence of small grazers (e.g., ciliates and MASTs) was suggested by past studies to be responsible for the decrease of this small photosynthetic group (Mackey et al., 2009).
4.3 Ecological implications to physical mixing events
Physical mixing events are widely recognized to control microbial community in aquatic systems (Johnson et al., 2010). The different community and their succession of microorganisms in surface and subsurface water after receiving nutrients and light indicates that the microorganisms in different water layers have distinct responses to the vertical mixing caused by physical events. According to the “dilution-recoupling” hypothesis, physical mixing also play a critical role in the initiation of the blooms, as mixing induced dilution of both phytoplankton and grazer biomass leads to fewer grazer-phytoplankton encounters (Behrenfeld, 2010; Johnson et al., 2010). Considering the carbon sequestration efficiency of the biological pump (BP) is shaped by the microbial community (Jiao et al., 2010). Those physical mixing events are important for the biological pump (BP) to perform carbon sequestration in the water column of oligotrophic oceans. This warrants more dedicated investigation.
5 Conclusion
In oligotrophic seas, vertical mixing caused by physical dynamics is critical in determining microbial community compositions and changes in the upper column. Few studies have comparatively investigated the microbial dynamics and more importantly their succession after the surface and subsurface waters mixing. During a research expedition to the south China sea in march 2018, we conducted an onboard experiment by collecting seawater samples at surface and the DCM layer and adding nutrients, and incubated them under full sunlight and 10% light, and examined the diversity of bacterial and eukaryotic communities and their cell abundance using 16/18S high throughput sequencing and FCM approaches. Our study found large differences in bacterial and eukaryotic community structure and cell abundance between the surface and DCM. After 72 hours of culture, taxonomically the incubated surface water was dominated by pico-eukaryotic phytoplankton, while the incubated DCM layer water is dominated by diatoms, which suggests diatoms are the main functional group of phytoplankton bloom after a vertical mixing event.
Data availability statement
The datasets presented in this study can be found in online repositories. The names of the repository/repositories and accession number(s) can be found below: https://www.ncbi.nlm.nih.gov/, PRJNA869577.
Author contributions
FG collected data and wrote the manuscript draft. YZ contributed the nutrients data. KY and JG supported the research cruise and revised the manuscript. KY and YZ designed the experimental plan. All authors contributed to the article and approved the submitted version.
Funding
This study was supported by GD KJT 2020B1111350001, SML2021SP204, GDNRC[2021]62, the NSF-China projects (U1701247, 91328203), NMENC-SYSU(201819/201820).
Acknowledgments
We thank the Sun Yat-Sen University for organizing the cruise and assisting with the sampling.
Conflict of interest
The authors declare that the research was conducted in the absence of any commercial or financial relationships that could be construed as a potential conflict of interest.
Publisher’s note
All claims expressed in this article are solely those of the authors and do not necessarily represent those of their affiliated organizations, or those of the publisher, the editors and the reviewers. Any product that may be evaluated in this article, or claim that may be made by its manufacturer, is not guaranteed or endorsed by the publisher.
Supplementary material
The Supplementary Material for this article can be found online at: https://www.frontiersin.org/articles/10.3389/fmars.2023.1122765/full#supplementary-material
References
Anglès S., Jordi A., Campbell L. (2015). Responses of the coastal phytoplankton community to tropical cyclones revealed by high-frequency imaging flow cytometry. Limnol. Oceangr. 60, 1562–1576. doi: 10.1002/lno.10117
Balestra C., Alonso-Sáez L., Gasol J. M., Casotti R. (2011). Group-specific effects on coastal bacterioplankton of polyunsaturated aldehydes produced by diatoms. Aquat. Microb. Ecol. 63, 123–131. doi: 10.3354/AME01486
Bauer A., Waniek J. J. (2013). Factors affecting chlorophyll a concentration in the central beibu gulf, south China Sea. Mar. Ecol. Prog. Ser. 474, 67–88. doi: 10.3354/MEPS10075
Behrenfeld M. J. (2010). Abandoning sverdrup's critical depth hypothesis on phytoplankton blooms. Ecology 91, 977–989. doi: 10.1890/09-1207.1
Caporaso J. G., Kuczynski J., Stombaugh J., Bittinger K., Bushman F. D., Costello E. K., et al. (2010). QIIME allows analysis of high-throughput community sequencing data. Nat. Methods 7, 335–336. doi: 10.1038/nmeth.f.303
Casey J. R., Aucan J., Goldberg S. R., Lomas M. W. (2013). Changes in partitioning of carbon amongst photosynthetic pico-and nano-plankton groups in the Sargasso Sea in response to changes in the north Atlantic oscillation. Deep Sea Res. II 93, 58–70. doi: 10.1016/j.dsr2.2013.02.002
Casotti R., Landolfi A., Brunet C., D'Ortenzio F., Mangoni O., Ribera d'Alcalà M., et al. (2003). Composition and dynamics of the phytoplankton of the Ionian Sea (eastern Mediterranean). J. Geophys. Res. Oceans 108, 277–278. doi: 10.1029/2002JC001541
Chang J., Chung C. C., Gong G. C. (1996). Influences of cyclones on chlorophyll a concentration and synechococcus abundance in a subtropical western pacific coastal ecosystem. Mar. Ecol. Prog. Ser. 140, 199–205. doi: 10.3354/meps140199
Chen Y. L. L., Chen H. Y., Jan S., Tuo S. H. (2009b). Phytoplankton productivity enhancement and assemblage change in the upstream kuroshio after typhoons. Mar. Ecol. Prog. Ser. 385, 111–126. doi: 10.3354/meps08053
Chen B., Liu H., Landry M., Chen M., Sun J., Shek L., et al. (2009a). Estuarine nutrient loading affects phytoplankton growth and microzooplankton grazing at two contrasting sites in Hong Kong coastal waters. Mar. Ecol. Prog. Ser. 379, 77–90. doi: 10.3354/meps07888
Chung C. C., Gong G. C., Hung C. C. (2012). Effect of typhoon morakot on microphytoplankton population dynamics in the subtropical Northwest pacific. Mar. Ecol. Prog. Ser. 448, 39–49. doi: 10.3354/meps09490
Clarke L. J., Bestley S., Bissett A., Deagle B. E. (2019). A globally distributed syndiniales parasite dominates the southern ocean micro-eukaryote community near the sea-ice edge. ISME J. 13, 734–737. doi: 10.1038/s41396-018-0306-7
Cotner J., James B., Wetzel R. G. (1992). Uptake of dissolved inorganic and organic bphosphorus compounds by phytoplankton and bacterioplankton. Limnol. Oceangr. 37, 232–243. doi: 10.4319/lo.1992.37.2.0232
Cunliffe M., Whiteley A. S., Newbold L., Oliver A., Schäfer H., Murrell J. C. (2009). Comparison of bacterioneuston and bacterioplankton dynamics during a phytoplankton bloom in a fjord mesocosm. Appl. Environ. Microbiol. 75, 7173–7181. doi: 10.1128/aem.01374-09
Deng Z., Zhao Y. (2020). Impact of tidal mixing on water mass properties and circulation in the bohai Sea: A typhoon case. J. MARINE. Syst. 206, 103338. doi: 10.1016/j.jmarsys.2020.103338
de Vargas C., Audic S., Henry N., Decelle J., Mahé F., Logares R., et al. (2015). Eukaryotic plankton diversity in the sunlit ocean. Science 348 (6237), 1261605. doi: 10.1126/science.1261605
Edgcomb V. P., Kysela D. T., Teske A., de Vera Gomez A., Sogin M. L. (2002). Benthic eukaryotic diversity in the guaymas basin hydrothermal vent environment. Proc. Natl. Acad. Sci. U. S. A. 99, 7658–7662. doi: 10.1073/pnas.062186399
Elwood H. J., Olsen G. J., Sogin M. L. (1985). The small-subunit ribosomal RNA gene sequences from the hypotrichous ciliates oxytricha nova and stylonychia pustulata. Mol. Biol. Evol. 2, 399–410. doi: 10.1093/oxfordjournals.molbev.a040362
Espinoza-González O., Figueiras F. G., Crespo B. G., Teixeira I. G., Castro C. G. (2012). Autotrophic and heterotrophic microbial plankton biomass in the NW Iberian upwelling: seasonal assessment of metabolic balance. Aquat. Microb. Ecol. 67, 77–89. doi: 10.3354/ame01584
Gaul W., Antia A. N., Koeve W. (1999). Microzooplankton grazing and nitrogen supply of phytoplankton growth in the temperate and subtropical northeast Atlantic. Mar. Ecol. Prog. Ser. 189, 93–104. doi: 10.3354/MEPS189093
Giner C. R., Pernice M. C., Balagué V., Duarte C. M., Gasol J. M., Logares R., et al. (2020). Marked changes in diversity and relative activity of picoeukaryotes with depth in the world ocean. ISME J. 14, 437–449. doi: 10.1038/s41396-019-0506-9
Gong F., Ji Q., Li G., Yin K., Gong J. (2022). Diversity and distribution of bacterioplankton in the coastal upwelling waters off hainan island, China. Acta Oceanol. Sin. 41, 76–85. doi: 10.1007/s13131-021-1807-1
Gong F., Li G., Wang Y., Liu Q., Huang F., Yin K., et al. (2020). Spatial shifts in size structure, phylogenetic diversity, community composition and abundance of small eukaryotic plankton in a coastal upwelling area of the northern south China Sea. J. Plankton Res. 42, 650–667. doi: 10.1093/plankt/fbaa046
Gran-Stadniczeñko S., Egge E., Hostyeva V., Logares R., Eikrem W., Edvardsen B. (2019). Protist diversity and seasonal dynamics in skagerrak plankton communities as revealed by metabarcoding and microscopy. J. Eukaryot. Microbiol. 66, 494–513. doi: 10.1111/jeu.12700
Guillou L., Bachar D., Audic S., Bass D., Berney C., Bittner L., et al. (2013). The protist ribosomal reference database (PR2): a catalog of unicellular eukaryote small sub-unit rRNA sequences with curated taxonomy. Nucleic Acids Res. 41, D597–D604. doi: 10.1093/nar/gks1160
Hanschen E., Starkenburg S. (2020). The state of algal genome quality and diversity. Algal Res. 50, 101968. doi: 10.1016/j.algal.2020.101968
Hernández-Ruiz M., Barber-Lluch E., Prieto A., Álvarez-Salgado X. A., Logares R., Teira E. (2018). Seasonal succession of small planktonic eukaryotes inhabiting surface waters of a coastal upwelling system. Environ. Microbiol. 20, 2955–2973. doi: 10.1111/1462-2920.14313
Hingsamer P., Peeters F., Hofmann H. (2014). The consequences of internal waves for phytoplankton focusing on the distribution and production of planktothrix rubescens. PloS One 9, e104359. doi: 10.1371/journal.pone.0104359
Hu S. K., Campbell V., Connell P., Gellene A. G., Liu Z., Terrado R., et al. (2016). Protistan diversity and activity inferred from RNA and DNA at a coastal ocean site in the eastern north pacific. FEMS Microbiol. Ecol. 92, fiw050. doi: 10.1093/femsec/fiw050
Huisman J., Pham Thi N. N., Karl D. M., Sommeijer B. (2006). Reduced mixing generates oscillations and chaos in the oceanic deep chlorophyll maximum. Nature 439, 322–325. doi: 10.1038/nature04245
Jiao N., Herndl G. J., Hansell D. A., Benner R., Kattner G., Wilhelm S. W., et al. (2010). Microbial production of recalcitrant dissolved organic matter: long-term carbon storage in the global ocean. Nat. Rev. Microbiol. 8, 593–599. doi: 10.1038/nrmicro2386-c5
Johnson K., Riser S., Karl D. (2010). Nitrate supply from deep to near-surface waters of the north pacific subtropical gyre. Nature 465, 1062–1065. doi: 10.1038/nature09170
Li W., McLaughlin F., Lovejoy C., Carmack E. (2009). Smallest algae thrive as the Arctic ocean freshens. Science 326, 539. doi: 10.1126/science.1179798
Liang W.-D., Yang Y. J., Tang T. Y., Chuang W.-S. (2008). Kuroshio in the Luzon strait. J. Geophys. Res. Oceans 113, C08048. doi: 10.1029/2007JC004609
Linacre L., Lara-Lara R., Camacho-Ibar V., Herguera J., Bazán-Guzmán C., Ferreira V. (2015). Distribution pattern of picoplankton carbon biomass linked to mesoscale dynamics in the southern gulf of Mexico during winter conditions. Deep Sea Res. I 106, 55–67. doi: 10.1016/j.dsr.2015.09.009
Liu K. K., Chao S. Y., Shaw P. T., Gong G. C., Chen C. C., Tang T. Y. (2002). Monsoon-forced chlorophyll distribution and primary production in the south China Sea: observations and a numerical study. Deep Sea Res. I 49, 1387–1412. doi: 10.1016/S0967-0637(02)00035-3
Liu X., Huang B., Liu Z., Wang L., Wei H., Li C., et al. (2012). High-resolution phytoplankton diel variations in the summer stratified central yellow Sea. J. Oceangr. 68, 913–927. doi: 10.1007/s10872-012-0144-6
López-García P., Philippe H., Gail F., Moreira D. (2003). Autochthonous eukaryotic diversity in hydrothermal sediment and experimental microcolonizers at the mid-Atlantic ridge. Proc. Natl. Acad. Sci. U. S. A. 100, 697–702. doi: 10.1073/pnas.0235779100
Mackey K., Rivlin T., Grossman A. R., Post A. F., Paytan A. (2009). Picophytoplankton responses to changing nutrient and light regimes during a bloom. Mar. Biol. 156, 1531–1546. doi: 10.1007/s00227-009-1185-2
Marie D., Simon N., Guillou L., Partensky F., Vaulot D. (2000). In living color: Protocols in flow cytometry and cell sorting. Eds. Diamond R. A., Demaggio S. (Berlin, Heidelberg: Springer Berlin Heidelberg), 421–454. doi: 10.1007/978-3-642-57049-0_34
Massana R. (2011). Eukaryotic picoplankton in surface oceans. Annu. Rev. Microbiol. 65, 91–110. doi: 10.1146/annurev-micro-090110-102903
Metfies K., von Appen W. J., Kilias E., Nicolaus A., Nöthig E. M. (2016). Biogeography and photosynthetic biomass of Arctic marine pico-eukaroytes during summer of the record Sea ice minimum 2012. PloS One 11, e0148512. doi: 10.1371/journal.pone.0148512
Nan F., Xue H., Yu F. (2015). Kuroshio intrusion into the south China Sea: A review. Prog. Oceanogr. 137, 314–333. doi: 10.1016/j.pocean.2014.05.012
Partensky F., Hess W. R., Vaulot D. (1999). Prochlorococcus, a marine photosynthetic prokaryote of global significance. Microbiol. Mol. Biol. Rev. 63, 106–127. doi: 10.1128/mmbr.63.1.106-127.1999
Piwosz K., Całkiewicz J., Gołębiewski M., Creer S. (2018). Diversity and community composition of pico- and nanoplanktonic protists in the vistula river estuary (Gulf of gdańsk, Baltic Sea). Estuar. Coast. Shelf Sci. 127–128. doi: 10.1016/j.ecss.2018.04.013
Quast C., Pruesse E., Yilmaz P., Gerken J., Schweer T., Yarza P., et al. (2013). The SILVA ribosomal RNA gene database project: improved data processing and web-based tools. Nucleic Acids Res. 41, D590–D596. doi: 10.1093/nar/gks1219
Ramond P., Sourisseau M., Simon N., Romac S., Schmitt S., Rigaut-Jalabert F., et al. (2019). Coupling between taxonomic and functional diversity in protistan coastal communities. Environ. Microbiol. 21, 730–749. doi: 10.1111/1462-2920.14537
Treusch A. H., Demir-Hilton E., Vergin K. L., Worden A. Z., Carlson C. A., Donatz M. G., et al. (2012). Phytoplankton distribution patterns in the northwestern Sargasso Sea revealed by small subunit rRNA genes from plastids. ISME J. 6, 481–492. doi: 10.1038/ismej.2011.117
Tsuchiya K., Kuwahara V. S., Yoshiki T., Nakajima R., Miyaguchi H., Kumekawa N., et al. (2013). Phytoplankton community response and succession in relation to typhoon passages in the coastal waters of Japan. J. Plankton Res. 36, 424–438. doi: 10.1093/plankt/fbt127
Varkey D., Mazard S., Jeffries T. C., Hughes D. J., Seymour J., Paulsen I. T., et al. (2018). Stormwater influences phytoplankton assemblages within the diverse, but impacted Sydney harbour estuary. PloS One 13, e0209857. doi: 10.1371/journal.pone.0209857
Walters W., Hyde E. R., Berg-Lyons D., Ackermann G., Humphrey G., Parada A., et al. (2016). Improved bacterial 16S rRNA gene (V4 and V4-5) and fungal internal transcribed spacer marker gene primers for microbial community surveys. Msystems 1, e00009-15. doi: 10.1128/mSystems.00009-15
Wong G. T. F., Tseng C.-M., Wen L. S., Chung S. W. (2007). Nutrient dynamics and n-anomaly at the SEATS station. Deep Sea Res. II 54, 1528–1545. doi: 10.1016/j.dsr2.2007.05.011
Wu C.-R., Wang Y.-L., Lin Y.-F., Chao S.-Y. (2017). Intrusion of the kuroshio into the south and East China seas. Sci. Rep. 7, 7895. doi: 10.1038/s41598-017-08206-4
Keywords: typhoon, bloom, phytoplankton, flow cytometry (FCM), high throughput sequencing, DCM
Citation: Gong F, Zhang Y, Xie W, Wu X, Zhang H, Huang S, Gong J and Yin K (2023) Response of microbial community of surface and deep chlorophyll maximum to nutrients and light in South China Sea. Front. Mar. Sci. 10:1122765. doi: 10.3389/fmars.2023.1122765
Received: 13 December 2022; Accepted: 07 February 2023;
Published: 09 March 2023.
Edited by:
Zhengui Wang, College of William & Mary, United StatesReviewed by:
Huizi Dong, Shanghai Jiao Tong University, ChinaYong Jiang, Ocean University of China, China
Copyright © 2023 Gong, Zhang, Xie, Wu, Zhang, Huang, Gong and Yin. This is an open-access article distributed under the terms of the Creative Commons Attribution License (CC BY). The use, distribution or reproduction in other forums is permitted, provided the original author(s) and the copyright owner(s) are credited and that the original publication in this journal is cited, in accordance with accepted academic practice. No use, distribution or reproduction is permitted which does not comply with these terms.
*Correspondence: Kedong Yin, eWlua2RAbWFpbC5zeXN1LmVkdS5jbg==; Jun Gong, Z29uZ2oyN0BtYWlsLnN5c3UuZWR1LmNu