 Xianling Qin
 Xianyun Chen2
 Changping Chen
95% of researchers rate our articles as excellent or good
Learn more about the work of our research integrity team to safeguard the quality of each article we publish.
Find out more
ORIGINAL RESEARCH article
Front. Mar. Sci. , 10 March 2023
Sec. Marine Biogeochemistry
Volume 10 - 2023 | https://doi.org/10.3389/fmars.2023.1120161
Qinzhou Bay is a tropical semiclosed bay with the highest phytoplankton diversity and a high frequency of harmful algal blooms (HABs) in the Guangxi coastal area, located north of the Beibu Gulf. Phaeocystis globosa is a typical HAB species in the Guangxi coastal area, and blooms mainly occur in autumn and winter. The causes of these blooms and the succession of phytoplankton assemblages related to the blooms are complicated and not fully understood. Therefore, a continuous survey was conducted monthly from October 2018 to March 2019 to study the succession of the phytoplankton community in Qinzhou Bay and its relationship with environmental variables in this area. The results revealed that the dynamics of the phytoplankton assemblages varied significantly with time, and P. globosa was the most frequent dominant species in five of these voyages, with the highest cell density of 3.79 ± 1.34 × 10⁶ cells/L in January. Chaetoceros species had a high density and were a dominant species associated with P. globosa in the early stage, while they were replaced by Guinardia striata when the density of P. globosa increased rapidly in January, and the abundance of dinoflagellates increased after the decline in P. globosa. The diversity index indicated that the community structure was more stable from October to December, while the sharp increase in P. globosa in January caused a decline in phytoplankton diversity. The redundancy analysis (RDA) results revealed that the phytoplankton community structure and its variation were mainly affected by hydrological and chemical factors, including DIN/DIP, temperature, DSi, DIP and DSi/DIP. Furthermore, we inferred that phosphorus (P) was the key factor limiting the colony formation of P. globosa, and P limitation prevented the outbreak of blooms. This research may provide more insight into the mechanisms driving and prevention of P. globosa blooms.
Qinzhou Bay is a semiclosed bay located in the northern Beibu Gulf and is considered to have the greatest phytoplankton biodiversity among the six bays in Guangxi, China (Xu, 2012). There are three rivers, the Qinjiang River, Maolingjiang River and Jingujiang River, that flow into Qinzhou Bay. Thus, large amounts of nutrients are discharged through runoff into the seawater. Qinzhou Bay is also an important natural fishing ground and artificial aquaculture base in China (Lin and Zhong, 2014; Lao et al., 2021). In recent years, the amount of pollutants in Qinzhou Bay has increased with the rapid development of industry and the increase in human activities; furthermore, due to poor exchange of water with the sea, more frequent eutrophication events have occurred, and these events have affected the community composition and abundance of phytoplankton and thus increased the incidence of harmful algal blooms (HABs) in Qinzhou Bay (Lan, 2012; Pang et al., 2018; Liu et al., 2020). Among the HABs that have occurred in Qinzhou Bay, the blooms caused by Phaeocystis globosa have attracted the most attention.
P. globosa is an HAB species with a global distribution and is commonly regarded as a nuisance algal species (Blauw et al., 2010; Zhang et al., 2020). This characterization is because P. globosa blooms can cause mass foam accumulation on beaches (Lancelot, 1995; Peperzak, 2002), lead to occasional shellfish mortality(Peperzak and Poelman, 2008) and produce dimethyl-sulfide precursors that may promote acid rain (Liss et al., 1994). Moreover, P. globosa is well known for its complex polymorphic life cycle, including flagellated cells and colonies. During the occurrence of blooms, most cells appear in the form of giant colonies. Blooms caused by P. globosa in the coastal waters of Guangxi were first recorded in 2011 and they have occurred frequently at different scales in the following years (Cao et al., 2017; Qin et al., 2018; Hu et al., 2019; Jiang, 2019). In late 2014, the viscous colonies caused by the bloom clogged the cooling water system at a nuclear plant located on the west coast of Qinzhou Bay, thus seriously threatening the safety of the nuclear plant (He et al., 2019a; Kang et al., 2020b). Therefore, there is an urgent need to understand the mechanisms driving the occurrence of P. globosa blooms to mitigate or prevent blooms to reduce the damage caused by this marine disaster.
Phytoplankton are responsible for nearly half of the Earth’s annual net primary production and play an extraordinary role in maintaining the ecological balance and material circulation of marine ecosystems, so their dynamic change is an important component of marine ecology research (Field et al., 1998; Cloern and Dufford, 2005; Pitta et al., 2009; Silva et al., 2012). As a typical estuary semienclosed bay, the nutrient status, phytoplankton diversity and distribution, phytoplankton seasonal variation and its relationship with environmental factors have been studied extensively in Qinzhou Bay (Jiang et al., 2012; Lan, 2012; Xu et al., 2012; Lin and Zhong, 2014; Luo et al., 2019; Liu et al., 2020). There are few previous studies of P. globosa blooms in Qinzhou Bay (Mo et al., 2022). Therefore, it is important to investigate the succession of phytoplankton assemblages, including P. globosa, its environment and its role in the ecosystems in the area. Algal blooms are events with rapid production and accumulation of phytoplankton biomass and are usually responses to physical forcings (Cloern, 1996), abundant nutrients and optimum sunlight intensity (Yogaswara, 2020), and the existence of bloom-forming species is prerequisite for the occurrence of HABs. Studying the response of the phytoplankton community to environmental physical and chemical factors during successive cruises is essential to understanding the key factors that control P. globosa blooms. Investigations of phytoplankton communities associated with Phaeocystis blooms are essential to understand the mechanism of Phaeocystis blooms and to identify indicators that can be used to the predict and provide early warning of blooms (Wang et al., 2021a).
In recent years, P. globosa blooms have typically occurred in the coastal waters of Guangxi Province from November to March, which is thought to be the key monitoring and control period of P. globosa (He et al., 2019b). According to the statistics of P. globosa blooms in Chinese coastal waters from 1997 to 2018, 80.6% of these blooms occurred in the South China Sea, and 72.5% occurred in the period from November to March (Wang et al., 2021b). In this study, six cruises were carried out monthly from October 2018 to March 2019, which covered the period with recurrent outbreaks of P. globosa blooms in the coastal area of Guangxi, to analyze the temporal and spatial variations in nutrients and phytoplankton community structure. The objectives of this study were to characterize the succession of phytoplankton assemblages and to detect the key factors affecting the dynamics of phytoplankton assemblages and driving P. globosa blooms. Thus, this study improves our understanding of the mechanisms underlying the formation of P. globosa blooms and provides a basis for the prevention and control of these blooms.
Six cruises were carried out from October 2018 to March 2019 in Qinzhou Bay (21.55–21.76°N, 108.53–108.72°E). Fifteen stations were set up for sampling during each cruise (Figure 1). Water samples were collected from a depth of approximately 0.5 m at each station using 2.5 L Niskin bottles for the determination of the nutrient concentrations, phytoplankton biomass and species composition.
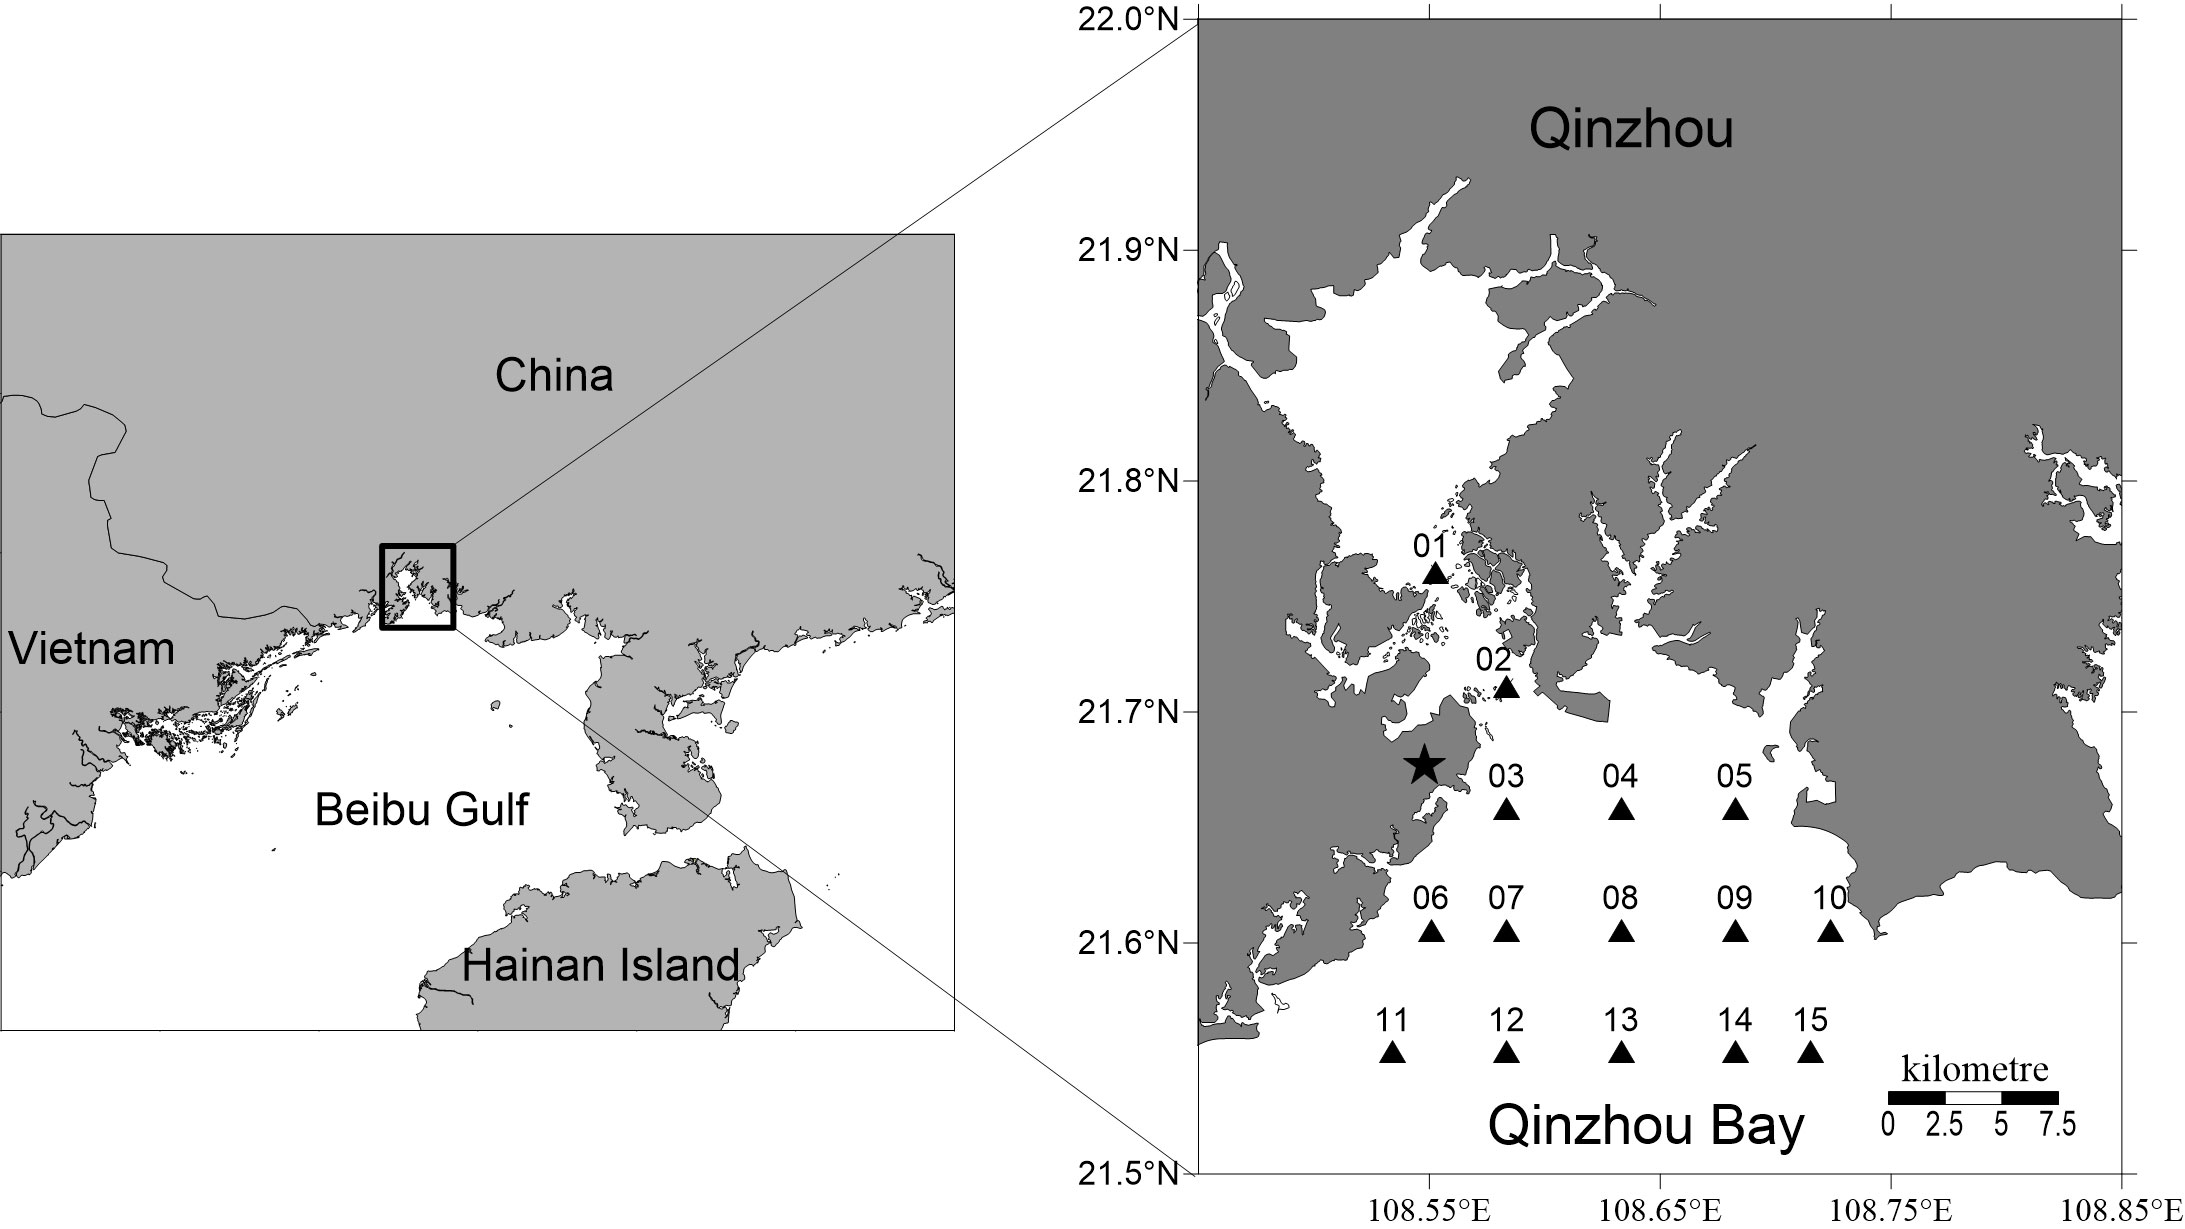
Figure 1 Map showing the locations of sampling stations in Qinzhou Bay in the northern Beibu Gulf from October 2018 to March 2019. The black star indicates the location of the nuclear power plant in Fangchenggang.
A multiparameter water quality analyzer kit (JFE AAQ171, Japan) was used to measure water temperature, pH, salinity, and dissolved oxygen (DO). The pH and DO sensors was calibrated before each cruise according to the calibration procedures provided by the manufacturer. Two type of standard solution are used for calibration on pH sensor, including standard 7 and standard 9. When the DO sensor is to be celibrated, fill a dedicated container with half full of water and prepare a 100% saturated water by air pump, then submerge the instrument in it. The steps specified for the calibration were carried out in accordance with the instrument communication software user’s guide.
Water samples were filtered through precombusted Whatman GF/F filters (450°C for 4–5 h) and stored at –20°C. The samples were thawed before they were analyzed, and the concentrations of dissolved inorganic nitrogen (DIN, including , , and ), dissolved inorganic phosphate (DIP), and dissolved inorganic silicate (DSi) were analyzed using a flow injection analyzer (Skalar San++ autoanalyzer, Holland).
One-liter seawater samples were mixed with 2% acid Lugol’s solution and concentrated gradually to 20 mL prior to quantification. A 100 μL concentrated sample was transferred to a 0.1 mL counting chamber. Standard methods (inverted microscopy (Olympus BX51) and Utermöhl were used for phytoplankton species identification and cell enumeration.
500 mL of water sample was poured into a white disk in batches, and lit up by a lamp for counting the density of P. globosa colonies. Colony size was roughly recored by a dividing rule. After the sample concentrating steps, the colonies of P. globosa were broke into pieces when they were absorbed back and forth for several times by a pipette. The cell density of P. globosa was calculated as the sum of solitary cells in the water and cells in the colony debris.
The dominant species of phytoplankton were determined according to the dominance index (Y), which was calculated by the following formula:
where Ni is the cell number of the specific species i, fi is the frequency of species i appearing in the survey area, and N is the total cell number of phytoplankton at all stations. Species were defined as dominant species when their Y≥0.02.
In addition to the dominance index, the Shannon-Wiener (Shannon, 1948), Margalef (Margalef, 1968), Simpson (Simpson, 1949) and Pielou’s evenness (Pielou, 1966) diversity indices of phytoplankton species were calculated for the study period.
Seawater samples (1000 mL) were filtered onto Whatman GF/F filters and stored at –20°C. The Chl a concentration was measured by the fluorometric method according to Yentsch and Menzel (1963). Ten milliliters of 90% acetone was added to the tubes with Chl a filters; the tubes were stored for 24 h in the dark at 4°C and then centrifuged at 4000 rpm for 10 min. Fluorescence before and after acidification with 3.7% HCl was recorded using a fluorospectrophotometer (Perkin Elmer LS55, Ex = 470 nm, Em = 680 nm).
One-way ANOVA was performed using SPSS 19 software to compare the difference between sets of parameters among cruises using Tukey’s studentized range test (t test), where a p value of 0.05 was used to determine the significance of the results.
Biological and environmental (BioEnv) analysis was performed using R Studio software to quantify the relative contributions of the abiotic variables to the observed patterns of phytoplankton for each cruise, and then the best models with the highest correlations were obtained.
Principal component analysis (PCA) was used to explore the influences of different sampling stations on environmental variables. Redundancy analysis (RDA) was used to evaluate the influence of abiotic variables on the abundances of the dominant species. Only those species with the 10 highest dominance index values (Y) were selected for the ordination analysis. All canonical axes were applied to evaluate the significant variables under analysis with Monte Carlo permutation tests (499 permutations). The above mentioned analyses were performed using Canoco 5 software.
The water temperature decreased from October to January and then increased from January to March (Figure 2A; Table 1). There were significant differences among the six months (one-way ANOVA, p< 0.01). The area close to the coastline had a lower temperature than the far shore area (Figure S1), which was mainly dependent on latitude. The salinity varied from 15.7 to 31.8 and increased gradually from the inner bay area to the outer area (Figure 2B; Figure S2). The salinity in October was significantly lower than that in any other month except January (one-way ANOVA, p< 0.05, Table 1). The salinity did not show significant variation among the five cruises from November 2018 to March 2019 (one-way ANOVA, p > 0.05). The average pH remained relatively stable throughout the study, varying from 7.97 to 8.14, and the highest average pH was recorded in January (Table 1; Figure 2C). According to the correlation analysis, pH was significantly positively correlated with temperature and salinity (p< 0.01), while it was negatively correlated with DIN, DIP and DSi (p< 0.01). DO was highest in January and then December, and the DO in these months significantly higher than that in the other four months (one-way ANOVA, p< 0.05, Table 1; Figure 2D). The DO was lowest in October when the highest temperature of the study period occurred. In fact, DO was mainly dependent on temperature, as an opposite trend was found between the two parameters (Table 1; Figure 2D).
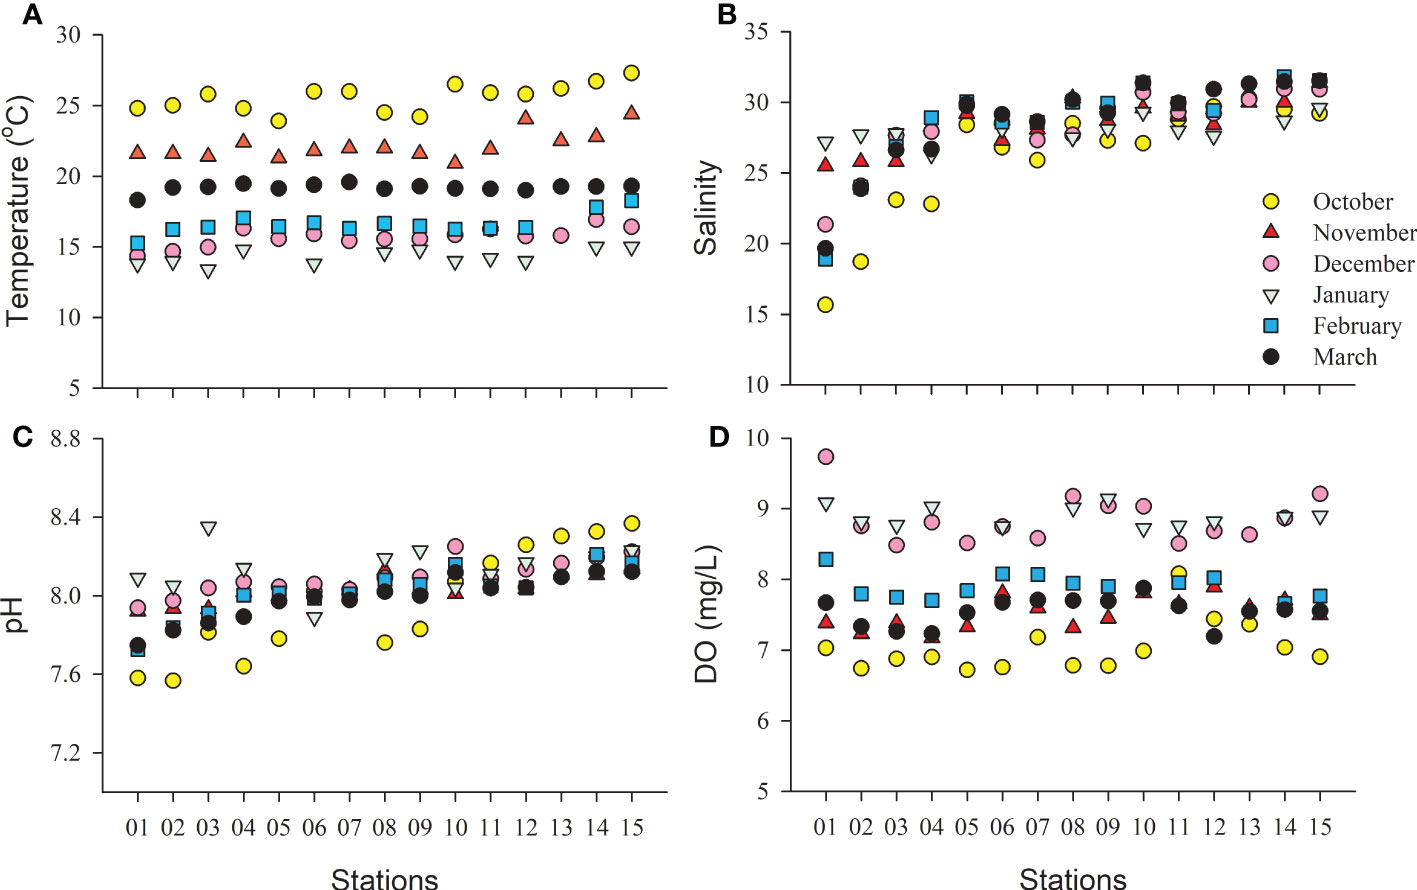
Figure 2 Map showing the temporal and spatial variations in temperature (A, C), salinity (B), pH (C) and dissolved oxygen [(D), mg/L] in the surface waters of the study area from October 2018 to March 2019.
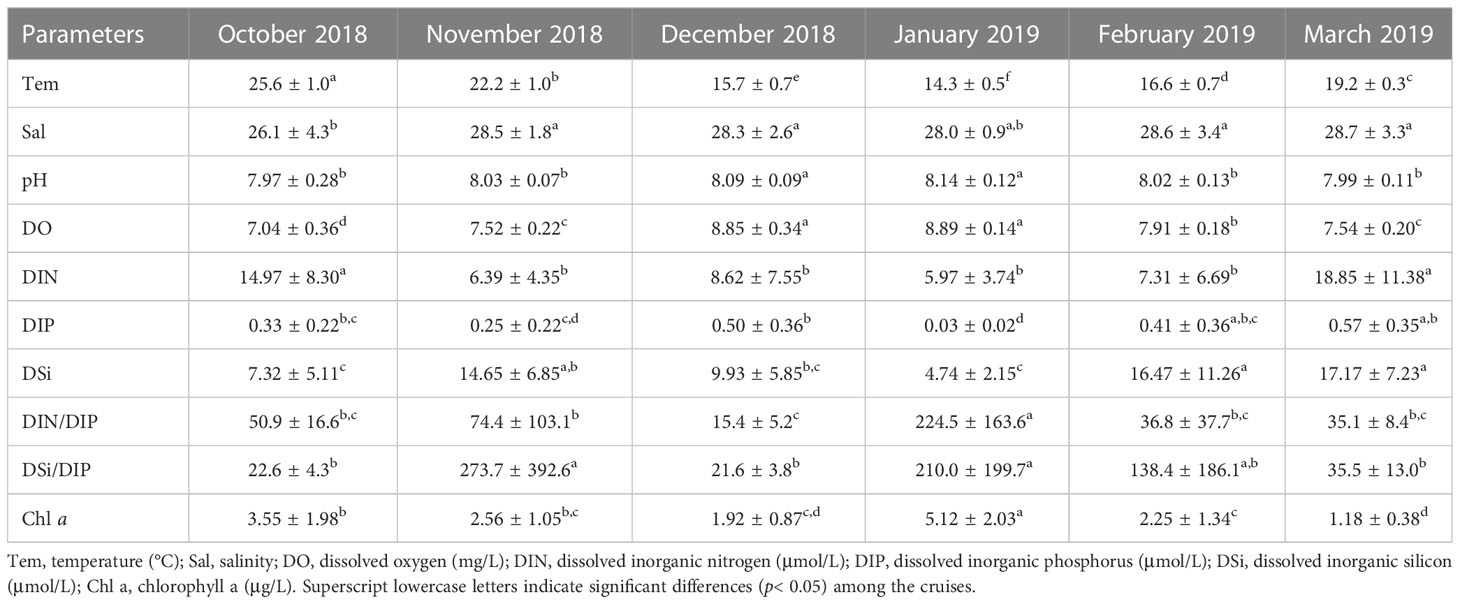
Table 1 Monthly changes in physical and chemical parameters (mean ± SD) in the surface waters of Qinzhou Bay during the six cruises from October 2018 to March 2019.
Except for January 2019, the spatial distributions of DIN, DIP, and DSi were consistent during all the cruises. In contrast to salinity, DIN, DIP and DSi decreased gradually from the inner bay to the outer region (Figures 3–5). The concentrations of all the inorganic nutrients were lowest in January 2019 (Table 1). The average DIN was the highest in March 2019, significantly higher than that in any other month except October 2018 (p< 0.01), and the highest DIN (49.4 μmol/L) was recorded in the surface water of station 1. DIP showed no significant differences among October, November and December 2018 (t test, p > 0.05), but it decreased sharply in January 2019, i.e., below 0.1 μmol/L at all survey stations (Figure 4D), increased gradually from February to March, and reached its highest value in March with an average of 0.57 μmol/L. The DSi in January was significantly lower than that in November, February and March (one-way ANOVA, p< 0.01), while there were no significant differences between January and October or between January and December (one-way ANOVA, p > 0.05).
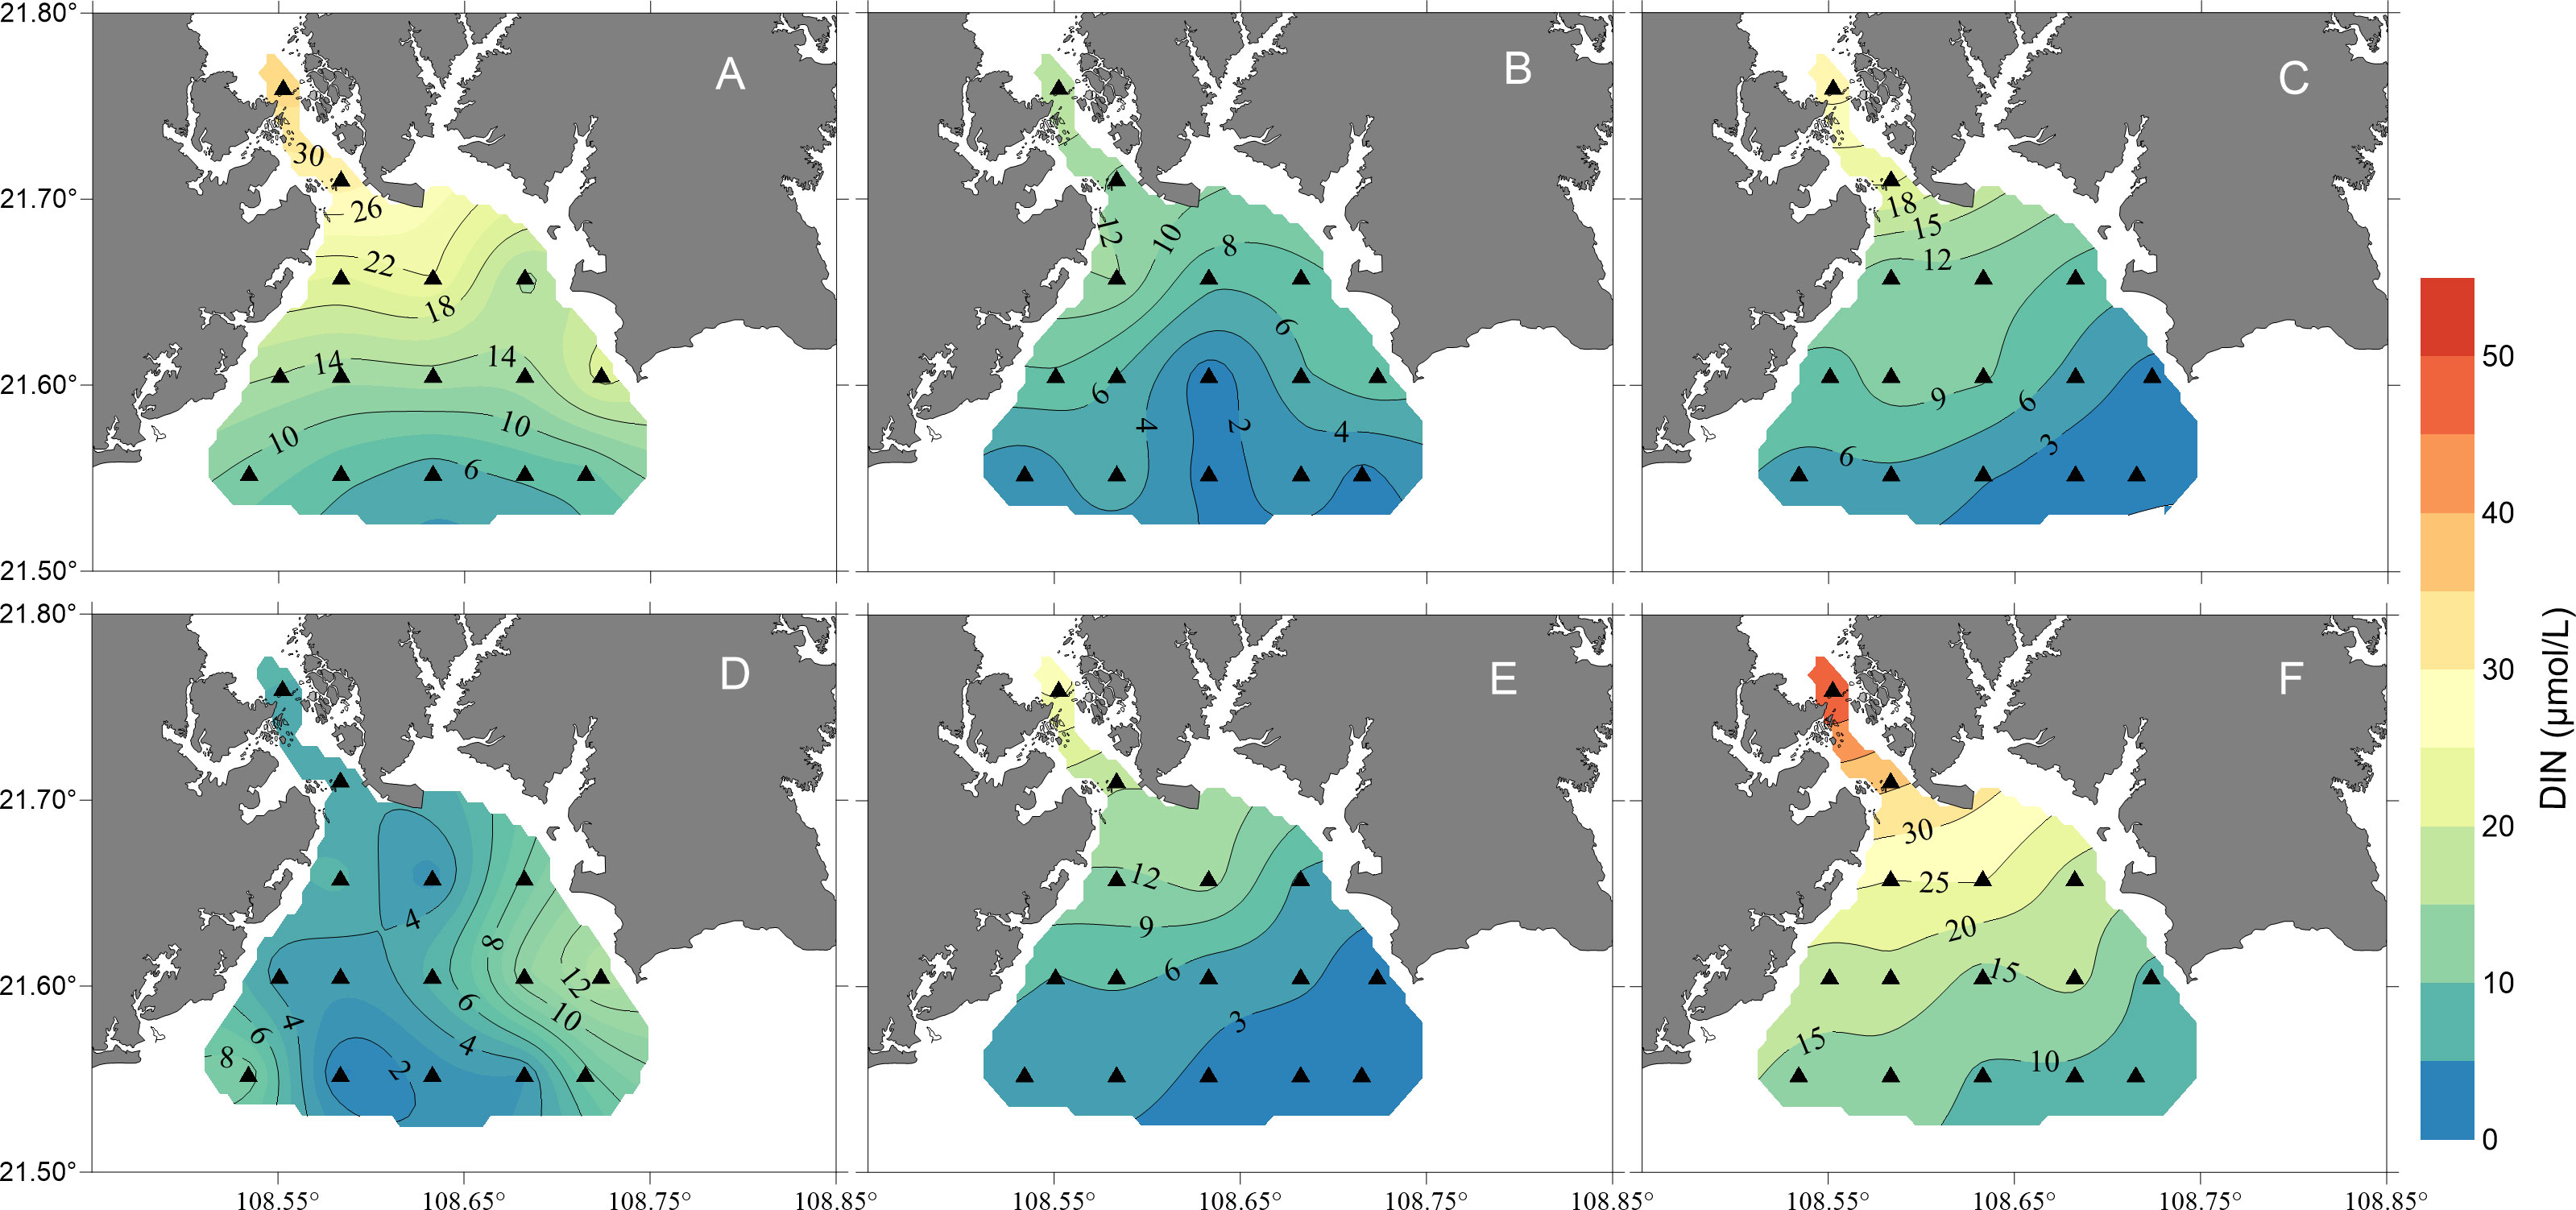
Figure 3 Map showing the temporal and spatial distributions of dissolved inorganic nitrogen (DIN) concentrations (units: μmol/L) in the surface waters of the study area from October 2018 to March 2019 [(A), October 2018; (B), November 2018; (C), December 2018; (D), January 2019; (E), February 2019; (F), March 2019].

Figure 4 Map showing the temporal and spatial distributions of dissolved inorganic phosphorus (DIP) concentrations (units: μmol/L) in the surface waters of the study area from October 2018 to March 2019 [(A), October 2018; (B), November 2018; (C), December 2018; (D), January 2019; (E), February 2019; (F), March 2019].
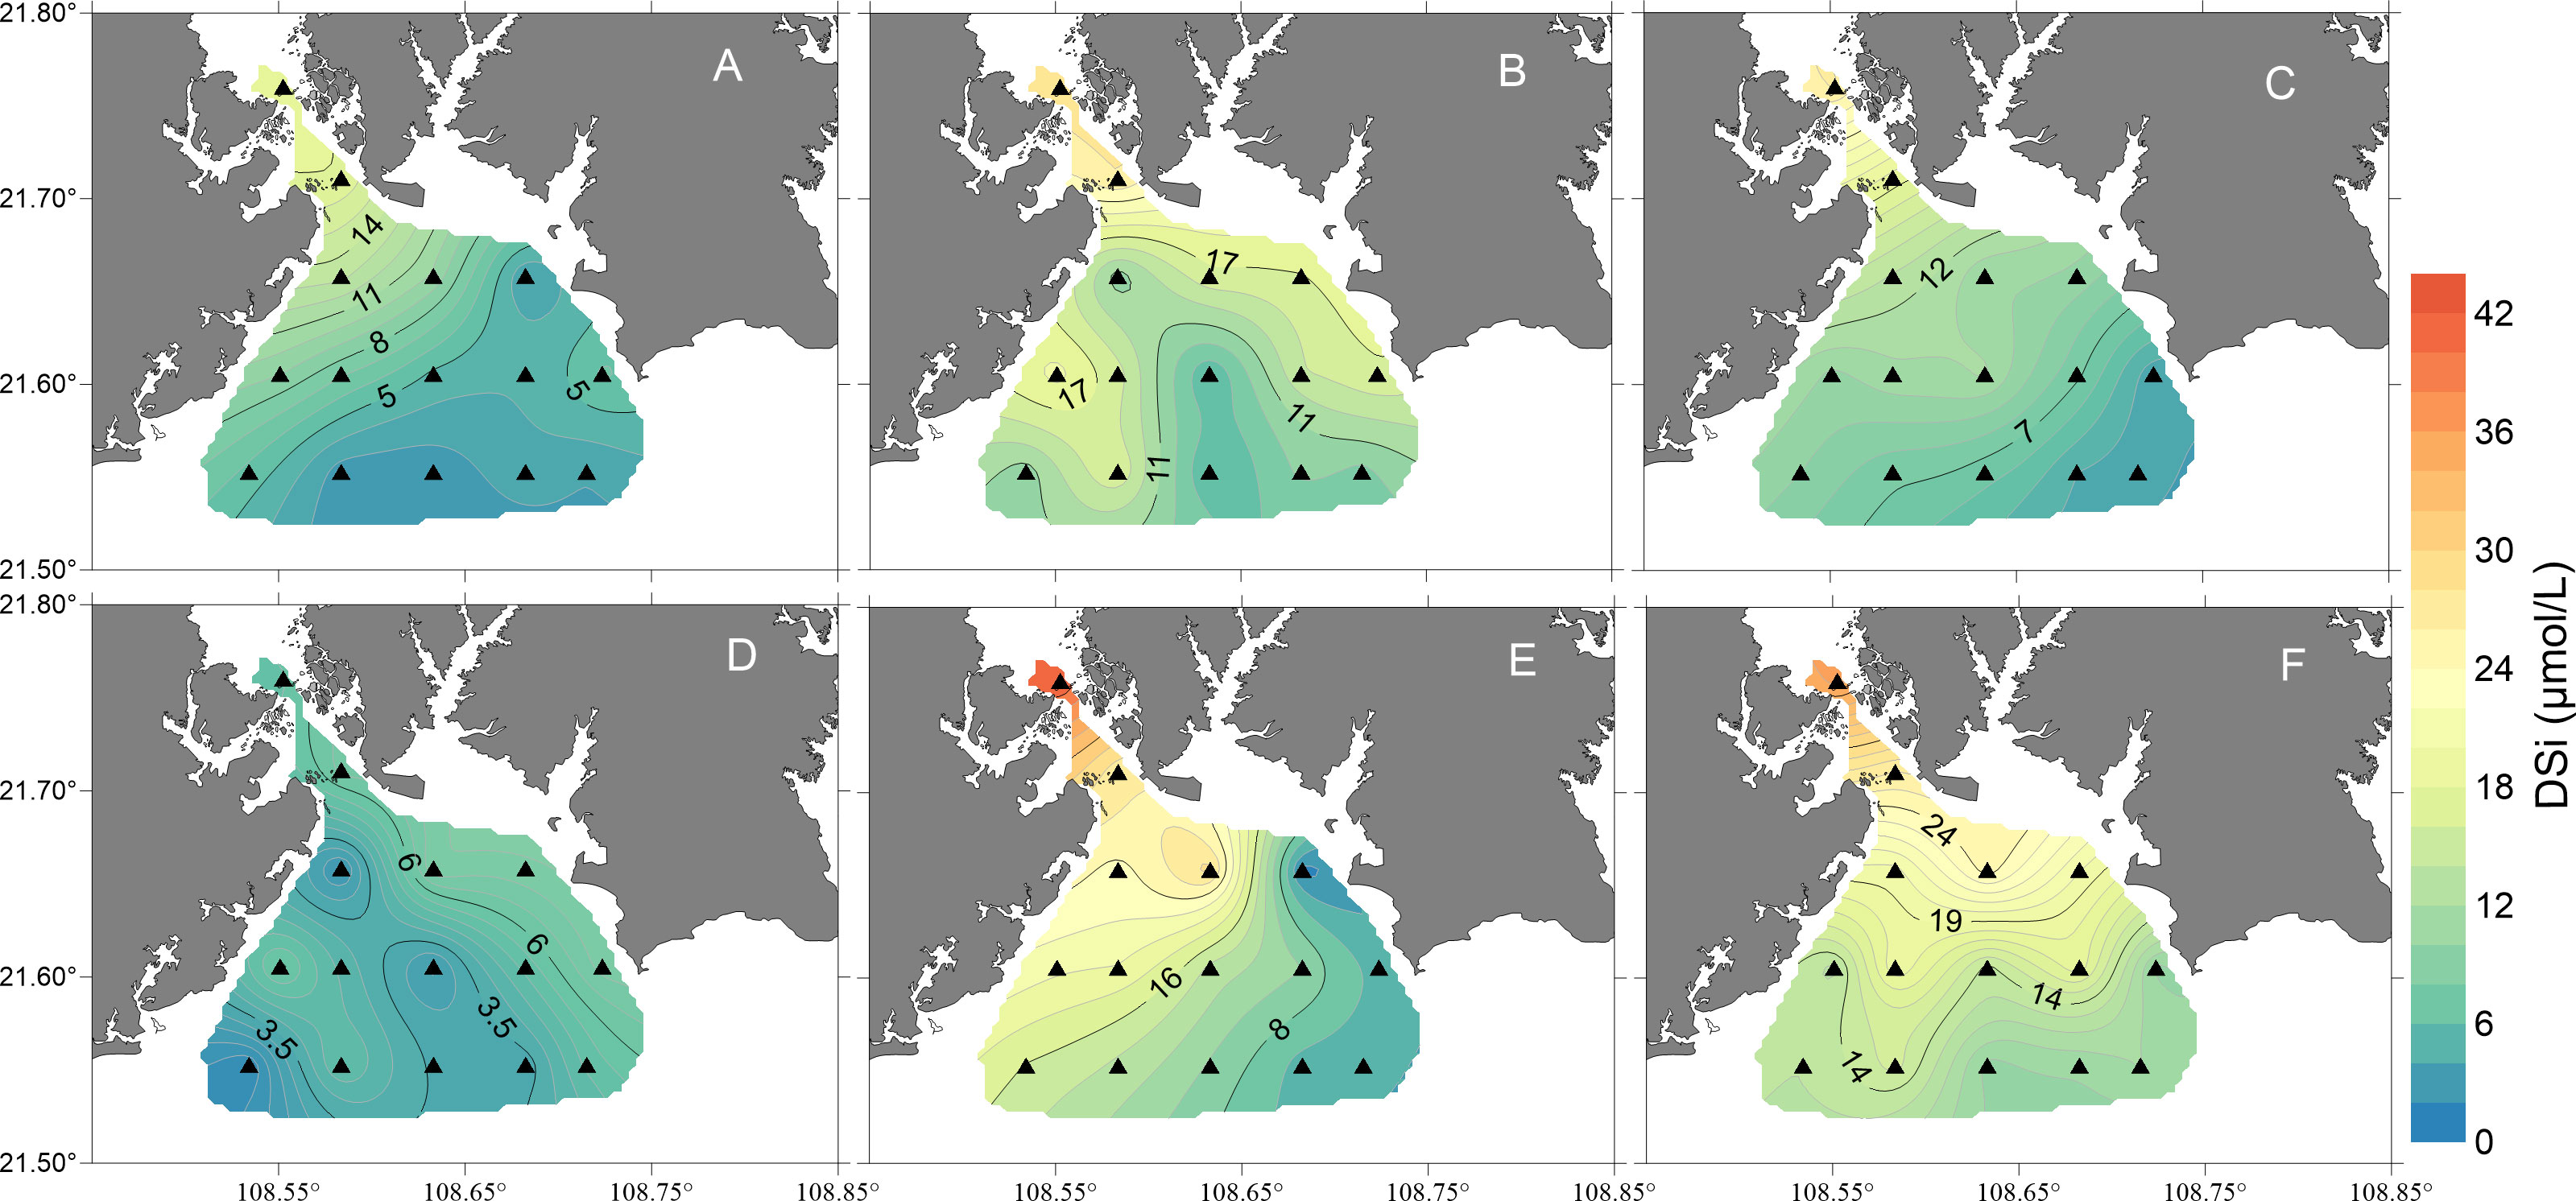
Figure 5 Map showing the temporal and spatial distributions of dissolved inorganic silicate (DSi) concentrations (units: μmol/L) in the surface waters of the study area from October 2018 to March 2019 [(A), October 2018; (B), November 2018; (C), December 2018; (D), January 2019; (E), February 2019; (F), March 2019].
During the study periods, the DIN/DIP values were higher than 22 in all months except December 2018, in which the average DIN/DIP was 15.4 ± 5.2 (Table 1). The average DSi/DIP ratio ranged from 21.6 to 273.7 during the six cruises, which was the same as the DIN/DIP. The DSi/DIP ratio also had the lowest average value in December 2018, while the ratio was higher than 22 in the other five months (Table 1).
The PCA results (Figure 6) showed that the inorganic nutrient (DIN, DIP and DSi) vectors were positively correlated with PCA axis 1, while the salinity, Chl a, pH, DIN/DIP and DSi/DIP vectors were negatively correlated with PCA axis 1. Moreover, DO was positively correlated with PCA axis 2, and the temperature vector was negatively correlated with PCA axis 2. Samples from the six cruises were distributed along PCA axis 2 with obvious differences, showing that temperature and DO were the main ecological constraints that affected the samples on the temporal scale. The distribution of samples in the same cruise was scattered, and samples near the inner bay (especially stations 01-04) were located closer to the DIN, DIP and DSi vectors, illustrating that these samples were richer in inorganic nutrients.
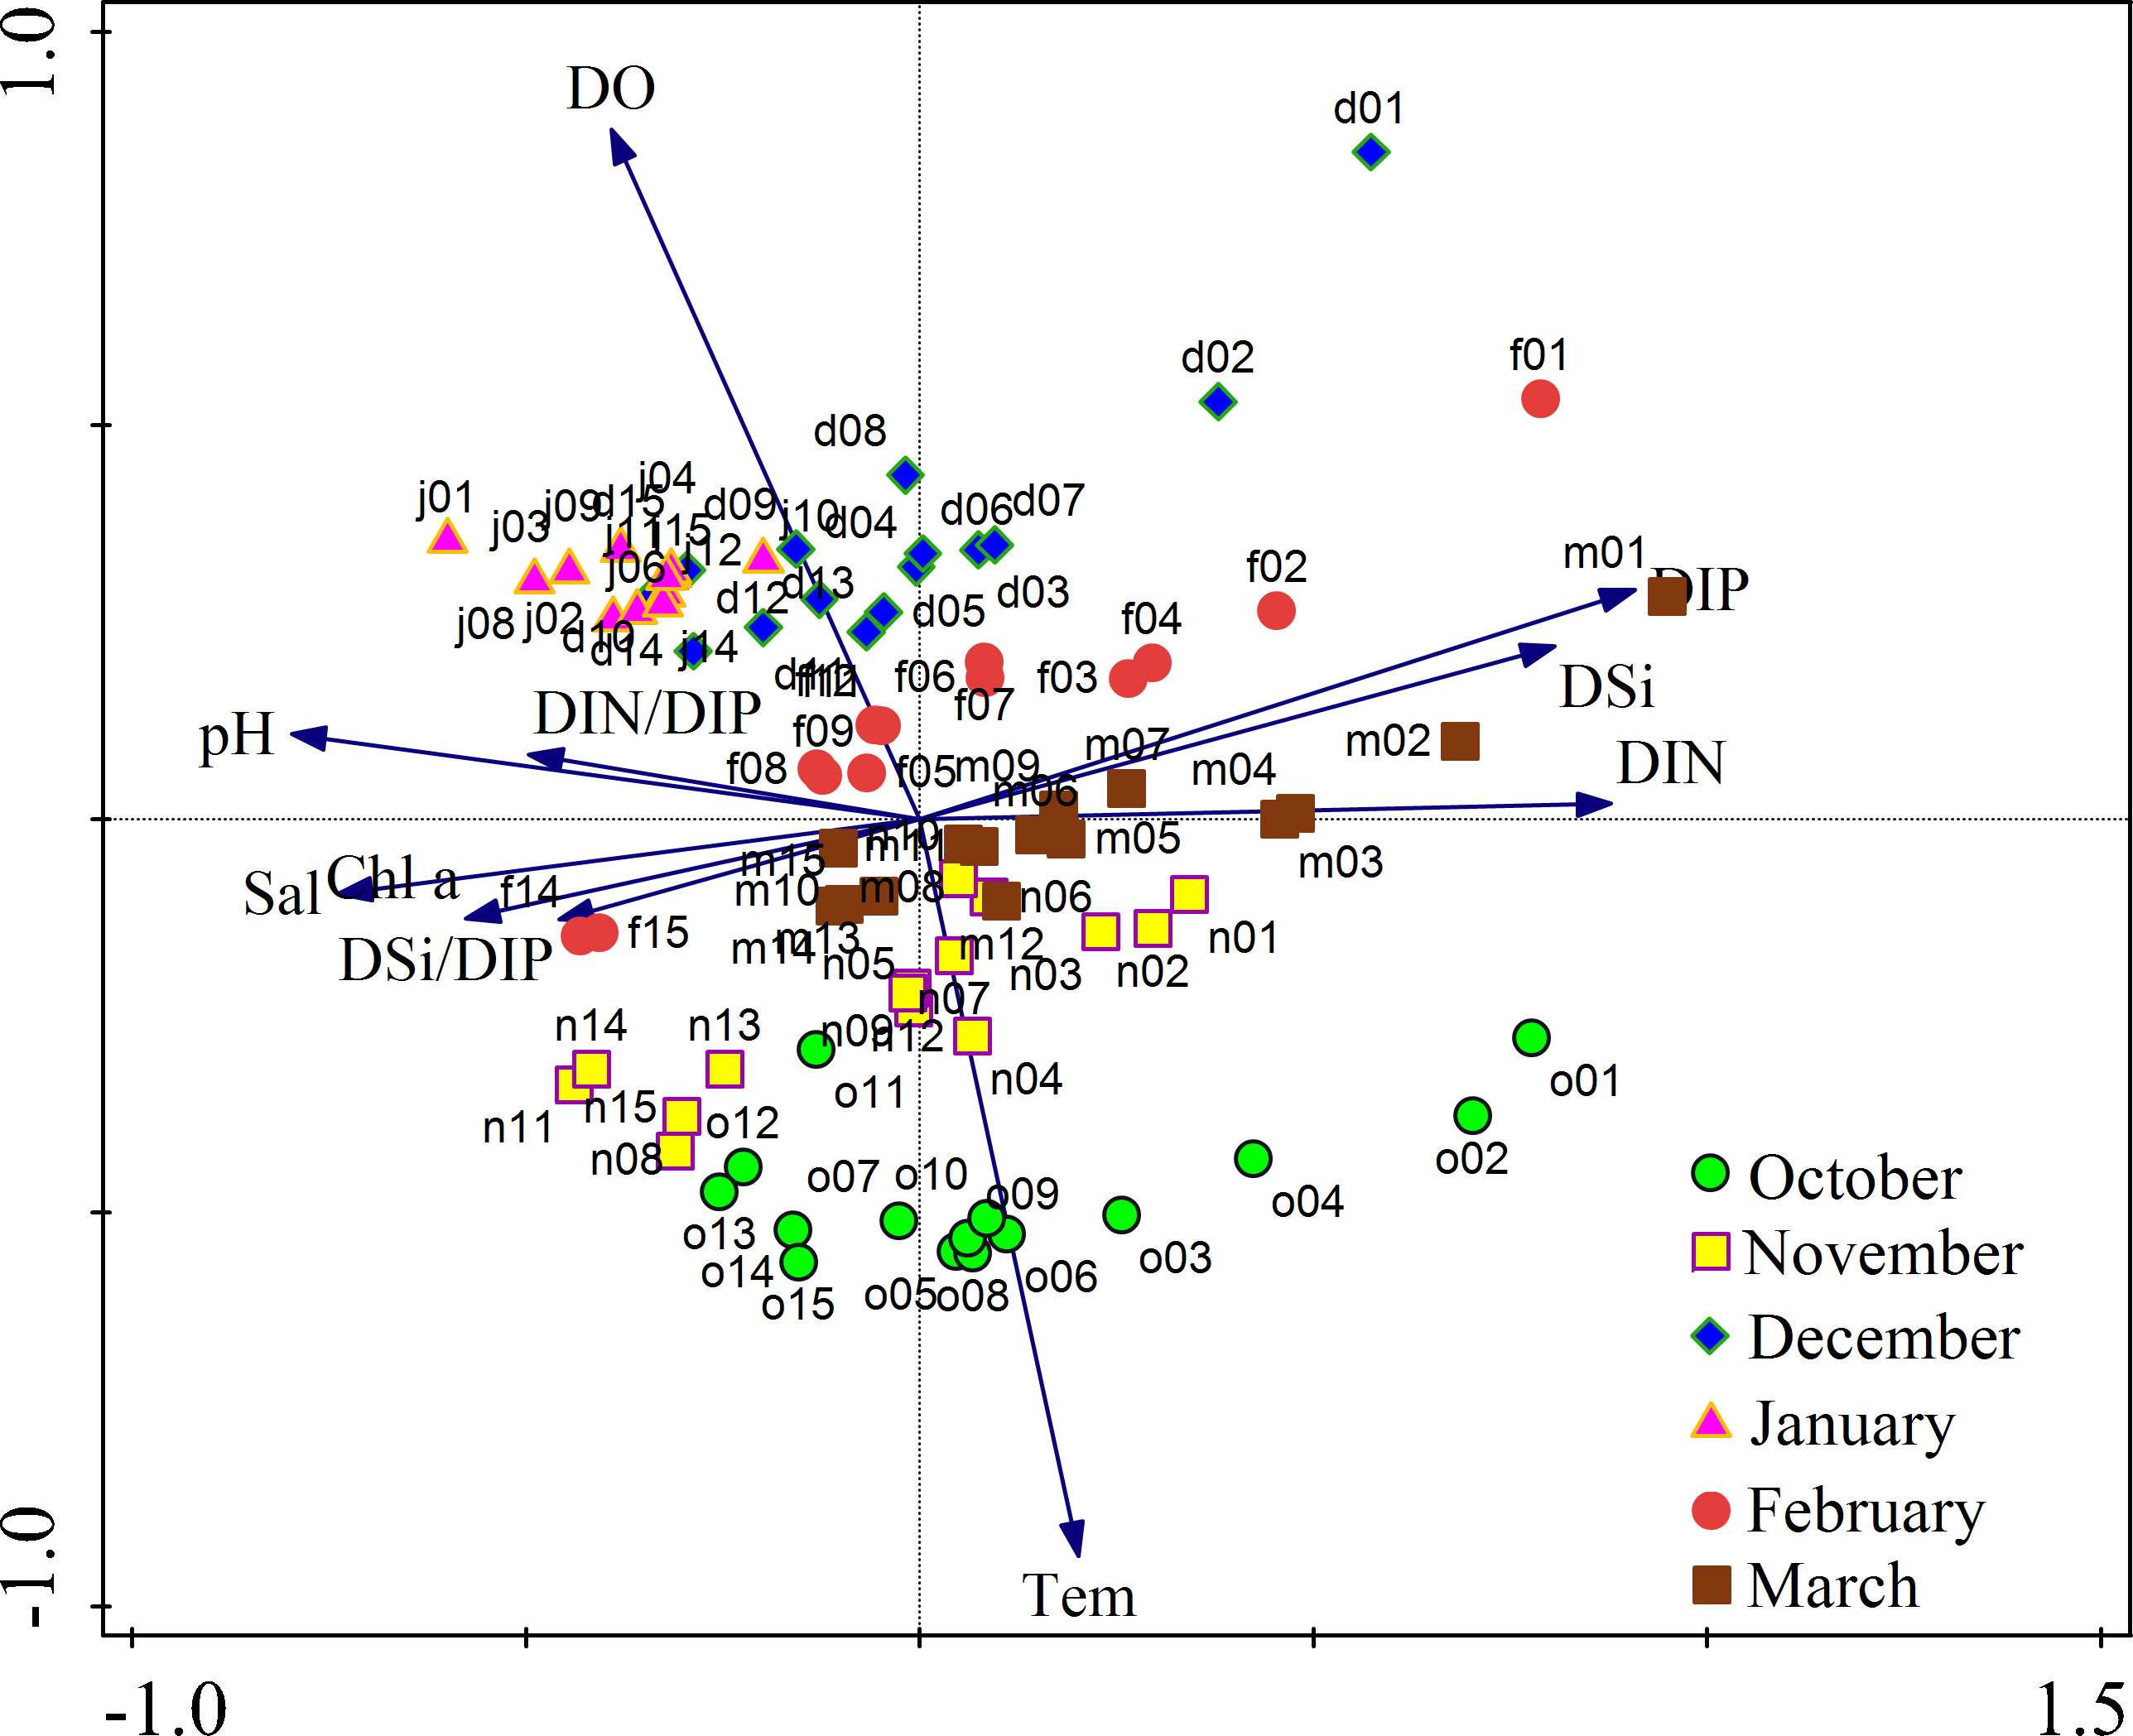
Figure 6 PCA on log10 (n + 1)-transformed environmental parameter data of all the sampling stations during the study period. Different cruise locations are coded with different colored symbols.
The highest average Chl a was observed during the cruise in January, and it was significantly higher than that in any other cruise (Table 1) (one-way ANOVA, p<0.01). Distribution tendencies of Chl a were different between cruises (Figure S3). A significant positive correlation was observed between Chl a and the abundance of phytoplankton (p< 0.01).
A total of 193 species (including unidentified species and varieties) of phytoplankton were found during the six cruises, including 141 diatoms and 43 dinoflagellates. The total species number for each cruise varied from 97 to 126, and the highest and the lowest numbers of species were found in December and January, respectively. Over 75% of the taxa were diatoms in the first five months, and 66.7% were diatoms in March. The average total abundance of phytoplankton varied from 0.3 ± 0.2 × 10⁵ cells/L to 43.4 ± 14.3 × 10⁵ cells/L, and phytoplankton abundance was significantly higher in January than in the other five cruises (t test, p< 0.01). The total phytoplankton abundance was higher in the eastern part of the study area than in the western part during all cruises except in January (Figure 7), while it was the highest at station 3, which was closest to the nuclear power plant, in January (Figure 7D). Diatoms and P. globosa were previously the most abundant algal groups from October to February (Figure 8). The abundance of diatoms varied from 0.2 ± 0.2 × 10⁵ cells/L to 5.4 ± 3.2 × 10⁵ cells/L, accounting for 12.6 ± 6.8% to 90.2 ± 19.7% of the total phytoplankton abundance during the six cruises. The average cell density of P. globosa ranged from 0 to 3.8 ± 1.3 × 10⁶ cells/L and accounted for 0 to 87.0% of the total abundance during the six cruises. The highest cell densities of both diatoms and P. globosa appeared in January 2019, and they were significantly higher than those in other cruises (t test, p< 0.01).
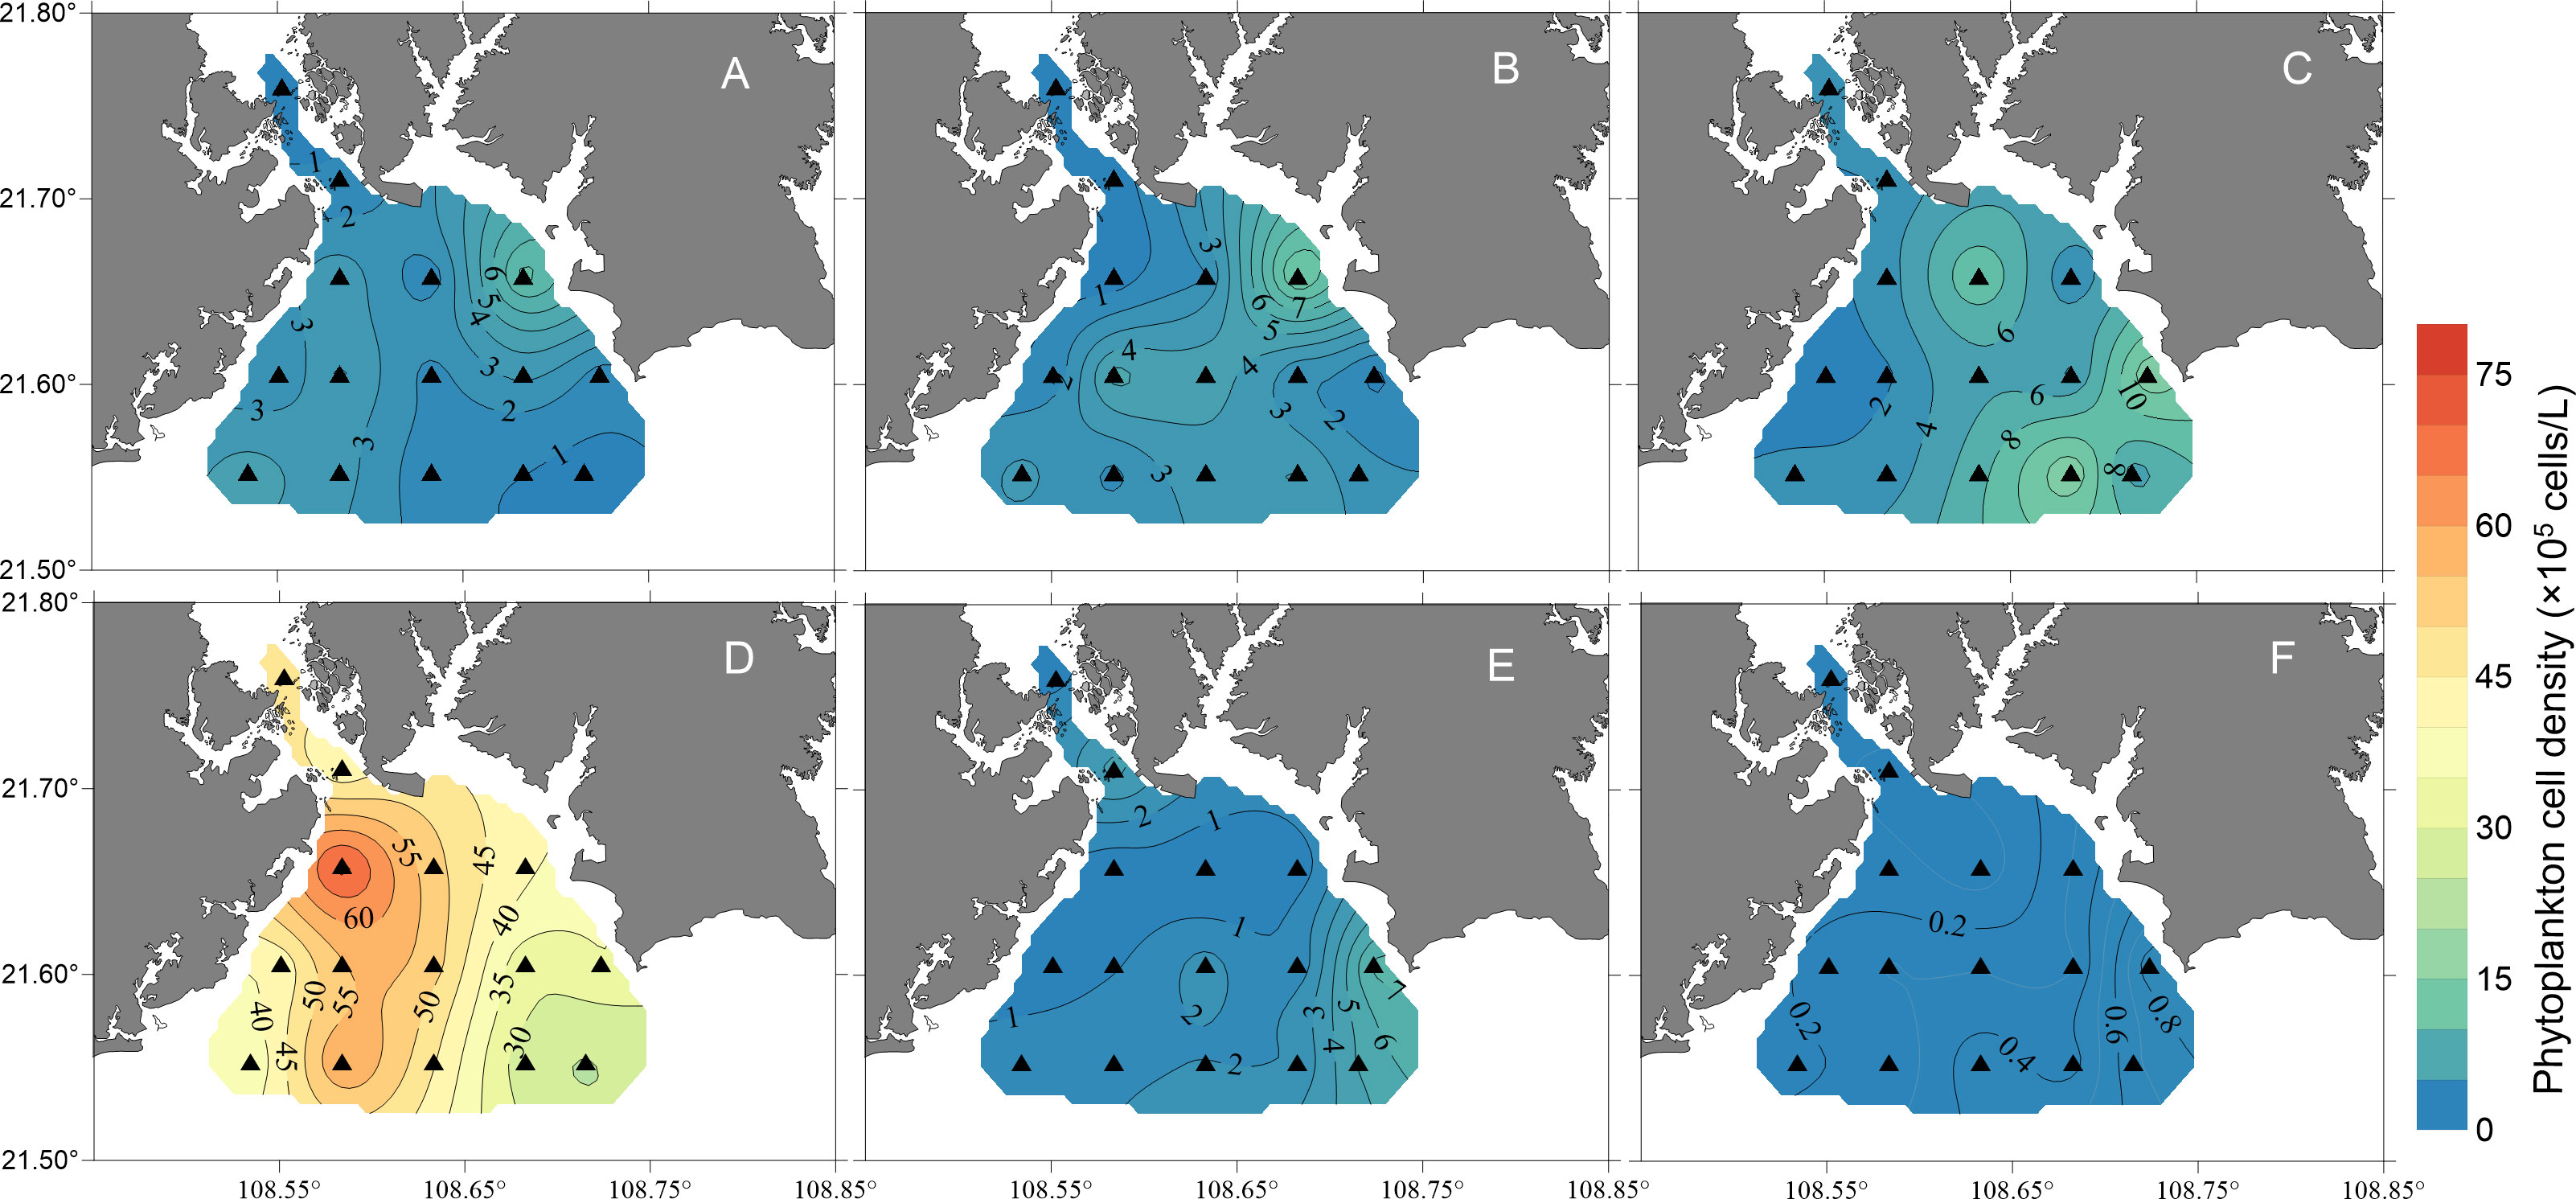
Figure 7 Map showing the temporal and spatial distributions of cell densities of total phytoplankton (units:×105 cells/L) in the surface waters of the study area from October 2018 to March 2019 [(A), October 2018; (B), November 2018; (C), December 2018; (D), January 2019; (E), February 2019; (F), March 2019].
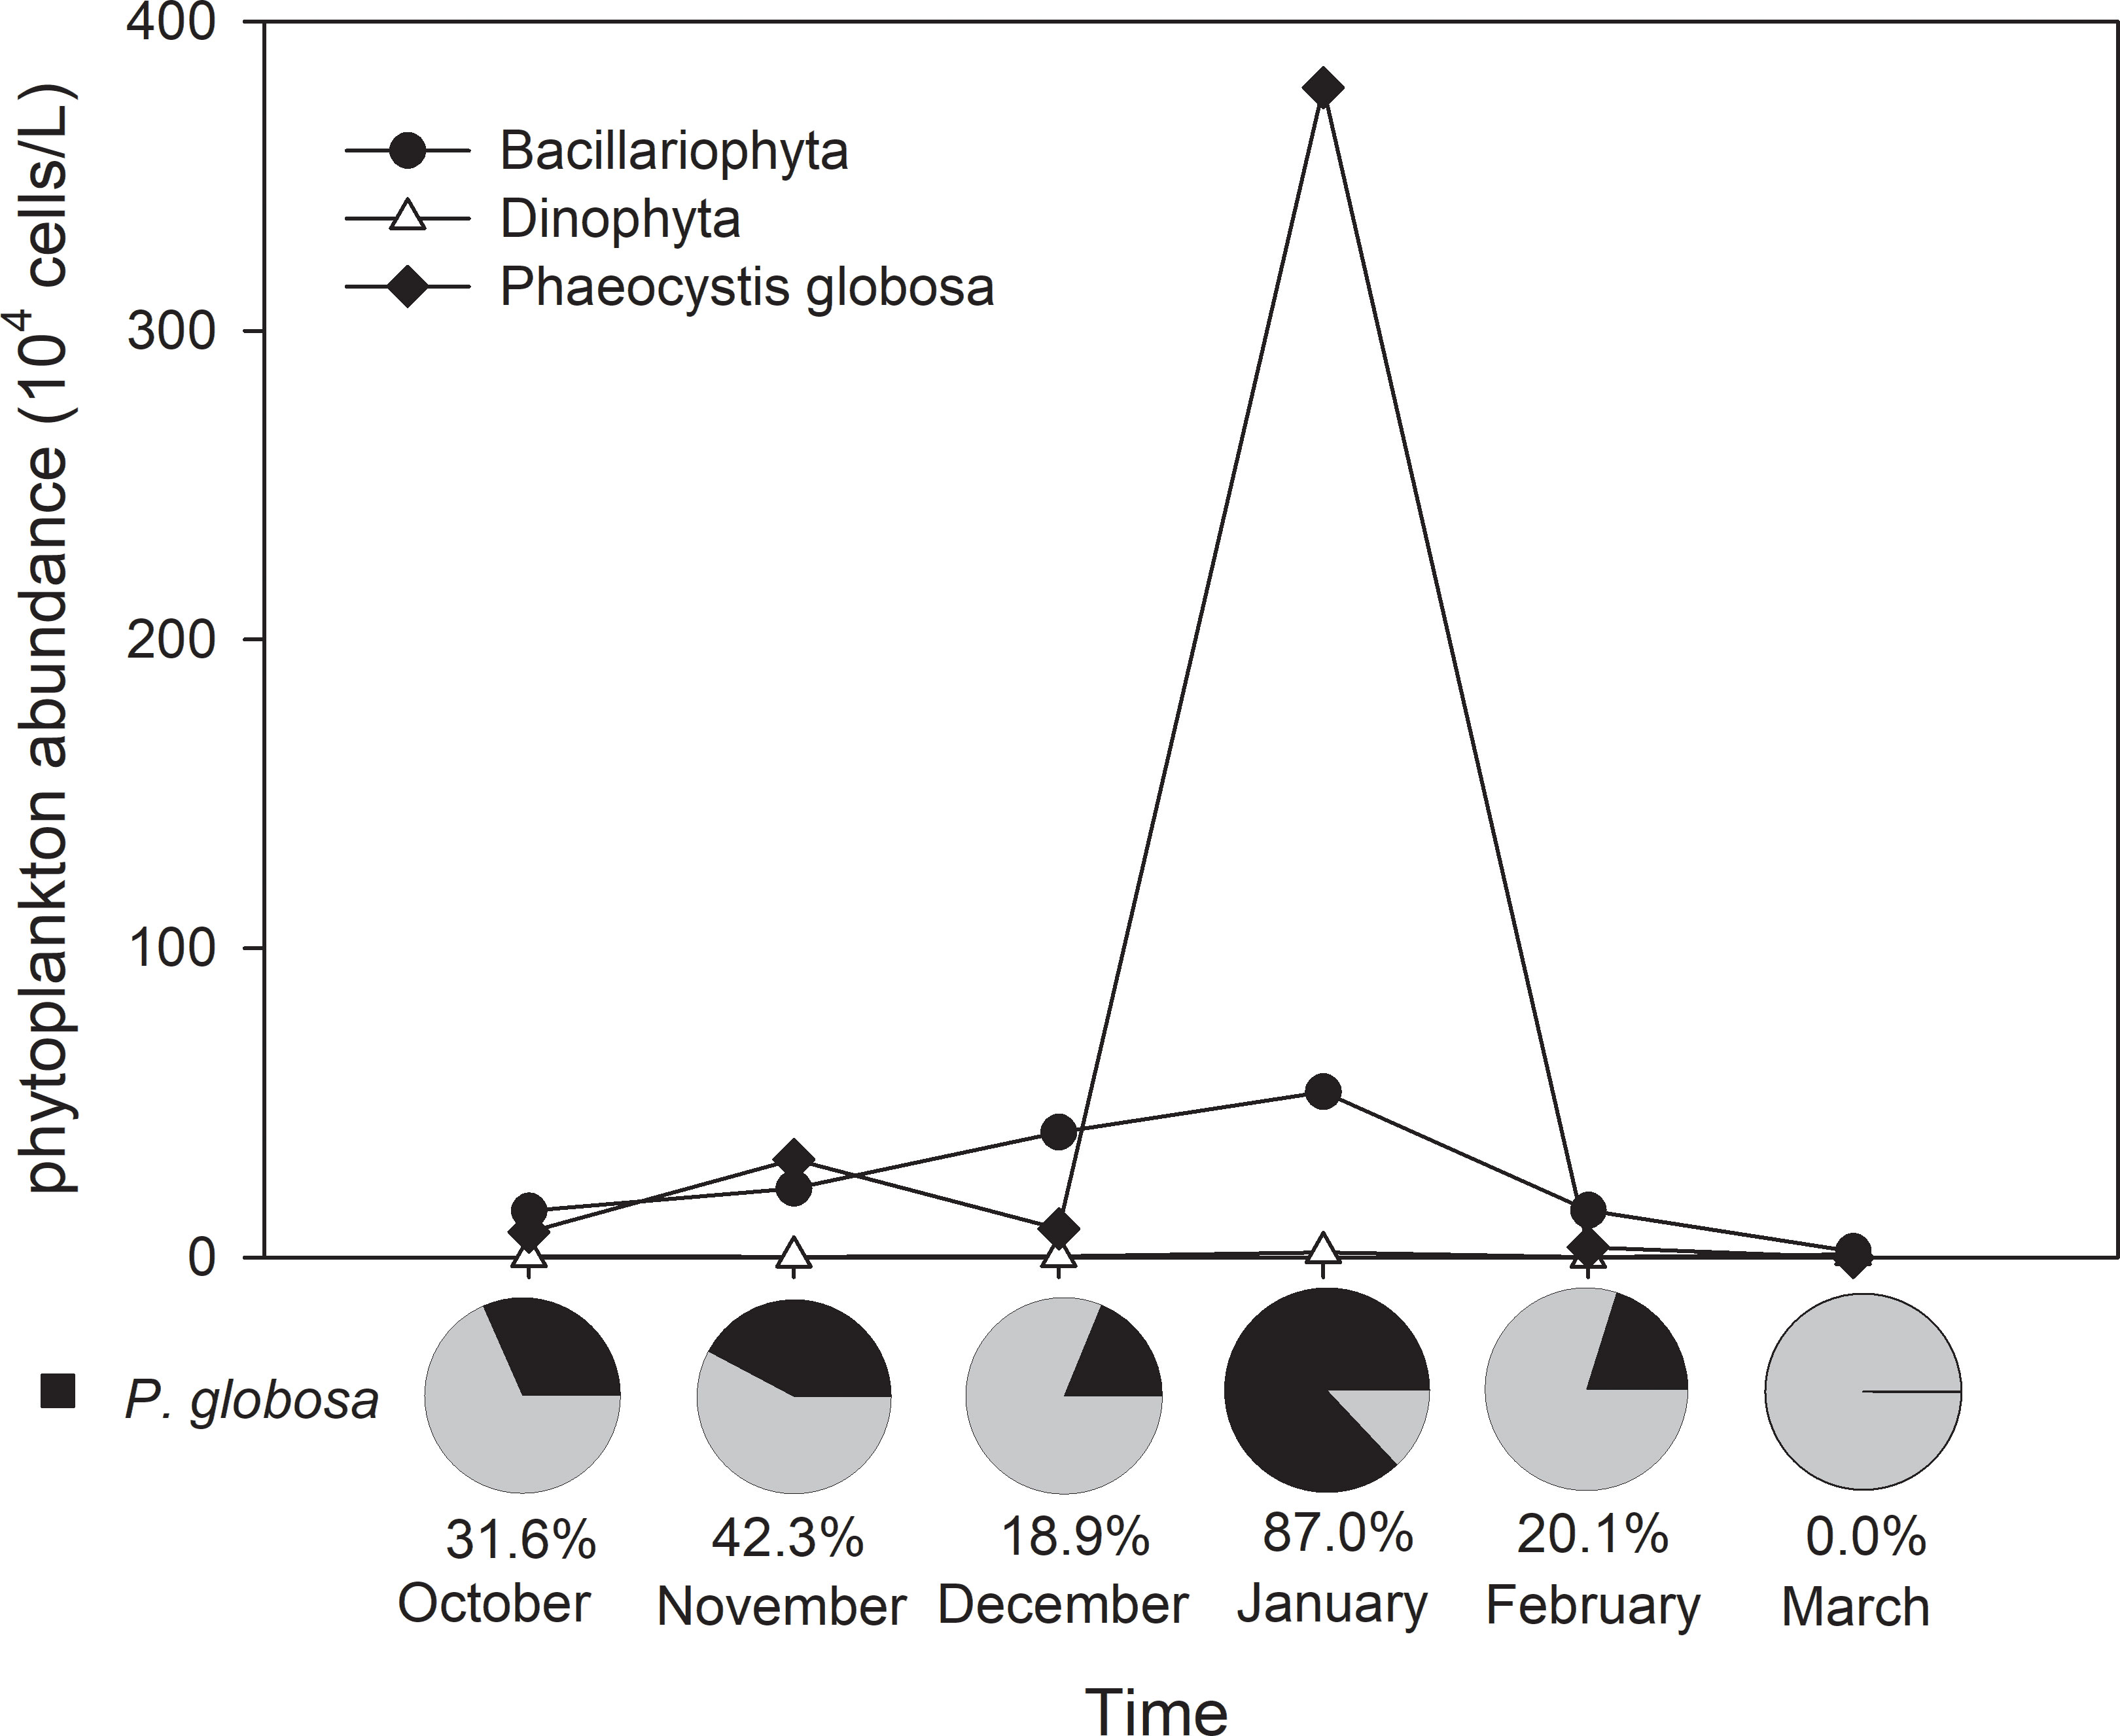
Figure 8 The abundance of the main groups of phytoplankton at all sampling stations during the study period and the average ratio of Phaeocystis globosa to total phytoplankton abundance.
The succession of the phytoplankton community was very obvious throughout the study period (Figure 9), and there were also monthly variations in temporal and spatial distributions of P. globosa (Figure 10). During the first cruise in October 2018, six dominant species were found in Qinzhou Bay, including P. globosa and five diatom species. Among these species, P. globosa was found at all stations (Figure 10A) and had the highest dominance index (0.319), with an average cell density of 8.2 ± l8.0 × 104 cells/L, accounting for 31.6% of the total phytoplankton abundance (Figure 8). The number of dominant species increased to 11 in November; ten of these species were diatoms, among which 9 species had chain-like structures. Although P. globosa was found at only three stations (Figure 10B), its high density made it one of the dominant species. Chaetoceros species and P. globosa continued to be the dominant species in December. P. globosa abundance increased dramatically, and this species became the most abundant species in January 2019, accounting for 87.0% of the total phytoplankton, with an average cell density of 3.8 ± 1.3 × 10⁶ cells/L. Only two dominant species were found during this cruise. P. globosa remained one of the dominant species in February, together with Plagioselmis prolonga (Cryptophyta) and Rhizosolenia alata (Bacillariophyta). Dinoflagellate (Dinophyta) species, including Oxyrrhis marina, Prorocentium micans and Gonyaulax spinifera, were found to be dominant species for the first time during the cruise in March 2019, and dinoflagellates replaced P. globosa and had the second-largest abundance following diatoms.
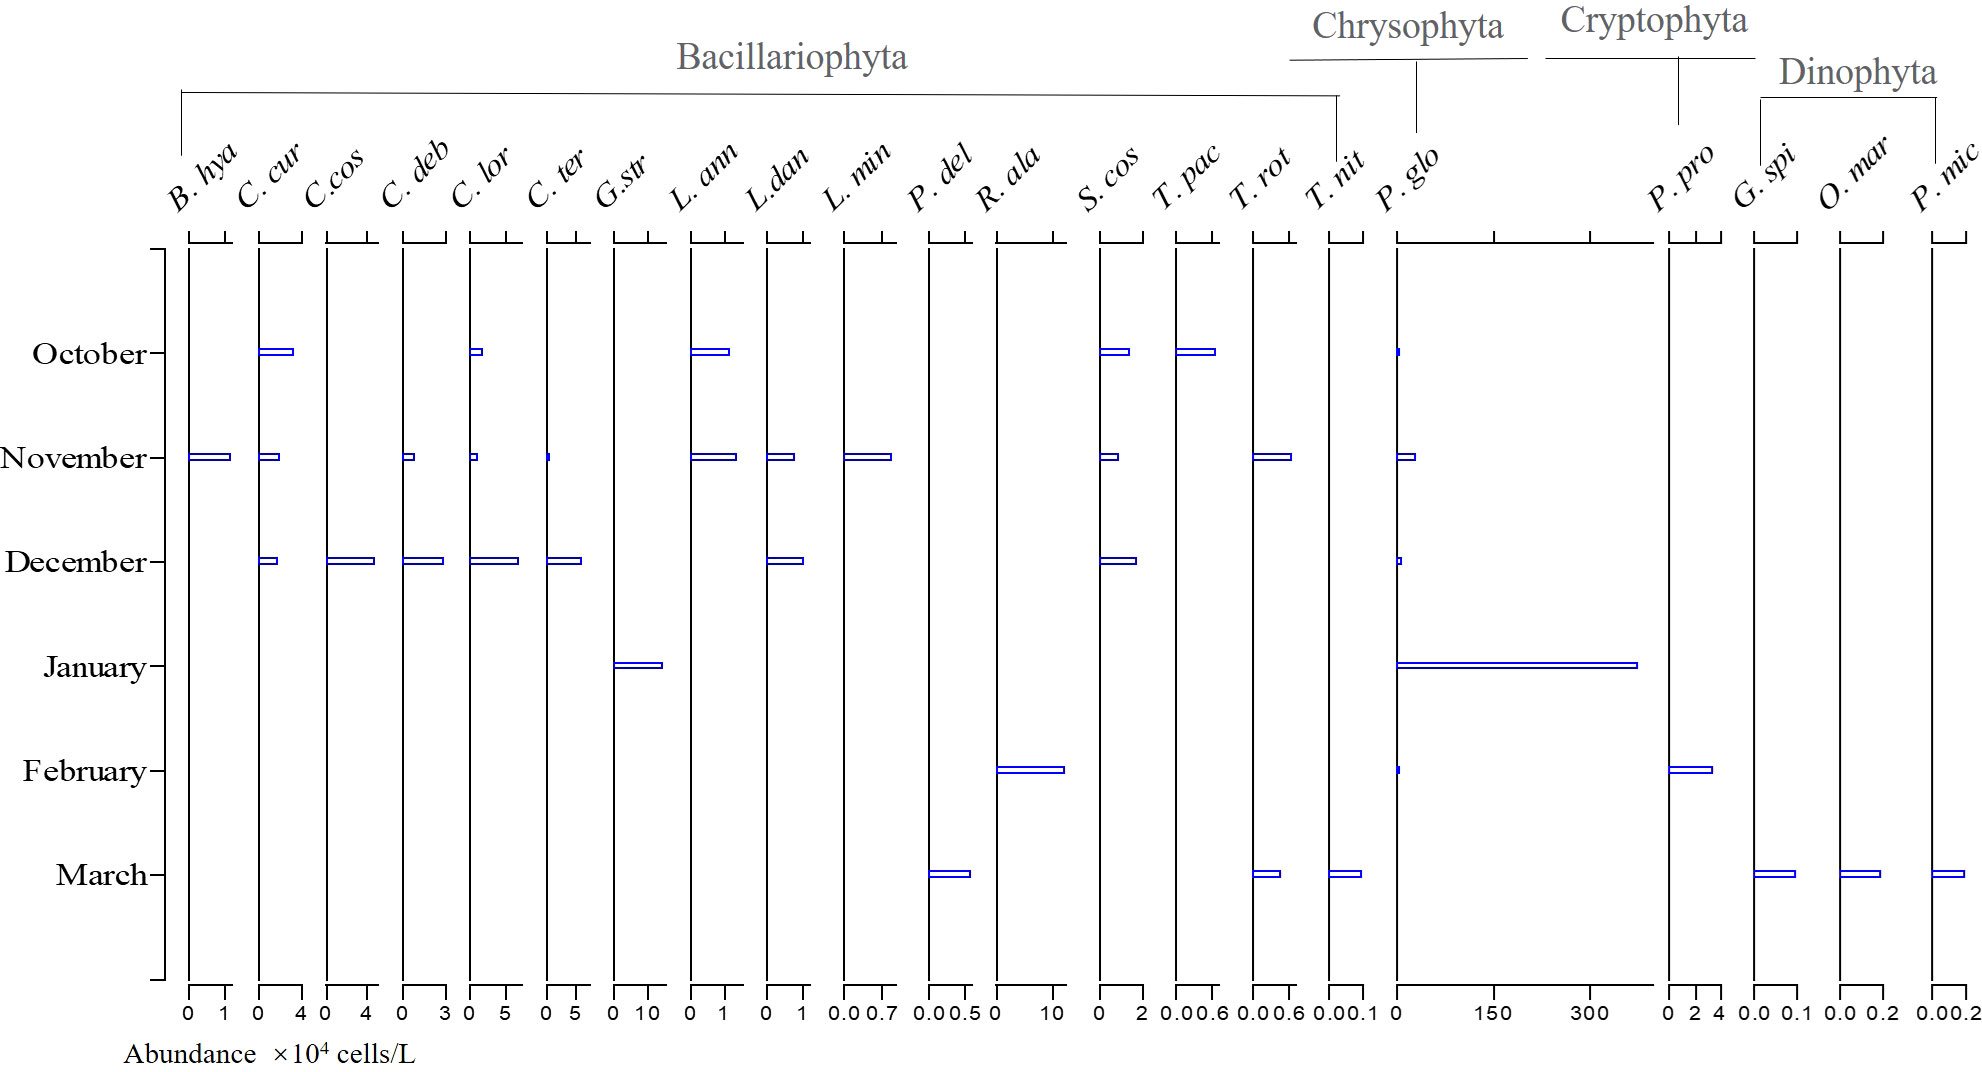
Figure 9 The temporal distributions of the dominant species in Qinzhou Bay during the six cruises from October 2018 to March 2019. (B. hya, B. hyalinum; C. cur, Chaetoceros curvisetus; C. cos, C. costatus; C. deb, C. debilis; C. lor, C. lorenzianus; C. ter, C. teres; G. spi, Gonyaulax spinifera; G. str, Guinardia striata; L. ann, Lauderia annulate; L. dan, Leptocylindrus danicus; L. min, L. minimus; O. mar, Oxyrrhis marina; P. glo, Pheaocystis globosa; P. del, Pseudo-nitzschia delicatissima; P. mic, Prorocentium micans; P. pro, Plagioselmis prolonga; R. ala, Rhizosolenia alata; S. cos, Skeletonema costatum; T. nit, Thalassionema nitzschioides; T. pac, Thalassiosira pacifica; T. rot, T. rotula.).
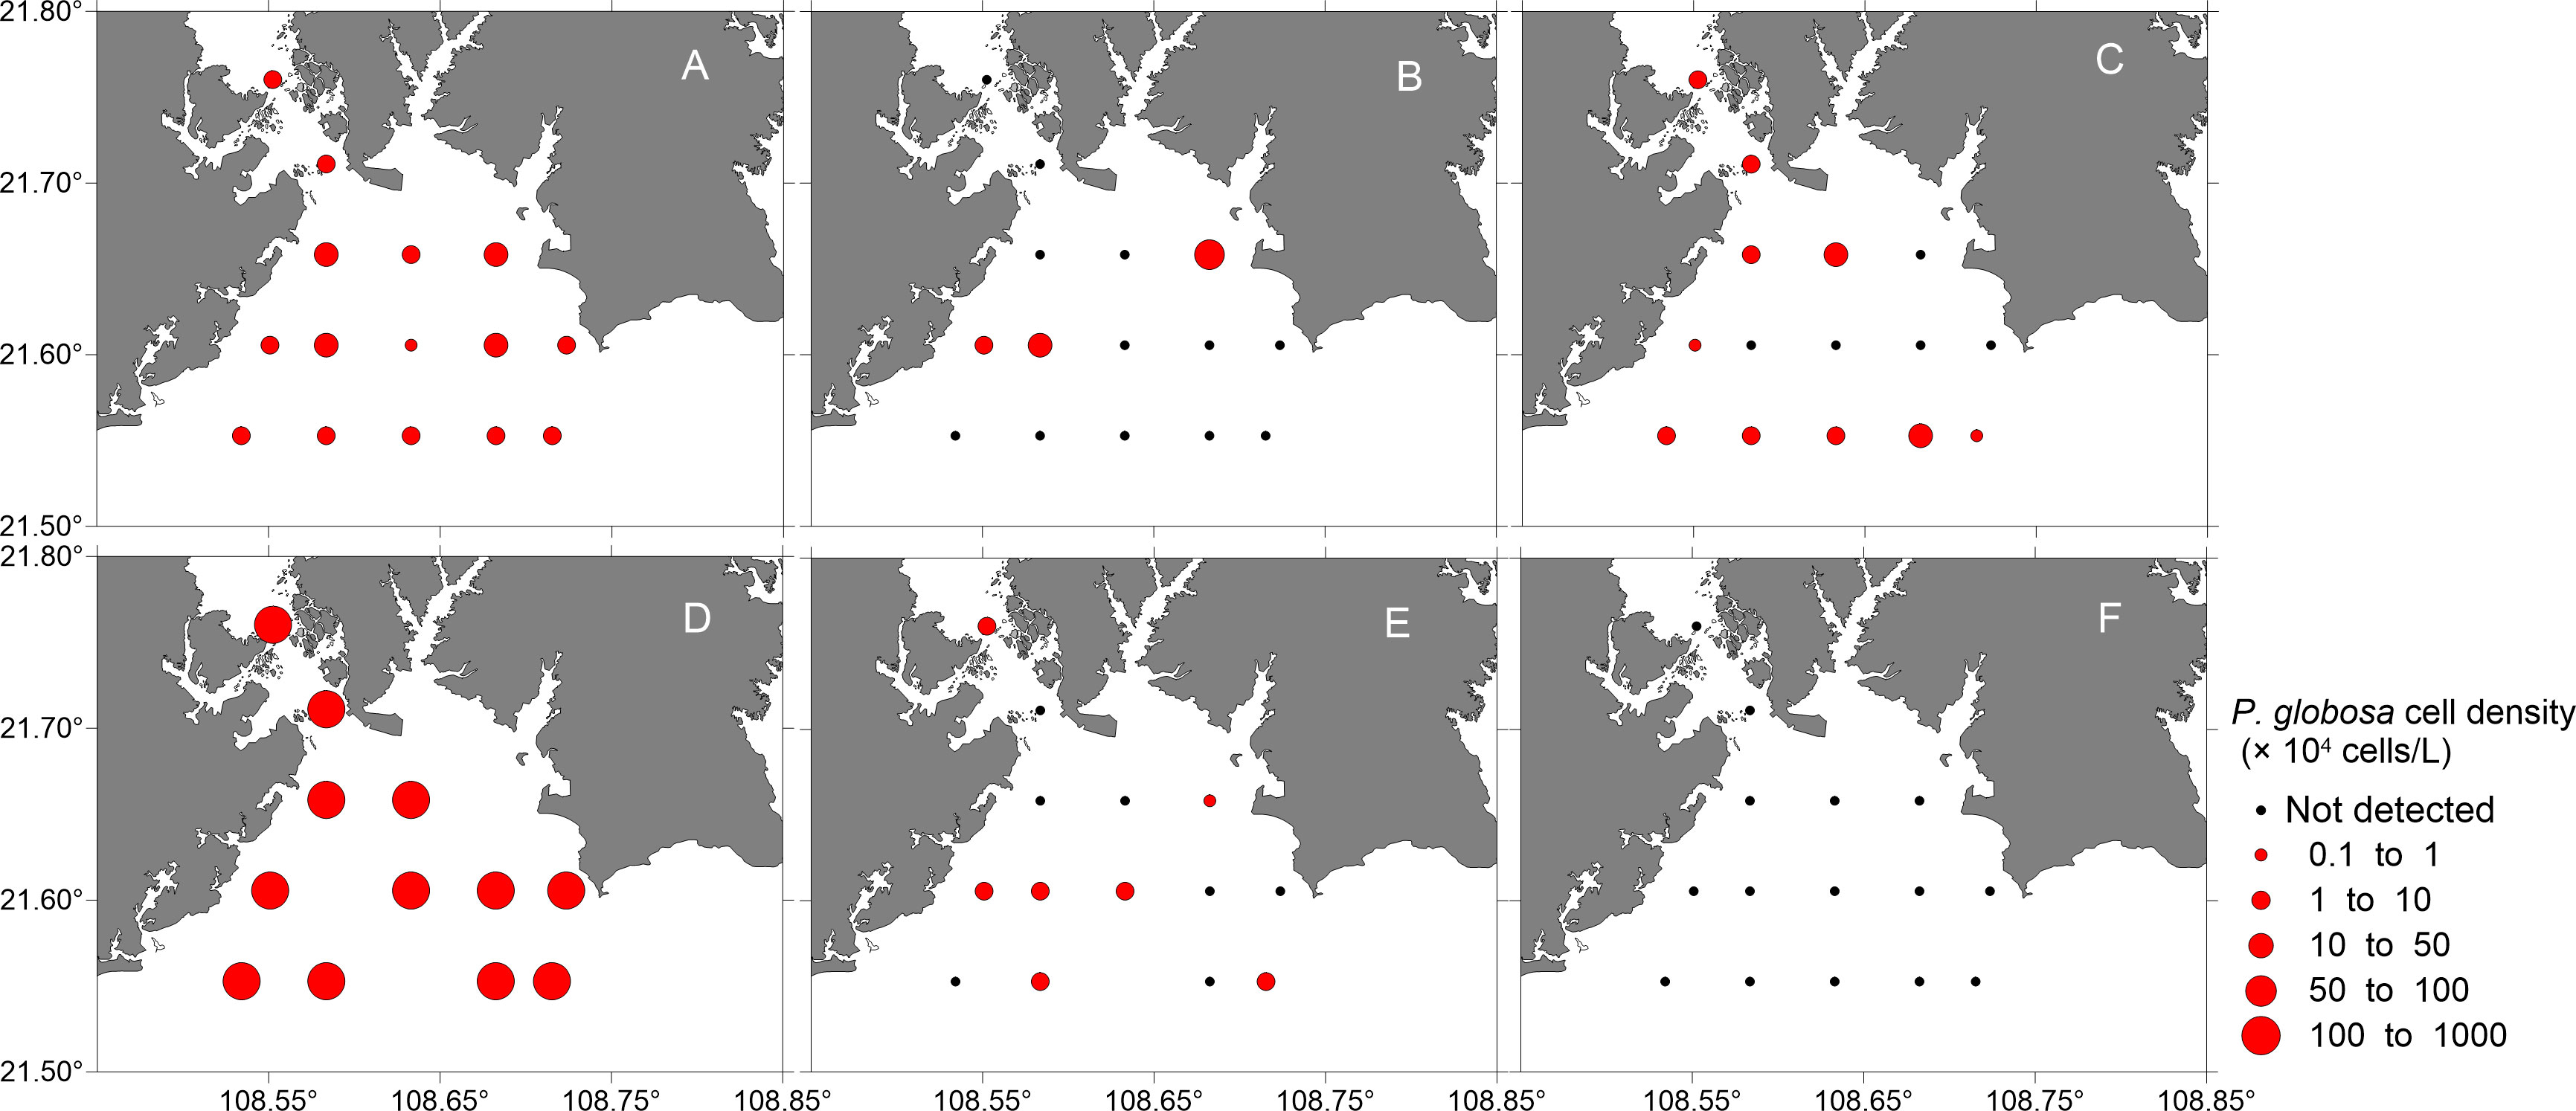
Figure 10 Map showing the temporal and spatial distributions of Phaeocystis globosa cell density (containing solitary cells and colonial cells, units: × 104 cells/L) in the surface waters of the study area from October 2018 to March 2019 [(A), October 2018; (B), November 2018; (C), December 2018; (D), January 2019; (E), February 2019; (F), March 2019].
P. globosa colonies were just found at one or two stations in the cruises excluding January, and had low densities (< 5 colonies/L). While colonies were detected at nearly all the stations in January, and the colony density ranged from 0 to 125 colonies/L, with an average of 43.7 ± 22.2 colonies/L. The percentages of colonial cells to total P. globosa cells varied from 0 to 84.5%, with an average of 31.1 ± 22.2%. Both the highest colony density and the highest percentage of colonial cells were recorded in station 12 (Figure 11). All the visable colonies was smaller than 0.4 cm.

Figure 11 The variation in the colony density of Phaeocystis globosa (black circle, colonies/L), the percentage of solitary cells (green bar, %) and the percentage of colonial cells (orange bar, %) in Qinzhou Bay in January.
Four phytoplankton community diversity indices were calculated to analyze the relationship between the phytoplankton community and the species density and disturbance degree of a colony to environmental factors. During the study period, the trends of all four diversity indices were consistent: the phytoplankton community structure stability was stable during October to December but decreased rapidly in January (Figure 12). The average value of the Shannon-Wiener index ranged from 0.99 to 4.24 throughout the tudy period. The highest average value was observed in November, and the lowest average value was recorded in January. The Margalef diversity index ranged between 1.95 and 3.29. The lowest and highest values were recorded in January and December, respectively. The values of both the Pielou evenness index and the Simpson index were lower than 1. Higher values indicated higher relative diversities and more evenly distributed species. The trend of variation in the Simpson evenness index was almost the same as that in Pielou’s evenness index. P. globosa abundance increased greatly in January, resulting in low values of the diversity indices except for the Margalef index (Figure 12).
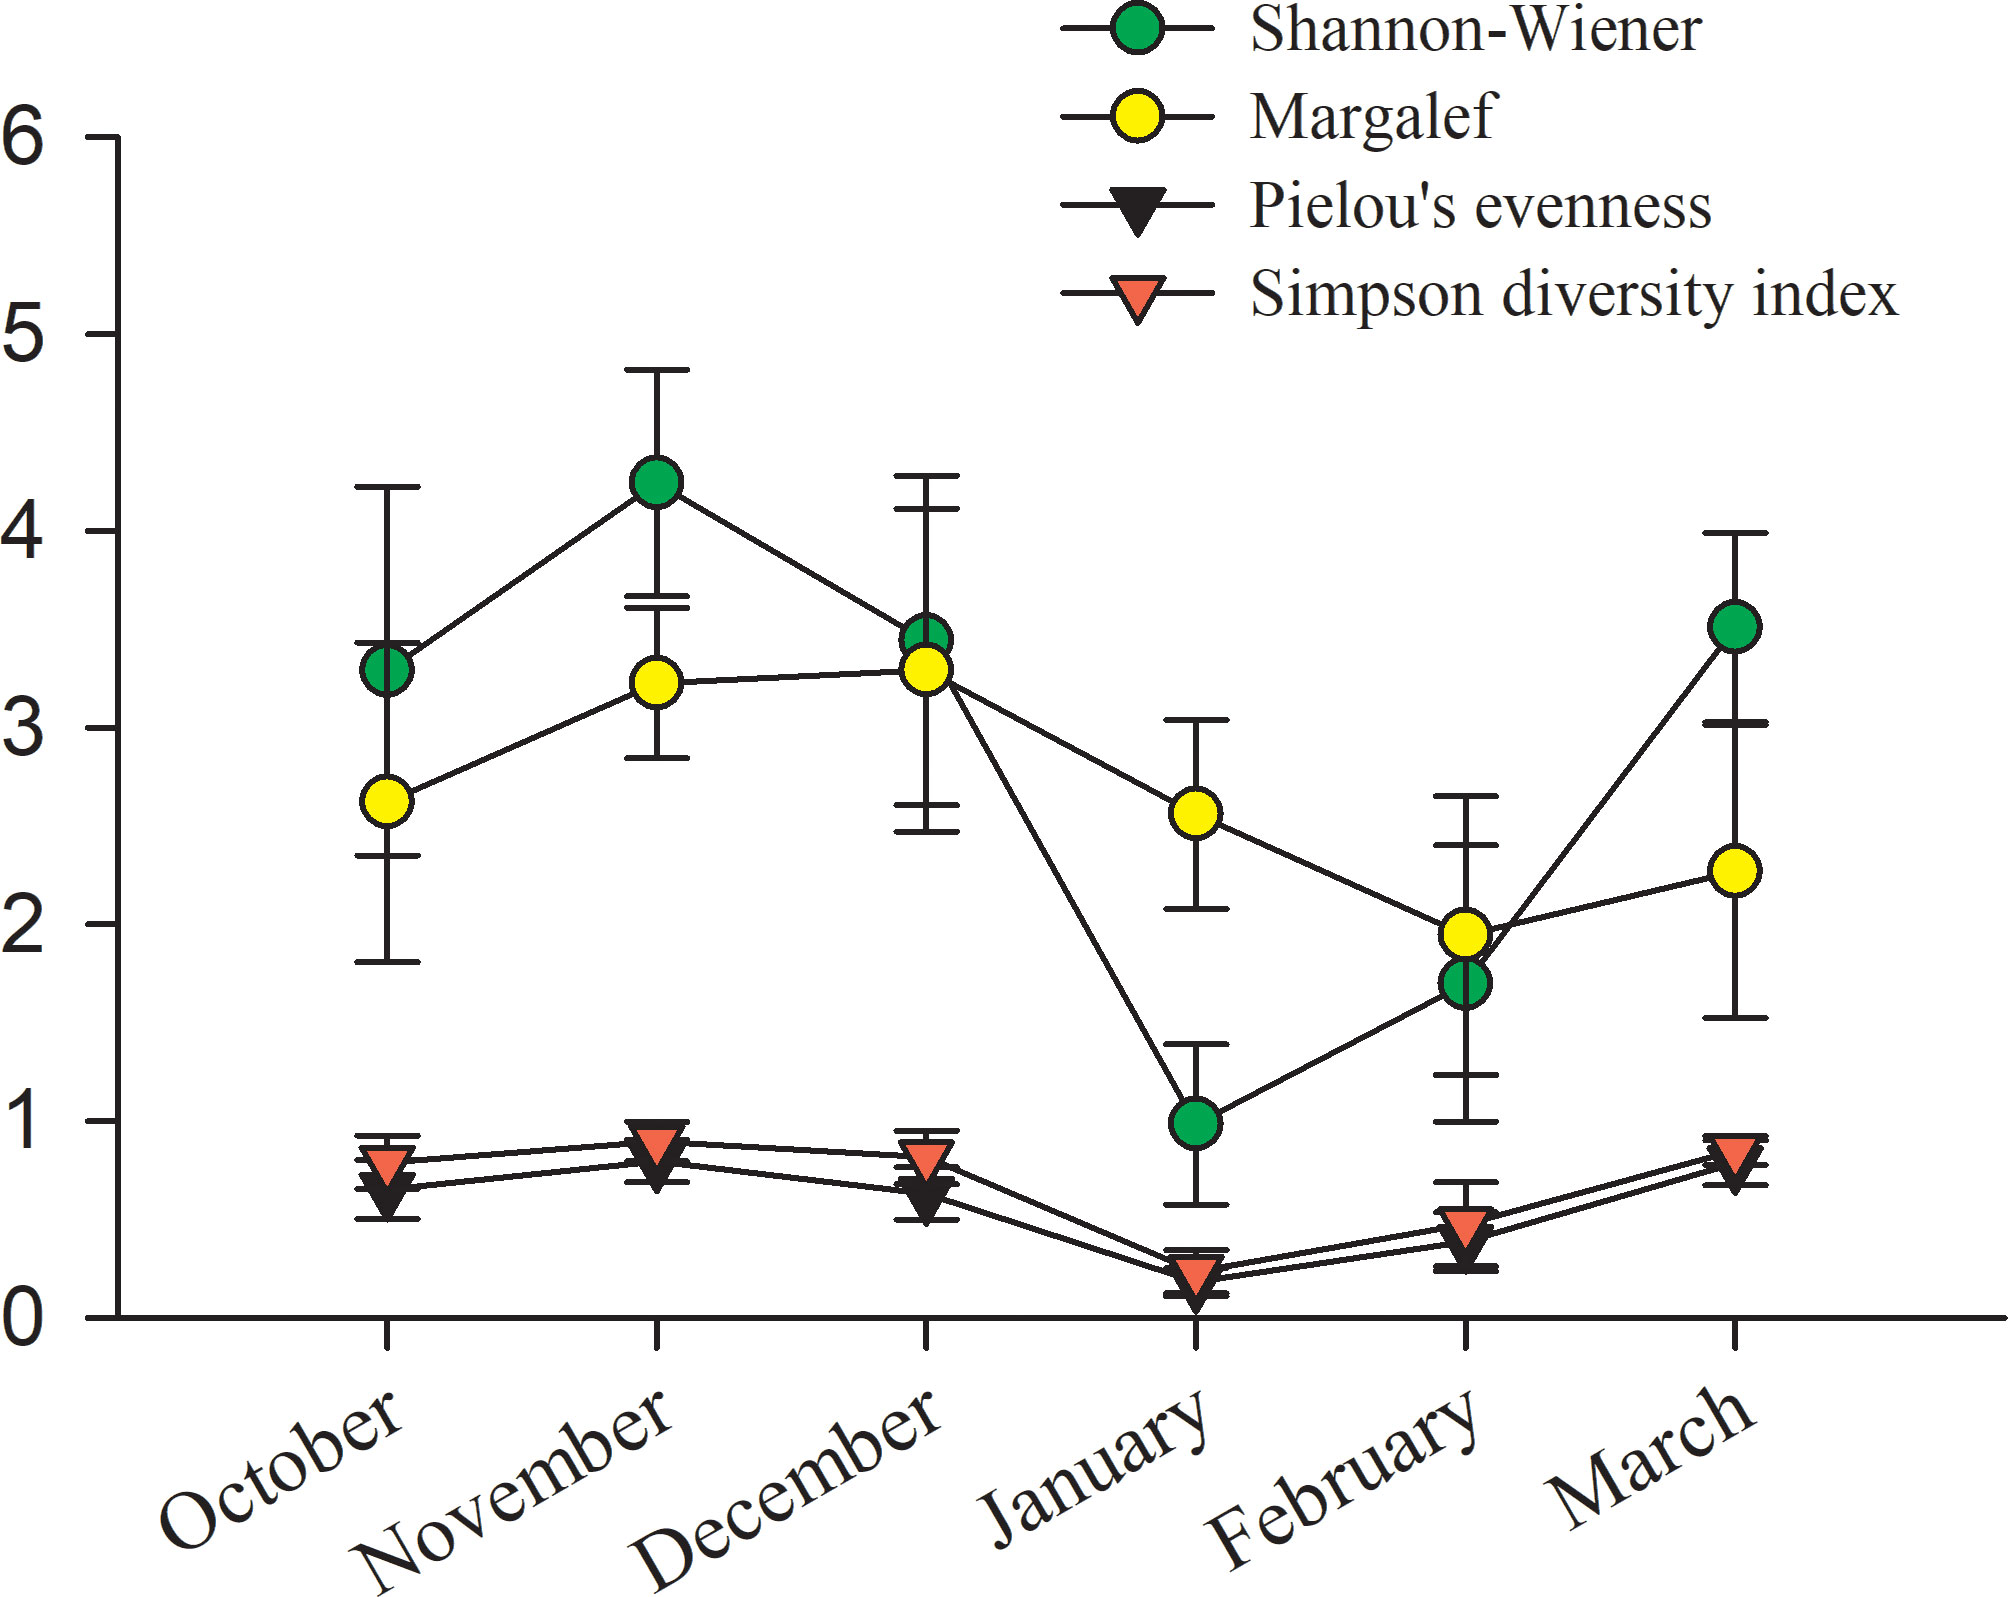
Figure 12 The variation in the Shannon-Wiener (green circle), Margalef (yellow circle), Pielou’s evenness (black triangle) and Simpson diversity (red triangle) indices of the phytoplankton communities in Qinzhou Bay from October 2018 to March 2019.
BioEnv analysis based on Spearman’s correlation matrix was performed to determine which variable(s) affected phytoplankton abundance and distribution in this study. The best models were selected according to correlations of the variables to phytoplankton communities. The results revealed that the variables that best explained the phytoplankton spatial pattern were variable among the cruises (Table 2). In October, salinity, DSi and pH were the main factors that statistically correlated the variations in the composition of phytoplankton, with correlations of 0.5224. The best model of environmental variables included just temperature and salinity in November, while temperature, salinity, DIN, DIP were contained in January, with high correlations of 0.6114 and 0.6907.
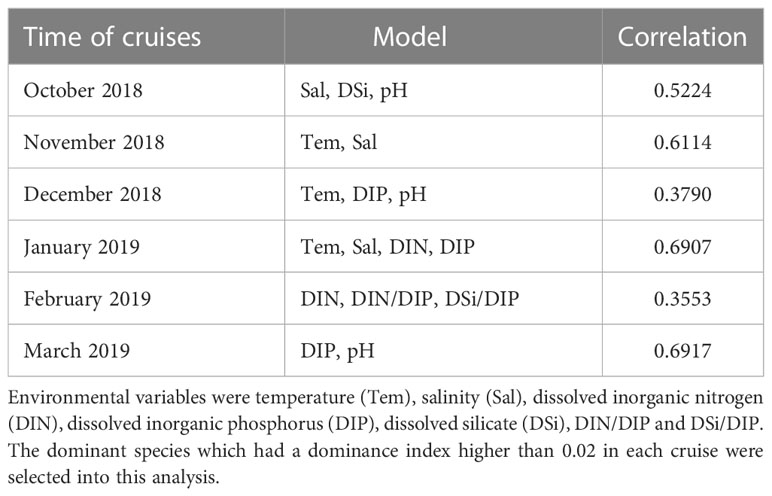
Table 2 Results of BioEnv analysis showing the best overall combination of environmental parameters for the six cruises during October 2018 to March 2019 in QinZhou Bay.
As the length of first DCA was between 3 and 4 (3.08), the relationship between environmental variables and the main phytoplankton species (i.e., those with one of the 10 highest dominance index values (Y) in this study) throughout the study period was analyzed by RDA. The first two axes explained 26.6% and 5.5% of the cumulative variance in the relationship between species and environmental variables, with eigenvalues of 0.266 and 0.055, respectively.
The ordination graph of RDA shows that the succession of phytoplankton was mainly driven by hydrological factors and inorganic nutrients (Figure 13). Instead of having multiple dominant species each month, there were only two dominant species (Y > 0.02) during the entire study period, P. globosa (Y = 0.382) and C. lorenzianus (0.022). The 10 species with the highest dominance index values from all of the samples met the data selection criteria and, consequently, were summed as the species data matrix. One of the predominant species, P. globosa, associated with G. striata and T. rotula, was characterized by high DIN/DIP. However, the other dominant species, C. lorenzianus, had a preference for high pH, and the vectors of C. debilis, C. costatus and L. danicus were close to that of C. lorenzianus in this graph. The other species, C. curvisetus, C. debilis, C. teres, and R. alata showed a particular preference for high pH and high salinity.
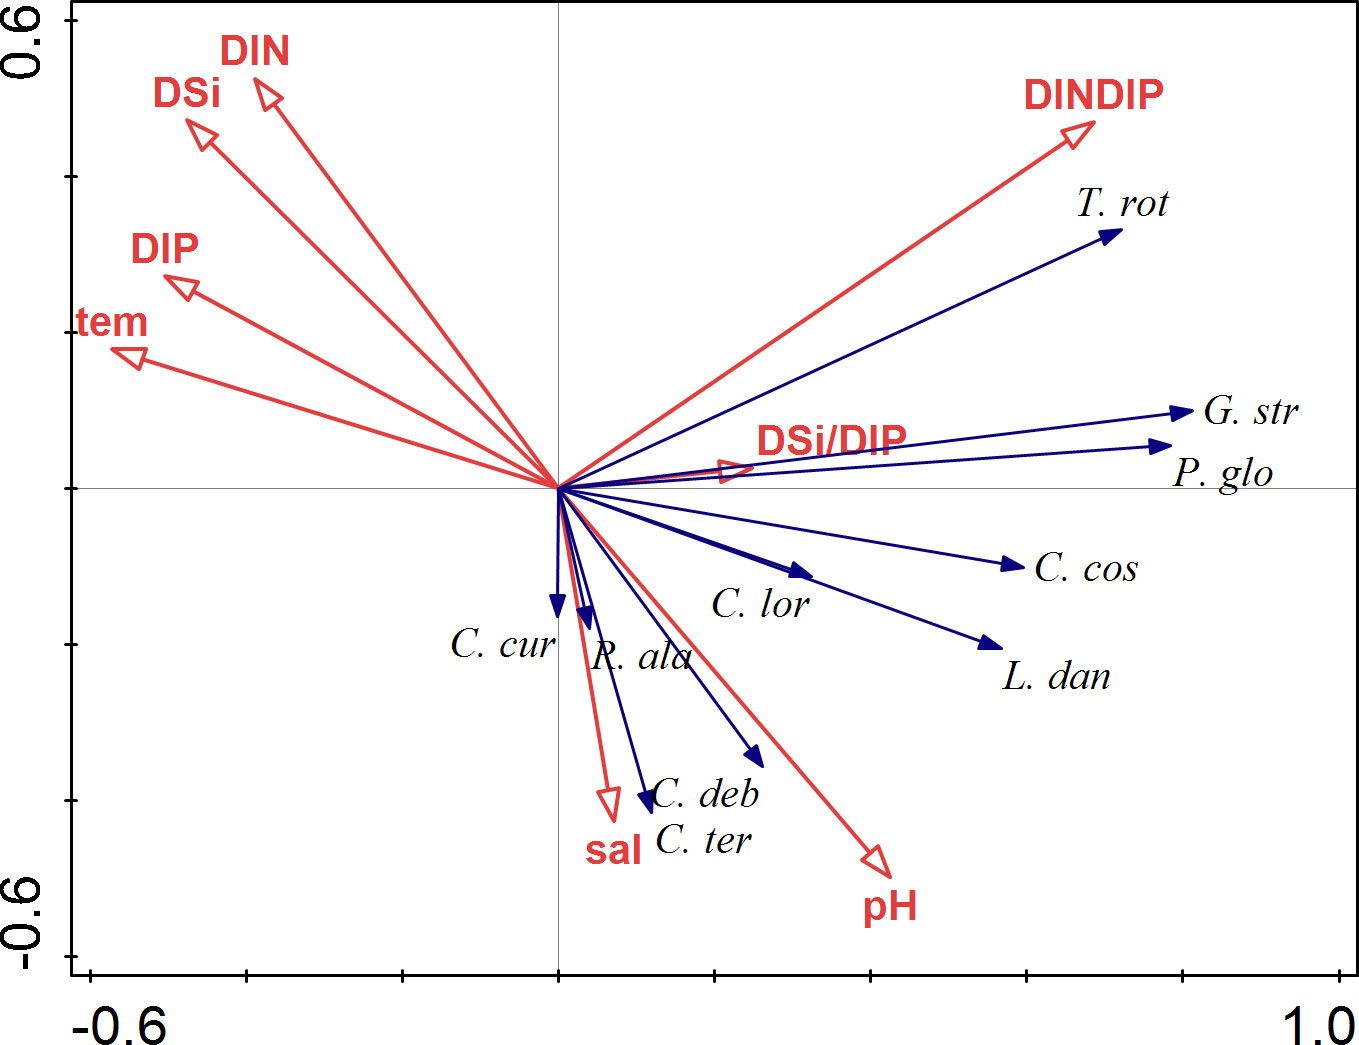
Figure 13 Correlation plots of the redundancy analysis (RDA) on the relationship between the environmental variables and phytoplankton species. The species selected were those with the 10 highest dominance index Y values across all samples throughout the study period, and the abbreviation of species names is the same as that in Figure 9.
Qinzhou Bay in a broad sense includes the inner bay (Maowei Sea) and the outer bay, where most of the stations in this study are located (stations 3 to 15, Figure 1). In addition to latitude playing a key role in temperature, the spatial distributions of temperature and salinity in the study area were affected by river input from the Maowei Sea and seawater intrusion from the offshore area (Figures S1, S2). As a tropical bay, the temperature was obviously different in different months (Table 1; Figure 2A); the maximum temperature was recorded in October 2018 (25.6 ± 1.0°C), while the minimum temperature was recorded in January 2019 (14.3 ± 0.5°C). Temporal variations in DO were almost the opposite of those of temperature during the six months (Table 1), so the vectors of DO and temperature were in opposite directions in the PCA results (Figure 6). According to the PCA results, we found that temperature and DO were important for the monthly environmental changes during the study period.
Nutrients in Qinzhou Bay were mainly affected by river input, as the Qinjiang River and Maolingjiang River are linked to the inner bay (Lan et al., 2012; Lan, 2012; Hong et al., 2014). The concentrations of DIN, DIP and DSi in all cruises except that in January decreased from the inner bay to the outer region (Figures 3–5) and showed a significant negative correlation with salinity during the investigation. Nutrients carried by river inputs in this area were calculated and accounted for more than 78% of the total nutrient input (Xu et al., 2012). Dissolved inorganic nutrient contents (DIN, DIP and DSi) were relatively low in the study area during this study, possibly because the rivers were in a low-flow season during this period, and the water was mixed with “clean water” from the outer sea. In addition, the outer bay is far from the estuary and has less land source sewage discharge and less mariculture area (Xu et al., 2012; Kang et al., 2020a). The samples from all cruises except those in January were dispersed along axis 1 in the PCA result, which was mainly associated with DIN, DIP, DSi and salinity (Figure 6).
In the last several decades, environmental pressure and eutrophication in Qinzhou Bay have been increasing with the rapid development of industrialization and urbanization. DIN was the nutrient that increased most, while DIP remained relatively stable; eutrophication was found only in the inner bay, and oligotrophication was found in the outer bay (Wei and He, 2008; Xu et al., 2012). DIN/DIP ratios are often used to determine whether an aquatic system is experiencing N or P limitation (Redfield, 1958; Redfield et al., 1963). Phytoplankton are considered to become P limited when DIN/DIP is greater than 20-30 (Healey, 1979). A DIP of 0.1 µmol/L is considered to be the minimum threshold for phytoplankton growth; that is, when DIP is lower than this value, phytoplankton are absolutely P limited (Peery and Eppley, 1981; Dortch and Whitledge, 1992). The DSi/DIP ratio was used in combination with the DIN/DIP ratio to determine if there was a P limitation, and when both ratios were greater than 22, the phytoplankton were thought to be in a P-limited state (Justić et al., 1995). Both the DIN/DIP and DSi/DIP in Qinzhou Bay were higher than 22 in this study during five cruises, excluding the cruise in December (Table 1), and the DIP at all the stations was lower than 0.1 µmol/L in January, indicating P limitation in this area. In fact, Qinzhou Bay has long been considered a P-limited area, as the average N/P and Si/P throughout the year were 116 and 152, respectively (Ma et al., 2013; Lin and Zhong, 2014).
A total of 193 species of phytoplankton were identified during the study, and this number was consistent with results obtained in 2010 (Jiang et al., 2012). However, only 148 species were recorded in 2013-2014 (Liu et al., 2020); this variation might be attributed to the difference in sampling stations and survey times. The dominant species changed gradually between cruises. P. globosa was the dominant species in the first five months, and C. curvisetus and C. lorenzianus were additional dominant species that appeared frequently (from October to December, Figure 9). Other studies have shown that Chaetoceros was the main dominant species in Qinzhou Bay (Jiang et al, 2012; Liu, 2017). Chaetoceros species were frequently dominant from October to December, the period during which Phaeocystis blooms began in previous years. Abundant Chaetoceros were found during the prebloom period (Peperzak et al., 2000), and many newly formed colonies were found on the setae of Chaetoceros, suggesting that Chaetoceros plays a key role in the inception of Phaeocystis blooms (Rousseau et al., 1994). It was reported that a certain cell density of C. minimus and C. pseudocurvisetus will significantly increase the number of P. globosa colonies and prolong the existence time of the colonies (Li et al., 2010; Liu et al., 2021). In fact, the coexistence of Phaeocystis colonies with diatoms is a well-known and recurring phenomenon in field observations (Rousseau et al., 1994; Peperzak et al., 1998; Wassmann et al., 2010). Diatom species, especially those with thorn, spine or setae structures, are commonly observed (Liu et al., 2021). These cell structures are regarded as beneficial for improving buoyancy or providing a substrate for P. globosa attachment (Rousseau et al., 1994; Sazhin et al., 2007; Liu et al., 2021). Moreover, the allelopathic effect of diatoms plays a key role in the effects of diatoms on P. globosa colony development. For example, the cell-free filtrates of Thalassiosira weissflogii and Ditylum brightwellii stimulate the formation of more and larger P. globosa colonies (Liu et al., 2021; Wang et al., 2021c). Some allelochemicals can support a reallocation of resources involved in forming and maintaining colonies (Mars Brisbin and Mitarai, 2019), while others could provide necessary nutrients and energy to support P. globosa colony formation (Zhang et al., 2020).
The phytoplankton community diversity indices were quite high from October to December, and all four indices decreased in January, which was when P. globosa had the highest density (Figure 12). Similarly, Liu et al. (2020) found that the phytoplankton diversity indices were high and the community was stable in Qinzhou Bay, but this characteristics changed when P. globosa blooms occurred. Significant changes were also found in both the quantity and the variety of phytoplankton-dominant species starting in January, when there were only two dominant species (Figure 9). Those Chaetoceros species that had a chain-like structure and spines on the cells were no longer dominant species after January. There are three possible reasons for the decline in diversity indices in January. One was that the decline in temperature in January led to a decrease in Chaetoceros abundance, as these species are thought to grow better at high temperatures (Wang et al. 2010a). Second, the DIP was relatively low in January, which might limit the growth of Chaetoceros. Third, the rapid reproduction of P. globosa might result in a reduction in Chaetoceros. The phytoplankton community always tends to be uniform during the formation of blooms, and the diversity decreases (He et al., 2008; Xu et al., 2022). Thus, diversity indices were proposed as a predictor of the occurrence of algal blooms (He et al., 2008). Single-cell species appeared successively; for example, P. prolonga (Cryptophyta) was recorded in February and dinoflagellates (O. marina and P. micans) were recorded in March. Colonies of Phaeocystis commonly attach to Plagioselmis species and heterotrophic dinoflagellates before the appearance of Phaeocystis blooms (Peperzak et al., 1998; Shields and Smith, 2008). Moreover, the abundance of heterotrophic dinoflagellates feeding on cells of Phaeocystis increases gradually during blooms (Grattepanche et al., 2011). Thus, it was speculated that the increase in heterotrophic dinoflagellates after the decline in P. globosa in March might be due to feeding on P. globosa cells throughout the investigation period.
According to the results of the BioEnv analysis, the factors regulating the phytoplankton assemblages during the six cruises differed month to month. Temperature, salinity and pH were important factors from October to December when the phytoplankton community was mainly composed of diatom species (Table 2). More variables (temperature, DIP, salinity, DIN) were found to be important by the BioEnv analysis for January, suggesting that the regulating model of environmental factors on phytoplankton assemblages is more complex when a bloom is about to start. When it was analyzed from the perspective of the entire investigation period, the phytoplankton community was mainly influenced by DIN/DIP, temperature, DSi, DIP and DSi/DIP (Figure 13; Table 3). In fact, phytoplankton succession is largely determined by the interactions of physical and chemical factors (Sommer and Maciej Gliwicz, 1986). T. rotula, G. striata and P. globosa were distributed in the stations with high DIN/DIP (Figure 13), indicating that these three species may have competitive advantages under P-limited conditions. T. rotula can grow well when the DIN/DIP ratio is 98 (Zhang, 2021), and P. globosa has been found to have competitive advantages when DIP is limited (Wang and Tang, 2006). All Chaetoceros species showed a strong negative relationship with inorganic nutrients, meaning that they were major consumers of these nutrients. Our findings are in agreement with earlier observations showing that hydrological and chemical factors play significant roles in determining the distribution and succession of phytoplankton (Peng et al., 2012; Cui et al., 2018).
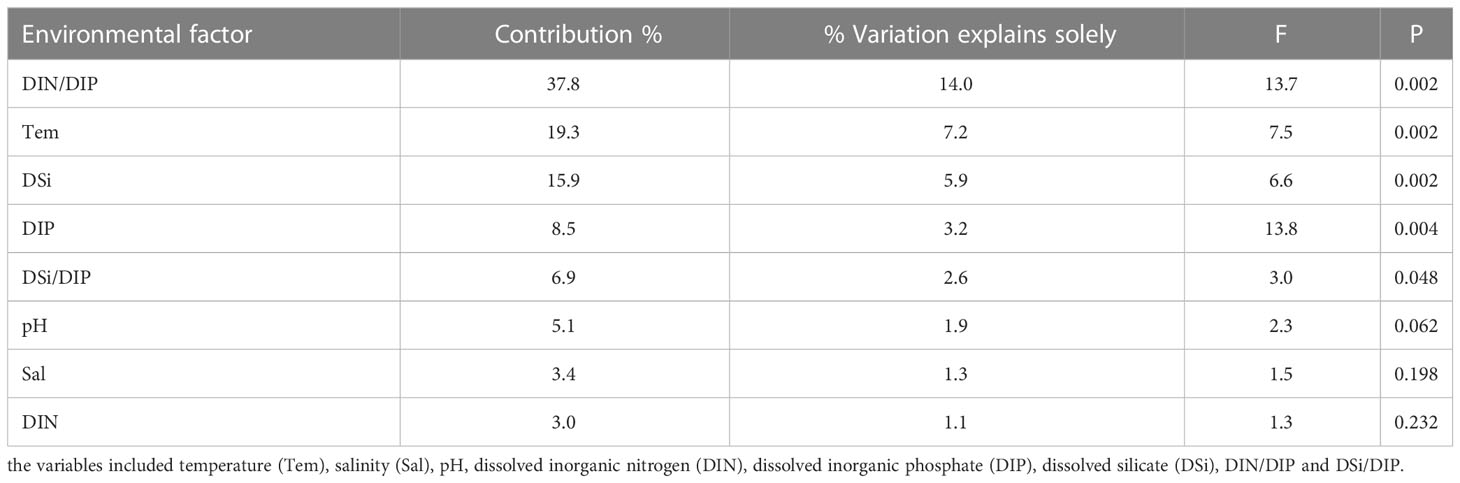
Table 3 Variation partitioning analysis of the environmental factors on the phytoplankton.
Most studies have shown that P. globosa blooms occur during late autumn and early spring, both in China (Guo et al., 2007) and in other countries (Baudoux et al., 2006; Seuront et al., 2006). Previous studies have shown that P. globosa blooms in the coastal waters of Guangxi often occur in autumn or winter, with occurrence having been recorded from November to March (Luo et al., 2016; He et al., 2019a; He et al., 2019b). According to statistics performed by He et al. (2019a), the water temperature range during blooms caused by P. globosa in the coastal of China was 15-27°C, and low and stable temperatures were thought to be favorable for colony formation. At the end of November 2017, a P. globosa bloom began with an average water temperature of 16.9°C in a similar survey area in Qinzhou Bay. The bloom lasted for one and a half months and then dissipated in mid-January 2018 when the average temperature was 15.4°C (He et al., 2019a). The average water temperature was 19.0°C during two P. globosa blooms that occurred in the coastal area of Guangxi (Li et al., 2015). P. globosa was correlated with low temperature according to the RDA results (Figure 13), and it seems that temperature was the key factor regulating the growth of P. globosa in Qinzhou Bay during this study. Previous studies have shown that P. globosa is always one of the predominant species in Qinzhou Bay (Jiang et al., 2012; Xu et al., 2014; Liu et al., 2020). In the present study, P. globosa was found to be a predominant species in Qinzhou Bay from October to February (Figure 9). The bloom occurrence threshold was defined according to the cell size of HABs causative species, and a cell density of 1×10⁷ cells/L was considered to be the bloom occurrence threshold of P. globosa or a corresponding Chl a content of 10 µg/L (Guo et al., 2014). Although the P. globosa density increased sharply and was close to the bloom density in January 2019, it failed to form a bloom, and few colonies were found in the water (Figure 11). During a typical P. globosa bloom, colonies dominate the phytoplankton community with high biomass (Chen et al., 2002; Hai et al., 2010), and the solitary cells were occasionally found or almost nonexistent in these blooms (Rousseau et al., 1994). During a P. globosa bloom occurred in Pearl River Estuary, the average colony density was 675 colonies/L with the highest value of 2000.2 colonies/L, and the diameter of visible colonies ranged from 0.5 to 2.5 cm (Wang et al., 2010b). The relationship between colony formation and density of solitary cells was revealed by Liu et al. (2021). In their study, P. globosa colonies were observed only when the density of solitary cells reached 104 cells cells/mL. Here, although P. globosa abundance increased during January in the study region, cell densities remained below this 104 cells/mL threshold. Even so, colonies were observed in the field, indicating that the factors controlling colony formation are more complex than replicated in laboratory studies.
Qinzhou Bay is mainly affected by northeast monsoon in winter (Gao and Chen, 2014). The date of sampling in January is 22nd, and this area began to be influenced by strong northeasterly winds two days before the sampling. Three days of strong northeasterly winds resulted in a significant drop in temperature (Figure 2A). The average of salinity in January was lower than in December, and the salinity difference between different stations became smaller (Figures 2B, S2). In particular, stations 01-03 near the inner bay had significantly lower salinities than observed at the outer stations in other months, but were all higher than 27 in January. These changes in salinity may imply that the influence of strong northeasterly winds may result in a mixing/upwelling where the outer bay with high salinity waters were mixed with inner bay low salinity nutrient enriched waters. The characteristics of the resultant new water mass (e.g., lower temperature, elevated nutrient concentrations, perhaps additional planktonic components) that drove the increase in P. globosa, and shaped the composition of the phytoplankton assemblage in January. It was also observed that all three surges in colony density occurred around the third day of strong winds (Xu, 2022). These findings suggest there is a correlation between the occurrence of P. globosa blooms and meteorological conditions.
Studies have shown that P plays a key role in the growth and colony formation of Phaeocystis; the growth and life-history transformation of Phaeocystis are inhibited under P deficiency, under which colonies fail to form (Veldhuis et al., 1991; Riegman et al., 1992). A concentration of 0.5-1 μmol/L phosphate is thought to be necessary for the formation of Phaeocystis colonies (Cariou, 1991). The average DIP in this survey was 0.36 ± 0.33 μmol/L, and the DIP was lower than the threshold for colony formation in P. globosa, especially in January. The DIP at all stations in the study area fell below the absolute P threshold for the growth of phytoplankton (0.1 µmol/L, Peery and Eppley, 1981), so there was not enough P for the cells to continue to grow and form a bloom. Many phytoplankton exploit P from organic sources by synthesizing alkaline phosphatase when DIP is depleted, and P. globosa was found to have the ability to utilize DOP under P limitation (Caroline et al., 2015; Qin et al., 2018; Huang et al., 2021). The DOP also declined to 0.15 ± 0.11 μmol/L in January during this study (data not shown). Mo et al. (2022) conducted nutrient enrichment experiments and confirmed that the addition of P to the surface seawater of Qinzhou Bay could stimulate the colony density, cell number and diameter of colonies. Therefore, phosphorus discharge management should be strengthened to avoid the stimulating effect of sudden P pollution on the growth of P. globosa.
Based on the analysis described above, it was speculated that in January, the mixing event that resulted from the strong northeasterly winds created improved environmental conditions for the growth of P. globosa, but that phosphorus was exhausted before higher cell densities could form. Therefore, the blooms failed to develop due to phosphorus limitation. As phosphorus is indispensable element for the formation of P. globosa colonies, it is speculated that the control of phosphorus input is of great significance for the prevention and control of P. globosa blooms and the reduction in disasters caused by its large colonies.
The phytoplankton diversity in Qinzhou Bay was relatively high, and phytoplankton were negatively affected by phosphorus restriction in the period from autumn to winter. The successional changes in phytoplankton abundance and community in this area were, to a great extent, regulated by physico-chemical factors. P. globosa was the most frequent dominant species in this area. Temperature and DIP were considered to play important roles in the development and elimination of P. globosa blooms. The content of DIP, which was lower than the absolute P limitation in January, may be the reason that the P. globosa bloom failed to fully form during the investigation. Our results reveal the key factors controlling the succession in phytoplankton community in Qinzhou Bay and provided a new glimpse of the occurrence mechanism of P. globosa blooms.
The original contributions presented in the study are included in the article/Supplementary Material. Further inquiries can be directed to the corresponding authors.
YG and BC conceived the project and review the manuscript. XQ and XC performed the experiments and wrote the manuscript. CC, LS, XS and JL contributed to data analysis and manuscript editing. All authors contributed to the article and approved the submitted version.
This work was supported by the Science & Technology Basic Resources Investigation Program of China (No.2018FY100202), and the National Natural Science Foundation of China (No.42066002).
The authors declare that the research was conducted in the absence of any commercial or financial relationships that could be construed as a potential conflict of interest.
All claims expressed in this article are solely those of the authors and do not necessarily represent those of their affiliated organizations, or those of the publisher, the editors and the reviewers. Any product that may be evaluated in this article, or claim that may be made by its manufacturer, is not guaranteed or endorsed by the publisher.
The Supplementary Material for this article can be found online at: https://www.frontiersin.org/articles/10.3389/fmars.2023.1120161/full#supplementary-material
Supplementary Figure 1 | Map showing the temporal and spatial distributions of water temperature (unit: °C) in the surface waters of the study area from October 2018 to March 2019 (A, October 2018; B, November 2018; C, December 2018; D, January 2019; E, February 2019; F, March 2019).
Supplementary Figure 2 | Map showing the temporal and spatial distributions of salinity in the surface waters of the study area from October 2018 to March 2019 (A, October 2018; B, November 2018; C, December 2018; D, January 2019; E, February 2019; F, March 2019).
Supplementary Figure 3 | Map showing the temporal and spatial distributions of chlorophyll a (unit: μg/L) in the surface waters of the study area from October 2018 to March 2019 (A, October 2018; B, November 2018; C, December 2018; D, January 2019; E, February 2019; F, March 2019).
Baudoux A. C., Noordeloos A., Veldhuis M., Brussaard C. (2006). Virally induced mortality of Phaeocystis globosa during two spring blooms in temperate coastal waters. Aquat. Microb. Ecol. 44, 207–217. doi: 10.3354/ame044207
Blauw A. N., Los F. J., Huisman J., Peperzak L. (2010). Nuisance foam events and Phaeocystis globosa blooms in Dutch coastal waters analyzed with fuzzy logic. J. Mar. Syst. 83, 115–126. doi: 10.1016/j.jmarsys.2010.05.003
Cao X. H., Yu Z. M., Qiu L. X. (2017). Field experiment and emergent application of modified clays for Phaeocystis globosa blooms mitigation. Oceanologia limnologia sinica. 48 (4), 753–759. doi: 10.11693/hyhz20170200026
Cariou V. (1991). Etude des mécanismes de formation des colonies de phaeocystis: Influence des phosphates. DEA thesis (Paris: University of Pierre et Marie Curie), 6–41.
Caroline G., Nathalie G., Flynn K. J., Christiane L. (2015). Modelling alkaline phosphatase activity in microalgae under orthophosphate limitation: The case of Phaeocystis globosa. J. Plankton Res. 37 (5), 869–885. doi: 10.1093/plankt/fbv062
Chen Y. Q., Wang N., Zhang P., Zhou H., Qu L. H. (2002). Molecular evidence identifies bloom-forming phaeocystis (Prymnesiophyta) from coastal waters of southeast China as phaeocystis globosa. Biochem. Syst. Ecol. 30, 15–22. doi: 10.1016/S0305-1978(01)00054-0
Cloern J. E. (1996). Phytoplankton bloom dynamics in coastal ecosystems: A review with some general lessons from sustained investigation of San Francisco bay, california. Rev. Geophys 34 (2), 127–168. doi: 10.1029/96RG00986
Cloern J. E., Dufford R. (2005). Phytoplankton community ecology: Principles applied in San Francisco bay. Mar. Ecol. Prog. 285 (Jan), 11–28. doi: 10.3354/meps285011
Cui L., Lu X. X., Dong Y. L., Cen J. Y., Cao R. B., Lu S. H., et al. (2018). Relationship between phytoplankton community succession and environmental parameters in qinhuangdao coastal areas, China: A region with recurrent brown tide outbreaks. Ecotox. Environ. Safe 159, 85–93. doi: 10.1016/j.ecoenv.2018.04.043
Dortch Q., Whitledge T. E. (1992). Does nitrogen or silicon limit phytoplankton production in the Mississippi river plume and nearby regions? Cont. Shelf Res. 12 (11), 1293–1309. doi: 10.1016/0278-4343(92)90065-R
Field C. B., Behrenfeld M. J., Randerson J. T., Falkowski P. G. (1998). Primary production of the biosphere: integrating terrestrial and oceanic components. Science 281 (5374), 237–240.
Gao J. S., Chen B. (2014). Analysis on characteristics and formation mechanism of the winter Boreal circulation in the beibu gulf. Guangxi Science. 21 (1), 64–72.
Grattepanche J. D., Breton E., Brylinski J. M., Lecuyer E., Christaki U. (2011). Succession of primary producers and micrograzers in a coastal ecosystem dominated by Phaeocystis globosa blooms. J. Plankton Res. 33 (1), 37–50. doi: 10.1093/plankt/fbq097
Guo H., Lin F. A., Liu Y. J., Xu D. Y., Lu X. W. (2014). High-incidence HABs causative species in China coastal waters and the forewarning method based on the HABs risk index. Mar. Environ. Science. 33 (1), 94–98. doi: CNKI:SUN:HYHJ.0.2014-01-017
Guo J., Yang W. D., Liu J. S., Fan Z. H. (2007). Effects of salinity, temperature and light intensity on the growth and toxin production of Phaeocystis globosa. Acta Scientiae Circumstantiae. 27 (8), 1341–1346. doi: 10.3321/j.issn0253-2468.2007.08.020
Hai D. N., Lam N. N., Dippner J. W. (2010). Development of phaeocystis globosa blooms in the upwelling waters of the south central coast of Viet nam. J. Mar. Syst. 83, 253–261. doi: 10.1016/j.jmarsys.2010.04.015
He C., Song S. Q., Li C. W. (2019a). The spatial-temperal distribution of phaeocystis globosa colonies and related affecting factors in guangxi beibu gulf. Oceanologia Limnologia Sinica. 50 (3), 630–643. doi: 10.11693/hyhz20180800192
He L. Y., Song X. X., Yu F., Wang K., Song S. Q., Yu Z. M. (2019b). Potential risk and prevention of phytoplankton outbreak to water-cooling system in nuclear power plant in fangchenggang, guangxi. Oceanologia Limnologia Sinica. 50 (3), 701–706. doi: 10.11693/hyhz20190100004
He Q., Xu K. C., Wu S. S., Lin J. Y., Chen B. H., Lin C., et al. (2008). The correlation between phytoplankton diversity and apparent oxygen increment to the prewarning of red tide events. Acta Oceanologica Sinica. 30 (2), 111–116. doi: 10.3321/j.issn:0253-4193.2008.02.013
Healey F. P. (1979). Short-term responses of nutrient-deficient algae to nutrient addition. J. Phycol. 15, 289–299. doi: 10.1111/j.0022-3646.1979.00289.x
Hong M., Li T. S., Lai C. M., Chen L., Li F. H., Lin S. Q. (2014). Multivariate analysis of offshore environmental factors in qinzhou bay from 2008 to 2012. Mar. Evironmental Science. 33 (6), 860–864.
Hu X. K., Zhang Q. C., Chen Z. F., Kong F. Z., Wang J. X., Yu R. C. (2019). Genetic diversity of Phaeocystis globosa strains isolated from the beibu gulf, the south China Sea. Oceanologia limnologia sinica. 50 (3), 601–610. doi: CNKI:SUN:HYHJ.0.2014-06-008
Huang X. Y., Long H., Mo Y., Guan X. (2021). Effects of different phosphorus sources on the growth and colony formation of Phaeocystis globosa. Trans. Oceanology Limnology 1, 117–122, 156. doi: 10.13984/j.cnki.cn37-1141.2021.01.016
Jiang N. (2019). Analysis on the evolution trend of red tide in the beibu gulf of guangxi and its prevention and control ideas. Ocean Dev. management. 11, 82–85. doi: CNKI:SUN:HKGL.0.2019-11-014
Jiang F. J., Chen B., He B. J., Xu M. B., Zhuang J. L., Zhang R. C., et al. (2012). Phytoplankton community in coastal waters of qinzhou bay in guangxi. Guangxi Sci. 3, 268–275. doi: 10.3969/j.issn.1005-9164.2012.03.018
Justić D., Rabalais N. N., Turner R. E., Dortch Q. (1995). Changes in nutrient structure of river-dominated coastal waters: stoichiometric nutrient balance and its consequences. Est. Coast. Shelf. 40 (3), 339–356. doi: 10.1016/S0272-7714(05)80014-9
Kang J. H., Lin Y. L., Yu. W., Lan W. L. (2020a). Assessment of the eutrophication level of the marine environment and its effect on phytoplankton chlorophyll a in qinzhou bay. Ocean Dev. Management. 11, 67–74.
Kang Z. J., Yang B., Lai J. X., Ning Y., Zhong Q. P., Lu D. L., et al. (2020b). Phaeocystis globosa bloom monitoring: based on P. globosa induced seawater viscosity modification adjacent to a nuclear power plant in qinzhou bay, China. Oceanic Coast. Sea Res. 19 (5), 1207–1220. doi: 10.1007/s11802-020-4481-6
Lan W. L. (2012). Eutrophication assessment and its variation trends during dry season of last five years in the qinzhou bay. Environ. Monit. China. 28 (5), 40–44. 10.3969/j.issn.1002-6002.2012.05.009
Lan W. L., Yang S. M., Wei S. (2012). Variation of river pollutant fluxes around qinzhou bay and their environmental impacts. Guangxi Sci. 19 (3), 257–262. doi: 10.3969/j.issn.1002-6002.2012.05.009
Lancelot C. (1995). The mucilage phenomenon in the continental coastal waters of the north Sea. Sci. Total Environ. 165, 83–102. doi: 10.1016/0048-9697(95)04545-C
Lao Q. B., Liu G. Q., Gao J. S., Shen Y. L., Guo Z., Qing S. M., et al. (2021). Study on the characteristics and eutrophication of nutrients in the mariculture farms of qinzhou bay, south China. Mar. Environ. Science. 40 (3), 407–416. doi: 10.13634/j.cnki.mes.2021.03.011
Li H., Gao C. L., Wang X. D., Wang Z. L. (2010). Effects of Chaetoceros minimus on colony development of Phaeocystis globosa. Adv. Mar. Science. 28 (1), 57–63.
Li B., Lan W. L., Li T. S., Li M. M. (2015). Variation of environmental factors during Phaeocystis globosa blooms and its implications for the bloom decay. Chin. J. Ecol. 34 (5), 1351–1358. doi: 10.13292/j.1000-4890.20150311.050
Lin M. F., Zhong Q. P. (2014). Seasonal variation and evaluation on nutrients in qinzhou bay of guangxi province. Environ. Sci. Management. 39 (6), 159–163. doi: 10.3969/j.issn.1673-1212.2014.06.042
Liss P. S., Malin G., Turner S. M., Holligan P. M. (1994). Dimethyl sulphide and Phaeocystis: a review. J. Mar. Syst. 5, 41–53. doi: 10.1016/0924-7963(94)90015-9
Liu L. (2017). The changes of phytoplankton community structure and the analysis of its impact factors in qinzhou bay. dissertation/master’s thesis. Gingdao: First institute of oceanography, state oceanic administration.
Liu L., Li Y., Sun P., Wang Z. L., Xin M. (2020). Seasonal changes of phytoplankton community structure and its influencing factors in qinzhou bay. Mar. Environ. science. 39 (5), 776–790. doi: 10.13634/j.cnki.mes.2020.05.017
Liu Q., Zhang R. J., Huang L., Zhang J. W., Zhuo S. Q., Wang Z., et al. (2021). The effect of Ditylum brightwellii (Bacillariophyceae) on colony development of bloom forming species Phaeocystis globosa (Prymnesiophyceae) under nutrient-replete condition. Mar. pollut. Bull. 167, 112336. doi: 10.1016/j.marpolbul.2021.112336
Luo X., Lan W. L., Li T. S., Li M. M. (2019). Distribution of phytoplankton and its relationship with environmental factors in the qinzhou bay in spring and summer. Acta Ecologica Sinica. 39 (7), 2603–2613. doi: 10.5846/stxb201803090472
Luo J. F., Li T. S., Lan W. L. (2016). Evolution trend and prevention strategy of algae bloom in the beibu gulf. Environ. Protection. 44 (20), 40–42. doi: 10.14026/j.cnki.0253-9705.2016.20.008
Ma Y., Wei W., Gao Z. H., Wang D., Yang. Y., Yu M. (2013). Study of the nutrient distribution and its influence factors in the qinzhou bay. Mar. Sci. bulletin. 32 (5), 481–487. doi: 10.11840/j.issn.1001-6392.2013.05.001
Mars Brisbin M., Mitarai S. (2019). Differential gene expression supports a resource intensive, defensive role for colony production in the bloom-forming haptophyte, Phaeocystis globosa. J. Eukaryot. Microbiol. 66, 788–801. doi: 10.1111/jeu.12727
Mo Y., Lan C. B., Xu M. B., Lai J. X., Ling H. J. (2022). Effects of nitrogen and phosphorus addition on Phaeocystis globosa colony growth in qinzhou bay. Mar. Sci. 46 (5), 30–41. doi: 10.11759/hykx20210601001
Pang B. J., Li T. S., Lan W. L., Li M. M., Luo X., Chen Y. (2018). Distribution patterns and environmental factors of zooplankton in the qinzhou bay in spring and autumn. Acta Ecologica Sinica. 38 (17), 6204–6216. doi: 10.5846/stxb201708121451
Peery M. J., Eppley R. W. (1981). Phosphate uptake by phytoplankton in the central north pacific ocean. Deep-Sea Res. 28, 39–49. doi: 10.1016/0198-0149(81)90109-6
Peng S. T., Qin X. B., Shi H. H., Zhou R., Dai M. X., Ding D. W. (2012). Distribution and controlling factors of phytoplankton assemblages in a semi-enclosed bay during spring and summer. Mar. Pollut. Bull 64, 941–948. doi: 10.1016/j.marpolbul.2012.03.004
Peperzak L. (2002). The wax and wane of phaeocystis globosa blooms. Ph.D. thesis, Groningen: University of Groningen.
Peperzak L., Colijn F., Gieskes W., Peeters J. (1998). Development of the diatom-Phaeocystis spring bloom in the Dutch coastal zone of the north Sea: The silicon depletion versus the daily irradiance threshold hypothesis. J. Plankton Res. 20 (3), 517–537. doi: 10.1093/plankt/20.3.517
Peperzak L., Gieskes W., Duin R., Colijn F. (2000). The vitamin b requirement of Phaeocystis globosa (Prymnesiophyceae). J. Plankton Res. 22 (8), 1529–1537. doi: 10.1093/plankt/22.8.1529
Peperzak L., Poelman M. (2008). Mass mussel mortalitly in the Netherlands after a bloom of Phaeocystis globosa (prymnesiophyceae). J. Sea Res. 60, 220–222. doi: 10.1016/j.seares.2008.06.001
Pielou E. C., Levandowsky M. (1966). The measurement of diversity in different types of biological collections. J. Theoretical Biol. 13, 131–144. doi: 10.1016/0022-5193(66)90013-0
Pitta P., Tsapakis M., Apostolaki E. T., Tsagaraki T., Karakassis I. (2009). 'Ghost nutrients' from fish farms are transferred up the food web by phytoplankton grazers. Mar. Ecol. Prog. 374, 1–6. doi: 10.3354/meps07763
Qin X. L., Chen B., Lai J. X., Lu J. C., Ya H. Z. (2018). Study on the utilization and alkaline phosphatase characteristics of a beibu gulf strain Phaeocystis globosa cultivated in different phosphorus. Guangxi Science. 25 (1), 80–86. doi: 10.13656/j.cnki.gxkx.20180123.001
Redfield A. C. (1958). The biological control of chemical factors in the environment. Am. Sci. 46, 205–255. doi: 10.2307/27827150
Redfield A. C., Ketchum B. H., Richards F. A. (1963). “The influence of organisms on the composition of sea water,” in The sea, vol. 2 . Ed. Hill M. N. (New York: Interscience Puplishers), 26–77.
Riegman R., Noordeloos A. A. M., Cadée G. C. (1992). Phaeocystis blooms and eutrophication of the continental coastal zones of the North Sea. Mar. Biol. 112 (3), 479–484. doi: 10.1007/BF00356293
Rousseau V., Vaulot D., Casotti R., Cariou V., Lenz J., Gunkel J., et al. (1994). The life cycle of Phaeocystis (Prymnesiophycaea): Evidence and hypotheses. J. Mar. Syst. 5 (1), 23–39. doi: 10.1016/0924-7963(94)90014-0
Sazhin A. F., Artigas L. F., Nejstgaard J. C., Frischer M. E. (2007). The colonization of two phaeocystis species (Prymnesiophyceae) by pennate diatoms and other protists: a significant contribution to colony biomass. Biogeochemistry 83 (1/3), 137–145. doi: 10.1007/s10533-007-9086-2
Seuront L., Vincent D., Mitchell J. G. (2006). Biologically induced modification of seawater viscosity in the Eastern English channel during a Phaeocystis globosa spring bloom. J. Mar. Syst. 61, 118–133. doi: 10.1016/j.jmarsys.2005.04.010
Shannon C. E. (1948). A mathematical theory of communication. Bell. Syst. Tech. J. 27, 379–423. doi: 10.1002/j.1538-7305.1948.tb01338.x
Shields A. R., Smith W. (2008). An examination of the role of colonial Phaeocystis antarctica in the microbial food web of the ross sea. Polar Biol. 31 (9), 1091–1099. doi: 10.1007/s00300-008-0450-z
Silva C., Yáñez E., Martín-Díaz M. L., Delvalls T. A. (2012). Assessing a bioremediation strategy in a shallow coastal system affected by a fish farm culture - application of GIS and shellfish dynamic models in the Rio San Pedro, SW Spain. Mar. pollut. Bull. 64, 751–765. doi: 10.1016/j.marpolbul.2012.01.019
Sommer U., Maciej Gliwicz Z. (1986). Long range vertical migration of Volvox in tropical lake cahora bassa (Mozambique). Limnol. Oceanogr. 31, 650–653. doi: 10.4319/lo.1986.31.3.0650
Veldhuis M. J. W., Colijn F., Admiraal W. (1991). Phosphate utilization in phaeocystis pouchetii (Haptophyceae). Mar. Ecol. 12 (1), 53–62. doi: 10.1111/j.1439-0485.1991.tb00083.x
Wang K., Chen B. H., Gao Y. H., Lin H. (2021b). Harmful algal blooms caused by phaeocystis globosa from 1997 to 2018 in Chinese coastal waters. Mar. pollut. Bull. 173, 112949. doi: 10.1016/j.marpolbul.2021.112949
Wang X. D., Huo Y. P., Yang F., Wang Y. (2021c). Induced allelopathic effects of Thalassiosira weissflogii on colony formation in Phaeocystis globosa. Water 13, 581. doi: 10.3390/w13050581
Wang J. X., Kong F. Z., Geng H. X., Zhang Q. C., Yuan Y. Q., Yu R. C. (2021a). CHEMTAX analysis of phytoplankton assemblages revealed potential indicators for blooms of haptophyte. Phaeocystis globosa. Ecol. Indic. 131, 108177. doi: 10.1016/j.ecolind.2021.108177
Wang C., Li X. H., Lai Z. N., Fang Z., Wu Q., Hu X. Y., et al. (2010a). Study on phytoplankton community structure at the late stage of a Phaeocystis globosa bloom in the pearl river estuary. Ecol. Science. 29 (2), 140–146. doi: 10.3969/j.issn.1008-8873.2010.02.009
Wang Y., Nie R., Li Y., Lu S. H. (2010b). Species diversity and geographical distribution of Chaetoceros in guangdong coastal water. Adv. Mar. Science. 28 (3), 342–352. doi: CNKI:SUN:HBHH.0.2010-03-011
Wang Y., Tang H. R. (2006). Effects of different phosphorus on the growth and alkaline phospohatase activity in Phaeocystis globosa. Ecologic Science. 25 (1), 38–40.
Wassmann P., Ratkova T., Andreassen I., Vernet M., Pedersen G., Rey F. (2010). Spring bloom development in the marginal ice zone and the central barents Sea. Mar. Ecology. 20 (3-4), 321–346. doi: 10.1046/j.1439-0485.1999.2034081.x
Wei M. X., He B. M. (2008). Change trend of water environmental index in last 20a of qinzhou bay v. biomass distribution of phytoplankton and effect factors. Mar. Environ. science. 27 (3), 253–257. doi: 10.3969/j.issn.1007-6336.2008.03.014
Xu M. (2012). Research on water quality and eutrophication of typical bays: A case study of qinzhou bay. master thesis, Chinese research academy of environmental sciences
Xu M. B. (2022). The key influencing factors in solitary cell and colony stages of phaeocystis globosa in beibu gulf. Nanning: Guangxi university.
Xu M., Han B. X., Long Y. X. (2012). Analysis of the variation trend and sources of nitrogen and phosphorus in qinzhou bay in the last 30 years. J. Environ. Eng. Technology. 2 (3), 253–258. doi: 10.3969/j.issn.1674-991X.2012.03.039
Xu S. N., Lin H. J., Dai M., Xiao Y. Y., Chen Z. Z. (2014). Ecological characteristics of phytoplankton communities in coastal waters of guangxi. Chin. J. Ecology. 33 (10), 2733–2739. doi: CNKI:SUN:STXZ.0.2014-10-022
Xu Q. S., Wang P. B., Huangleng J. H., Su H. Q., Chen P. Y., Chen X., et al. (2022). Co-Occurrence of chromophytic phytoplankton and the vibrio community during Phaeocystis globosa blooms in the beibu gulf. Sci. Total Environ. 805, 150303. doi: 10.1016/j.scitotenv.2021.150303
Yentsch C. S., Menzel D. W. (1963). A method for the determination of phytoplankton chlorophyll and phaeophytin by fluorescence. Deep Sea Res. 10, 221–231. doi: 10.1016/0011-7471(63)90358-9
Yogaswara D. (2020). Distribusi dan siklus nutrient di perairan estuari serta pengendaliannya. OSEANA 45 (1), 28–39. doi: 10.14203/oseana.2020.Vol.45No.1.52
Zhang W. J. (2021). Effects of inorganic phosphorus limitation on the growth and transcription expression of thalassiosira rotula. Zhoushan: Zhejiang Ocean University.
Keywords: Qinzhou Bay, phytoplankton, Phaeocystis globosa, harmful algal blooms, assemblages
Citation: Qin X, Chen X, Chen C, Sun L, Su X, Liang J, Chen B and Gao Y (2023) Succession and controlling factors of phytoplankton assemblages during a period with recurrent outbreaks of Phaeocystis globosa blooms in Qinzhou Bay, China. Front. Mar. Sci. 10:1120161. doi: 10.3389/fmars.2023.1120161
Received: 09 December 2022; Accepted: 24 February 2023;
Published: 10 March 2023.
Edited by:
Sibel Bargu, Louisiana State University System, United StatesCopyright © 2023 Qin, Chen, Chen, Sun, Su, Liang, Chen and Gao. This is an open-access article distributed under the terms of the Creative Commons Attribution License (CC BY). The use, distribution or reproduction in other forums is permitted, provided the original author(s) and the copyright owner(s) are credited and that the original publication in this journal is cited, in accordance with accepted academic practice. No use, distribution or reproduction is permitted which does not comply with these terms.
*Correspondence: Yahui Gao, Z2FveWhAeG11LmVkdS5jbg==; Bo Chen, Z3hreHljYkAxNjMuY29t
Disclaimer: All claims expressed in this article are solely those of the authors and do not necessarily represent those of their affiliated organizations, or those of the publisher, the editors and the reviewers. Any product that may be evaluated in this article or claim that may be made by its manufacturer is not guaranteed or endorsed by the publisher.
Research integrity at Frontiers
Learn more about the work of our research integrity team to safeguard the quality of each article we publish.