 Taavi Liblik
 Stella-Theresa Stoicescu
 Fred Buschmann
 Urmas Lips
- Department of Marine Systems, Tallinn University of Technology, Tallinn, Estonia
The Gulf of Riga is a shallow basin in the eastern Baltic Sea connected to the Central Baltic Sea via shallow straits. Seasonal oxygen depletion occurs in the deep layer of the gulf. We conducted hourly measurements of dissolved oxygen, temperature, and salinity in the deep layer (50 m) of the gulf and observed the full cycle of development and relaxation of hypoxia in 2021. Hypoxia (<2.9 mg l-1) first occurred on 27 June and was observed for 71 days until its complete decay on 22 October. Average oxygen decline of 0.10 mg l-1 d-1 from saturation in mid-April until mid-July and 0.04 mg l-1 d-1 onwards until the end of August were observed. This seasonal pattern was superimposed by short-term variability in time scales from hours to days and was probably caused by inertial oscillations, (sub)mesoscale processes, deep layer currents, and pycnocline movements. Ventilation events with a relatively low impact and duration of up to ten days occurred in the deep layer due to the inflows of the saltier water from the Central Baltic. The inflowed water originated from the upper layer in winter and the thermocline in summer and was almost saturated in oxygen. Mostly mixing with existing oxygen-depleted water in the Gulf of Riga, but also local consumption declined the oxygen levels in the inflow water before it arrived at the observing station. Monthly standard deviations in oxygen varied from 0.3 to 2.8 mg l-1 and illustrated the added value of Eulerian measurements to complement the conventional monitoring.
1 Introduction
Oxygen depletion in the coastal ocean has expanded globally (Diaz and Rosenberg, 2008) and in the Baltic Sea (Schmidt et al., 2021; Krapf et al., 2022) since the 1960s. In many coastal areas, oxygen declines have been caused by increased loadings of nutrients (Breitburg et al., 2018), and the semienclosed Gulf of Riga in the Baltic Sea is a showcase of such changes.
Unlike the Central Baltic (CB) Sea, where hypoxia/anoxia below the permanent halocline can last for years and can only be interrupted by Major Baltic Inflows (Mohrholz et al., 2015; Liblik et al., 2018), oxygen depletion in the Gulf of Riga (GoR) is a seasonal phenomenon (Berzinsh, 1995; Stoicescu et al., 2022), which is characteristic of coastal marine systems under the anthropogenic impact (e.g. Dietze and Löptien, 2021; Lee et al., 2021; Sun et al., 2022).
The GoR is located in the Eastern Baltic Sea and is connected to the saltier CB via Irbe Strait in the west and Suur Strait (Figure 1). The Irbe Strait is the major contributor to the saltier water input to the GoR. The sill depths in the straits (25 m and 5 m, respectively) are clearly shallower than the halocline, which separates oxic and oxygen-depleted water in the CB (Meyer et al., 2018; Almroth-Rosell et al., 2021). Thus, hypoxic/anoxic water from the CB cannot enter the GoR, and oxygen depletion in the GoR is a result of local processes. The present extent of deoxygenation in the Baltic Sea is caused by eutrophication (Conley et al., 2009).
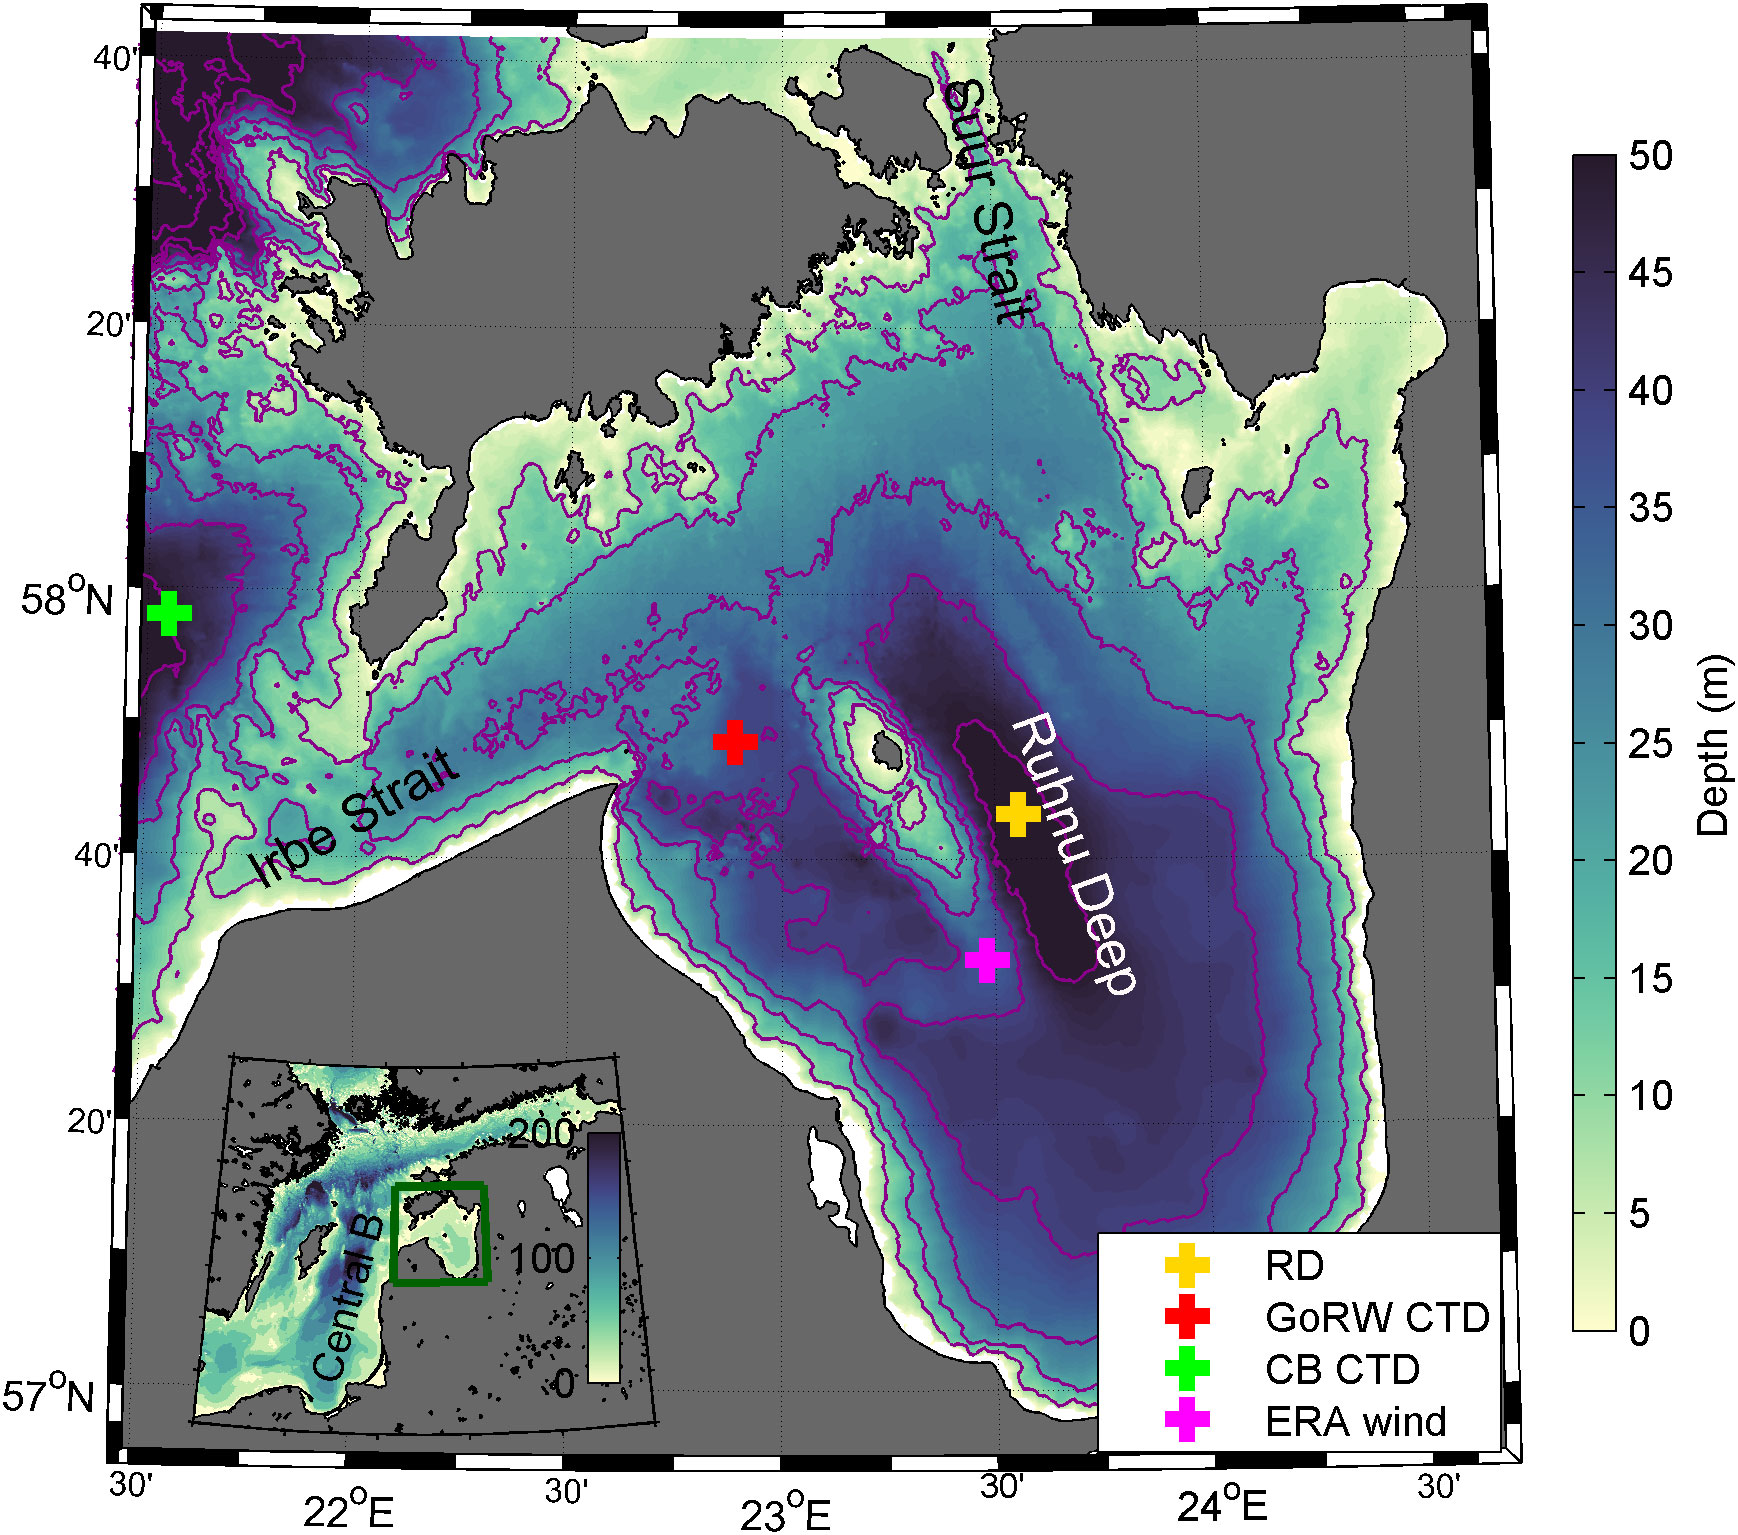
Figure 1 Locations of CTD stations in the Central Baltic (CB) and the western Gulf of Riga (GoRW), ERA wind data acquisition (ERA wind) and the mooring in the Ruhnu Deep (RD) are shown. Colormap shows the sea depths; isolines are shown by 10 m step.
Convection and wind stirring ventilate the whole water column in the GoR in winter. The onset of stratification in spring is created by buoyancy forcing resulting from riverine freshwater flux (Stipa et al., 1999), which is concentrated in the southern part of the gulf (Stipa et al., 1999; Skudra and Lips, 2017). Stratification in summer is mostly maintained by the vertical temperature gradient, while haline stratification is a minor contributor (Liblik et al., 2017). Oxygen consumption exceeds the oxygen import to the sub-surface layer by physical processes, and as a result, oxygen concentration declines in the deep layer during summer (Berzinsh, 1995; Liblik et al., 2017; Stoicescu et al., 2022).
Southwesterly winds cause downwelling in the western (CB) side of the Irbe Strait. Part of the downwelling water enters the GoR and mixes with ambient fresher GoR water and forms buoyant saline and warm (sub)mesoscale features, which do not ventilate the deep layer in the GoR (Liblik et al., 2017). Northeasterly winds cause upwelling on the western side of the Irbe Strait. Part of the upwelling water likely enters the gulf and could be dense enough for deepwater renewal.
The variability in meteorological conditions could cause inter-annual variability in the deep layer oxygen conditions, and as a result, hypoxia does not occur every year (Stoicescu et al., 2022). However, the current evaluations of deep water oxygen conditions rely solely on sparse shipborne conventional monitoring, which is done by research vessels 5-6 times a year (Liblik et al., 2017; Stoicescu et al., 2022). The high-frequent temperature and salinity profiling (Liblik et al., 2017) and near-bottom temperature observations (Raudsepp and Kõuts, 2001) have hinted that the infrequent shipborne sampling might miss a large extent of variability and events. Variability in oxygen conditions alters nutrient fluxes at the sediment boundary (Eglite et al., 2014; Stoicescu et al., 2022), benthic communities (e.g. Rousi et al., 2013), and pelagic fish (e.g. Limburg and Casini, 2018). In conclusion, the ecological consequences of the variability in oxygen depletion could be significant, but the deep-layer oxygen conditions are currently studied only by sparse shipborne measurements in the GoR.
In the present work, we report the results from the first continuous measurements of dissolved oxygen, salinity, and temperature in the deep layer of the GoR. The main aim of the work was to analyze and describe the time series of deep layer observations from the saturated state in spring to the formation of oxygen depletion (hypoxia) in summer/autumn until the decay of depletion.
Particularly, the following objectives were set in this study: Estimate the characteristic oxygen decline rate in the near-bottom layer of the GoR; Describe the governing processes causing shorter-term variability in oxygen, their time scales and the magnitude of caused changes; Estimate the impact of inflowing CB water on the oxygen conditions in the GoR deep layer; Assess the added value of near-bottom moorings on the existing observing program in the GoR.
2 Data and methods
SBE 37-SMP-ODO MicroCAT (Sea-Bird Scientific) recorder was deployed to measure temperature, conductivity (to calculate Absolute Salinity), and dissolved oxygen at 50.5 m depth at the RD station on 28 January 2021. The sea bottom depth in the mooring location was 54 m. We present the time series until 23 October 2021, when turnover and ventilation of the water column occurred (Figure 2). The monthly standard deviations of oxygen were calculated until the end of the year.
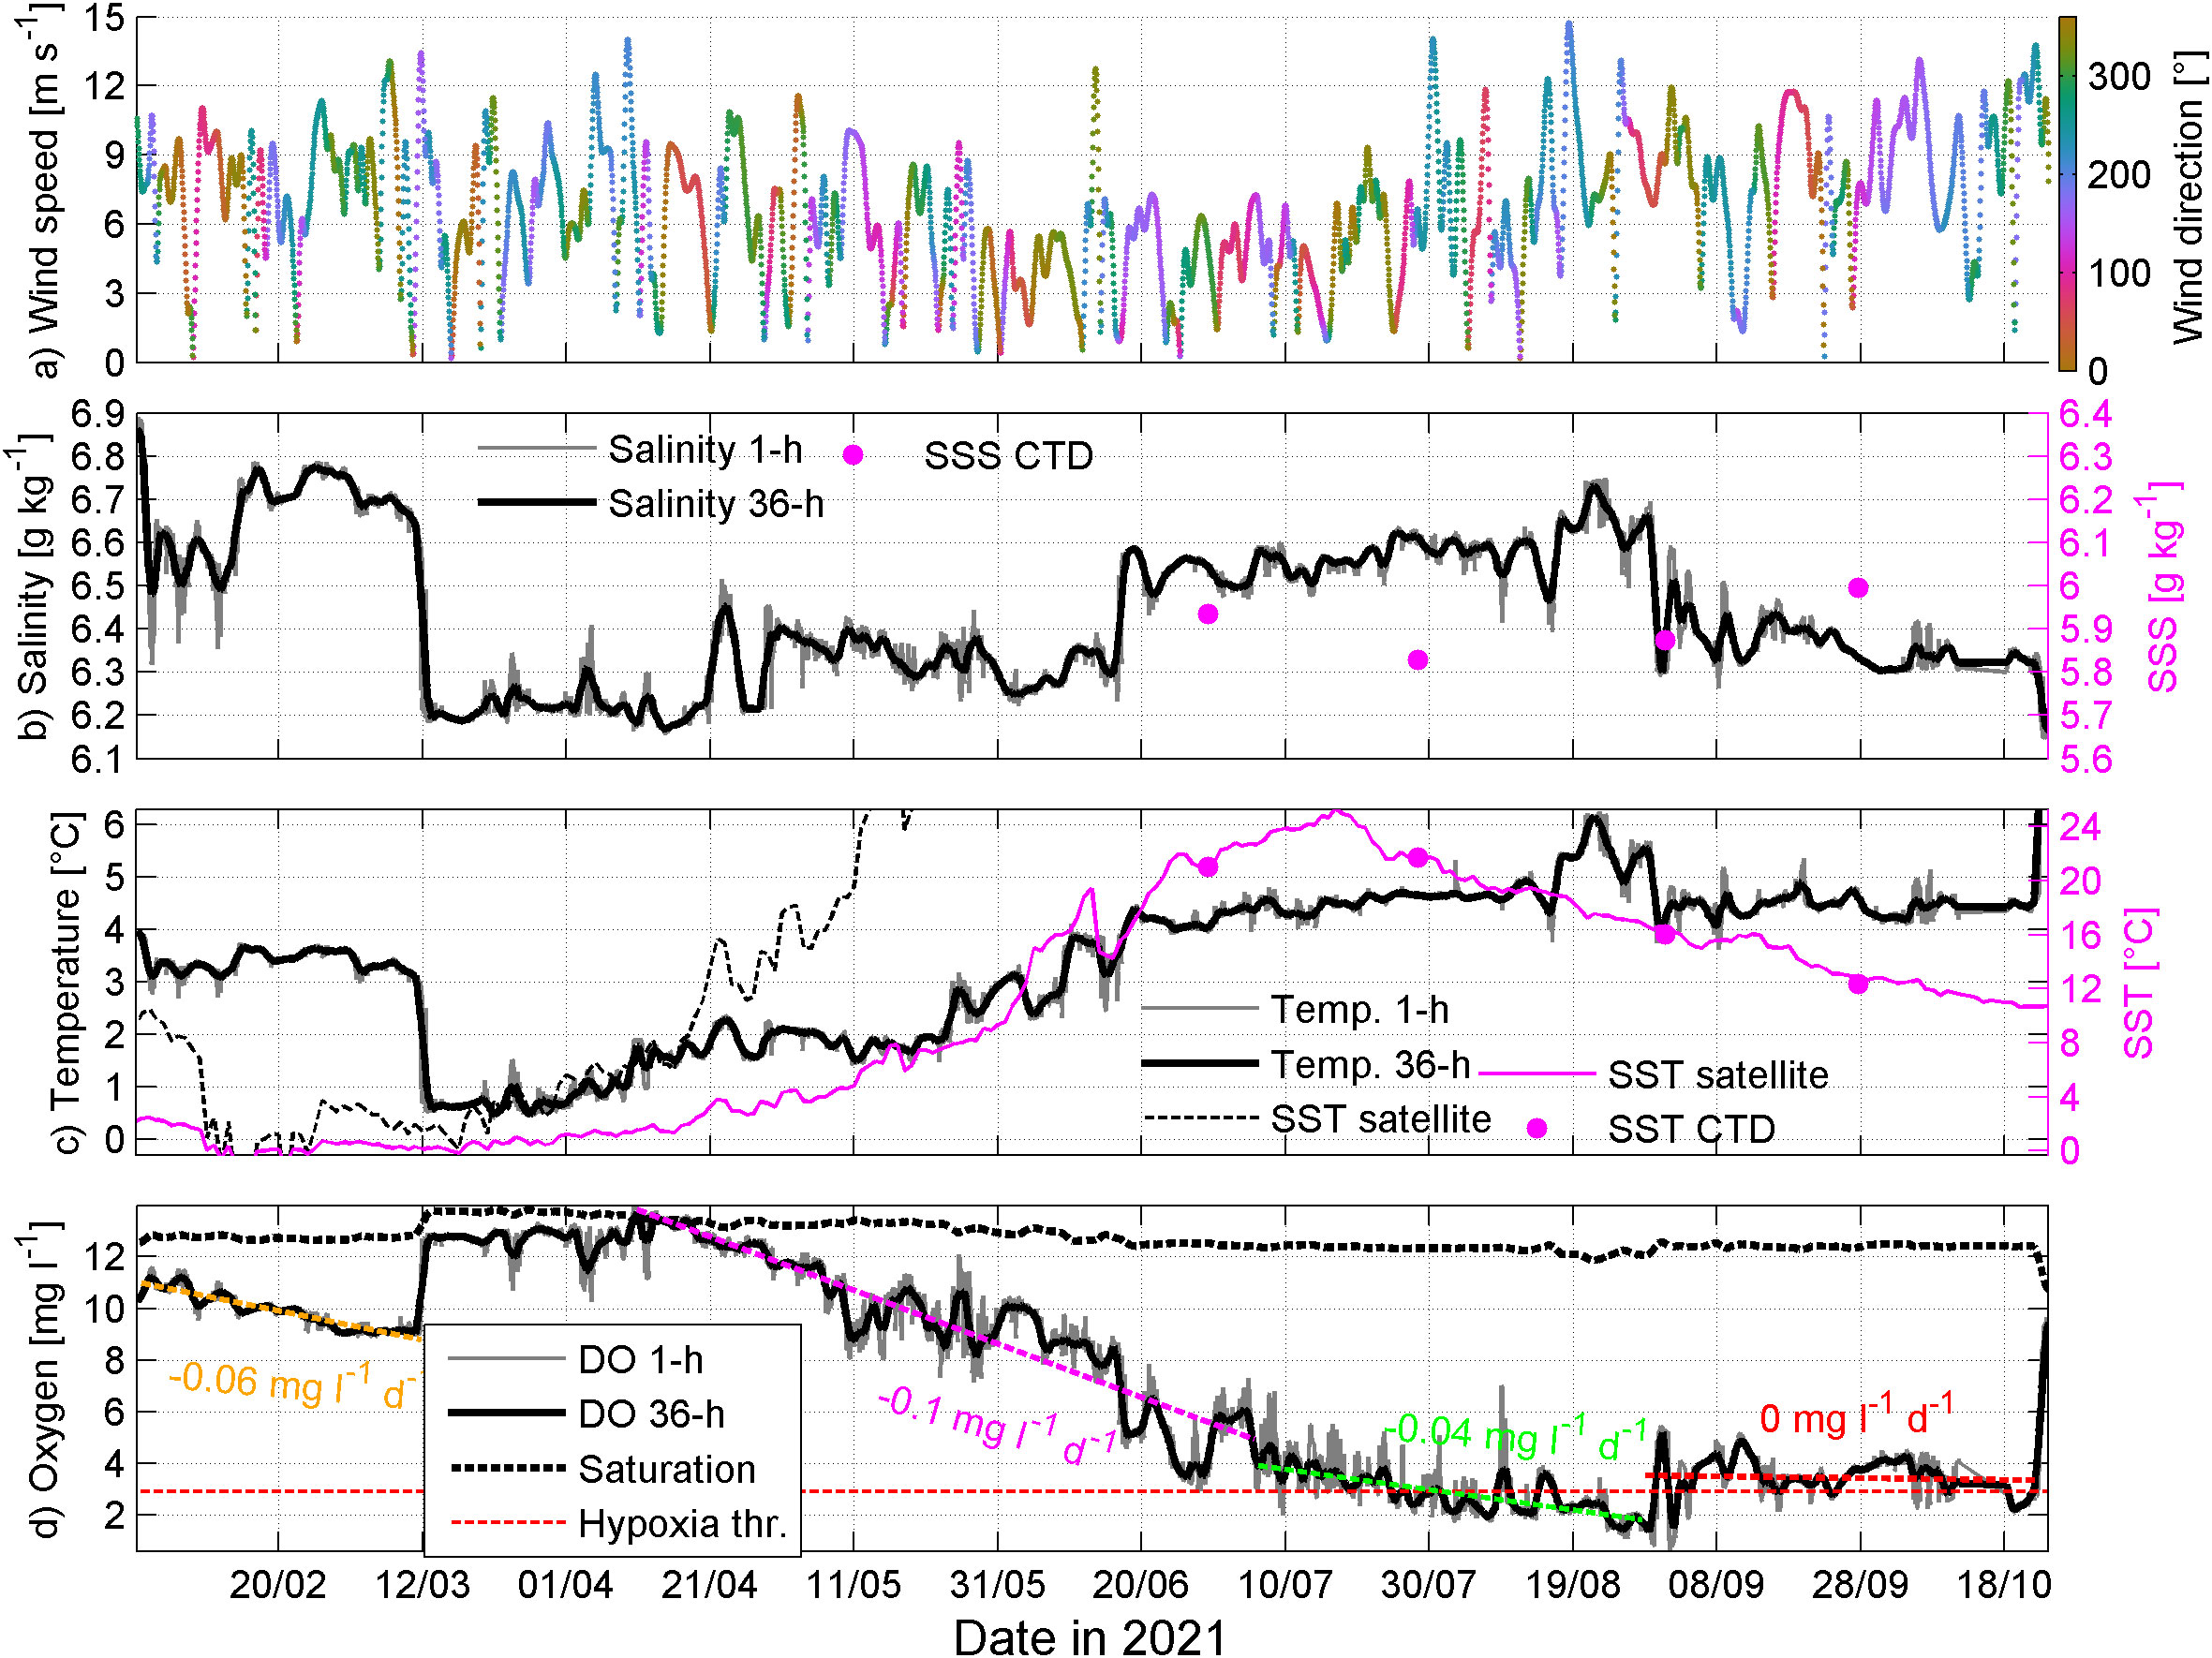
Figure 2 Wind speed and direction (ERA wind in Figure 1), salinity, temperature, and dissolved oxygen at 50 m depth in RD station from 28 January to 23 October 2021. Bold lines correspond to 36-h smoothed values. Sea surface temperature (from remote sensing as the purple line and CTD profiles as the purple dots) and salinity (dots) are shown in the middle panels (the scale of the right axis is different from the left axis).
The recorder was calibrated by the manufacturer, and it was checked against RV Salme measurements before and after deployment, as described in the best practices of ocean observatories (Venkatesan et al., 2018). The recorder was attached to the CTD Rosette, and parallel measurements at selected depths were carried out (Karstensen, 2005). The profiles onboard RV Salme were recorded using an Ocean Seven 320plus CTD probe (Idronaut S.r.l). The oxygen sensor (Idronaut S.r.l) attached to the probe was calibrated before each cruise and oxygen profiles were quality-checked against bottle samples that were analyzed using the MU 6100 L multi-parameter meter (VWR International, LLC). The salinity data of the RV probe was checked against the water sample analyses using a salinometer 8410A Portasal (Guildline). No correction of MicroCAT recorder measurements was needed. Hourly, 10 m level wind velocities of ERA5 reanalysis data (Hersbach et al., 2020) were used (see Figure 1 for location).
The MATLAB function ‘pwelch’ was used to estimate the power spectral density (PSD). To increase the accuracy of the PSD estimates, the time series were divided into eight equal-length segments. The calculated spectra having 16 degrees of freedom were presented with 95%-confidence bounds.
The MATLAB function ‘findchangepts’ (Killick et al., 2011) was used to estimate the shift in linear trend in mid-summer.
3 Results and discussion
3.1 Time-series of water properties in the Ruhnu Deep
The oxygen depletion cycle started in mid-April when water was saturated and lasted until 23 October, when the turnover of the water column occurred (Figure 2D).
Water was well ventilated, although not saturated in oxygen until mid-March. Salinity was high and water was rather warm compared to previous observations (Raudsepp, 2001; Stoicescu et al., 2022), indicating that an inflow of the CB water had occurred (Figures 2B–D). Oxygen decline trend of -0.06 mg l-1 d-1 was observed from the end of January to 11 March. Only the eastern part of the gulf was covered by ice in winter (not shown). A strong mixing event occurred as a result of strong winds in the first half of March (Figure 2A), and consequently, temperature and salinity decreased and oxygen concentration rose. Water was fully saturated in oxygen in mid-April, and as stratification formed, oxygen concentration started to decrease. A relatively stable decreasing trend of -0.10 mg l-1 d-1, although superimposed by shorter-term variability, was observed until 5 July (Figure 2C). According to the breakpoint analysis, the trend eased off around 5 July, and a decline in oxygen concentration of -0.04 mg l-1 d-1, on average, lasted until the strong SW wind event, which caused an instantaneous oxygen increase on 29 August. The AOU (apparent oxygen utilization) trends during the same periods before and after 5 July were 0.09 and 0.03 mg l-1 d-1, respectively. Thus, the trend in oxygen solubility due to temperature and salinity changes had a minor effect on the seasonal oxygen decrease. The faster oxygen decline in spring and early summer was probably related to the higher primary production (spring bloom), related sedimentation of organic matter, and consequent oxygen consumption (Olli and Heiskanen, 1999; Aigars et al., 2015; Purina et al., 2018). The connection between primary production in the upper layer and oxygen depletion in the near-bottom layer has been found in many estuarine environments, e.g., in the Changjiang (Yangtze) Estuary (e.g. Wei et al., 2021; Wei et al., 2022). The second reason for the faster oxygen decrease in spring and early summer was likely the strengthening of the stratification.
Various oxygen metrics have been established to describe oxygen deficiency (e.g. Piehl et al., 2022). In the present work, we describe the deficiency by the temporal presence of hypoxia (< 2.9 mg l-1). The first oxygen value below the hypoxic level was registered already on 27 June and occasional hypoxia was observed until mid-July, after which hypoxic conditions prevailed until the end of August (Figure 2D). After the mixing event on 29 August, hypoxia occurred occasionally, and oxygen concentration did not show any significant trend until turnover of the water column on 23 October. The last day hypoxia occurred was 22 October. In total, hypoxic water was present for 1050 hours, i.e., 44 days. There were 71 days when hypoxia was at least once observed and the longest continuous period of such days was 23 days in the beginning of August.
Water gradually got saltier and warmer until the second half of August. Despite high short-term variability, several gradual shifts can be distinguished in salinity. From mid-March to mid-April, salinity was mostly around 6.2-6.3 g kg-1, until mid-June 6.3-6.4 g kg-1, until mid-August 6.5-6.6 g kg-1, and peaked at 6.75 g kg-1 on 23 August. After the latter, salinity dropped to 6.3-6.5 g kg-1 and again on 23 October to 6.1-6.2 g kg-1. The temperature did not exactly follow the temporal course of salinity. Shifts in salinity in mid-April and mid-June were preceded by smoother temperature increases during about 3-4 weeks. Compared to previous observations (Raudsepp, 2001; Skudra and Lips, 2017; Stoicescu et al., 2022), the near-bottom water was warmer and saltier in the summer of 2021, indicating higher salty water inflow activity than usual. The details and spatial features behind detected gradual shifts can be effectively analyzed in further studies where high-resolution vertical profiling with a moored profiler and underwater glider is included in an observing system.
3.2 Variability of deep water characteristics
On top of the seasonal trends in oxygen, shorter-term variability was observed. Spectra of oxygen, temperature, and salinity variance revealed elevated energy at 14.2 h, which is associated with the inertial oscillations also observed earlier in the GoR (Raudsepp and Kõuts, 2001). Internal waves probably impact the time series in shorter time scales, while irregular variability in the time scale from day to week reflects synoptic-scale changes in forcing.
The oxygen and water temperature spectral slopes between the temporal scales of 25 h and 7 d were about −1.8 to −2 (in logarithmic scale). Wavenumber spectra slope around -2 suggests a significant role of sub-mesoscale processes in vertical exchanges (Lips et al., 2016; Väli et al., 2017). The profiling data collected over 4 months revealed the existence of submesoscale features within the seasonal thermocline of the GoR (Liblik et al., 2017). High-resolution measurements in space are required to understand better the role of submesoscale processes in the Gulf of Riga deep layer.
Next, we analyze and discuss the synoptic scale variability of water column properties. In Figures 3A–C, we present the daily changes in salinity (a), temperature (b), and oxygen (c). In panel d, changes in detrended 3-day mean oxygen are shown.
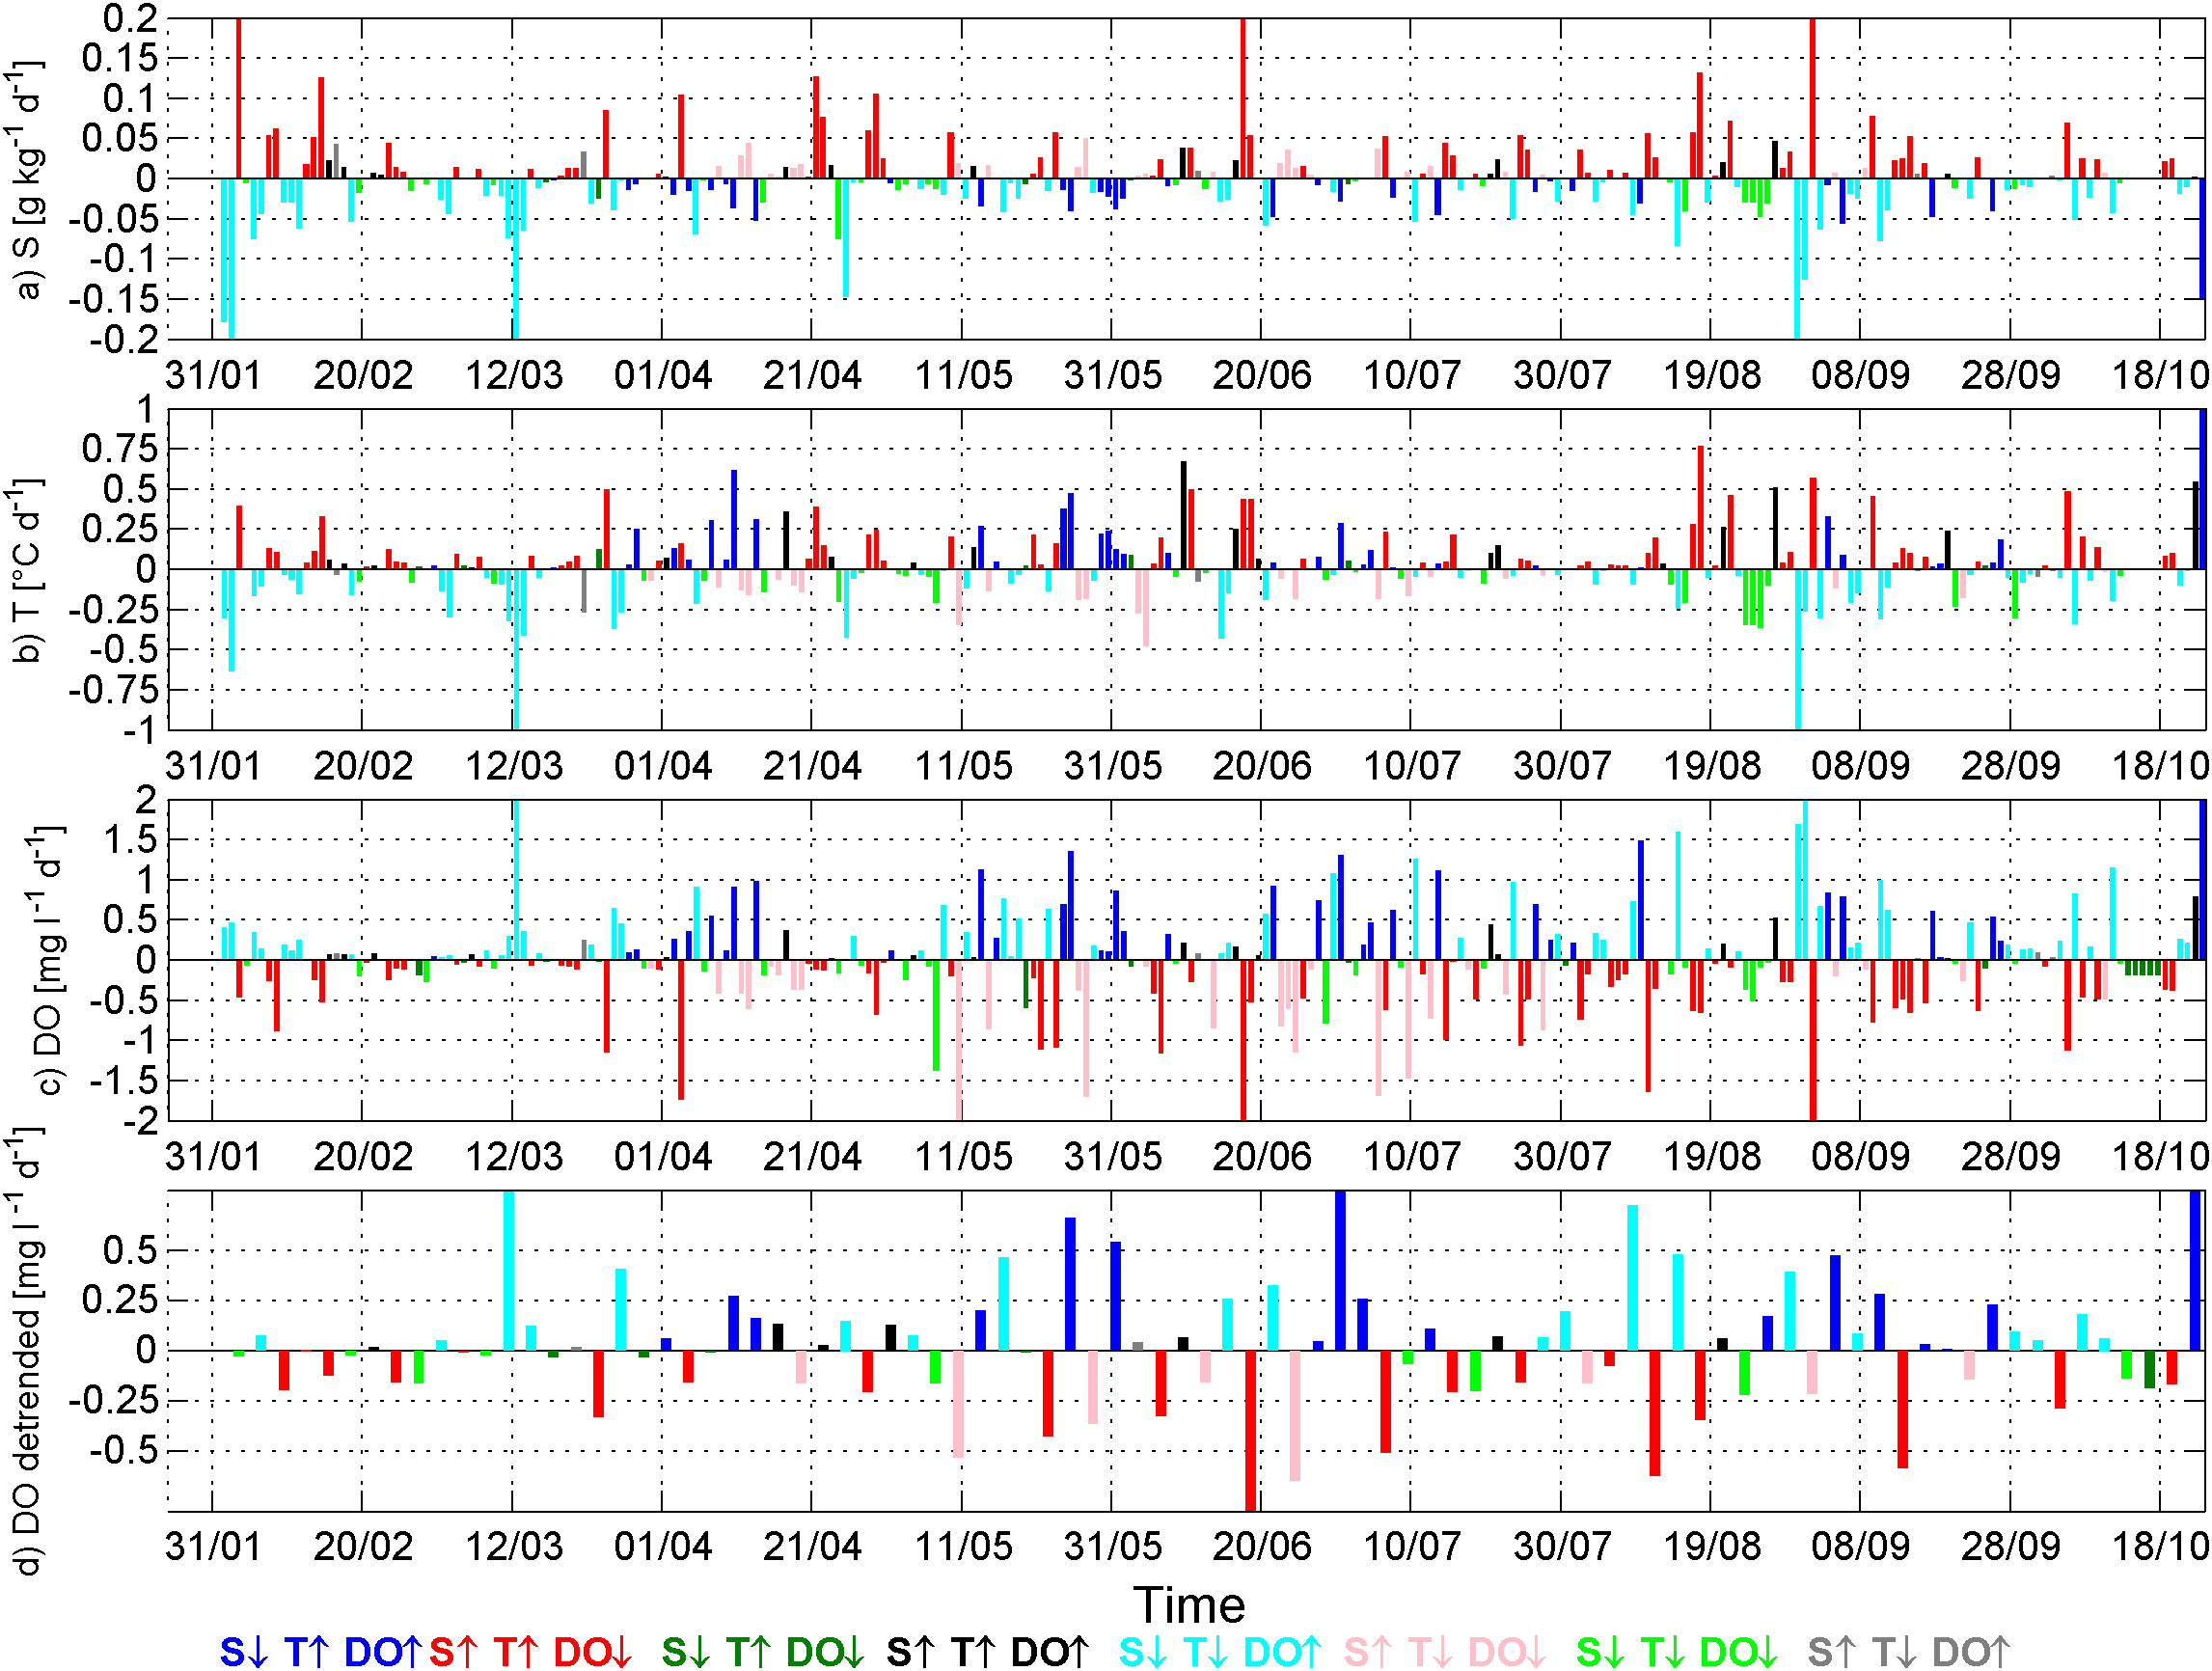
Figure 3 Daily changes in salinity, temperature, and oxygen (A–C) from 28 January to 23 October 2021. Detrended (according to the linear trends shown in Figure 2C) 3-day mean changes of oxygen (D). Colors show the positive or negative changes of variables, as shown at the bottom of the figure.
Throughout the time series, the increase in salinity corresponded mostly to the decrease in oxygen (red and pink color in Figures 3A, C) and vice-versa (blue and cyan color in Figures 3A, C) (red and pink color in Figures 3A, C). These events were probably related to the upward and downward movement of clines caused by the wind-driven current in the upper layer and return flow in the deep layer (Raudsepp and Kõuts, 2001).
Until March, an increase in oxygen and decrease in salinity were associated with a temperature decrease (cyan color in Figure 3A) and lower oxygen was associated with higher salinity and higher temperature (red color in Figure 3A). This can be explained by cooling of the upper layer water and reversed thermal stratification (i.e. colder water at the sea surface, warmer in the near-bottom layer). When vertical mixing occurred (e.g. the main event on 8-13 March, see Figures 3A–C) or pycnocline moved downwards, oxygen increased and temperature/salinity decreased. Saltier and warmer water re-appearance caused a decrease in oxygen.
High salinity-low oxygen and vice-versa relation kept prevailing the variability after March, but the temperature and salinity relationship were not that obvious until autumn, i.e. sometimes high salinity-low oxygen associated with higher temperature (red color on Figures 3A–C), sometimes with lower temperature (pink color on Figures 3A–C). It is probably related to the cold intermediate layer, which is not well pronounced in the GoR (Stipa et al., 1999; Liblik et al., 2017; Skudra and Lips, 2017; Stoicescu et al., 2022).
The arrival of oxygenated water from the CB is revealed by a simultaneous increase in salinity, temperature, and oxygen (black color in Figures 3A–C). These events are rather rare compared to the upward and downward movements of pycnoclines. Several small positive oxygen fluxes as a result of transport from the CB occurred in mid-April, mid-June, on 20-21 July, and on 20 and 27 August. Sometimes, oxygen decrease occurred simultaneously with the decrease in salinity and temperature (green color, Figures 3A–C). These cases likely indicate the events of reappearance of older low-oxygen GoR water after the mixing event or the CB inflow event, e.g. after the event on 20 August.
Most of the oxygen increase events were followed by oxygen decrease and salinity increase events due to the cline variability. We removed seasonal linear trends (Figure 2D) and calculated changes in the 3-day mean oxygen content to present the multi-day changes of oxygen (Figure 3D). The ventilation events caused by the CB water arrival can be recognized in the time series, but compared to the magnitude of internal variability of the GoR they are rather small (Figure 3D). Moreover, the amount of oxygen the inflows brought to the Ruhnu Deep was so small that this new oxygen disappeared after few days if considering the seasonal trends (Figure 2C).
3.3 Ventilation events: Origin and fate of inflowing waters
Several small ventilation events were detected in the time series and can be seen in OS diagrams (Figures 4B, D). Transport through the Irbe Strait plays an important role in the deep water renewal in the GoR (Raudsepp and Kõuts, 2001; Stoicescu et al., 2022). This is confirmed by the TS- and OS-diagrams – the origin of the arrived water with higher oxygen content was saltier and warmer (Figures 4A–D). Both northerly or southerly wind-generated flow events in the Irbe Strait and simultaneous upwelling and downwelling, respectively, at the western side of the strait, could potentially bring water to the deep layers of the GoR.
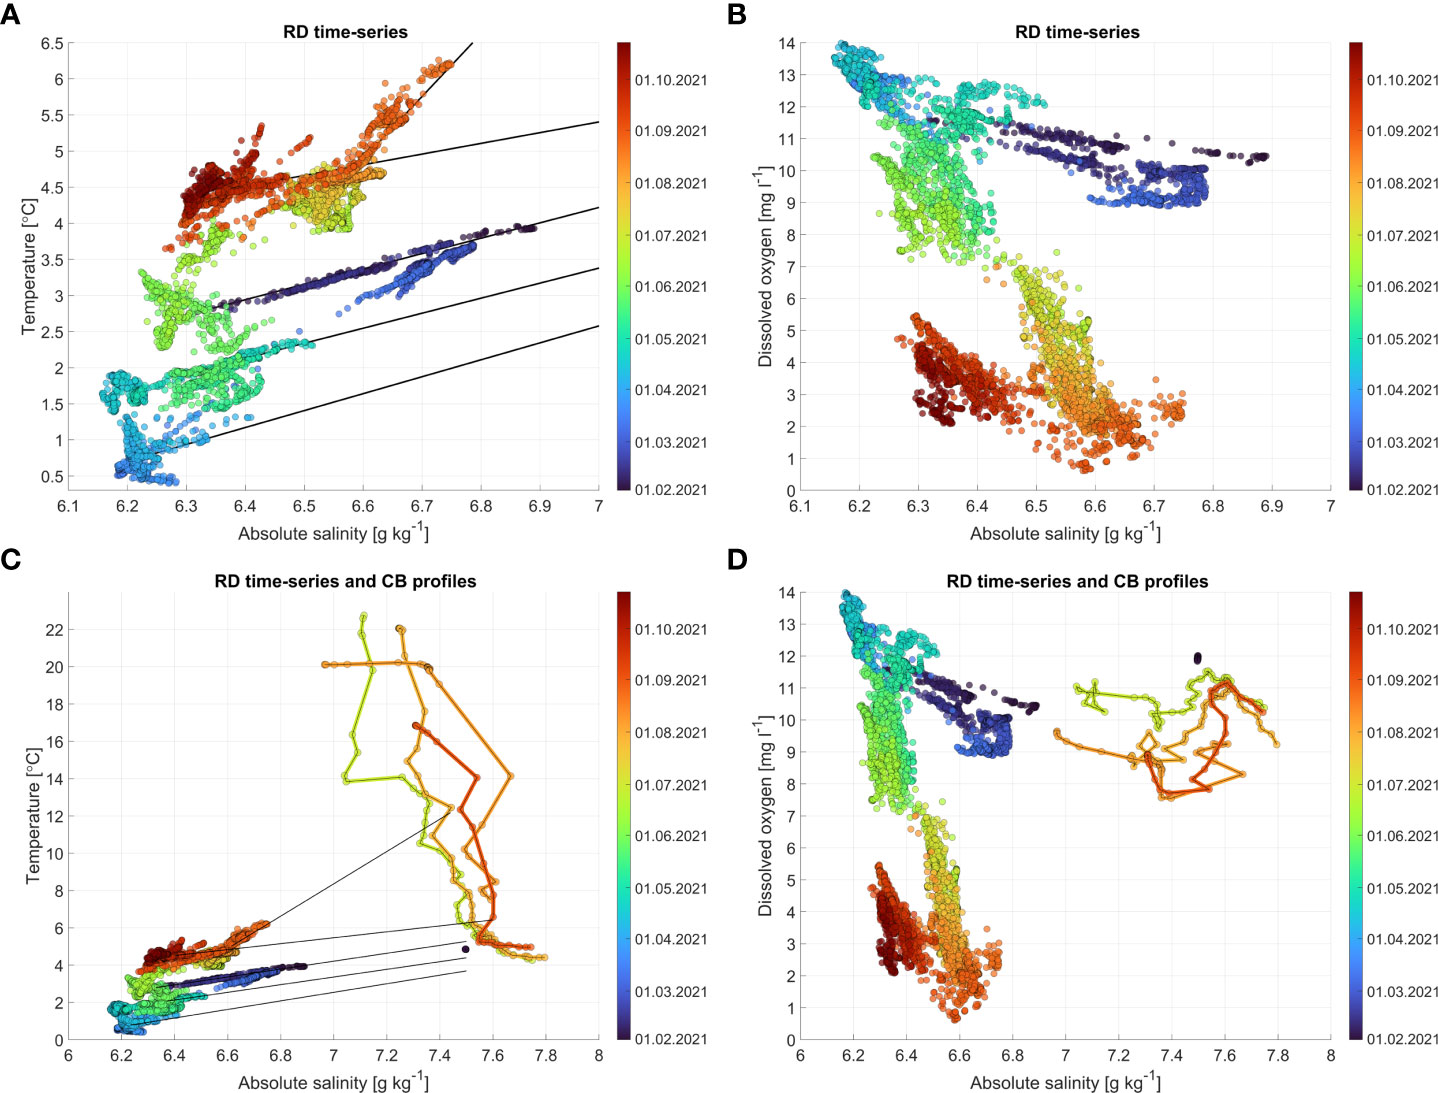
Figure 4 Ruhnu Deep time-series (A–D) with CB profiles (C, D) in temperature-salinity (A, C) and salinity-oxygen diagrams (B, D). CB profile data points are connected with lines.
The water column was well mixed in the CB (Figure 4C) and the arrivals of more saline water in mid-February and at the end of April were likely caused by the barotropic flow in the Irbe Strait and downwelling at the CB side of the strait, which occur in response to southerly winds (Otsmann et al., 2001; Liblik et al., 2022). A comparison of temperature-salinity characteristics in the Ruhnu Deep time series and the profile in the CB at the end of January confirms the origin (Figure 4C).
Further saltier water arrivals rather originated from the thermocline of the CB; see the regression lines for an indication of the potential origin of the saltier water mass in the CB (Figure 4C). Northerly wind directions cause upwelling at the eastern coast of the CB, onshore flow within or below the thermocline (Liblik et al., 2022) and likely inflow of colder waters to the GoR via Irbe Strait (Lilover et al., 1998). This water can be dense enough to penetrate the deep layers of the GoR (Stoicescu et al., 2022). Inflow events also occur in the case of southerly wind events and downwellings along the CB coast in summer, but in these cases, water is too warm (light) and forms buoyant salinity maxima in the GoR and does not ventilate deep layers (Liblik et al., 2017). It has been suggested that the period when inflows generated by the southerly wind do not interrupt the deep layer lasts from May/June to September (Liblik et al., 2017).
The actual wind events that caused the arrival of the CB waters to the Ruhnu Deep cannot be distinguished from existing data. The rapid increase in salinity observed in mid-June was preceded by several northerly wind events in April and May, and the same wind prevailed in the first half of June (Figure 2A). Another weaker northerly wind impulse occurred during a week from the end of June – early July. Likewise, northerly winds prevailed during the next small ventilation event on 20-21 July. Latter wind impulse probably also contributed to the higher salinity water arrival to the Ruhnu Deep on 20 August. Thus, on the one hand, the assumption of one month arrival time from Irbe Strait to Ruhnu Deep, suggested by Stoicescu et al. (2022), might be valid. However, the CTD profiles measured in the western GoR (GorW in Figure 1) show the highest near bottom salinity (6.84 g kg-1) already on 29 June, lower on 28 July (6.67 g kg-1), and even lower on 31 August (6.52 g kg-1). The highest salinity (6.74 g kg-1) was observed in the Ruhnu Deep on 20-23 August. The TS characteristics of the water in the Irbe Strait on 29 June hint that the water arrival, which we observed on 20-23 August, might have crossed the Irbe Strait already in June. It could be that several wind impulses are required for the salty water transport over the sill and to the deeper areas of the GoR. Continuous simultaneous measurements in the Irbe Strait and Ruhnu Deep would help to understand the connectivity of the water characteristics in the strait and deep layers of the GoR.
On the way from Irbe Strait to the deeper part of the GoR, water mixes with ambient oxygen-depleted GoR water, and oxygen is consumed due to biogeochemical processes. We estimated the share of the CB water and ambient GoR water in the arrived water. Taking into account the mean salinity before the arrival of new water, the salinity of new water, and the salinity of the CB water (7.4 g kg-1), the estimated share of the CB water in the water mass was about 15% in the water that arrived in the second half of April, 19% in the second half of June and 16% in the arrival of 20 August. Thus, the inflowed water is the subject of an active mixing process before arrival to the deep layers of the GoR.
To illustrate the impact of mixing on oxygen content, we describe the 20 August saltier water arrival event. Taking the oxygen concentration of the CB water (9 mg l-1, Figure 4D) and one-month average concentration (the assumed travel time of inflowed water) before the event in the near-bottom layer of the GoR (2.8 mg l-1) and the shares of waters (84% - old GoR water and 16% - CB water), we get that without local oxygen consumption, the oxygen concentration in the arrived water mass would be 3.8 mg l-1 solely due to mixing with the GoR water. Thus, the oxygen import by advection (DOadv) would be 1 mg l-1 month-1, i.e. 0.03 mg l-1 d-1. If we apply the mean seasonal trend of oxygen decrease during one month (0.04 mg l-1 d-1, Figure 2D), the concentration would be 2.6 mg l-1, which is very close to the observed 3-day mean oxygen concentration after the appearance of new water (2.5 mg l-1). Despite losses of oxygen on the way, it still slightly ventilated the deep layer as the 3-day mean concentration before the event was 2.1 mg l-1. Thus, it took about 10 days for oxygen concentration to decline to the level measured before the arrival of inflow water. We can conclude that inflow events have some potential for ventilation of deep water of the GoR. Stronger ventilation events did not occur because of oxygen loss due to mixing on the way to the Ruhnu Deep (approximately 80%) and local seasonal oxygen depletion (20%).
It has been suggested that the arrival of CB water strengthens the deep layer stratification, which leads to faster oxygen consumption due to the thinner near-bottom layer (Stoicescu et al., 2022). Thus, although the inflows bring oxygen to the deep layers, the net impact of inflows might be negative for deep-layer oxygen conditions. Targeted observations, including Eulerian measurements in the deep layer presented in the current study, high-resolution spatial measurements along the pathway from the CB to the Ruhnu Deep, and dedicated numerical simulations are required to confirm our estimates and improve understanding of the deep-layer oxygen budgets in the GoR.
3.4 The added value of Eulerian observations for the monitoring system
Next, we discuss the variability of near-bottom oxygen observations in the context of the potential of Eulerian observations to complement the existing conventional monitoring in the GoR. Conventional monitoring is usually conducted once in January, April, May, July, August, and October (Stoicescu et al., 2022).
The standard deviation of oxygen was lower in February (0.60 mg l-1), April (0.67 mg l-1), August (0.93 mg l-1), September (0.80 mg l-1), and November-December (<0.38 mg l-1), i.e. in months when oxygen depletion did not occur or when it was already well established. Standard deviation was higher in May-July (>1.16 mg l-1), particularly in June (2.22 mg l-1), i.e. when oxygen depletion developed. Standard deviations were lower if linear trends in summer months presented in Figure 3 were removed (>0.74 mg l-1 in May and July, 0.91 mg l-1 in August, 1.45 mg l-1 in June). The high standard deviations in March (1.76 mg l-1) and October (2.82 mg l-1) were a result of the turnover of the water column. Variability was quite low before and after the mixing events. Although hypoxia prevailed from the second half of July, the maximum concentrations were as high as 7.3 mg l-1, 7.0 mg l-1, and 5.2 mg l-1 in July, August, and September, respectively. The probability of hypoxia was highest in August (81.9%) and lower in July (23.5%), September (16.3%), and October (20.3%). Only one hourly observation of hypoxia was captured at the end of June.
Major signals, such as the decrease in near-bottom oxygen concentration and strong inter-annual differences, can be detected by conventional monitoring (Stoicescu et al., 2022), but our statistics suggest that uncertainties of these estimates are high. Moreover, the variability, including the duration of hypoxic conditions, is not captured by conventional monitoring. Conditions were extremely different before and after the turnover event in October. Thus, depending on the exact visit time of a monitoring cruise, the observations of near-bottom oxygen conditions can be radically different in autumn. This could impact seasonal hypoxic area estimates (e.g. Krapf et al., 2022) and long-term trend estimates (e.g. Lainela et al., 2020). The continuous Eulerian measurements considerably contribute to the understanding of the processes, complement spatial mappings (Meyer et al., 2018; Mohrholz, 2018) and improve the confidence of the assessments of eutrophication status (Stoicescu et al., 2019).
Assuming that changes in oxygen concentration in the near-bottom layer (DOchange) are defined by oxygen consumption (DOcons), oxygen fluxes due to advection (DOadv) and vertical mixing (DOvertmix), and short-term variability caused by internal waves and mesoscale/submesoscale processes (DOchangeHF), we can express it as
While Stoicescu et al. (2022) used the same equation to estimate oxygen consumption in the near-bottom layer of the GoR but without considering short-term variability, the current dataset allows us to evaluate what would be the error estimate of such calculations based on measurements with a monthly timestep.
The impact of advection estimated in relation to the inflow, which arrived in the RD on 20 August 2021, was 1.0 mg l-1 month-1 or 0.03 mg l-1 d-1 (see section 3.3). Assuming a similar to Stoicescu et al. (2022) impact of vertical mixing of 0.02-0.03 mg l-1 d-1, and considering the two estimates of long-term trends based on the present dataset of -0.10 mg l-1 d-1 and -0.04 mg l-1 d-1, we can estimate the oxygen consumption rate in spring-summer 2021. It would be between 0.09 mg l-1 d-1 and 0.16 mg l-1 d-1. Stoicescu et al. (2022) obtained similar consumption rate estimates for 2018, ranging from 0.10 to 0.16 mg l-1 d-1.
Considering the found monthly standard deviations of oxygen concentration in different months 2021 from spring to autumn in a range from 0.67 to 2.82 mg l-1 as an estimate of short-term changes (e.g., DOchangeHF = 0.67 mg l-1 per month or another selected period) and trends between 1.20 and 3.33 mg l-1 month-1, the error of consumption rate estimates based on monthly measurements could be >50%. We suggest that sustainable continuous measurements of near-bottom water characteristics would enhance the knowledge and lower the uncertainties of estimates of oxygen conditions in the Gulf of Riga.
5 Conclusion
Continuous deep layer measurements in the Ruhnu Deep revealed characteristics of seasonal oxygen depletion in the Gulf of Riga. On top of the seasonal oxygen decline, short-term variability, likely caused by inertial oscillations, (sub)mesoscale processes, deep layer currents, and pycnocline movements, was observed. The inflow events from the Central Baltic slightly ventilated the hypoxic deep layer. Although the inflowed water was nearly saturated in oxygen, once it arrived to the Ruhnu Deep, it has lost its high oxygen content due to mixing with existing oxygen-depleted water in the Gulf of Riga and local consumption on the way.
The revealed short-term variability points to uncertainties of conventional monitoring and demonstrates the added value of permanent continuous measurements to the observing system. Targeted high-resolution spatial measurements along the pathway from the Central Baltic to the Ruhnu Deep, combined with Eulerian measurements, conventional monitoring, and dedicated numerical simulations, are required to improve our understanding of the deep layer dynamics in the Gulf of Riga.
Data availability statement
The raw data supporting the conclusions of this article will be made available by the authors, without undue reservation.
Author contributions
TL designed the experiment and led the analyses of the data and writing of the paper. FB contributed with in-situ data gathering, calibration and data processing. ST-S, UL and M-JL contributed to the writing of the manuscript.
Funding
This research has been supported by the Estonian Research Council (grant no. PRG602).
Acknowledgments
We thank our colleagues who help to conduct the measurements and the ship crew of the RV Salme. We thank Germo Väli for his help with breakpoint analysis.
Conflict of interest
The authors declare that the research was conducted in the absence of any commercial or financial relationships that could be construed as a potential conflict of interest.
Publisher’s note
All claims expressed in this article are solely those of the authors and do not necessarily represent those of their affiliated organizations, or those of the publisher, the editors and the reviewers. Any product that may be evaluated in this article, or claim that may be made by its manufacturer, is not guaranteed or endorsed by the publisher.
References
Aigars J., Poikane R., Dalsgaard T., Eglite E., Jansons M. (2015). Biogeochemistry of n, p and SI in the gulf of Riga surface sediments: Implications of seasonally changing factors, cont. Shelf Res. 105, 112–120. doi: 10.1016/J.CSR.2015.06.008
Almroth-Rosell E., Wåhlström I., Hansson M., Väli G., Eilola K., Andersson P., et al. (2021). A regime shift toward a more anoxic environment in a eutrophic Sea in northern Europe. Front. Mar. Sci. 8. doi: 10.3389/FMARS.2021.799936/BIBTEX
Berzinsh V. (1995). Hydrology, in ecosystem of the gulf of Riga between 1920 and 1990. Ed. Ojaveer E. (Tallinn.: Estonian Acad. Publ.), 7–31.
Breitburg D., Levin L. A., Oschlies A., Grégoire M., Chavez F. P., Conley D. J., et al. (2018). Declining oxygen in the global ocean and coastal waters. Science 359, eaam7240. doi: 10.1126/science.aam7240
Conley D. J., Björck S., Bonsdorff E., Carstensen J., Destouni G., Gustafsson B. G., et al. (2009). Hypoxia-related processes in the Baltic Sea, environ. Sci. Technol. 43 (10), 3412–3420. doi: 10.1021/es802762a
Diaz R. J., Rosenberg R. (2008). Spreading dead zones and consequences for marine ecosystems. Science 321 (5891), 926–929. doi: 10.1126/science.1156401
Dietze H., Löptien U. (2021). Retracing hypoxia in eckernförde bight (Baltic Sea). Biogeosciences 18 (14), 4243–4264. doi: 10.5194/BG-18-4243-2021
Eglite E., Lavrinovičs A., Müller-Karulis B., Aigars J., Poikane R. (2014). Nutrient turnover at the hypoxic boundary: flux measurements and model representation for the bottom water environment of the gulf of Riga. Baltic Sea Oceanol. 56 (4), 711–735. doi: 10.5697/OC.56-4.711
Hersbach H., Bell B., Berrisford P., Hirahara S., Horányi A., Muñoz-Sabater J., et al. (2020). The ERA5 global reanalysis, q. j. r. Meteorol. Soc. 146 (730), 1999–2049. doi: 10.1002/QJ.3803
Karstensen J. (2005). “Calibration of physical data,” in A cookbook for MicroCat (ADCP and RCM data). doi: 10.25607/OBP-1509
Killick R., Fearnhead P., Eckley I. A. (2011). Optimal detection of changepoints with a linear computational cost. J. Am. Stat. Assoc. 107 (500), 1590–1598. doi: 10.1080/01621459.2012.737745
Krapf K., Naumann M., Dutheil C., Meier H. E. M. (2022). Investigating hypoxic and euxinic area changes based on various datasets from the Baltic Sea. Front. Mar. Sci. 9. doi: 10.3389/FMARS.2022.823476/BIBTEX
Lainela S., Herkül K., Leito I., Jaanus A., Suursaar Ü. (2020). Contemporary trends in hydrophysical and hydrochemical parameters in the NE Baltic Sea. Est. J. Earth Sci. 69 (2), 91–108. doi: 10.3176/earth.2020.06
Lee Y. W., Park M. O., Kim S. G., Kim S. S., Khang B., Choi J., et al. (2021). Major controlling factors affecting spatiotemporal variation in the dissolved oxygen concentration in the eutrophic masan bay of Korea. Reg. Stud. Mar. Sci. 46, 101908. doi: 10.1016/J.RSMA.2021.101908
Liblik T., Naumann M., Alenius P., Hansson M., Lips U., Nausch G., et al. (2018). Propagation of impact of the recent major Baltic inflows from the Eastern gotland basin to the gulf of Finland. Front. Mar. Sci. 5. doi: 10.3389/fmars.2018.00222
Liblik T., Skudra M., Lips U. (2017). On the buoyant sub-surface salinity maxima in the gulf of Riga. Oceanologia 59 (2), 113–128. doi: 10.1016/J.OCEANO.2016.10.001
Liblik T., Väli G., Salm K., Laanemets J., Lilover M. J., Lips U. (2022). Quasi-steady circulation regimes in the Baltic Sea. Ocean Sci. 18 (3), 857–879. doi: 10.5194/OS-18-857-2022
Lilover M.-J., Lips U., Laanearu J., Liljebladh B. (1998). Flow regime in the irbe strait. Aquat. Sci. 60 (3), 253. doi: 10.1007/s000270050040
Limburg K. E., Casini M. (2018). Effect of marine hypoxia on Baltic Sea cod gadus morhua: Evidence from otolith chemical proxies. Front. Mar. Sci. 5 (DEC). doi: 10.3389/FMARS.2018.00482/BIBTEX
Lips U., Kikas V., Liblik T., Lips I. (2016). Multi-sensor in situ observations to resolve the sub-mesoscale features in the stratified gulf of Finland. Baltic Sea Ocean Sci. 12 (3), 715–732. doi: 10.5194/os-12-715-2016
Meyer D., Lips U., Prien R. D., Naumann M., Liblik T., Schuffenhauer I., et al. (2018). Quantification of dissolved oxygen dynamics in a semi-enclosed sea – a comparison of observational platforms. Cont. Shelf Res. 169, 34–45. doi: 10.1016/J.CSR.2018.09.011
Mohrholz V. (2018). Major Baltic inflow statistics – revised. Front. Mar. Sci. 5. doi: 10.3389/fmars.2018.00384
Mohrholz V., Naumann M., Nausch G., Krüger S., Gräwe U. (2015). Fresh oxygen for the Baltic Sea - an exceptional saline inflow after a decade of stagnation. J. Mar. Syst. 148, 152–166. doi: 10.1016/j.jmarsys.2015.03.005
Olli K., Heiskanen A. S. (1999). Seasonal stages of phytoplankton community structure and sinking loss in the gulf of Riga. J. Mar. Syst. 23 (1–3), 165–184. doi: 10.1016/S0924-7963(99)00056-1
Otsmann M., Suursaar Ü., Kullas T. (2001). The oscillatory nature of the flows in the system of straits and small semienclosed basins of the Baltic Sea. Cont. Shelf Res. 21 (15), 1577–1603. doi: 10.1016/S0278-4343(01)00002-4
Piehl S., Friedland R., Heyden B., Leujak W., Neumann T., Schernewski G. (2022). Modeling of water quality indicators in the Western Baltic Sea: Seasonal oxygen deficiency. Environ. Model. Assess. 1, 1–18. doi: 10.1007/S10666-022-09866-X/FIGURES/10
Purina I., Labucis A., Barda I., Jurgensone I., Aigars J. (2018). Primary productivity in the gulf of Riga (Baltic Sea) in relation to phytoplankton species and nutrient variability. Oceanologia 60 (4), 544–552. doi: 10.1016/J.OCEANO.2018.04.005
Raudsepp U. (2001). Interannual and seasonal temperature and salinity variationsin the gulf of Riga and corresponding saline water inflow from the Baltic proper, nord. Hydrol 32 (2), 135–160. doi: 10.2166/nh.2001.0009
Raudsepp U., Kõuts T. (2001). Observations of near-bottom currents in the gulf of Riga. Baltic Sea Aquat. Sci. 63, 385–405. doi: 10.1007/s00027-001-8040-y
Rousi H., Laine A. O., Peltonen H., Kangas P., Andersin A. B., Rissanen J., et al. (2013). Long-term changes in coastal zoobenthos in the northern Baltic Sea: the role of abiotic environmental factors. ICES J. Mar. Sci. 70 (2), 440–451. doi: 10.1093/ICESJMS/FSS197
Schmidt B., Wodzinowski T., Bulczak A. I. (2021). Long-term variability of near-bottom oxygen, temperature, and salinity in the southern Baltic. J. Mar. Syst. 213, 103462. doi: 10.1016/J.JMARSYS.2020.103462
Skudra M., Lips U. (2017). Characteristics and inter-annual changes in temperature, salinity and density distribution in the gulf of Riga. Oceanologia 59 (1), 37–48. doi: 10.1016/J.OCEANO.2016.07.001
Stipa T., Tamminen T., Seppälä J. (1999). On the creation and maintenance of stratification in the gulf of Riga. J. Mar. Syst. 23 (1–3), 27–49. doi: 10.1016/S0924-7963(99)00049-4
Stoicescu S. T., Laanemets J., Liblik T., Skudra M., Samlas O., Lips I., et al. (2022). Causes of the extensive hypoxia in the gulf of Riga in 2018. Biogeosciences 19 (11), 2903–2920. doi: 10.5194/BG-19-2903-2022
Stoicescu S.-T., Lips U., Liblik T. (2019). Assessment of eutrophication status based on Sub-surface oxygen conditions in the gulf of Finland (Baltic Sea). Front. Mar. Sci. 6. doi: 10.3389/fmars.2019.00054
Sun X., Li Z., Ding X., Ji G., Wang L., Gao X., et al. (2022). Effects of algal blooms on phytoplankton composition and hypoxia in coastal waters of the northern yellow Sea. China Front. Mar. Sci. 9. doi: 10.3389/FMARS.2022.897418/BIBTEX
Väli G., Zhurbas V., Lips U., Laanemets J. (2017). Submesoscale structures related to upwelling events in the gulf of Finland, Baltic Sea (numerical experiments). J. Mar. Syst. 171, 31–42. doi: 10.1016/J.JMARSYS.2016.06.010
Venkatesan R., Ramesh K., Kishor A., Vedachalam N., Atmanand M. A. (2018). Best practices for the ocean moored observatories. Front. Mar. Sci. 5 (DEC). doi: 10.3389/FMARS.2018.00469/BIBTEX
Wei Q., Yao P., Xu B., Zhao B., Ran X., Zhao Y., et al. (2021). Coastal upwelling combined with the river plume regulates hypoxia in the changjiang estuary and adjacent inner East China Sea shelf. J. Geophys. Res. Ocean. 126 (11), e2021JC017740. doi: 10.1029/2021JC017740
Keywords: seasonal hypoxia, mooring measurement, eutrophication, estuarine, deoxygenation
Citation: Liblik T, Stoicescu S-T, Buschmann F, Lilover M-J and Lips U (2023) High-resolution characterization of the development and decay of seasonal hypoxia in the Gulf of Riga, Baltic Sea. Front. Mar. Sci. 10:1119515. doi: 10.3389/fmars.2023.1119515
Received: 08 December 2022; Accepted: 27 February 2023;
Published: 10 March 2023.
Edited by:
Kui Wang, Zhejiang University, ChinaReviewed by:
Rene Friedland, Leibniz Institute for Baltic Sea Research (LG), GermanyGwénaëlle Chaillou, Université du Québec à Rimouski, Canada
Markus Meier, Leibniz Institute for Baltic Sea Research (LG), Germany
Copyright © 2023 Liblik, Stoicescu, Buschmann, Lilover and Lips. This is an open-access article distributed under the terms of the Creative Commons Attribution License (CC BY). The use, distribution or reproduction in other forums is permitted, provided the original author(s) and the copyright owner(s) are credited and that the original publication in this journal is cited, in accordance with accepted academic practice. No use, distribution or reproduction is permitted which does not comply with these terms.
*Correspondence: Taavi Liblik, dGFhdmkubGlibGlrQHRhbHRlY2guZWU=