 Eun Young Lee
 Dong Eun Lee
 Young-Gyu Park
 Hyunjin Kang
 Haedo Baek
95% of researchers rate our articles as excellent or good
Learn more about the work of our research integrity team to safeguard the quality of each article we publish.
Find out more
ORIGINAL RESEARCH article
Front. Mar. Sci. , 02 February 2023
Sec. Physical Oceanography
Volume 10 - 2023 | https://doi.org/10.3389/fmars.2023.1118969
This article is part of the Research Topic Air-Sea Interaction and Oceanic Extremes View all 31 articles
Vertical stratification preconditions marine heat wave (MHW) events in marginal seas. The major events since 1982 in the marginal sea area west and south of the Korean Peninsula have been led by abnormally strong stratification in the vicinity, which was detected at least two months in advance. This robust coincidence provides substantial control over mid-summer events through local stratification in early summer. Such heatwave-leading stratification can be attributed to various oceanic factors during early summers, including anomalous sea surface temperature, freshwater flux, and wind mixing. Knockout-style experiments using a 1-dimensional ocean model revealed that the upper ocean stratification in the preceding months, mostly through wind mixing, is capable of regulating MHWs. Meanwhile, in the longer historical records, gradual decreases in the intensity and frequency of the daily wind gusts were found, possibly as a mixed result of anthropogenically induced climate change and strong natural variability of the midlatitudes. This might have dominated in enhancing the occurrence of MHWs, combined with the rising background surface temperature.
Marine heatwave (MHW) events are phenomena of local extreme daily sea surface temperature (SST) above the 90th percentile threshold (Hobday et al., 2016) that are detected for more than five consecutive days. In the northern mid-latitudes, the most disastrous heatwaves, the excessive and rapid rise, in shallow semi-closed marginal seas such as the Yellow and the East China Seas (YECS) occur during the hottest season in and around August. In 2016, one of the most severe MHW events, occurred in the YECS (Figure 1A). Consequently, the local fishing industry is severely affected. Toxic jellyfish of subtropical origin appear near the major recreational beaches. Great concern overshadows coastal resilience, as it has tended to occur in mid-latitude marginal seas more frequently in recent years (Oliver et al., 2018; Gupta et al., 2020).
The studied region is the Korean side of a continental shelf area located in the Yellow and the East China Seas with the average depth less than 50 meters. The physical condition includes strong semidiurnal tidal currents at 1~2 m/s of average speed, warm and salty advection with the Tsushima Warm Currents (TWC), air-sea interaction associated with the East Asian Monsoon system both in summer and winter, the freshwater flux from the neighboring rivers including the Yangtze, as well as the major disturbance brought by tropical cyclones in the later summer.
Mechanisms behind the regional marine heatwaves, such as the event in 2016, seem highly complex. Modeling studies have suggested that surface wind anomalies in northeastern marginal seas are related to heatwaves in some recent years (Cai et al., 2017; Gao et al., 2020). Large-scale circulation variability may provide promising predictability on a seasonal-to-interannual timescale (Xu et al., 2020). Meanwhile, the preconditions for MHWs can be traced back to the preceding winter, as the anomalous expansion of the Yellow Sea Cold Bottom Water (YSCBW) is correlated with warmer summers in subsequent years (Park et al., 2011; Li et al., 2016). Whether these possible mechanisms are effective in each MHW events depends on the competition between the thermal sources and sinks at the surface and subsurface.
Presumably and predominantly, the instantaneous air-sea heat exchange triggered by large-scale atmospheric heatwave activities (Zhang and Anderson, 2003; Lee et al., 2020; Chiswell, 2021; Li et al., 2022) must be the most direct cause. However, not all the atmospheric heatwaves have accompanied with local marine heatwaves (Ministry of Oceans and Fisheries, 2022; Korea Meteorological Administration, 2023), indicating that the importance of oceanic conditions could not be left overlooked.
Only recently has ML thickness received global attention as being responsible for MHWs occurring more frequently, in the context of climate change (Amaya et al., 2021). Slowly varying oceanic mixed layer thickness opens the door to seasonal-to-interannual scale predictions of MHWs, as well. However, it is unclear whether the reported strong association between the shoaling ML thickness and increasing MHW events (Capotondi et al., 2022; Jacox et al., 2022) guarantees predictability. As the faster surface warming with respect to the subsurface warming strengthens vertical stratification, understanding the cause and effect between SST and ML thickness is limited by the suggested concurrent relationship (Amaya et al., 2021). Therefore, it is worthwhile to revisit the role of the ML thickness by carefully focusing on the direct premonition of MHWs.
The ML thickness varies owing to the local marine processes. In mid-latitude marginal seas, vertical stratification is determined by the thermal, saline, and mechanical factors. The relative importance of each factor in recent events has been examined separately by other researchers (Park et al., 2011; Tan and Cai, 2018; Wang et al., 2022; Gao et al., 2020). Li et al. (2022) found out that weaker wind speeds reduced upper oceanic mixing with greater than normal solar radiation and caused the MHW in 2016. In some cases, complicated numerical models and heat-budget analyses have been rigorously applied to identify the most direct causes of the events (Gao et al., 2020).
However, it has been overlooked that all the thermal, saline, and mechanical effects are likely to occur as part of a single weather system, which visits the region in a temporally random manner. Often, the randomness of atmospheric conditions does not mean that one physical variable is completely independent of others, such as a shift in the monsoonal front, typhoons, or atmospheric blocking. In this respect, Li’s study exhibiting two atmospheric effects in 2016 is similar to our direction. It would be worthwhile to extend the similar approach to MHW events indicated in the past.
Rather than assessing the impact of a particular factor alone, the role of one factor can be better estimated by the likelihood of MHW events with the factor knocked out. Thus, the role of each factor can be examined without being excessively idealized, and the probability distribution of MHWs can be obtained in terms of local marine conditions within plausible ranges of atmospheric variables supported by observed historical events. The goal of this study was to investigate the role of stratification that allows marine heatwaves, and to further explore the stratification process using a 1-dimensional ocean. First, the causal relationship between the observed MHW and local stratification was explored. Second, the impact of stratification-determining factors was quantitatively examined using a 1-dimensional ocean model to assess the individual contributions to historical MHW events. Finally, the climatic implications of local MHWs were addressed in terms of changes and variability in the associated preconditions.
The vertical profiles from 61 stations in the western and southwestern areas of the Korean Peninsula have been produced every two months since the 1960’s by the Korea Serial Oceanography Observations Program run by the National Institute of Fisheries Science (NIFS) (Park, 2021). The locations of these sites are shown in Figure 1A. This dataset was used to detect vertical stratification and verify the model results. The stations were selected from the western half of the stations and grouped into two: the northwest box (35–37.1°N, 124.3~125.3°E) and the southwest box (33.1~34.97°N, 124.3~125.3°E).
Daily surface net heat flux, surface wind stress, and precipitation data from the National Center for Environmental Prediction (NCEP) reanalysis 1 (Kalnay et al., 1996) were used to force the 1-dimensional ocean model. These were interpolated to match the NIFS locations.
MHW events in the study area were detected from 1982 to 2020 using daily Optimum Interpolation Sea Surface Temperature v2 (Reynolds et al., 2007) data from the National Oceanic and Atmospheric Administration (NOAA). The detections are based on the definition of Hobday (Hobday et al., 2016) as longer than five consecutive days of high SST above the all-summer 90th daily percentile of the 31day moving-average. The climatology is calculated at the period from 1982 to 2020. The estimated threshold is approximately 27.3°C around the central Yellow Sea area in August (Figure 1A).
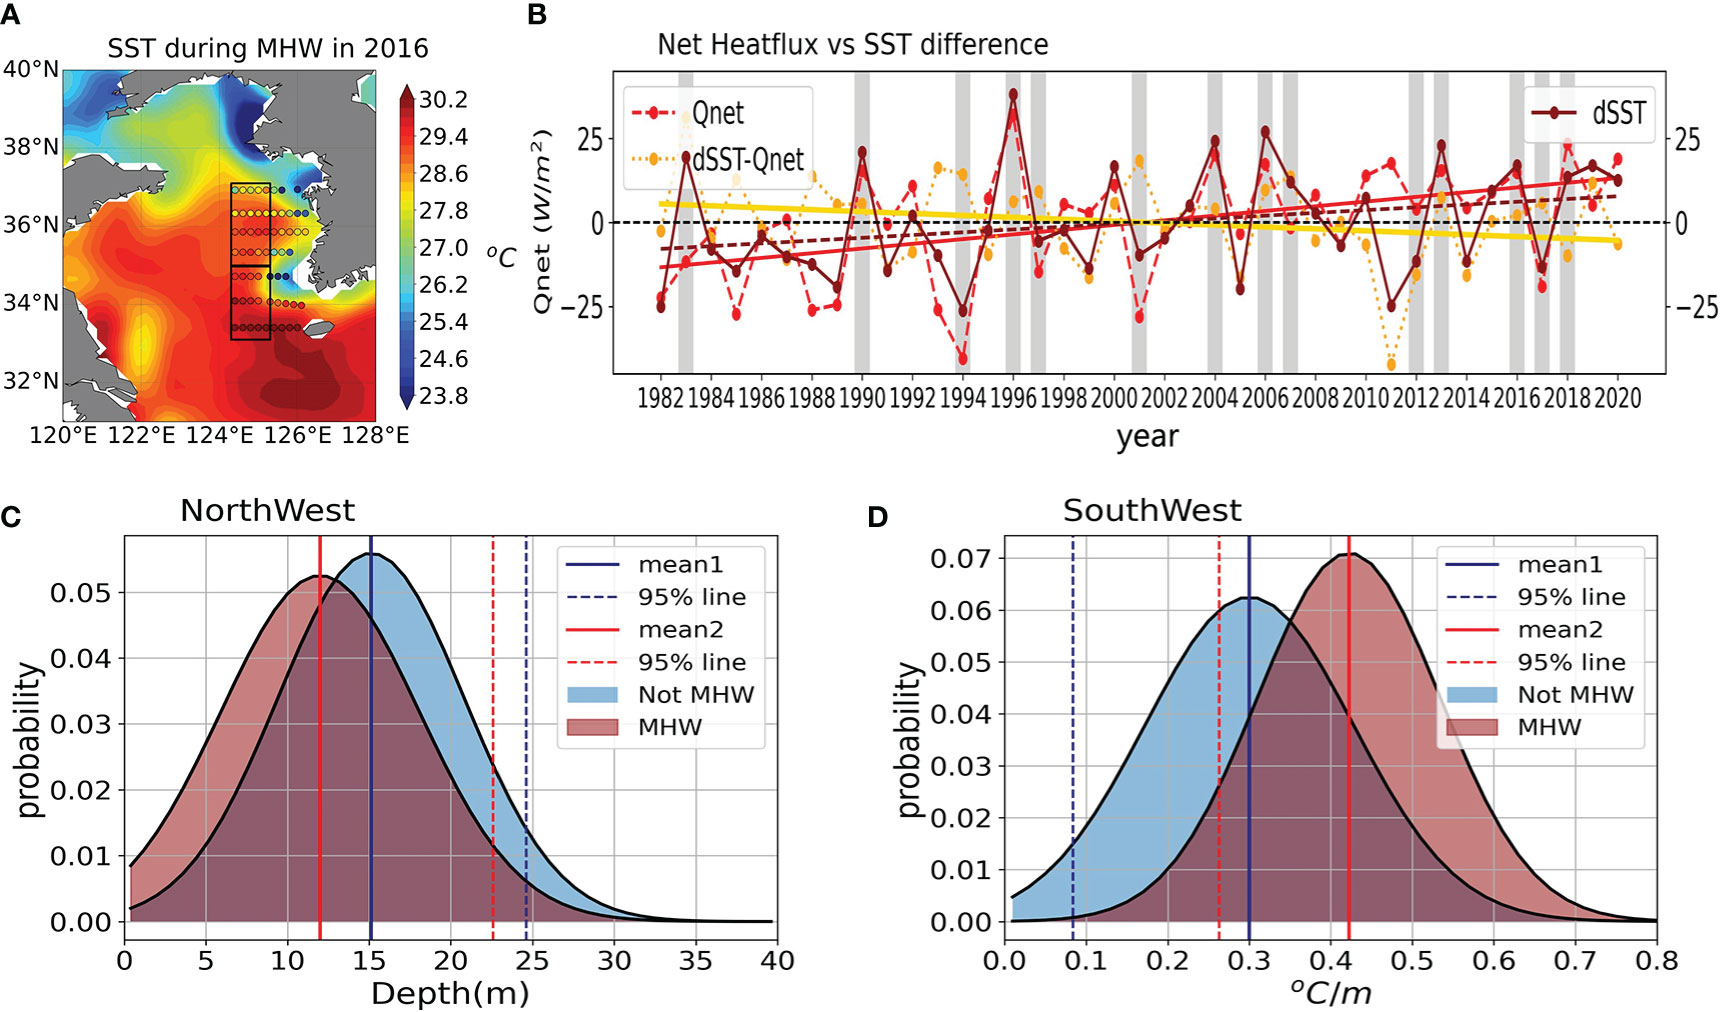
Figure 1 (A) Monthly average SST during the marine heat wave events in August 2016, based on OISST (Reynolds et al., 2007). Overlaid contour indicates the boundary of the heatwave at 27.3°C, the value of 90th percentile of the August monthly mean. Colored dots are the NIFS temperature observation in August 2016. (B) Monthly average surface net heat flux anomaly calculated from mid-July to mid-August (red), overlaid with changes in SST anomaly (brown), and the residual (yellow), area averaged in the outer box (33.1~37.1°N, 124.3~126.3°E). The monthly change in SST anomaly was averaged from mid-July to mid-August using daily data. Gray bars indicate the years with the August MHWs detected in the area averaged daily OISST data. (C, D) probability mass function for depth of maximum vertical temperature gradient and the vertical temperature gradient at 20m depth over the Northwest and the Southwest domain, respectively, based on NIFS data in June, from 1982 to 2020. Shaded in blue for the years with no MHW and red for the years with MHWs.
A 1-dimensional thermodynamic model with variable ML, iterated based on vertical stability (Price-Weller-Pinkel model, PWP), was utilized in this study to obtain oceanographic insights into MHWs. Details of this model can be found in previous studies (Price et al., 1986; Mathieu and de Young, 1995; Anderson et al., 1996; Mujumdar et al., 2011; Zhang and Anderson, 2003; Yang et al., 2015; Yu et al., 2020; ). The critical bulk Richardson number and critical gradient Richardson number were chosen at 1.0 and 3.0, respectively, through rigorous trials for the mean modeled vertical temperature profiles to best fit the typical vertical thermal structure of the studied area. The validation of the choices was performed by assessing anomaly correlation and root-mean-squared errors of monthly mean temperature anomalies at each observation station and vertical level, as described in the next section.
The hindcasting experiments were conducted at 61 NIFS stations. They were designed to (1) prove the proposed concept of the 1-dimensional MHW-generating mechanism, (2) obtain the probability distribution of MHW occurrence based on the possible combinations of physical marine conditions within the historical range, (3) verify the 4-month lead potential forecast skill, and (4) investigate the relative importance of each vertically stratifying condition using knock-out style experiments. As a general terms, a knockout experiment is referred to as an experiment designed to deactivate one factor out of all the considered. A knockout-style experiment, in this study, is referred to as an experiment in which only anomalies are deactivated while climatological mean values are kept active.
For Full experiments, all three factors were provided with raw data from the observation and reanalysis. In Sbar experiment, sea surface salinity (SSS) was restored to the climatological daily variation, whereas the other two factors were provided with raw data. In Ibar experiments, the initial conditions for temperature and salinity on the 1st of April are given with the climatological mean on April 1st. In Tbar experiments, the wind speed was set to the climatological daily means, rather than the climatological daily means of the zonal and meridional winds. Table 1 summarizes the experimental design of the model.
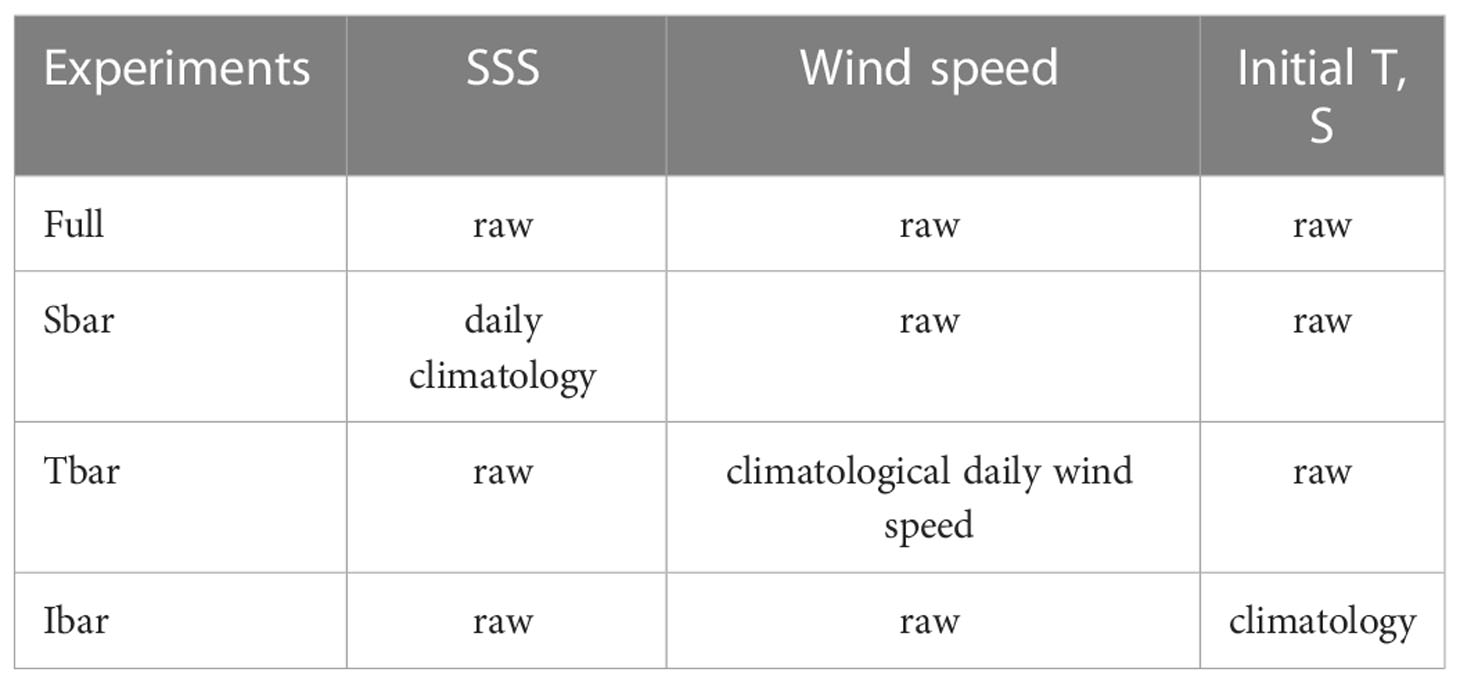
Table 1 The conditions for each of the experiments.
Each experiment was initiated on April 1st of each year and marches forward for 6 months until the end of September. The initial conditions were obtained from the vertically interpolated observed profile, and the surface forcing for heat, freshwater and momentum was provided using interpolated NCEP daily data to match the vertical levels and time steps of the model. There are 61 models for the stations, 53 sets of initial conditions, and surface-forcing data from 1968 to 2020. The surface heat flux forcing from the reanalysis was applied identically to all the experiments.
The area-averaged budget revealed the important role played by oceanic processes in MHW events.
where Q is the surface heat flux, T is the mixed-layer temperature, and H is the mixed-layer thickness. This approximation works well on the ocean surface, where oceanic heat advection is negligible (ρ: density of seawater, cp: specific heat of seawater, and t: time). The bars indicate the climatological monthly mean values. Although the outer terms are obtained directly, the terms inside the square brackets are not separable and are obtained as residuals on the left-hand side of Q′.
If the thickness of the surface water in the study area remains constant at the mid-summer average of approximately 10m in the studied area (Lin et al., 2019), the surface heat flux required for the historical anomalous SST tendency from July to August must be proportional to the surface heat flux. However, the approximated historical heat-flux-driven temperature tendency in the assumed-slab mixed-layer ocean disagrees with the observed temperature tendency during the corresponding period (Figure 1B). Among the 14 historical area-averaged events since 1982, six events occurred without anomalously stronger July-to-August surface heat fluxes from the atmosphere, and 12 events were led by the positive residual heat flux, which is presumably ocean-driven.
This difference is mostly attributable to the heat exchange with the subsurface ocean. The top-down vertical re-distribution of the surface heat flux is likely to contribute substantially to it, due to the variable vertical mixing. Considering the shallow bottom topography with less than 50 meters on average, it is unlikely for the Tsushima Warm Current (TWC) would have laterally advected this remarkable thermal source. Figure 1B demonstrates that the residual heat flux was noticeably positive in the majority of MHW years, whereas it was strongly negative in some non-MHW years, such as 2011. By contrast, when the residual was negative, the surface heat flux was lost to the subsurface and dissipated into a larger volume.
In addition to the dominant interannual processes, a positive linear trend since 1982 has been observed in the atmospheric heat flux at +0.7 W/m2 per year. This trend was unevenly divided into 4.1:2.9 above and below the climatological mean boundary of ocean ML. In the Figure 1B, the linear trend contained in the mixed layer ocean heating rate (dSST) is shown about 0.41 W/m2 per year, based on a least-square estimation. Therefore, the difference between the two leaves about -0.29 W/m2 per year, which is lost to the subsurface of much thicker volume. This implies that the vertical stratification has strengthened and that the surface layer has shoaled gradually, as the temperature increase accelerates much faster above the climatological mean boundary of the ML. The relative importance of shoaling ML and the increasing surface heat flux in the recent increase in MHWs requires further examination.
The causal relationships between MHW and vertical stability in the months prior to MHWs are implied in the observed vertical profiles. Early summer surface stratification is represented by the depth of the maximum vertical gradient and the strength of the vertical gradient at a fixed depth in June of each year. Two different groups of samples were taken from MHWs and non-MHWs (Figures 1C, D). The probability mass functions for the depth of the maximum vertical temperature gradient in the northwest and that for the vertical gradient at 20m depth in the southwest exhibited robust differences in conditions for MHWs compared with normal years. In the northwest domain, 95% of the MHW events occurred when the maximum gradient was located shallower than approximately 21.4 meters in June (Figure 1C). In the southwest domain, more than 95% of MHWs occurred with a vertical gradient at 20m depth greater by 0.12°C/m than in normal years (Figure 1D). Stronger than normal vertical stratification in early summer indeed appears to be preferable condition for MHW. The standards of vertical stability were applied interchangeably for each region. And the results are similar to the former but less robust (not shown).
To better understand the dominant oceanic processes behind MHWs, area-averaged historical records of three major factors associated with vertical stratification were investigated: surface temperature anomalies, the occurrence and intensity of stronger winds, and surface salinity in early summers (Figure 2). Notably, these three data points were nonstationary. They exhibit both linear trend and time-varying interannual variance. Between the 20th and 21st centuries in the observed record, the SST anomaly (Figure 2A) increased linearly at 0.04°C/year (with NIFS, 0.03°C/year with ERSST), and its interannual variance showed a visible decrease (0.9 in the earlier half period, 0.8 in the later period, with p< 0.05, with F-test). The elevated early summer surface temperature could make it easier to reach extreme temperatures later in the summer. Strong winds (Figure 2B), defined as the occurrence of the top 33% of daily summer wind speeds and their average intensity, exhibited stronger interannual variability in the earlier half of the study period, with decreasing linear trends of -0.0093 m2/year (p~0.27) and -0.02 times/year (p<0.05), respectively. The interannual variability of strong winds in summer indicates a strong disturbance at the surface layer, thereby widening the range of surface layer variability. The internal variability of monthly mean surface salinity (Figure 2C) in June is presented. The linear trend of surface salinity is slightly negative with a trend of -0.024 psu/year (p<0.05), while that of the Korea Meteorological Agency (KMA)’s Changma precipitation index shows little indication of a long-term change. Notably, the detrended interannual precipitation variability was positively correlated with the occurrence of strong winds (Figure 2B) with a correlation coefficient of 0.49 (p<0.05), whereas the positive long-term trend contradicted the gradual decrease in strong winds.
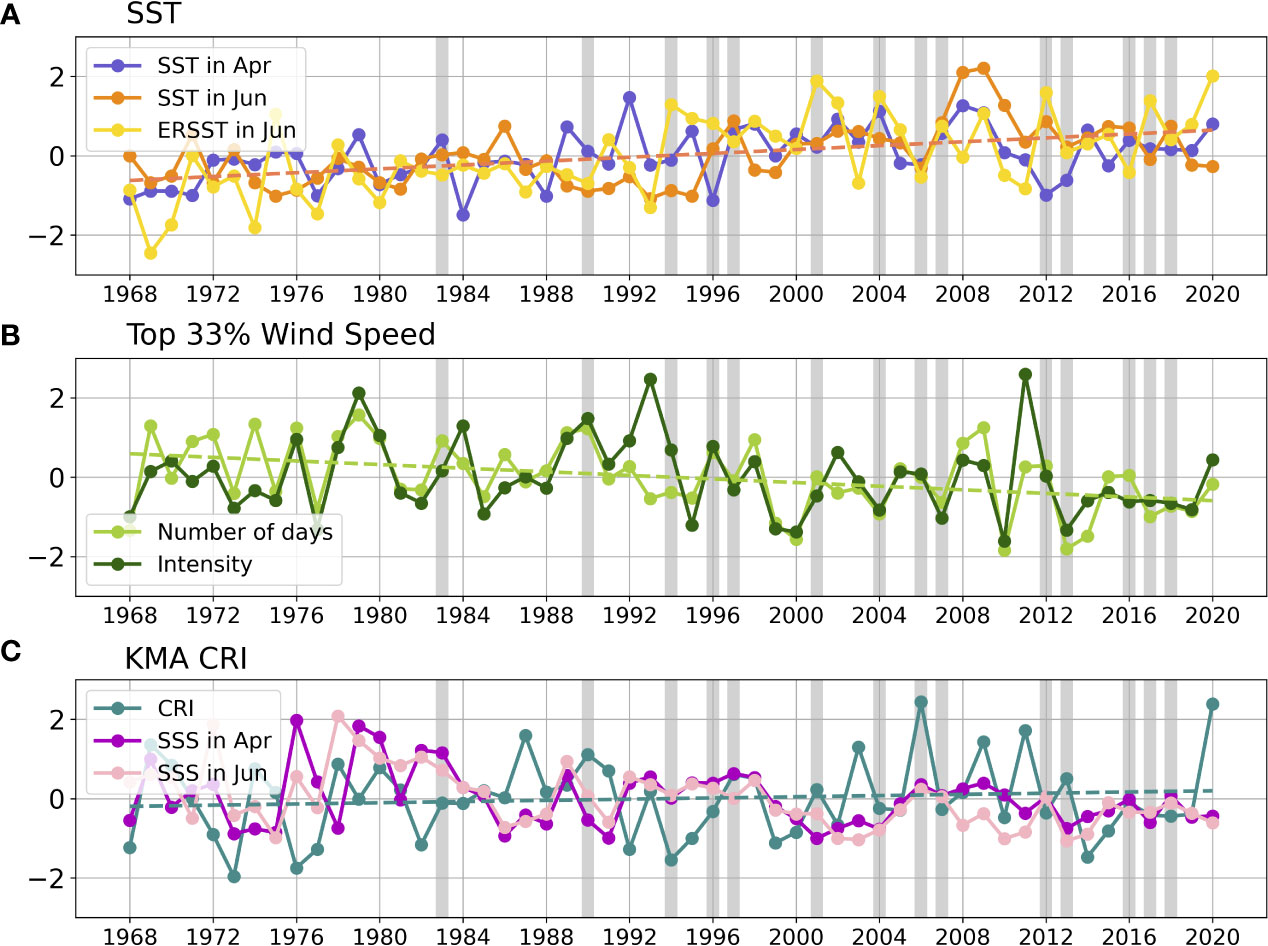
Figure 2 (A) Standardized SST anomaly in June from NIFS station data in orange, from ERSSTv4 in yellow, (B) same as (A) except for occurrence exceeding top 33% percent daily wind speed (mint) and average speed of top 33% percent daily wind speed (green), (C) same as (A), but for surface salinity (pink) and KMA Changma Index (bluegreen), area-averaged in the boxed area defined in Figure 1A, except for KMI Changma Index.
Thus far, the impacts of these three factors on local stratification agree in trends but disagree on an interannual timescale, implying that vertical stratification in every year can be determined both constructively and destructively among the factors. However, all the tendencies have been changing favorably to strengthen vertical stratification over a long time. It is speculated that surface warming and decreasing wind speed over time cause gradual strengthening of vertical stratification, with decreasing surface salinity contributing to surface density reduction. However, further investigation is required to assess these roles.
In this study, a 1-dimensional ocean model was utilized to conduct knockout-style experiments to prove our hypothesis that these factors regulate the occurrence of MHWs in addition to direct heating at the surface. A “knockout-style experiment” is a series of sensitivity runs that one of the four forcing fields are set to climatological means to knock its effects out of the hindcasts while the other forcing effects is maintained. First, to verify the performance of the model, August forecasts from the full experiment were compared with observations. As mentioned in the Methods section, the vertical structure of the model was tuned against the observed mean to obtain the best results. Figure 3A shows that the hindcast SST anomalies in the modeled regions are in good agreement with those observed. Regarding the timing of the MHWs, the model successfully simulated the continuous development of warming events from the beginning of April to the end of September, not only on the climatological average but also in the individual years. However, the model tends to overestimate the SST in July and August by approximately 1.6°C. For this reason, we used the model’s own MHW threshold from the full experiment rather than using the observed threshold to detect modeled MHWs (Figure 3B).
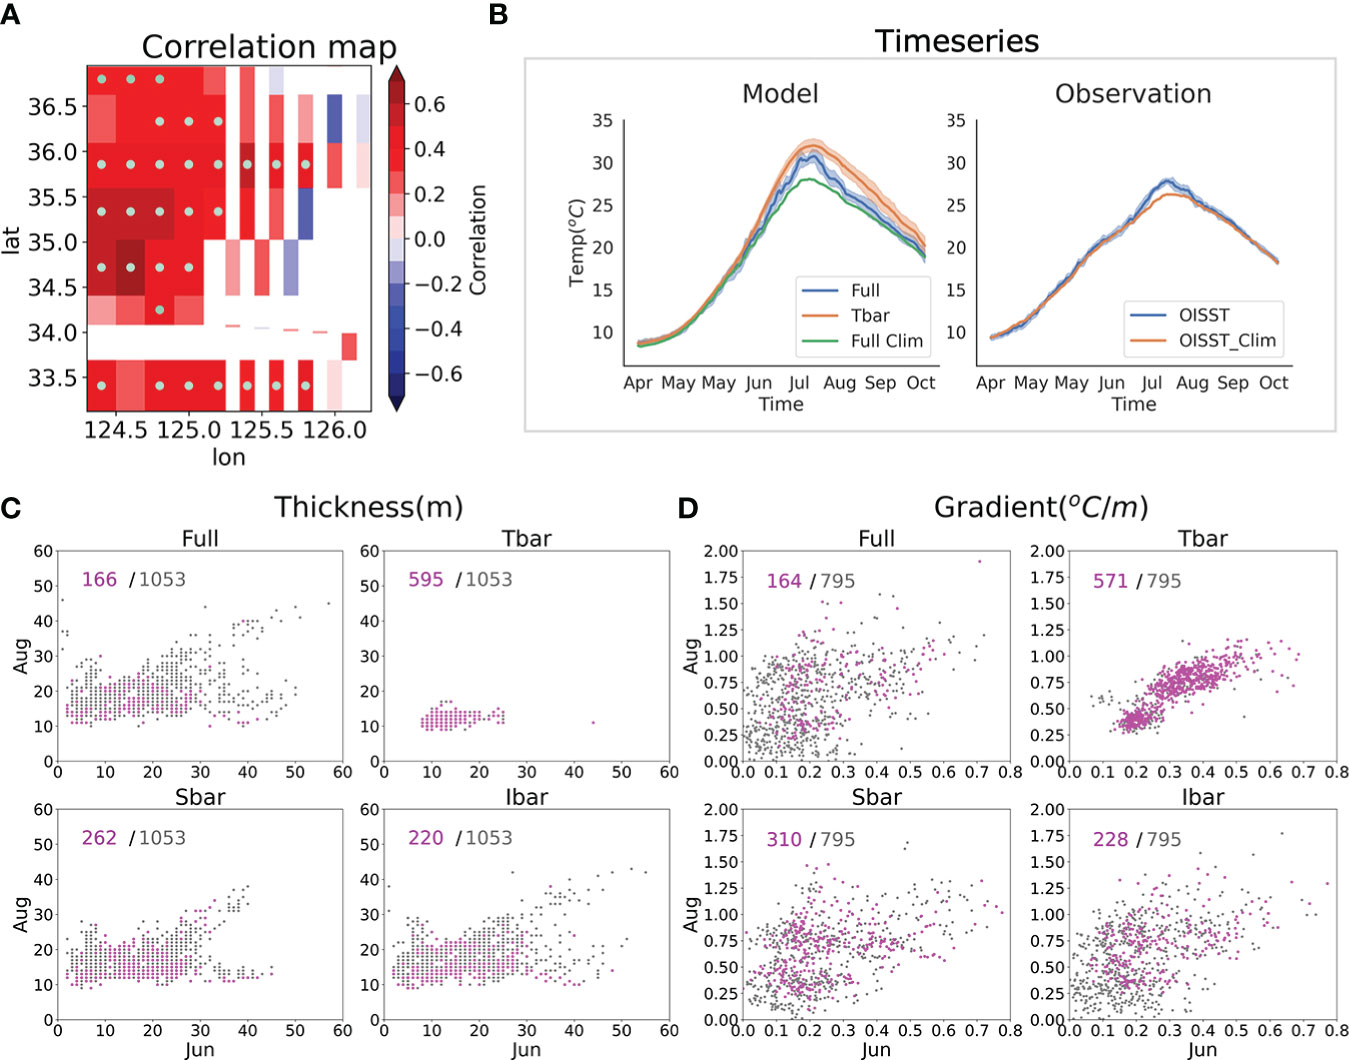
Figure 3 (A) Model verification against the observation using anomaly correlation for August monthly mean SST anomalies from the hindcast experiment initialized on the April 1st. (B) The temporal evolution of the area average temperature from the mapped region, for the model hindcast on the left and the observation on the right. Green indicates the climatological means, and blue indicates the average development of MHW event, and its 95% uncertainty spread shaded in light blue from the full experiments. The orange curve and shade indicate the same except for the Tbar experiment. The scatter for the surface stratification in June (horizontal) and August (vertical) from the all stations (C) in the northwest and (D) in the southwest boxes in MHW Augusts (magenta) and all Augusts (gray), with the titles of experiments labeled on top of each panel. The numbers of MHW occurrences in the corresponding experiments (magenta) with respect to the full experiment (gray) are marked in the top right corner in each box. For maximum gradient in the northwest and gradient at 20m depth in the southwest domain, respectively.
Knockout-style experiments revealed the role of each factor in generating MHWs through ocean stratification. We emphasize that the climatological means of the three factors considered for knocking out – the daily mean wind speed, the surface salinity boundary condition, and the initial conditions for temperature and salinity – were maintained equal to those of full experiments. Among these three factors, the knocking out daily wind variability generated the most robust difference from full. Anomalous daily wind speed variability hinders a thin ML from lasting long, which is the most critical condition among the tested three factors against the amplification of warm-surface anomalies. As shown in Figure 3B, the temporal evolution of SST from April to September in Tbar, in which the wind speed is restricted at the climatological daily mean strength without occasional gusts of wind, tends to reach a much warmer temperature for a longer duration than that with full.
Whichever factor was knocked out, more MHW events were triggered than they would with all three factors fully considered. This indicates that anomalies that hamper MHWs matter more than those that facilitate them. The abnormally strong wind would deepen the local ML and possibly help prevent MHW from occurring, while the abnormally weak wind would not further shoal ML much, which is already the shallowest of the year. Therefore, removing positive wind speeds flipped many summers and locations into the MHWs from normal situations, whereas removing negative wind speeds did not have turned the MHWs into normal situations (Tbar). Similarly, removing positive surface salinity increased the number of summers and locations of MHWs, while removing almost no negative salinity (Sbar). Removing the colder initial conditions increased the MHWs, whereas removing warmer conditions had almost no effect (Ibar).
The relevance of oceanic factors to vertical stratification was discussed for each experiment. With full, the simulated depths of the maximum temperature gradient in June ranged from 2 to 55 m, with a median of approximately 12 m in the northwestern domain. Two months later, the depth ranged from 10 m to 47 m, with a median of approximately 15 m (Figure 3C). The relationship was scattered, with a subtle implication of positive relationship between the two months (slope=0.18, r=0.35, p<0.05), indicating that the shallow depth in June ended at a shallower depth in August. Likewise, in the southern domain, the stronger the gradient at the bottom of the ML, the weaker the vertical mixing. Less than 5% of MHWs would occur if the gradient was less than approximately 0.1°C/m in June or less than approximately 0.2°C/m in August. (Figure 3D). The positive correlation is weak, especially with the MHWs, because the vertical stability is harder to increase further near the upper bound. If the ML is already extremely thin in June, there is little room to shoal in the following August. If the vertical gradient is already substantially strong in June, strengthening further is hard in the later summer, as the atmosphere would extract the excessive heat out of the ocean before SST becomes too hot. With Tbar, the most dramatic change was observed in the vertical stratification. Tbar demonstrated that the vertical stratification remained strong from the beginning of the summers without variable wind speeds beyond the climatological mean variation. As a result of removing both stronger and weaker wind anomalies, the ML depth in June and August is mostly confined within a box bounded by 8 and 20 m. Similarly in the southern domain, the maximum gradient at the bottom of ML is never below 0.2 in June and 0.25 in August (°C/m). As a result, roughly 3.5 times more MHWs are generated compared to full. With no anomalous daily wind strength, the positive linear relationship (in the northern domain, slope=0.14, r=0.33, p<0.05; in the southern domain, slope=0.7, r=0.45, p<0.05) between the vertical stratification in June and August was much more certain; otherwise, the relationship was scattered with less significance, as shown in all the three experiments with anomalous winds. This implies that day-to-day wind variability plays the most critical role in regulating the occurrence of MHWs and that the uncertainty in daily wind speed could substantially undermine the ocean surface temperature forecasts and the early warning of MHWs. Although much less robustly, both Sbar and Ibar demonstrate the asymmetric results as well, in which the results indicate removal of one side of forcing matters more, where both the positive and the negative anomalies are removed.
Another important implication of Ibar experiment is whether the cause of the positive trend in MHW frequency is the background warming due to climate change, which could have gradually increased the chances for the local SST to exceed the threshold for MHW detection. If the warming due to the climate change helped efficiently the local marine MHWs to occur, the frequency of MHWs is not expected to increase in time without the interannually varying initial conditions, while it is in Full. But it turns out that, the MHW occurrences in Ibar followed those of the fully initialized cases. Therefore, it is implied that the historical increase in MHW frequencies has not been due to gradual rise of the local surface temperature, but because of more frequent set-ups of MHW-favored conditions, such as the decreasing wind mixing.
The strong winds associated with the MHW-preventing vertical ocean mixing in the Yellow Sea exhibit substantial coherence with extratropical cyclones that pass in early summers. As shown in Figure 4, stronger-than-normal precipitation anomalies passed eastward across the Yellow Sea approximately two days before and two days after strong winds (top 33% daily). These precipitation anomalies are caused by convective weather systems that typically travel eastward along the frontal structure associated with the Changma, which is referred to as the rainy season in Korea between June and August, accompanied by the maturing East Asian Summer Monsoon system across the Korean Peninsula (Wang et al., 2001; Ha et al., 2012). However, the meridional position of these systems around the days of MHW events shifted northward, as if the typical Changma front had matured unusually ahead of time. In addition, positive interannual anomalies in the number of strong-wind days in June were associated with a northward interannual shift in the position of the monsoonal precipitation (Figure 5). Therefore, the early arrival of Changma shields the local ocean surface against MHWs in the late summer. In addition to wind mixing, the reduced solar radiation and enhanced latent heat flux tagging along the passing cyclones could help intensify the vertical instability via surface cooling. Although lower-than-normal surface salinity due to excessive precipitation may slightly reduce vertical mixing, it is unlikely that salinity played a decisive role, as shown by the numerical experiments in this study.
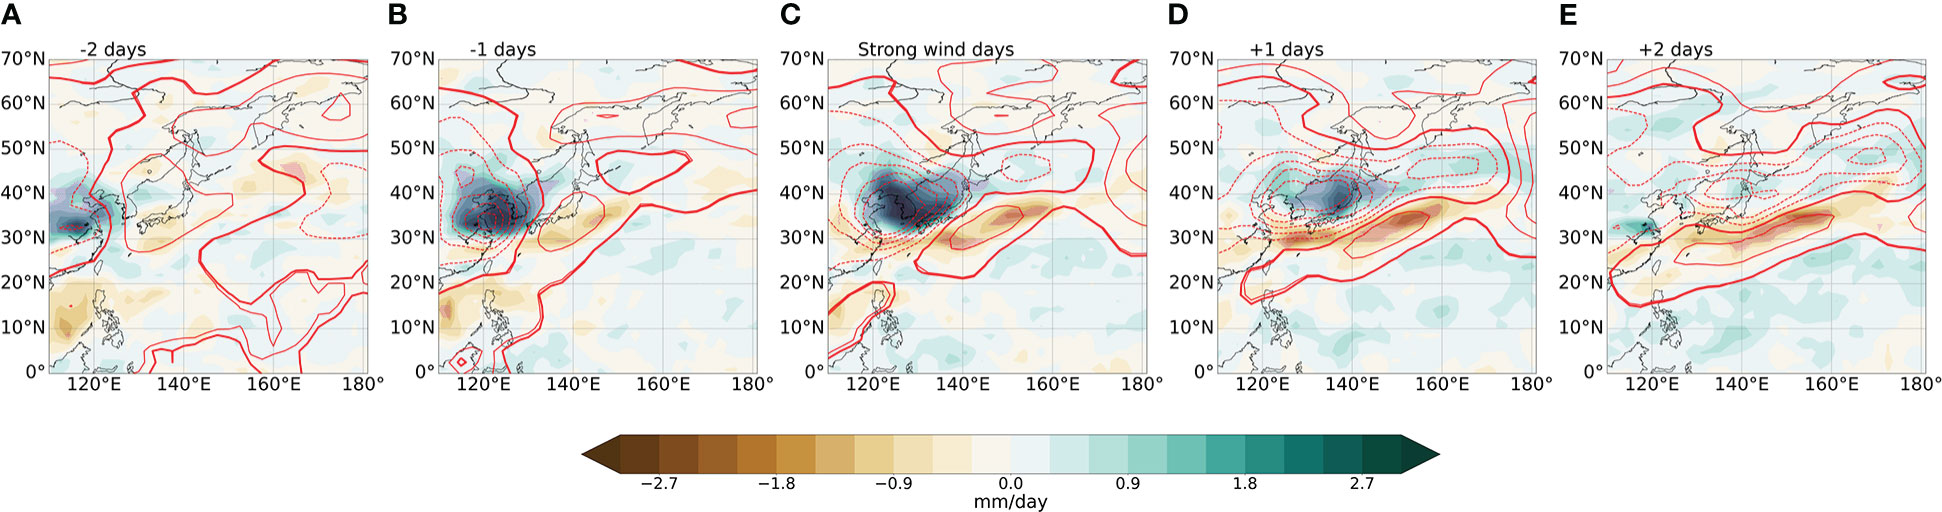
Figure 4 (A–E) Temporal evolution of the sea level pressure (SLP, red contours) and the precipitation (PREC, green and brown shades) anomalies before and after the days of strong wind (top 33% daily) in June. Black arrows guide through the chronological order. Contour interval is 0.3hPa. Stipples indicate significance at 95% level.
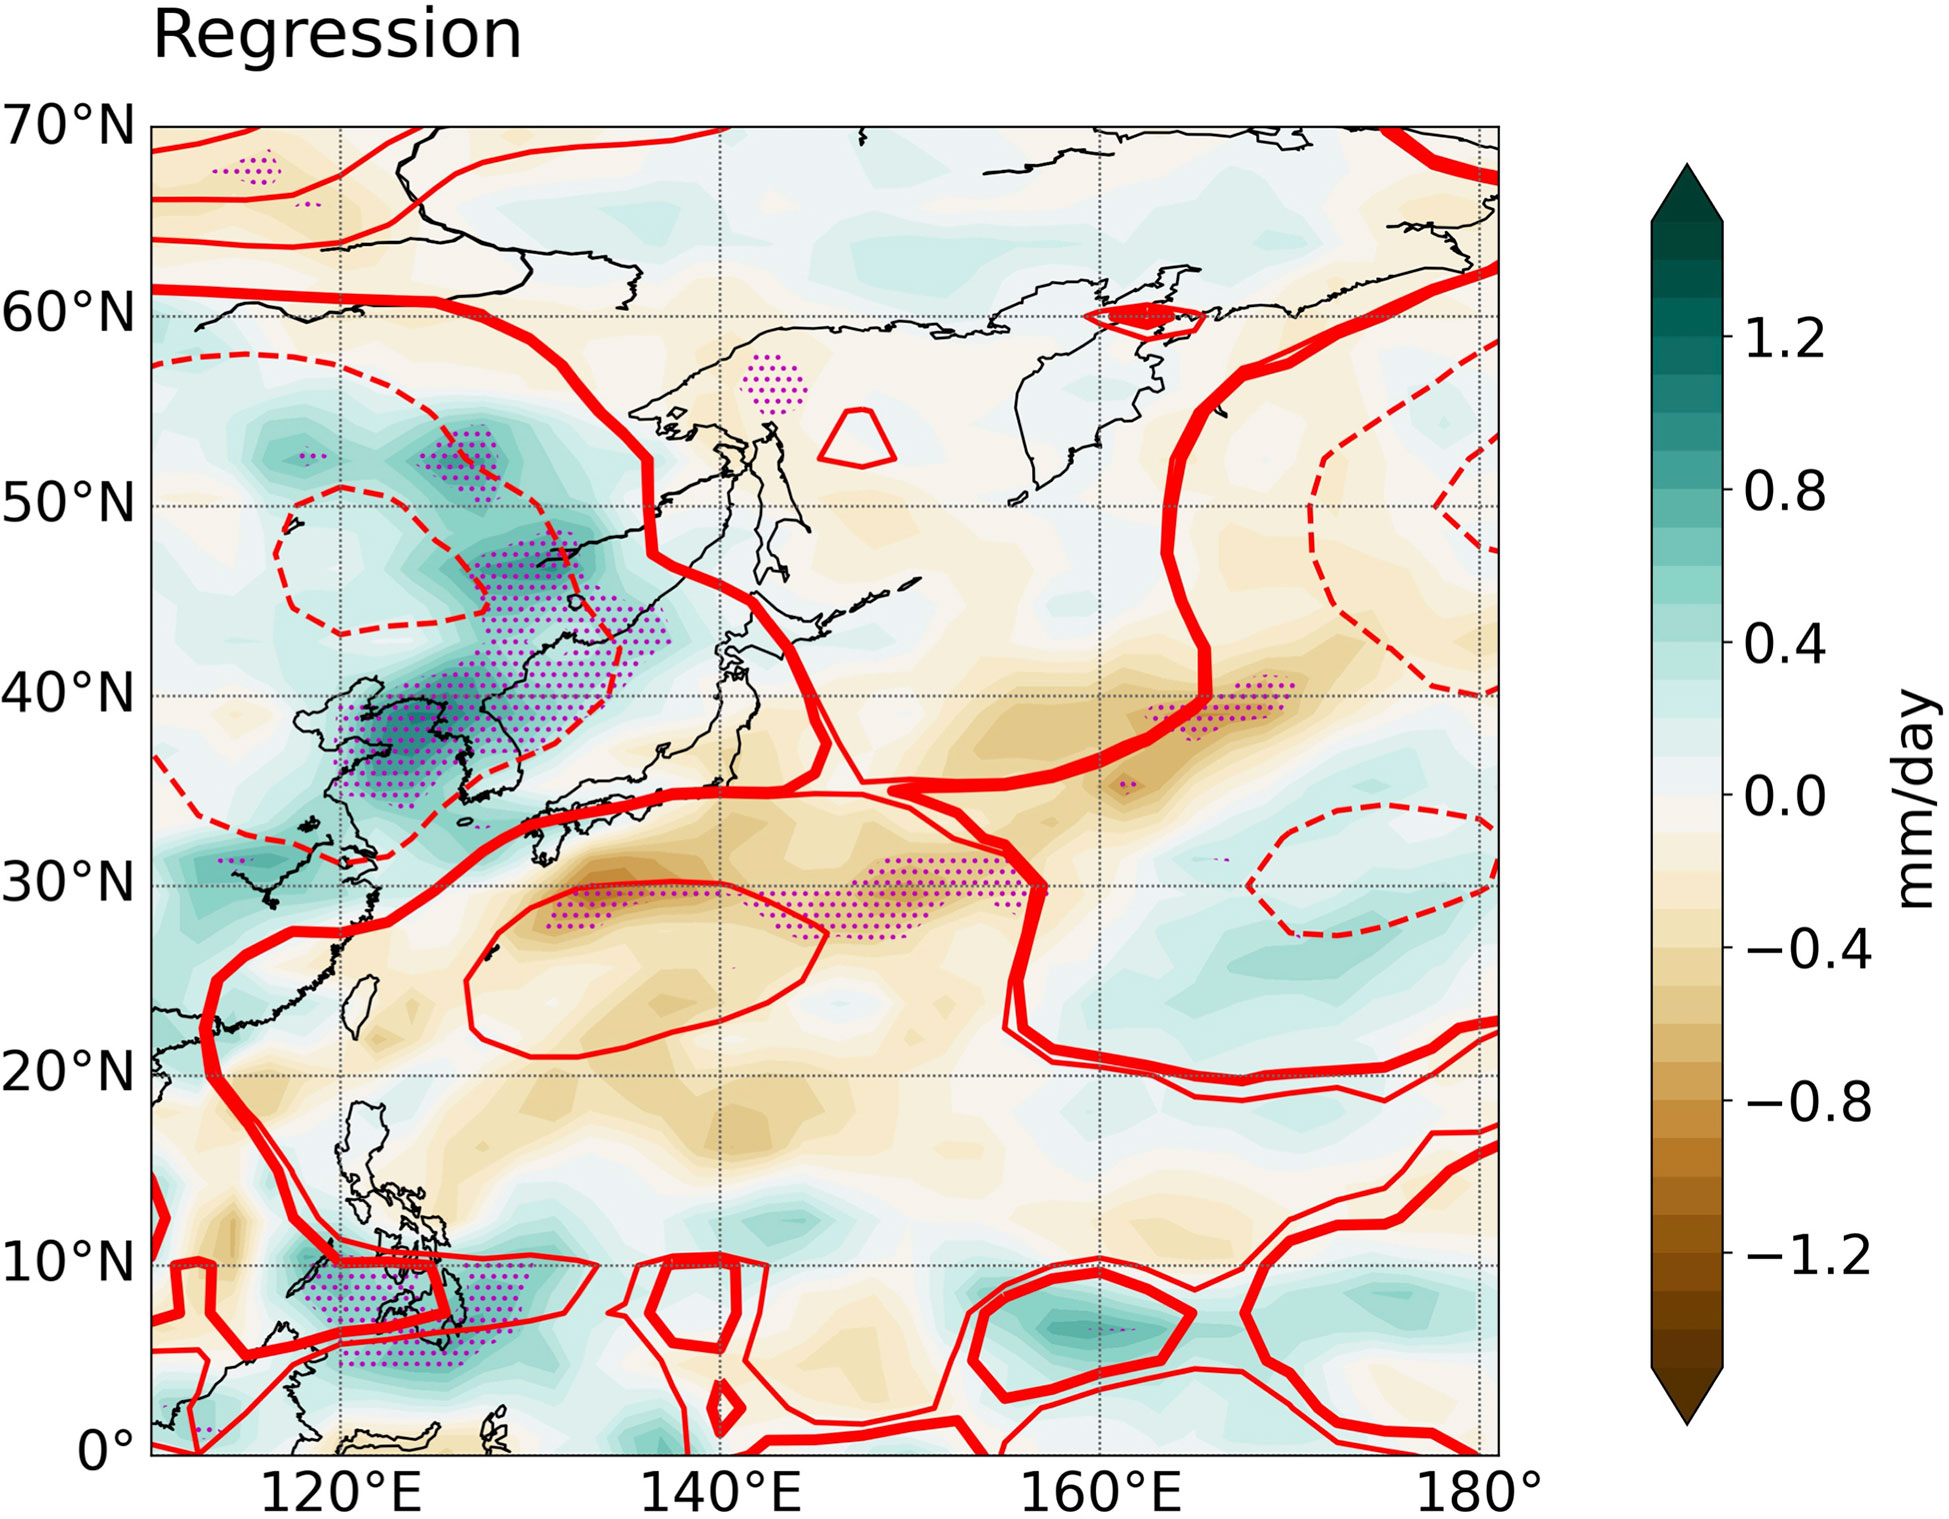
Figure 5 Same as Figure 4, except for the linear regression coefficients of the monthly mean anomalies of the SLP and PREC associated with the standardized monthly counts of the days of strong wind (top 33%).
The MHW-driving processes in a marginal sea in East Asia were investigated, with a focus on the role of the ocean in early summer. In addition to the surface heat flux, upper ocean stability in early summer is another decisive factor for MHW occurrence later in summer. The performance of a 1-dimsional model with variable stratification for temperature and salinity forced with surface heat and freshwater flux was verified with 6-month long hindcast experiments initialized on April 1st from 1980, to 2020. In knockout-style experiments, the passing of mesoscale low-pressure systems is wound, shielding the regional sea against MHWs by causing vertical instability with wind. The experiments further revealed the dominance of surface wind mixing over density-driven vertical stability in triggering the individual MHW events. Furthermore, the weakening surface wind is suggested to be responsible for the recent increase in extreme heating events rather than the gradual decrease in surface buoyancy due to climate change. We suggest that the validity of our simple hypothesis that warming sea surface temperatures due to climate change would trigger more MHW events might be highly dependent on regional environments, and must be rigorously tested.
It is worth to mention that the predictability presented in this study is distinguishable from the previously suggested long-range predictability of MHWs, which are highly dependent on ENSO predictability (Lee et al., 2020; Capotondi et al., 2022). The former originates from local oceanic preconditions, whereas the latter originates mainly from the surface heat flux driven remotely by atmospheric variability. Because it is possible that the two sources of predictability can be partially independent of each other, further skill improvement is expected by considering both.
Producing useful medium range forecast of MHW events in the local ocean, in a monthly to interannual lead time, is still extremely challenging for traditional numerical ocean models with full primitive equations. This study indicates that improvement of the local vertical structure in the prediction system can lead to improvement in MHW prediction even with a 1-D ocean model solving for a simple heat budget. Effective improvement could be made through improving the representation of vertical mixing in the state-of-the-art ocean models, or improvement in assimilating vertical profile data in the regions of interest.
One of the shortcomings of this study was that the impact of typhoons was not explicitly considered, although typhoons were included in the surface heat flux and wind stresses in the hindcast experiments. Typhoons were set aside from the main discussion as we decided that they were events of late summers, contributing little to the preconditioning of MHWs. The roles of the TWC and YSCBW have not been thoroughly considered considering the shallow regional topography. In a first-order approximation, local vertical stability is more important for MHW than oceanic heat transport, as these subsurface variabilities are usually beyond the reach of normal summer mixing. However, combined with typhoon-scale mixing, some could have significantly affected the summer MHWs, as in previous reports on selected years (Lee et al., 2016).
The original contributions presented in the study are included in the article/supplementary material. Further inquiries can be directed to the corresponding author.
DL and EL participated in every aspect of this work; all other authors contributed to the interpretation of the results. All authors contributed to the article and approved the submitted version.
This work was supported by the National Research Foundation of Korea (NRF- 2019R1A2C1090009, NRF-2021M3I6A1091272, NRF-2022R1A4A1033825), Korea Institute of Marine Science & Technology Promotion(KIMST) funded by the Ministry of Oceans and Fisheries(KIMST-20220033), and Chungnam National University. Y-GP was supported by KIMST, funded by the Ministry of Oceans and Fisheries(KIMST-20190344).
The authors declare that the research was conducted in the absence of any commercial or financial relationships that could be construed as a potential conflict of interest.
All claims expressed in this article are solely those of the authors and do not necessarily represent those of their affiliated organizations, or those of the publisher, the editors and the reviewers. Any product that may be evaluated in this article, or claim that may be made by its manufacturer, is not guaranteed or endorsed by the publisher.
The Supplementary Material for this article can be found online at: https://www.frontiersin.org/articles/10.3389/fmars.2023.1118969/full#supplementary-material
Amaya D. J., Alexander M. A., Capotondi A., Deser C., Karnauskas K. B., Miller A. J., et al. (2021). Are long-term changes in mixed layer depth influenceing north paicific marine heatwaves? Bull. Amer. Meteor. Soc 102, S59–S66. doi: 10.1175/BAMS-D-20-0144.1
Anderson S. P., Weller R. A., Lukas R. B. (1996). Surface buoyancy forcing and the mixed layer of the western pacific warm pool observations and 1D model results. J. Climate. 9, 3056–3085. doi: 10.1175/1520-0442(1996)009<3056:SBFATM>2.0.CO;2
Cai R., Tan H., Kontoyiannis H. (2017). Robust surface warming in offshore China seas and its relationship to the East Asian monsoon wind field and ocean forcing on interdecadal time scales. J. Climate. 30, 8987–9005. doi: 10.1175/JCLI-D-16-0016.1
Capotondi A., Newman M., Xu T., Di Lorenzo E. (2022). An optimal precursor of northeast pacific marine heatwaves and central pacific El nino events. Geophys. Res. Lett. 49, e2021GL097350. doi: 10.1029/2021GL097350
Chiswell S. M. (2021). Atmospheric wavenumber-4 driven south pacific marine heat waves and marine cool spells. Nat. Commun. 12, 4779. doi: 10.1038/s41467-021-25160-y
Gao G., Marin M., Feng M., Yin B., Yang D., Feng X., et al. (2020). Drivers of marine heatwaves in the East China Sea and the south yellow Sea in three consecutive summers during 2016-2018. J. Geophys. Res. 125, e2020JC01658. doi: 10.1029/2020JC016518
Gupta S. A., Thomsen M., Benthuysen J. A., Hobday A. J., Oliver E. C. J., Alexander L. V., et al. (2020). Drivers and impacts of the most extreme marine heatwaves events. Sci. Rep. 10, 19359. doi: 10.1038/s41598-020-75445-3
Ha K. J., Heo K. Y., Lee S. S., Yun K. S., Jhun J. G. (2012). Variability in the East Asian monsoon: a review. Meteorol. Appl. 19, 200–215. doi: 10.1002/met.1320
Hobday A. J., Alexander L. V., Perkins-Kirkpatrick S. E., Smale D. A., Straub S. C., Oliver E. C. J., et al. (2016). A hierarchical approach to defining marine heatwaves. Prog. Oceanogr. 141227–238. doi: 10.1016/j.pocean.2015.12.014
Jacox M., Alexander M. A., Amaya D., Becker E., Bograd S. J., Brodie S., et al. (2022). Global seasonal forecasts of marine heatwaves. Nature 604, 486–490. doi: 10.1038/s41586-022-04573-9
Kalnay E., Kanamitsu M., Kistler R., Collins W., Deaven D., Gandin L., et al. (1996). The NCEP/NCAR 40-year reanalysis project. Bull. Amer. Meteor. Soc 77, 437–470. doi: 10.1175/1520-0477(1996)077<0437:TNYRP>2.0.CO;2
Korea Meteorological Administration, National Climate Data Center (2023) HeatWaves. Available at: https://data.kma.go.kr/climate/heatWave/selectHeatWaveChart.do (Accessed January 12, 2023).
Lee J. H., Pang I. C., Moon J. H. (2016). Contribution of the yellow Sea bottom cold water to the abnormal cooling of sea surface temperature in the summer of 2011. J. Geophys. Res: Oceans. 121, 3777–3789. doi: 10.1002/2016JC011658
Lee S., Park M. S., Kwon M., Kim Y. H., Park Y. G. (2020). Two major modes of East Asian marine heatwaves. Environ. Res. Lett. 15, 074008. doi: 10.1088/1748-9326/ab8527
Li J., Li G., Xu J., Dong P., Qizo L., Liu S., et al. (2016). Seasonal evolution of the yellow Sea cold water mass and its interactions with ambient hydrodynamic system. J. Geophys. Res. 121, 6779–6792. doi: 10.1002/2016JC012186
Lin L., Liu D., Luo C., Xie L. (2019). Double fronts in the yellow Sea in summertime identified using sea surface temperature data of multi-scale ultra-high resolution analysis. Cont. Shelf. Res. 175, 76–86. doi: 10.1016/j.csr.2019.02.004
Li Y., Ren G., You Q., Wang Q., Niu Q., Mu L. (2022). The 2016 record-breaking marine heatwave in the yellow Sea and associated atmospheric circulation anomalies. Atmos. Res. 268, 106011. doi: 10.1016/j.atmosres.2021.106011
Mathieu T., de Young B. (1995). Application of a mixed layer model to the inner Newfoundland shelf. J. Geophys. Res. 100, 921–936. doi: 10.1029/94JC01435
Ministry of Oceans and Fisheries (2022) High-temperature damage status. Available at: https://www.mof.go.kr/article/view.do?menuKey=971&boardKey=10&articleKey=46393 (Accessed January 12, 2023).
Mujumdar M., Salunke K., Rao S. A., Ravichandran M., Goswami B. N. (2011). Diurnal cycle induced amplification of sea surface temperature intraseasonal oscillations over the bay of Bengal in summer monsoon season IEEE. Geosci. Remote. Sens. Lett. 8, 206–210. doi: 10.1109/LGRS.2010.2060183
Oliver E. C. J., Donat M. G., Burrows M. T., Moore P. J., Smale D. A., Alexander L. V., et al. (2018). Longer and more frequent marine heatwaves over the past century. Nat. Commun. 9, 1324. doi: 10.1038/s41467-018-03732-9
Park J. J. (2021). Quality evaluation of long-term shipboard salinity data obtained by NIFS. J. Kor. Soc. Oceanogr. 26, 49–61. doi: 10.7850/jkso.2021.26.1.049
Park S., Chu P. C., Lee J. H. (2011). Interannual-to-interdecadal variability of the yellow Sea cold water mass in 1967-2008: Characteristics and seasonal forcings. J. Mar. Sys. 87, 177–193. doi: 10.1016/j.jmarsys.2011.03.012
Park T., Jang C. J., Jungclaus J. H., Haak H., Park W., Oh I. S. (2011). Effects of the changjiang river discharge on sea surface warming in the yellow and East China seas in summer. Cont. Shelf. Res. 31, 15–22. doi: 10.1016/j.csr.2010.10.012
Price J. F., Weller R. A., Pinkel R. (1986). Diurnal cycling: Observations and models of the upper ocean response to diurnal heating, cooling, and wind mixing. J. Geophys. Res. 91, 8411–8427. doi: 10.1029/JC091iC07p08411
Reynolds R. W., Smith T. M., Liu C., Chelton D. B., Casey K. S., Schlax M. G. (2007). Daily high-resolution-blended analyses for sea surface temperature. J. Climate. 20, 5473–5496. doi: 10.1175/2007JCLI1824.1
Tan H., Cai R. (2018). What caused the record-breaking warming in the East China seas during august 2016? Atmos. Sci. Lett. 19, e853. doi: 10.1002/asl.853
Wang B., Wu R., Lau K. (2001). Interannual variability of the Asian summer monsoon: Contrasts between the Indian and the western north pacific-east Asian monsoons. J. Climate. 14, 4073–4090. doi: 10.1175/1520-0442(2001)014<4073:IVOTAS>2.0.CO;2
Wang Q., Zhang B., Zeng L., He Y., Wu Z., Chen J. (2022). Properties and drivers of marine heatwaves in the northern south China Sea. J. Phys. Oceanogr. 52, 917–927. doi: 10.1175/JPO-D-21-0236.1
Xu T., Newman M., Capotondi A., Lorenzo E. (2020). The continuum of northeast pacific marine heatwaves and their relationship to the tropical pacific. Geophys. Res. Lett. 48, e2020GL090661. doi: 10.1029/2020GL090661
Yang Y., Li T., Yu W., Li K. (2015). What controls seasonal variations of the diurnal cycle of sea surface temperature in the eastern tropical Indian ocean? J. Climate. 28, 8466–8485. doi: 10.1175/JCLI-D-14-00826.1
Yu J., Gan B., Jing Z., Wu L. (2020). Winter extreme mixed layer depth south of the kuroshio extension. J. Climate. 33, 10419–10436. doi: 10.1175/JCLI-D-20-0119.1
Keywords: marine heatwaves, vertical stratification, East Asian summer monsoon, 1-dimensional ocean model, extreme forecast
Citation: Lee EY, Lee DE, Park Y-G, Kang H and Baek H (2023) The local stratification preconditions the marine heatwaves in the Yellow Sea. Front. Mar. Sci. 10:1118969. doi: 10.3389/fmars.2023.1118969
Received: 08 December 2022; Accepted: 24 January 2023;
Published: 02 February 2023.
Edited by:
Lichuan Wu, Uppsala University, SwedenReviewed by:
Toru Miyama, Japan Agency for Marine-Earth Science and Technology, JapanCopyright © 2023 Lee, Lee, Park, Kang and Baek. This is an open-access article distributed under the terms of the Creative Commons Attribution License (CC BY). The use, distribution or reproduction in other forums is permitted, provided the original author(s) and the copyright owner(s) are credited and that the original publication in this journal is cited, in accordance with accepted academic practice. No use, distribution or reproduction is permitted which does not comply with these terms.
*Correspondence: Dong Eun Lee, ZGxlZUBjbnUuYWMua3I=
Disclaimer: All claims expressed in this article are solely those of the authors and do not necessarily represent those of their affiliated organizations, or those of the publisher, the editors and the reviewers. Any product that may be evaluated in this article or claim that may be made by its manufacturer is not guaranteed or endorsed by the publisher.
Research integrity at Frontiers
Learn more about the work of our research integrity team to safeguard the quality of each article we publish.