
95% of researchers rate our articles as excellent or good
Learn more about the work of our research integrity team to safeguard the quality of each article we publish.
Find out more
ORIGINAL RESEARCH article
Front. Mar. Sci. , 01 September 2023
Sec. Deep-Sea Environments and Ecology
Volume 10 - 2023 | https://doi.org/10.3389/fmars.2023.1117806
This article is part of the Research Topic 16th Deep-Sea Biology Symposium View all 27 articles
 Kátia Cristina Aparecido1,2*
 Thierry Frédou2
 Leandro Nolé Eduardo1
 Michael Maia Mincarone3,4
 Rayssa Siqueira Lima2
 Maria Fernanda da Silva Morais2
 Bastien Mérigot1
Mesopelagic zones (200–1,000-m depth) are characterized by relatively low light levels, cold waters, and often limited oxygen, forming a stable yet challenging habitat for their inhabitants. To overcome these constraints, mesopelagic fishes have developed several adaptations that enable them to participate in crucial ecosystem processes such as nutrient cycling, carbon transport, and provisioning of harvestable fish stocks. However, our understanding of the functional diversity of mesopelagic fishes remains limited, while it is of particular importance considering the increase in human threats and possible environmental changes in the deep ecosystems. In this context, functional diversity emerges as a powerful tool and can help assess community assembly rules, including species complementary and redundancy. Here, we take advantage of scientific surveys that collected 200 species taxa identified from over 7,000 specimens to determine the functional diversity of mesopelagic fish assemblages across depths and the day–night period. We created a data set of 17 qualitative functional traits related to feeding, survival, and locomotion functions. Based on this information, functional spaces and diversity indices were calculated, and functional groups were established. Furthermore, the influence on the functional diversity of environmental variables and the day–night period was assessed by generalized additive models (GAMs). The hypothesis of functional complementary was tested. Overall, mesopelagic fishes displayed a high functional diversity and could be grouped into 10 major functional groups. Moreover, 107 species exhibited a unique composition of functional trait values, revealing a vast complementarity of functions within the deep-sea ecosystem. We also showed that functional diversity in mesopelagic ecosystems is neither static nor homogeneous, exhibiting higher values in the deepest layers and varying between day and night. We finally discuss processes that may structure mesopelagic fish assemblages and the implications of our findings for the conservation mesopelagic fishes.
Functional diversity (FD) plays a crucial role in understanding the relationship between biodiversity and ecosystem processes (Naeem, 2006), complementing taxonomic and phylogenetic diversity analyses. FD takes into account the functional traits of species, which are essential for assessing the impact of environmental changes and human pressures on ecosystems (McGill et al., 2006; Villéger et al., 2010). Moreover, FD contributes to informing conservation and management strategies by identifying areas that require protection (Mouillot et al., 2011). One significant advantage of FD over taxonomic diversity is that it captures the ecological roles and functions that species perform within an ecosystem. This approach allows for identifying species with unique functional traits that may affect ecosystem processes disproportionately (Mouillot et al., 2013b). Taking a functional traits perspective, rather than focusing solely on species, can enhance predictions because ultimately these traits determine the nature and strength of animal impacts on ecosystems (Schmitz et al., 2023). Recent advances in FD research have led to indices that quantify complementary features of the functional space occupied by species, considering both their positions and abundance or biomass (Villéger et al., 2008; Mouillot et al., 2013a). The FD concept involves several components, mainly as follows: functional richness, evenness, divergence, dispersion, originality, specialization, and redundancy. Different indices were developed to quantify these components. They have improved our understanding of community responses to environmental variations and predictions of ecosystem feedback (Gagic et al., 2015; Lefcheck and Duffy, 2015; Dee et al., 2016). However, FD analysis requires detailed information on species distribution and trait data, often limited to poorly known ecological groups, such as those inhabiting the mesopelagic zones.
Mesopelagic zones (200–1,000-m depth) are characterized, for example, by relatively low light levels, cold waters, and often limited oxygen, which create a stable yet challenging habitat for their inhabitants (Fock et al., 2004; Bertrand et al., 2010; Proud et al., 2017; Boswell et al., 2020). To overcome these constraints, mesopelagic fishes developed adaptations such as bioluminescence, complex visual systems, and different patterns of vertical migration that may reach shallow waters (Gjøsæter and Kawaguchi, 1980; Sutton, 2013; Priede, 2017). These adaptations enable their contribution to several ecological processes that underpin oceanic ecosystems and offer numerous benefit to society. Notably, mesopelagic species are essential to nutrient cycling and carbon transportation across depth layers. They also provide food for larger predators in marine ecosystems. Nonetheless, despite their ecological significance, our understanding of mesopelagic species remains limited, while it is of critical importance considering the increase in threats such as climate change, plastic pollution, and exploitation of deep-sea resources (Davison and Asch, 2011; Hidalgo and Browman, 2019; Levin et al., 2019; Drazen et al., 2020; Ferreira et al., 2022; Justino et al., 2022). For instance, there is a significant knowledge gap about the basic biology of many species, including their life history and crucial functional traits. Information such as maximum age, age of first maturity, spawning seasons, distribution of sex ratios across different layers, and variations in feeding based on sex or maturity stage are lacking. This deficit hinders our ability to investigate ecological patterns and community assembly rules in the context of unprecedented global changes.
More specifically, in mesopelagic research, a pivotal question revolves around how a zone with such environmental constraints can support important species diversity and biomass (Gjøsæter and Kawaguchi, 1980; Eduardo et al., 2022), challenging the initial supposition of reduced biodiversity in deep-sea ecosystems (Priede, 2017). The remarkable diversity found in these ecosystems may stem from the ecological specialization of species, considering their niche and functional roles (Devictor et al., 2010). In addition, community assembly rules, including stochastic and deterministic processes, aim to explain species coexistence. Two main deterministic processes have been defined: limiting similarity (MacArthur, 1958; Abrams, 1983) and environmental filtering (Van Der Valk, 1981; Weiher et al., 1998; Kraft et al., 2015). Limiting similarity suggests that species with different traits are more likely to coexist. This hypothesis is a corollary of the competitive exclusion principle (Gause, 1932), which states that two species competing for the same resources cannot stably coexist. Thus, the competitive exclusion will result in a pattern where functionally similar species cannot co-occur. Conversely, it leads to the co-occurrence of species that are complementary in resource use and, thus, in niche occupied. In contrast, the environmental filtering hypothesis favors species with traits better adapted to environment requirements and leads to more similar traits among species. In the mesopelagic zone, where photosynthetic primary production is scarce, species may have evolved specific traits and feeding habits to exploit different resources and/or depths and avoid direct competition (Gloeckler et al., 2018; Eduardo et al., 2023). Although their evolutionary processes have not yet been extensively studied, it is plausible to assume that these environmental pressures have influenced their evolution in distinct ways. As a result, mesopelagic fishes may have undergone specific adaptations and developed unique characteristics that contribute to their survival in this challenging habitat. Given the specialized nature of mesopelagic habitat and the unique adaptations of mesopelagic fishes, it is reasonable to assume that functional redundancy among these species may be low.
The main objective of this study is to investigate whether the mesopelagic fish community exhibits high functional diversity due to the presence of species with unique and complementary functions and to investigate functional diversity patterns according to environmental variables. We notably tested the hypothesis of functional complementarity among species. This means that the species perform distinct functions, and there is a relatively low degree of functional redundancy among them. This research contributes to filling knowledge gaps in understanding the functional diversity of the mesopelagic fishes. It provides valuable information to initiate a discussion on the conservation of this understudied community.
The study area is located Fernando de Noronha Ridge, north-eastern Brazil (from Rio Grande do Norte to Pernambuco) (Figure 1). This area is classified as an Ecologically or Biologically Significant Marine Area (EBSA) that, by definition, is a unique place of fundamental importance for biodiversity and life cycles of marine species (CBD, 2014).
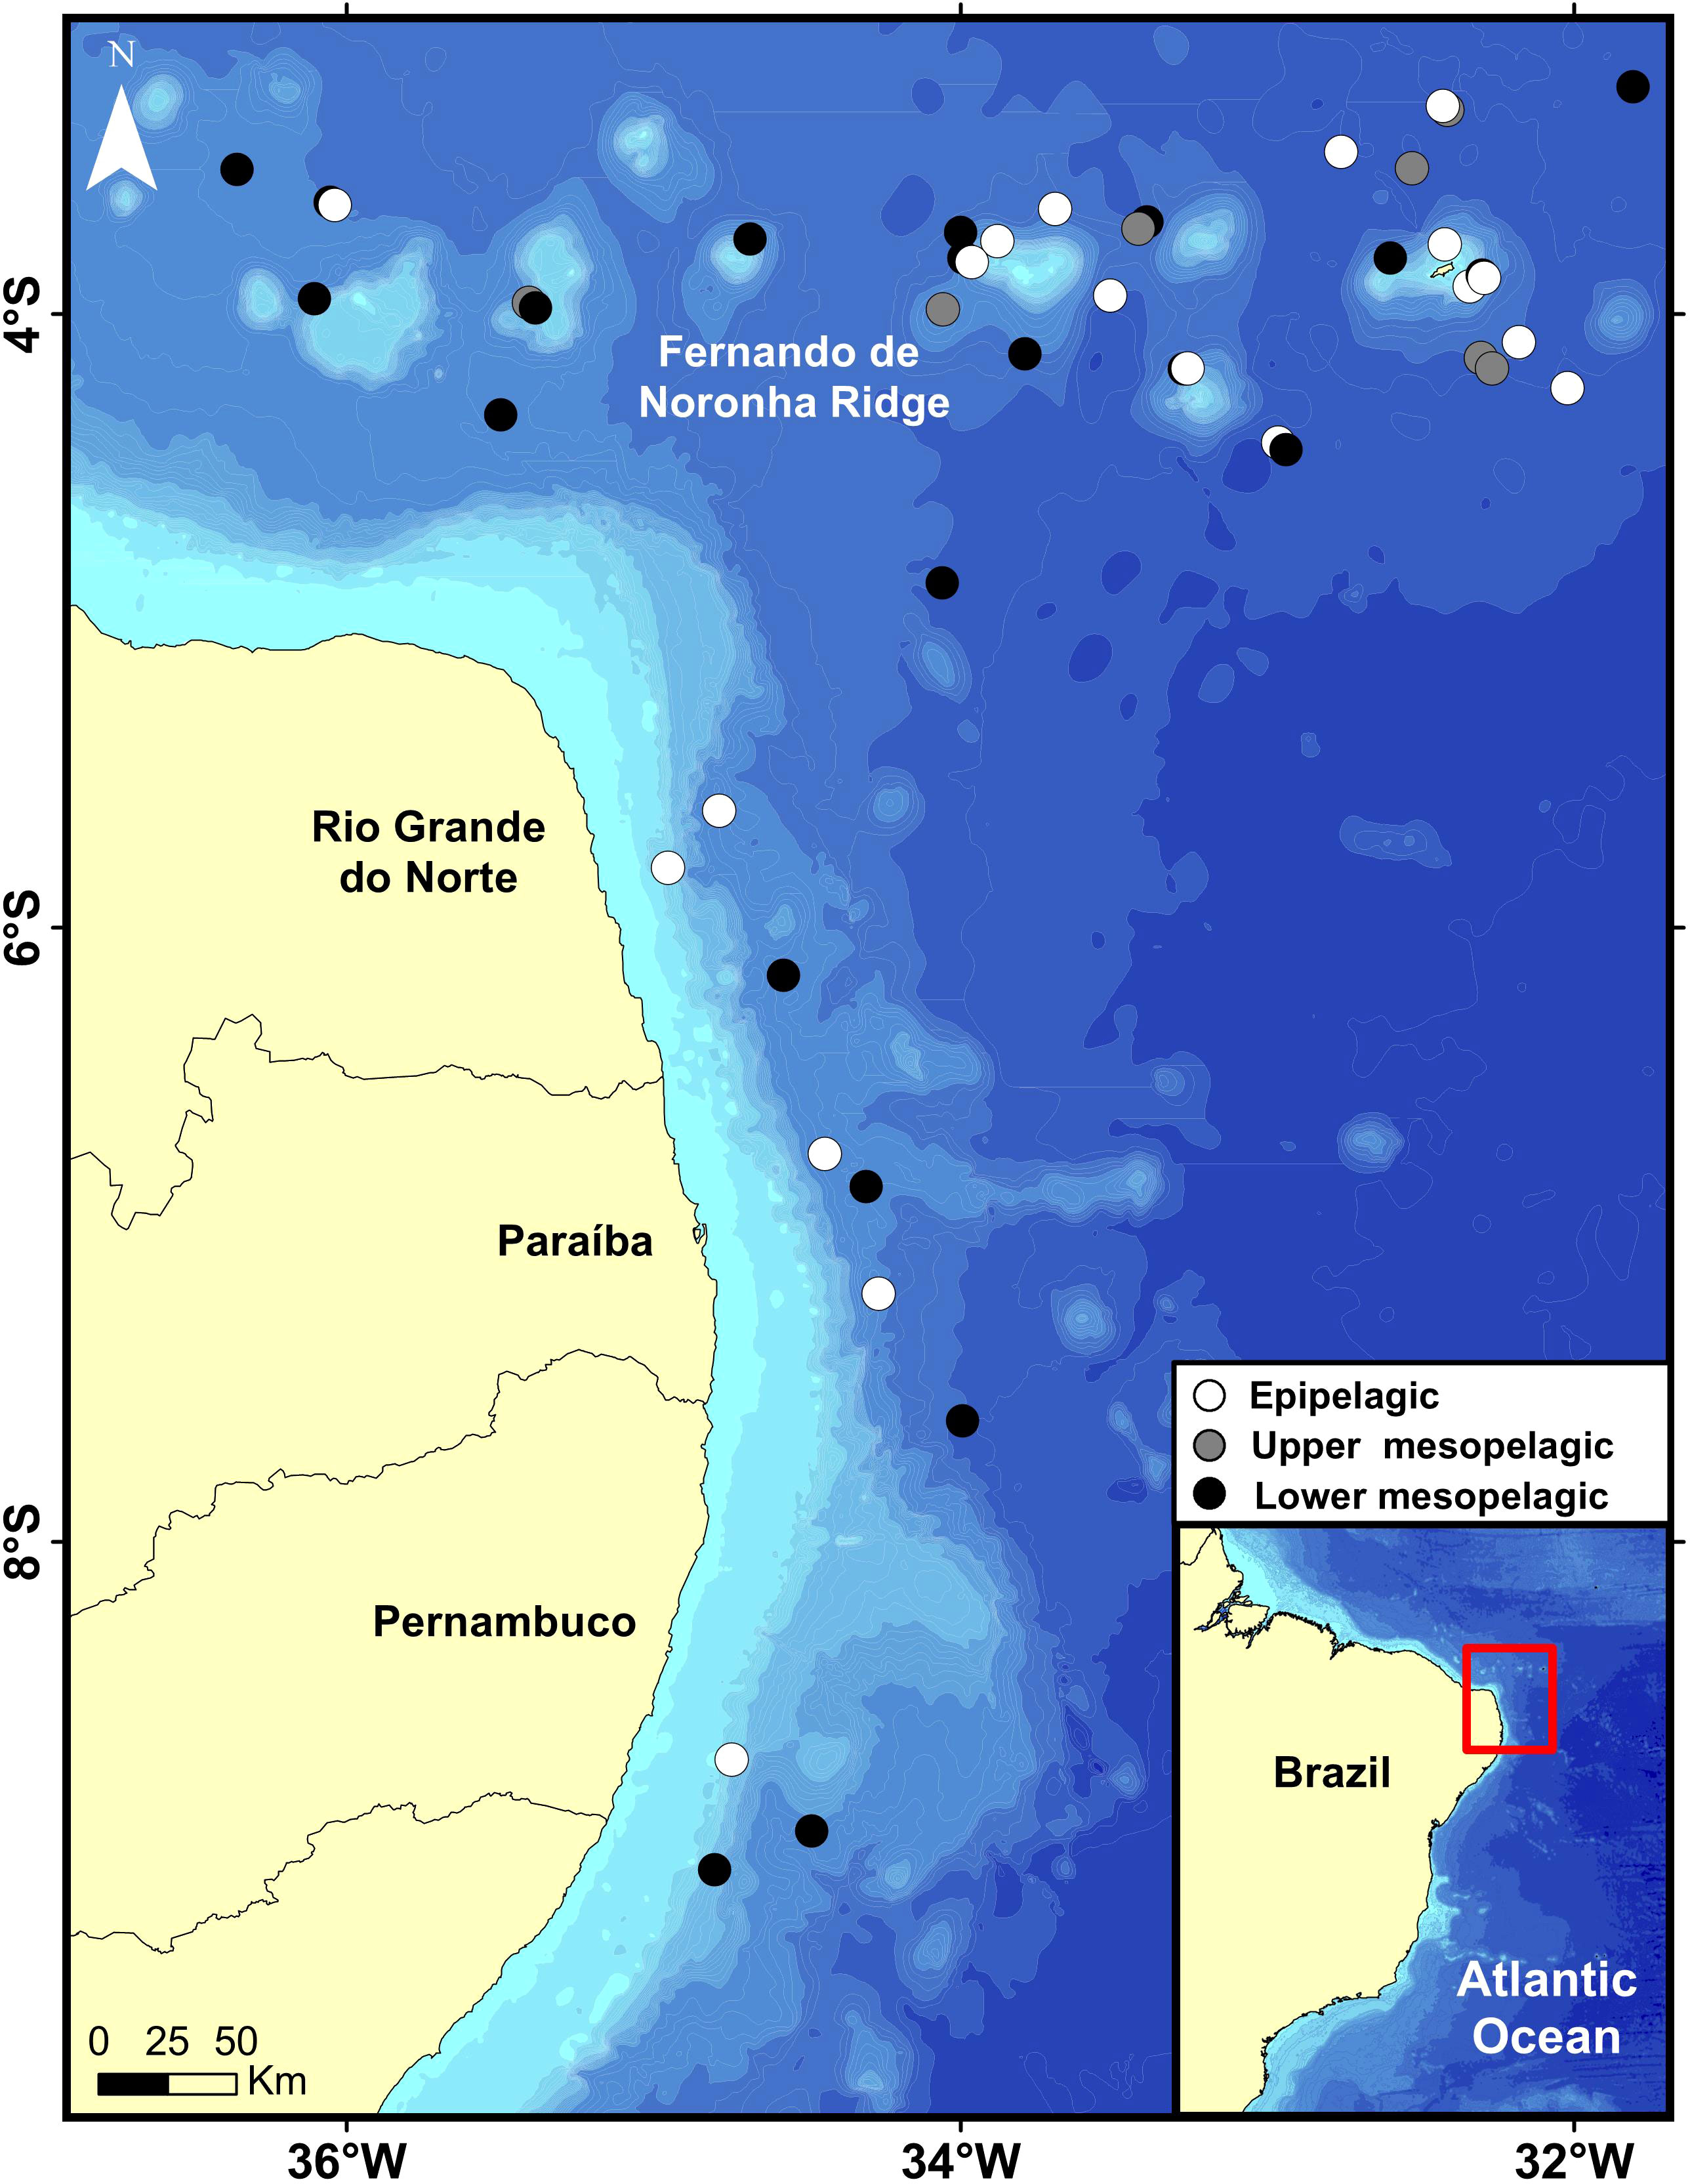
Figure 1 Sampling stations of Northeast Brazil are indicated by dots, and the color scheme defines the depth layers.
Several authors recently described the main oceanographic physico-chemical features of this region (Assunção et al., 2020; Dossa et al., 2021; Silva et al., 2021). Overall, south western topical Atlantic is considered to be oligotrophic. However, banks and oceanic islands act as barriers, enriching sub-surface waters and improving mass and energy fluxes in the food web (Travassos et al., 1999; Tchamabi et al., 2017).
Data were collected by the RV Antea during the ABRACOS scientific expeditions, carried out between September 29 and October 21, 2015 (AB 1; Bertrand, 2015), and between April 9 and May 10, 2017 (AB 2; Bertrand, 2017). Environmental profiles were collected using a CTDO SeaBird911+ with temperatures ranging from 4.36°C to 28.82°C, salinity from 34.40 to 37.34, and dissolved oxygen from 3.3 ml/L to 4.7 ml/L.
Mesopelagic fishes were sampled day and night at 62 trawl stations by using mesopelagic (AB1; body mesh 30 mm, cod-end mesh 4 mm, net mouth 16.6 × 8.4 m) and micronekton (AB2; body mesh 40 mm, cod-end mesh 10 mm, net mouth 24 × 24 m) nets. The targeted depth for each layer was defined according to the presence of scattered acoustic layers or patches of organisms. However, in an effort to improve the representativeness of biodiversity, we also conducted trawling in areas where no organism aggregations were observed and even beyond the range of the echosounder. Each trawl lasted approximately 30 minutes. Except for the layers 200–300 and 700–800 at night, where no aggregation of organisms was observed through acoustics, all depth strata were sampled at least once (for further information on sampling procedures, see Eduardo et al., 2022). A total of 7,190 fish specimens were collected, representing 200 distinct species (SI Table S1). All specimens collected were deposited at the fish collection of the Instituto de Biodiversidade e Sustentabilidade, Universidade Federal do Rio de Janeiro (NPM; Macaé, Brazil).
Sampling data were organized as a matrix with the 200 species as variables (i.e., columns of the matrix) and 62 surveyed stations as statistical objects (i.e., lines). This matrix was used to compute the diversity indices in Section 2.4.
All methods were approved and conducted following the regulations of the Brazilian Ministry of Environment (SISBIO authorization number: 47270-5). Operations of the RV Antea were approved by the Brazilian Navy Authority (“Estado-Maior da Armada”) under Ordinances 178 (August 9, 2015) and 4 (January 24, 2017).
Seventeen qualitative traits were selected to investigate the functions of feeding, locomotion, and survival (i.e., traits used as survival strategy) (Table 1) for 184 species among the 200 species (see Eduardo et al., 2022). Traits values were obtained from bibliographic references and the NPM museum specimens. When possible, missing data were inferred from observation and knowledge of experts in the field.
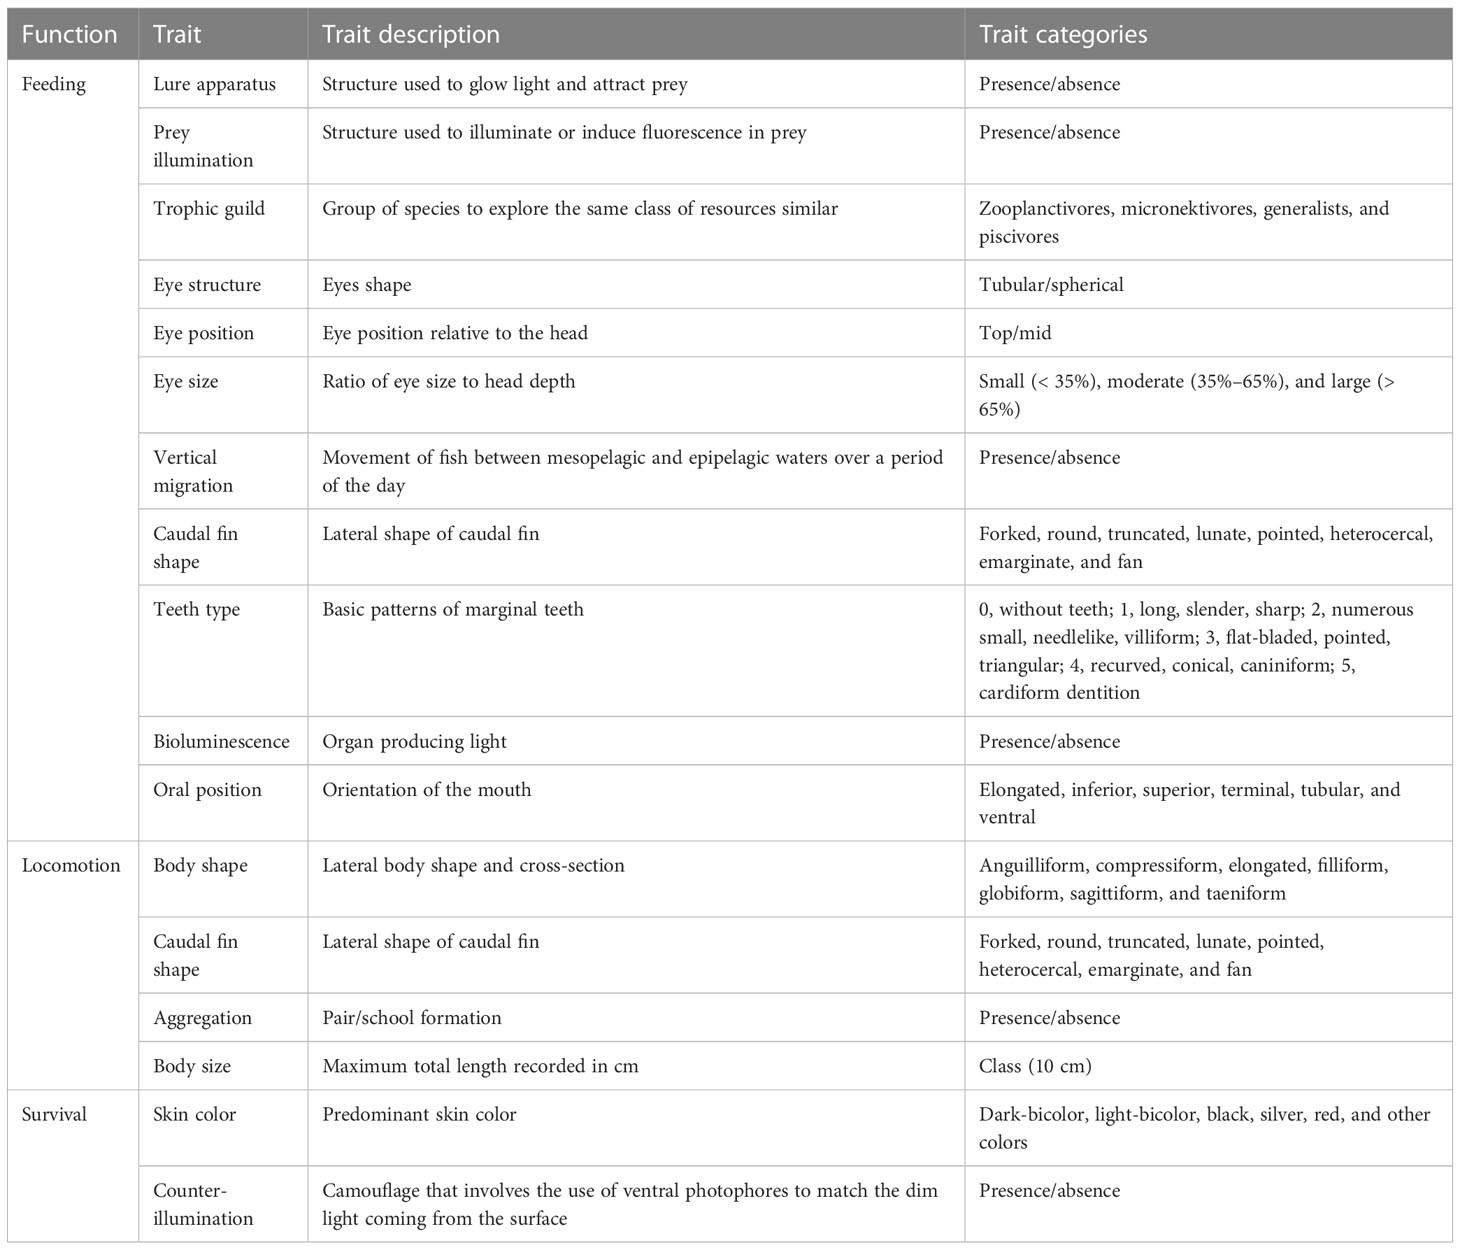
Table 1 Selected functional traits of feeding, locomotion, and survival and their respective modalities.
Regarding the skin color trait, fish skin colors were categorized into six modalities (Table 1). Notably, for fishes presenting two skin colors, we coded a predominant dark color as dark-bicolor, and a predominant lighted color as light-bicolor. More specifically, regarding certain anglefish species (Lophiiformes: Ceratioidei) with notable sexual dimorphism (Pietsch, 1976), we opted to focus on females as representatives of the species due to their higher capture frequency and easier identification when compared to males. Furthermore, anglefishes have a unique reproductive strategy in which smaller males rely on females for survival. They merge with the female’s skin as permanent parasitic appendages through a process known as “sexual parasitism”. Consequently, after the reproductive engagement, the female assumes responsibility for feeding, locomotion, and survival functions considered in this study.
From the information provided in Table 1, a functional trait matrix was created, with traits as variables (columns) and species as statistical objects (lines). This matrix was used to compute the functional diversity indices, including the functional space, and the fourth-corner analysis to study the relationship among functional traits and explanatory variables (see below).
Taxonomic species richness and the functional space occupied by species, based on the 17 traits associated with three primary functions (feeding, locomotion, and survival, Table 1), were first calculated for each depth layer (gamma diversity) to offer a comprehensive evaluation of the studied zones. Second, species richness and six additional functional diversity indices (Table 2) for each of the 62 sampled stations (alpha diversity) were also determined, and their mean values for each depth layer and day–night period were then computed to compare them (qualitative variables). Third, the alpha diversity values calculated for each station were further utilized to assess the effects of environmental conditions (quantitative variables, see Section 2.5).
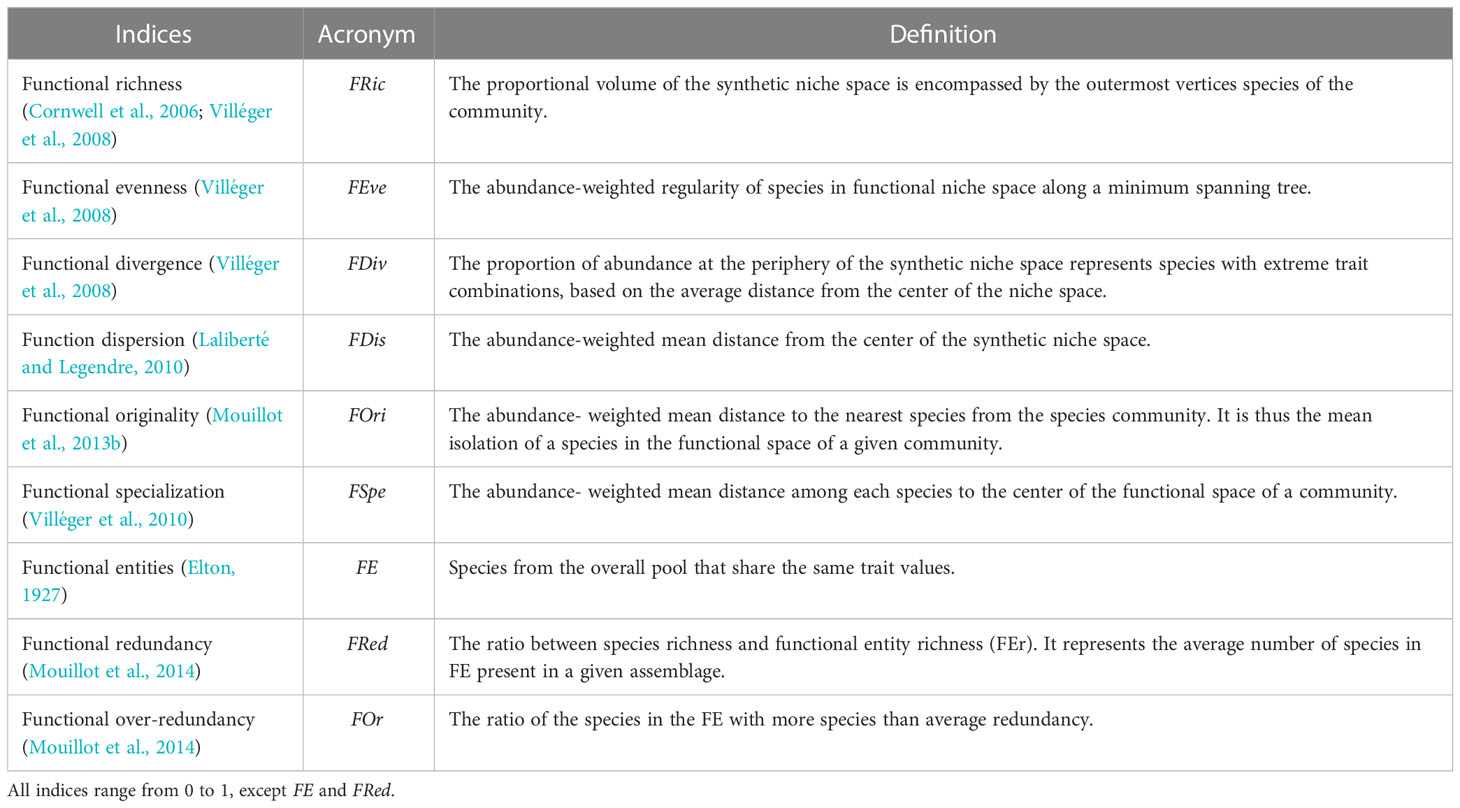
Table 2 Functional diversity indices computed on species data and 17 functional traits (adapted from Brandl et al., 2016).
The functional diversity indices are presented, with related references, in Table 2. In short, functional richness (FRic) quantifies how much niche space species occupy (i.e., convex hull volume). Higher index values indicate a larger volume occupied within trait space (Cornwell et al., 2006). Functional evenness (FEve) indicates how the species and their proportion (here based on abundance) are evenly distributed within the functional volume. Higher index values suggest that species and their proportions are more evenly distributed within the functional volume (Villéger et al., 2008). Functional divergence (FDiv) measures how far relatively highly abundant species with extreme traits are from the center of the functional trait space. It can be related to the levels of resource differentiation and competition among species (Mason et al., 2005). Functional dispersion (FDis) is the mean distance of individual species to the centroid of all species in the functional trait space. A high dispersion value infers a high species spread in the functional niche. Functional originality (FOri) computes the weighted mean distance between each species and the species closest to it in the functional space. Higher values might be interpreted as low functional redundancy (Mouillot et al., 2013b). Functional specialization (FSpe) is the mean distance among each species to the center of the functional space. It indicates the tendency of species to have extreme trait values (Lechêne et al., 2018). Therefore, it is possible to assess how generalist or specialist species are (Villéger et al., 2010; Mouillot et al., 2013b) with higher values indicating a predominance of specialist species.
We calculated total species richness (gamma) and mean species richness of stations (alpha) by depth layer (epipelagic 0–200 m, upper mesopelagic 200–500 m, and lower mesopelagic 500–1,000 m) and period stocks (day and night). We included all 200 taxa to compute taxonomic species richness since functional traits are not necessary for its calculation. We removed 16 species from the analyses because they had too many missing trait data (Johnson et al., 2021). Sampling stations (n = 15) with only two species were also removed, as calculating functional space is not feasible in such cases (e.g., fewer species than functional dimensions).
We computed pairwise functional species distances with the Gower distance metric between species based on functional trait values (considered as the variables). This metric can consider qualitative traits. As the distance between some species was 0 (i.e., functional redundancy), we also calculated FD based on functional entities (FEs). In this scenario, we grouped species into FEs according to their shared trait values (Mouillot et al., 2014). In addition, we computed functional redundancy FRed and over-redundancy FOr indices (Table 2) (Mouillot et al., 2014). To identify and visualize functional groups, we used the Gower trait-based distances among species in the average linkage clustering algorithm (unweighted pair group method with arithmetic mean(UPGMA)). It is a hierarchical method providing a dendrogram representation. Then, we employed the gap statistic method to determine the optimal number of functional groups (clusters) on the dendrogram (Tibshirani et al., 2001).
We tested the quality of the multidimensional space, representing the functional space built from a principal coordinates analysis (PCoA) considering two to 10 dimensions, using the R package mFD (Magneville et al., 2022) (SI Figure S1). To assess the quality of the representation, we used the lowest deviation between the original Gower trait-based distances among species and their Euclidean distances in the functional spaces from the PCoA (Maire et al., 2015). This index ranges between 0 and 1, with 0 being the lowest deviation. mSD values were very low for every number of dimensions considered (<0.13, Figure S1), and therefore, we kept only two dimensions to create and represent the functional space.
We calculated the six complementary indices of FD (Table 2), using the mFD package, for alpha diversity (i.e., computed for each sampled station, see values in Table S2). The values of the indices were scaled between 0 and 1 by dividing each value by the maximum value computed for a given index, except for FEve and FDiv, for which the values were already set between 0 and 1.
Finally, the empirical pairwise relationships (i.e., complementary/redundancy) among alpha FD indices were investigated using a draftsman plot representing both i) x–y plot fitted by a non-parametric local regression (locally reweighted scatter plot smoothing (LOWESS)) and ii) correlation coefficient (Figure S2). Then, given the non-linear trends among each FD index and some explanatory variables (Figure S2), generalized additive models (GAMs) were used to assess the relationship among each complementary alpha FD index (i.e., non-linearly related and non-correlated) and the environmental variables (oxygen, temperature, and depth), day and nighttime, and interactions among these explanatory variables. GAM analysis assesses the effect of multiple predictors in additive models and has the advantage of not requiring an a priori linear relationship. The models were chosen based on analyses of the multiple variable combinations, which were compared using the Akaike information criterion corrected for finite sample sizes (AICc). The best-fitted models were those with the lowest AICc. All GAM analyses were conducted using the R package “mgcv” (Wood, 2001).
We performed a fourth-corner analysis (FCA) (Legendre et al., 1997; Dray and Legendre, 2008; ter Braak et al., 2012) on the three following tables: environmental variables (R), species abundance (L), and functional traits (Q). The fourth corner correlation allows us to quantify the overall amplitude of the association among traits and environmental variables. The square of this correlation is a score test statistic for trait–environment association in a Poisson log-linear model (ter Braak et al., 2017).
The analysis was performed among functional traits and environmental variables (depth and oxygen, but not temperature and salinity being negatively correlated to depth; see Figure S2) separated by period (day/night) to account for the daily movement of species in the water column. For the day period, 33 stations and 143 species were included in the analysis, and for the night period, 29 stations and 145 species were considered. To address multiple comparisons, the conservative Holm method was employed (Holm, 1979), which adjusts the p-values of each test using a threshold. Global hypothesis test model 6 was conducted, which consists of the simultaneous testing of model 2 (permutation of abundances among stations) and model 4 (permutation of abundances among species). Two permutation tests (n = 9,999) considering model 2 and model 4 were computed. Model 2 tests H0, assuming that environmental conditions do not influence species distribution with fixed traits. Model 4 tests H0, assuming that species traits do not influence the species composition of samples with fixed environmental conditions. The FCA used the “ade4” (Kleyer et al., 2012) R package (R Core Team, 2022).
A total of 7,190 individuals were collected from 62 sampling stations using trawling techniques during both day and night. These individuals represented 200 different species, belonging to 131 genera and 57 families (Table S1). Detailed results related to gamma diversity according to sampling depth layers and periods (day/night) are included in Table 3. Accumulation curves of species richness (gamma diversity) are provided in Figure S3. These latter highlighted that both observed (when rarefied to a common sampling effort) and estimated total species richness are higher in the lower mesopelagic layer (Figure S3).
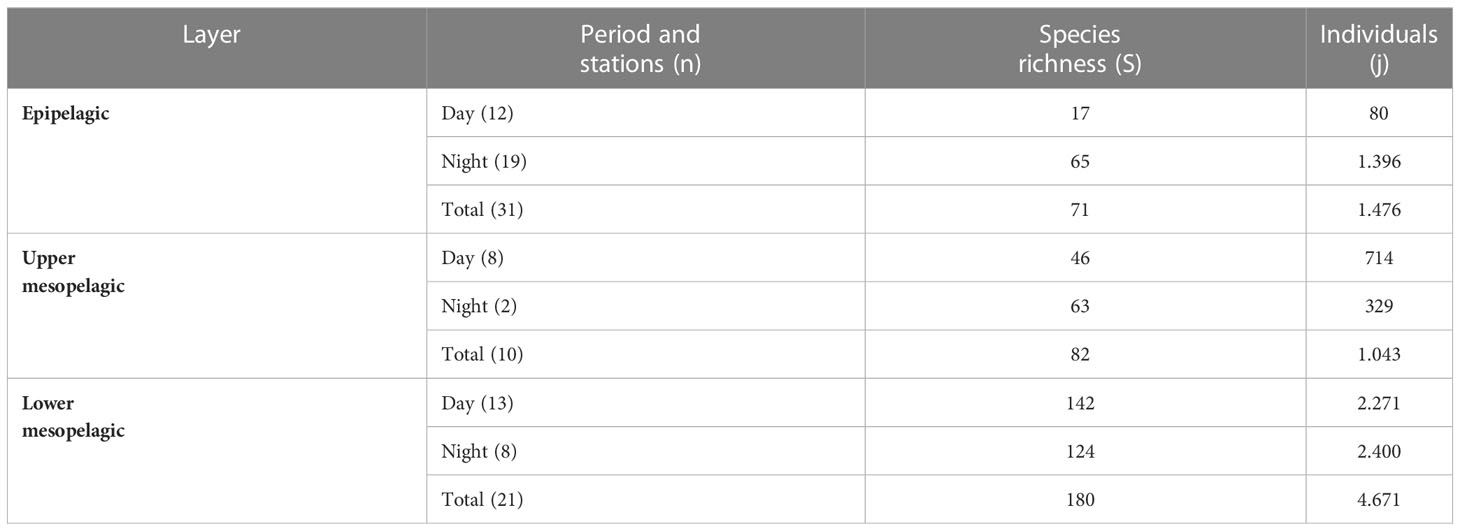
Table 3 Fish community features collected within each oceanographic layer and time period (day, night, and total (day + night)).
Functional diversity was calculated for 184 out of the 200 species, as trait values were lacking for 16 of them (see Data Analyses section). Species were distributed across 47 stations (see above Data Analyses section), including 19 in the epipelagic layer, 7 in the upper mesopelagic layer, and 21 in the lower mesopelagic layer. The FEs were arranged into 134 groups. The largest group, FE1, was composed of seven species (Benthosema suborbitale, Ceratoscopelus warmingii, Diogenichthys atlanticus, Hygophum hygomii, Hygophum macrochir, Hygophum reinhardtii, and Hygophum taaningi). Additionally, two FEs comprised five species, one FE with four species, 10 FEs with three species, and 13 EFs with two species, totaling 77 species distributed in the FEs. No trait values were shared among 107 species (79.85%), thus having no functional redundancy with another species. The family Stomiidae exhibited the highest number of species with unique combinations of traits (n = 15). Likewise, the Myctophidae and Stomiidae encompassed a great number of FE with 10 and eight FEs, respectively.
As previously mentioned, we have identified 134 FEs based on precise combinations of trait values, among which 107 FEs had each only one species, and only 27 FEs had more than two species. Furthermore, the functional over-redundancy FOr index showed low values; each layer had mean values of 0.1, 0.074, and 0.09 for the epipelagic, upper mesopelagic, and lower mesopelagic zones, respectively. In addition, we found low mean values of functional redundancy FRed index of 1.23, 1.1, and, 1.26, for these three zones, respectively. To complement this analysis and provide a broader assessment of species’ functional roles, we also conducted a hierarchical clustering analysis of functional traits. This analysis identified 10 major functional groups of species (Figure 2), which allowed us to better understand the interplay between species and their functional roles within their ecosystem. This dual approach provides a more comprehensive understanding of species complementarity and redundancy.
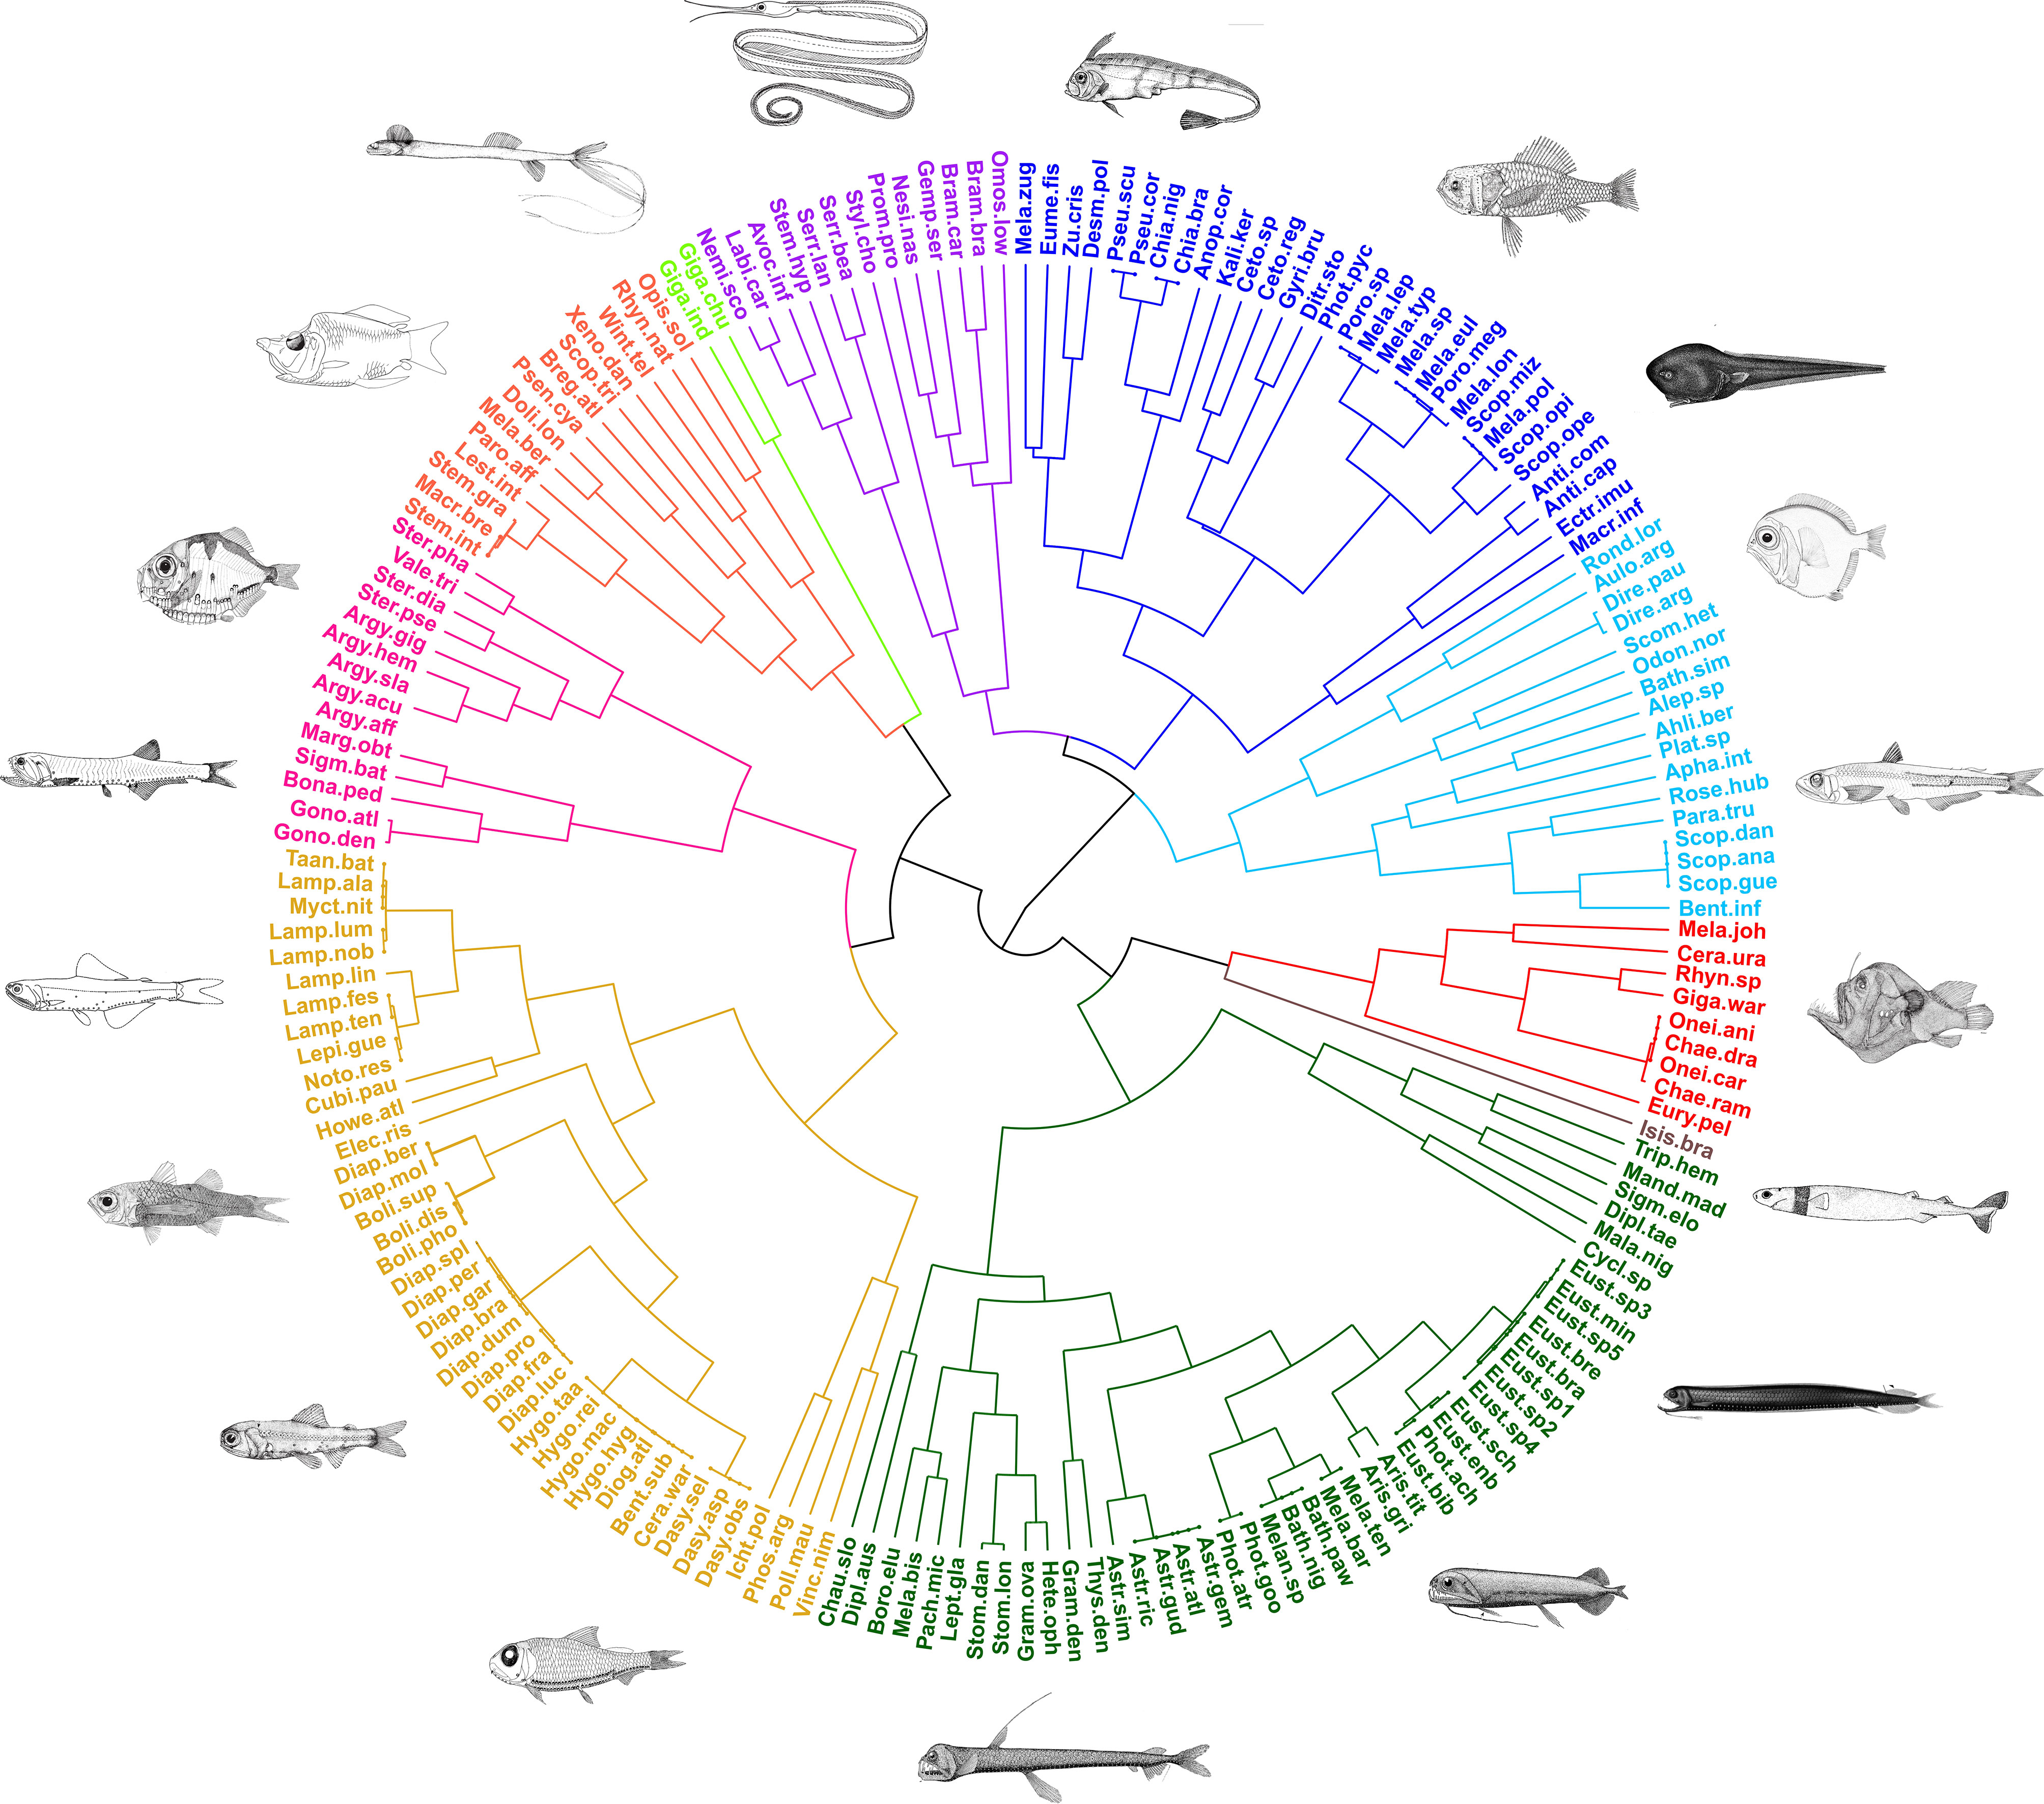
Figure 2 Hierarchical clustering of species defined based on their pairwise functional distances and groups identified according to the Gap stat criterion for optimal group partitioning (fish images adapted from Sutton et al., 2020).
These 10 major groups are the following:
The largest group encompassed a total of 45 species, primarily composed of species belonging to the Stomiidae (86.36%). Key traits displayed by these species include a sagittiform body shape, black or dark-bicolor coloration, light emission, counter-illumination, lure apparatus, spherical eyes, and micronektonivorous feeding habits. Group 1 notably contains the highest number of species exhibiting unique trait combinations (21 species) and eight FEs.
The second largest group, comprising 40 species, predominantly consisted of species of the Myctophidae (34 species), also including similar species of the Phosichthyidae (4), Nomeidae (1), and Howellidae (1). Species in this group exhibited characteristics such as relatively small overall size, vertical migration, zooplanktivorous feeding habits, large spherical eyes, counter-illumination, prey illumination, and dark-bicolor coloration. Group 2 had the highest number of FEs (10).
The third largest group, encompassing 30 species, primarily included members from the Melamphaidae (11), Chiasmodontidae (5), and Cetomimidae (4) families. These species were mainly characterized by moderate to small spherical eyes and the lack of bioluminescence (except for Pseudoscopelus). This group accounted for five FEs.
This group comprised 17 species, encompassing all members of the Scopelarchidae (five species) as well as 11 species of other families. Species in this group were primarily characterized by bicolored light or silvery coloration, large eyes, and piscivorous habits. Interestingly, this group was composed of just one FE, which includes Scopelarchus analis, Scopelarchus guentheri, and Scopelarchoides danae.
This group consisted of 14 species and one FE. It encompassed all nine species of the Sternoptychidae found in our samples, along with five species of the Gonostomatidae. Species in this group displayed counter-illumination, zooplanktivorous feeding habits, and relatively short total body lengths. Most of the Sternoptychidae species exhibited a silvery color and a compressed body shape.
This group also consisted of 14 species and one FE. Group 6 predominantly featured species from families of the order Argentiniformes: Opisthoproctidae (three species), Bathylagidae (two species), and Microstomatidae (one species). Moreover, six additional families were part of this group. Most species in Group 6 exhibited relatively short body lengths, lack of bioluminescence, forked caudal fins, and zooplanktivorous feeding habits.
This group consisted of 13 species distributed across six families. Six species in this group belong to the order Anguilliformes (three Serrivomeridae and three Nemichthyidae). Most species in Group 7 displayed a filiform body shape, pointed caudal fins, spherical eyes, lack of bioluminescence, silvery coloration, and vertical migration patterns. No FE was identified in this group.
This group consisted of nine species from five families. Except for Eurypharynx pelecanoides (Anguiliformes), all species in this group were Lophiiformes. They were characterized by the presence of lure appendages, black coloration, globiform or sagittiform body shapes, and micronektonivorous habits. This group accounted for one FE.
Composed of only two and one species, respectively. Group 9 included two species of the Giganturidae (Gigantura chuni and Gigantura indica), characterized by sagittiform body shape, tubular eyes, and generalist feeding habits. Group 10 consisted of Isistius brasiliensis, the single elasmobranch species collected in our samples, characterized by a sagittiform body shape, spherical eyes, and piscivorous feeding habits. No FEs were identified in both groups.
In terms of functional space, overlaps were observed among depth layers and time periods (gamma-diversity, Figure 3). Nonetheless, the volume of the convex hull occupied by species was substantially greater in the lower mesopelagic layer (alpha mean FRic = 0.58 ± 0.28) compared to the epipelagic layer (alpha mean FRic = 0.19 ± 0.15) and the upper mesopelagic layer (alpha mean FRic = 0.38 ± 0.32, Figure 4). This indicates a broader mean functional range for mesopelagic fish species in assemblages of deeper waters.
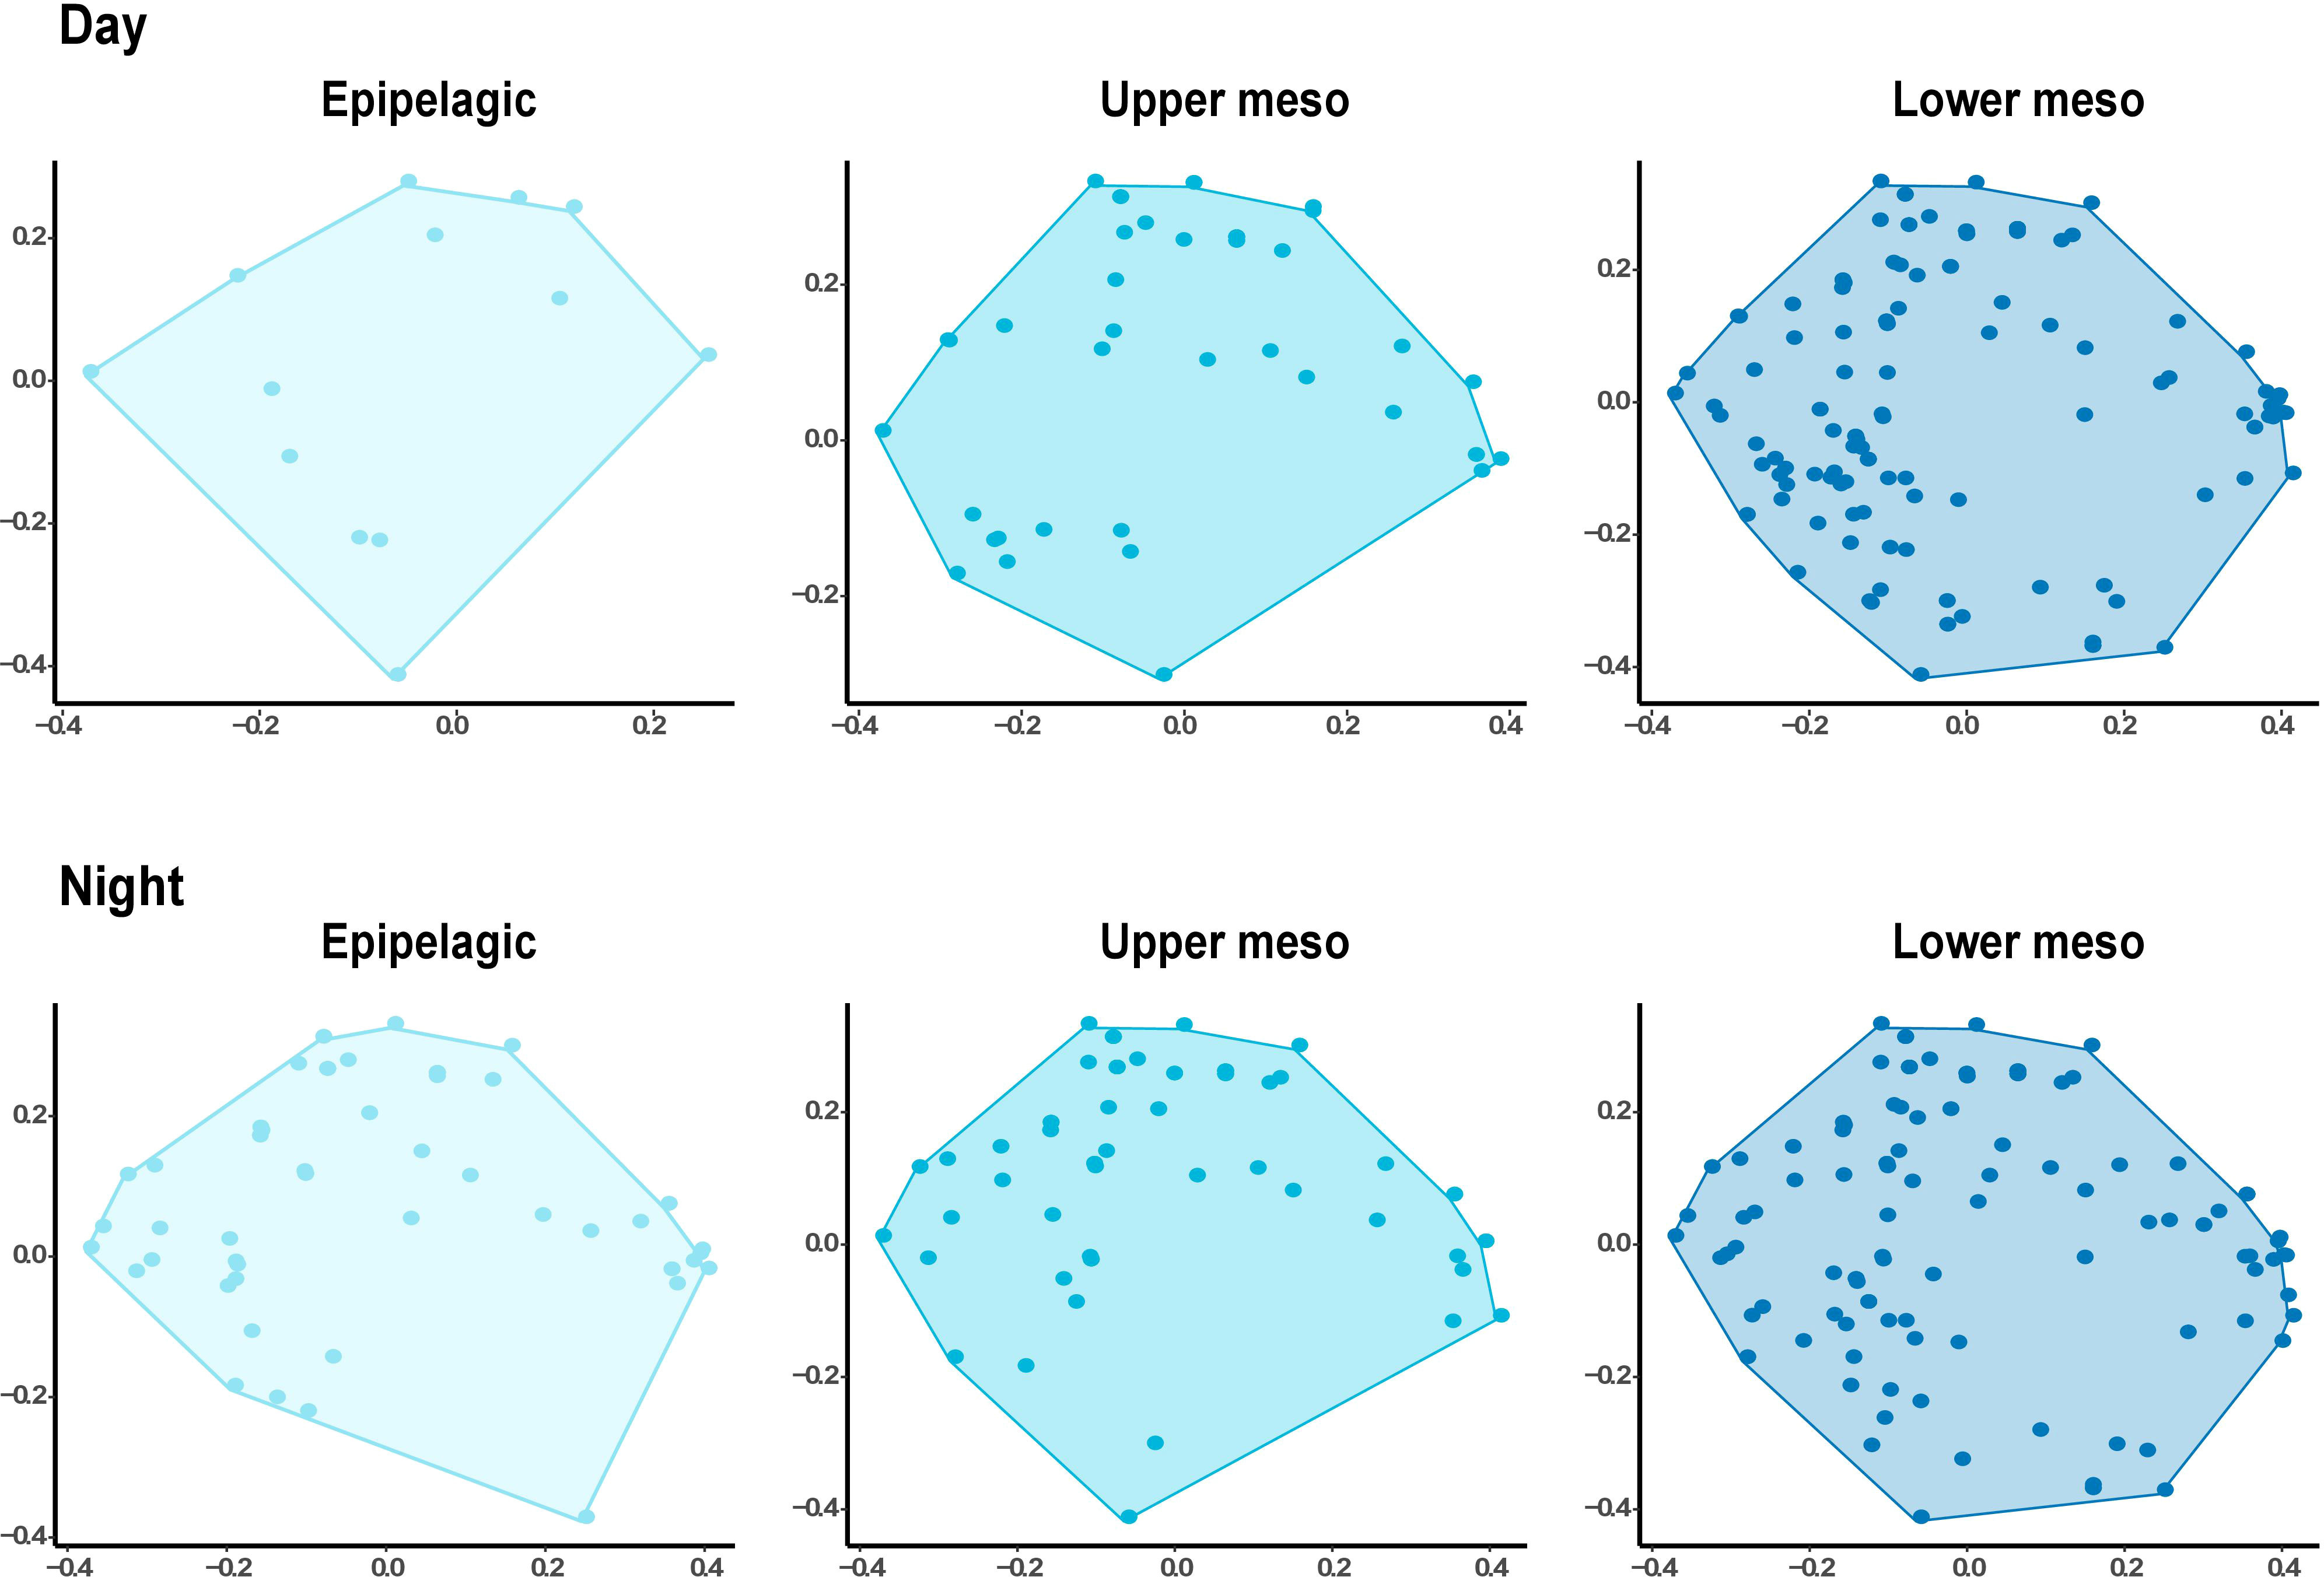
Figure 3 Comparison of functional space in 2-D from each oceanographic layer. The gray dashed line represents the global functional space (i.e., all layers combined). PCoA (Principal Coordinates Analysis) was computed on functional trait values (number of species = 184). Barplots present the mean values with standard deviations (values provided in Table 4) of each functional diversity index (see definitions in Table 2) for each oceanographic layer.
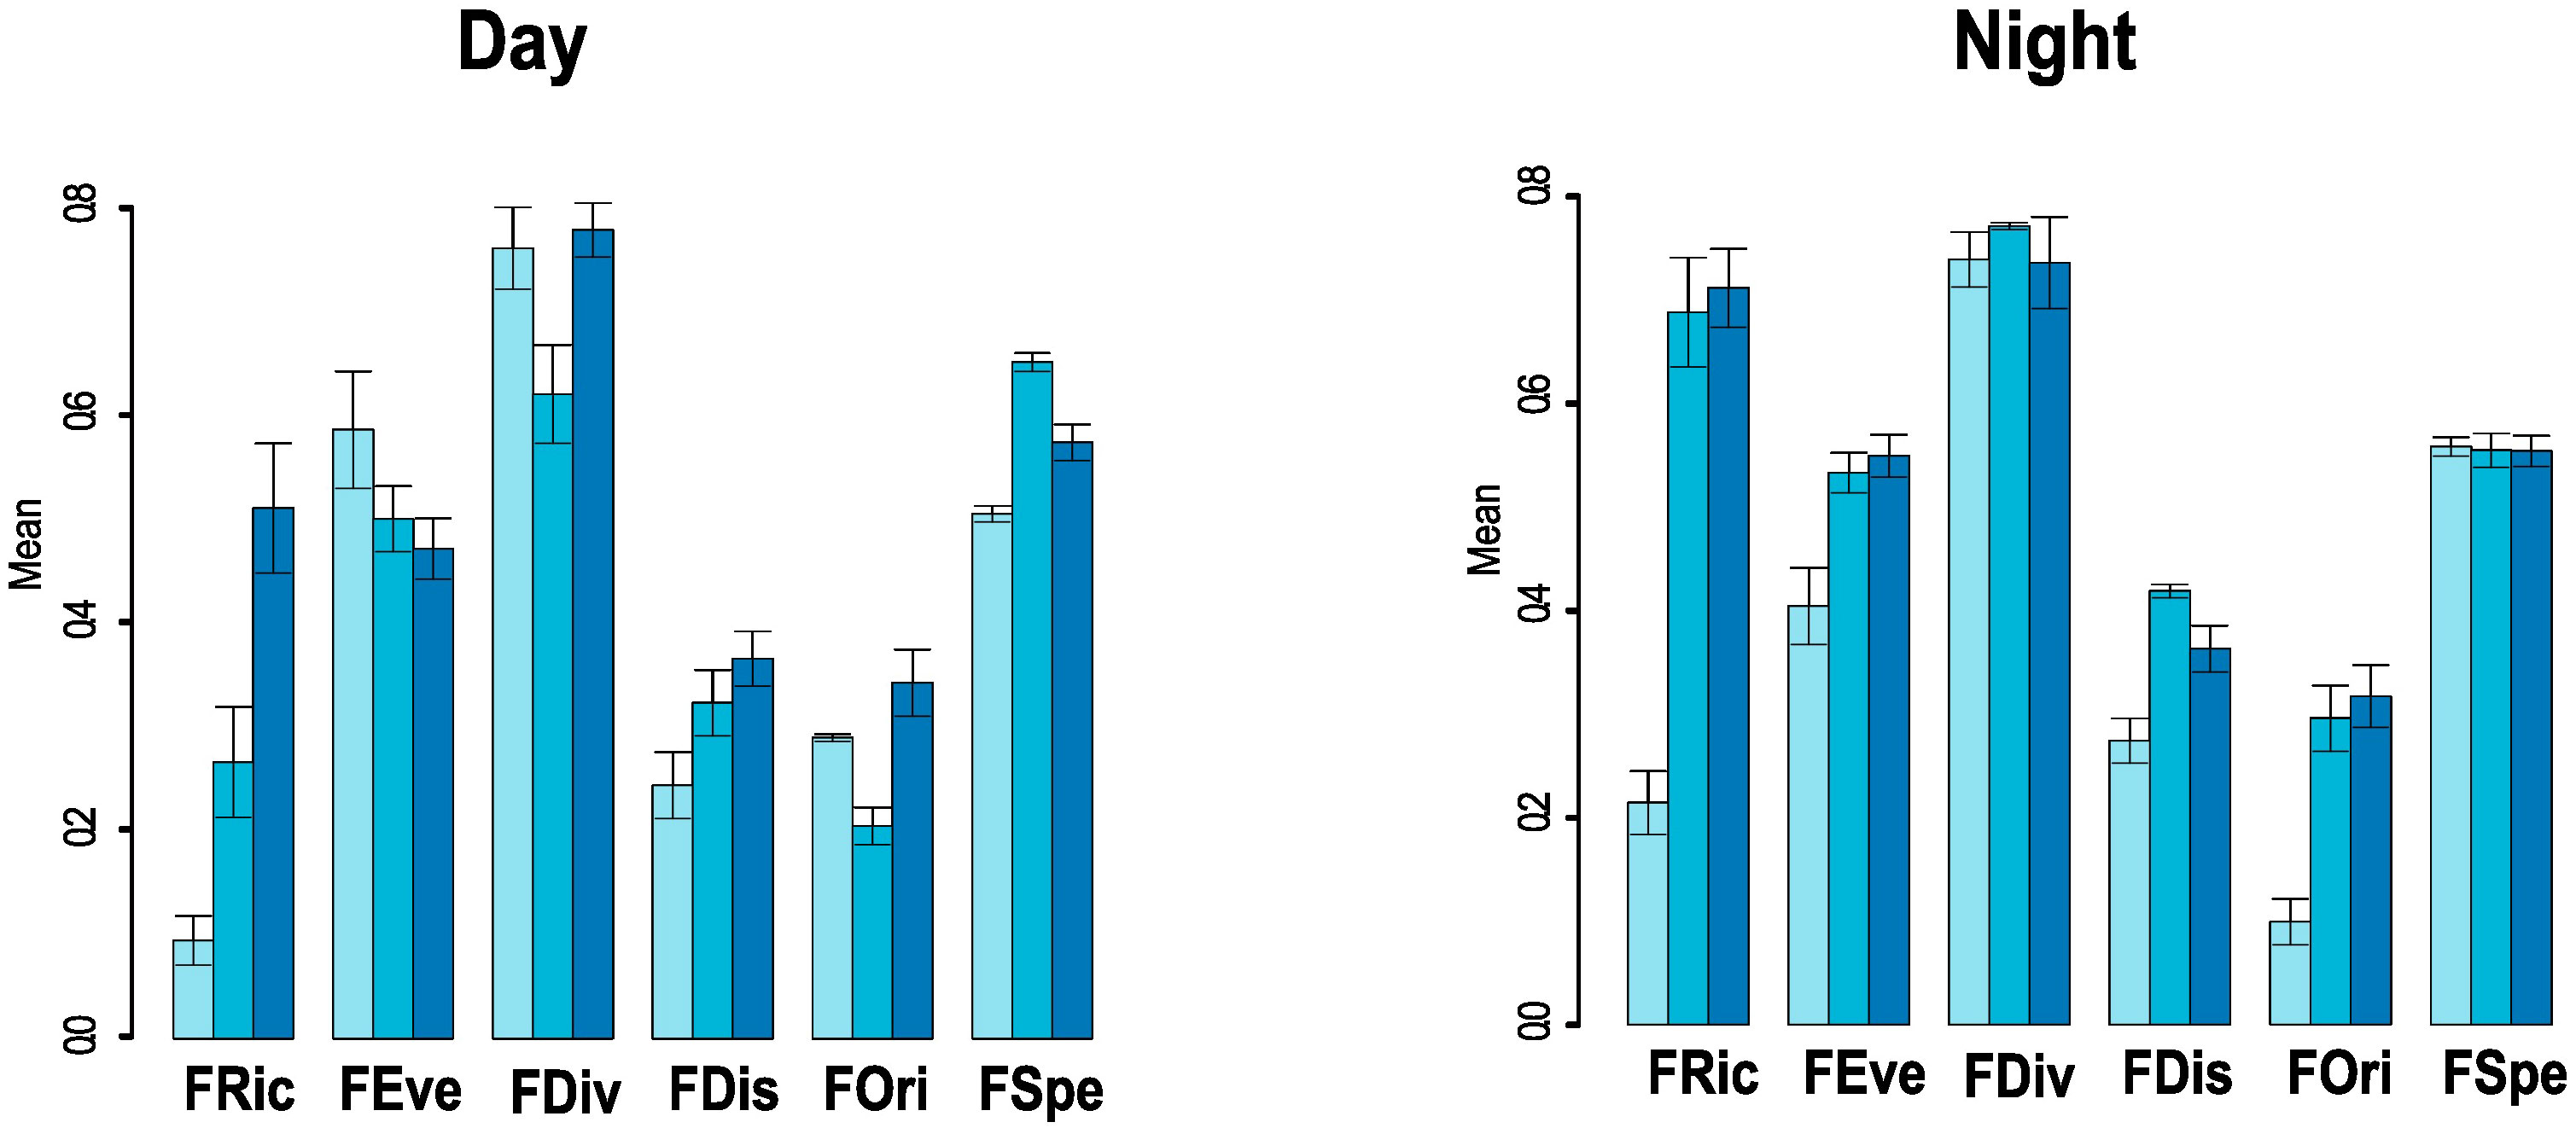
Figure 4 Barplots present the mean values with standard deviations (values provided in Table 4) of each functional diversity index (see definitions in Table 2) for each oceanographic layer. PCoA, Principal Coordinates Analysis.
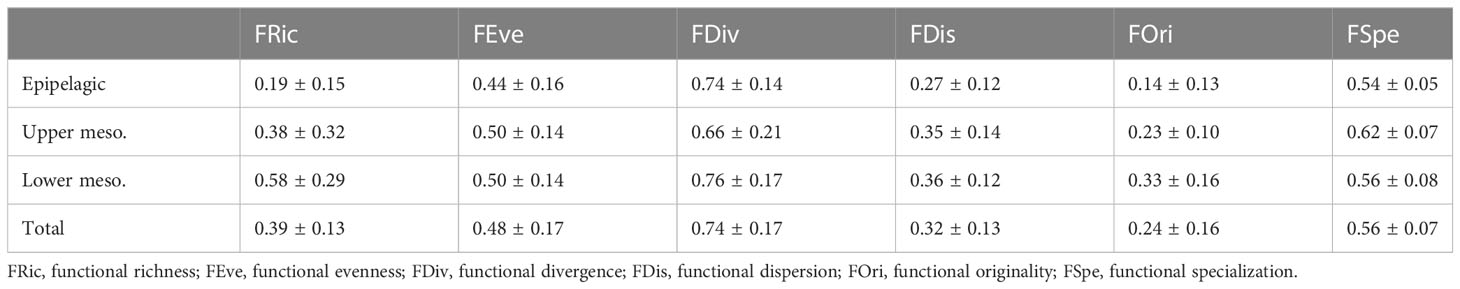
Table 4 Mean and standard deviation values of the complementary functional indices (see Table 2) by oceanographic layer.
In both periods, FRic values were higher in the lower mesopelagic layer, although there was little difference in functional space in the upper mesopelagic layer during the night, with an average of 0.68 ± 0.05 in this layer and 0.70 ± 0.03 in the lower mesopelagic layer (Figure 4; Table S3). In FEve (Figure S4), the epipelagic layer obtained the highest uniformity, with an average of 0.58 ± 0.06 during the day, but this value decreased to 0.40 ± 0.03 during the night (Figure 4; Table S3).
FDiv (Figure S5) reached 417, the highest means value in both periods (Figure 4; Table S3), with a peak in the upper mesopelagic layer at night with 0.76 ± 0.00. However, this layer had the lowest mean value during the day at 0.61 ± 0.04. FDis (Figure S6) showed the highest mean value at the upper mesopelagic layer during the night, with 0.41 ± 0.00 (Figure 4; Table S3). During the day, the lower mesopelagic layer had the highest mean value among the other layers (Figure 4; Table S3).
Likewise, all layers presented relatively low values of FOri; however, during the night period, the mean values between the upper meso- and lower mesopelagic layers approached each other, with values of 0.29 ± 0.03 and 0.31 ± 0.02 (Figure 4; Table S3, Figure S7), respectively. The seven species contributed the most to this index (contribution > 6% obtained with the mFD package from individual species contribution to the overall index value) were Malacosteus niger (8.8%), Melanonus zugmayeri (8.5%), E. pelecanoides (7.9%), Eumecichthys fiski (7.1%), Platytroctidae sp. (7.0%), Chauliodus sloani (6.9%), and Melanocetus johnsonii (6.5%).
Regarding FSpe, the mean values were equal between the layers during the night period, at approximately 0.55 ± 0.01 for all layers, highlighting a moderate average distance of a species to the other species within the functional space (Figure S8). The analysis of the contribution of individual species to the FSpe index revealed that M. johnsonii (45%) contributed the most to this index. Additionally, important contributions (≥40%) were made by three species of the Stomiiformes (Heterophotus ophistoma, 42%; Melanostomias biseriatus, 42%; Grammatostomias ovatus, 41%, one species of Gadiformes (M. zugmayeri, 42%), and three species of Lophiiformes (Oneirodes carlsbergi, 40%; Oneirodes anisacanthus, 40%; Chaenophryne draco, 40%). These results indicate that species of Lophiiformes, including M. johnsonii, which stood out in both indices, played a crucial role in functional specialization and originality.
GAMs, fitting the variation of each index (alpha diversity values) in the function of explanatory variables and their interactions (see raw relationships in Figure S2), revealed that the influence of these variables explained between 40.4% and 83.1% of the deviance, depending on the indices (Table 5). Generally, depth proved to be a crucial variable for functional diversity indices, being significant in four out of the six investigated indices (see Figure 5 for variables having a significant effect, as well as Figure S9 for all graphs of each variable included in the GAMs).
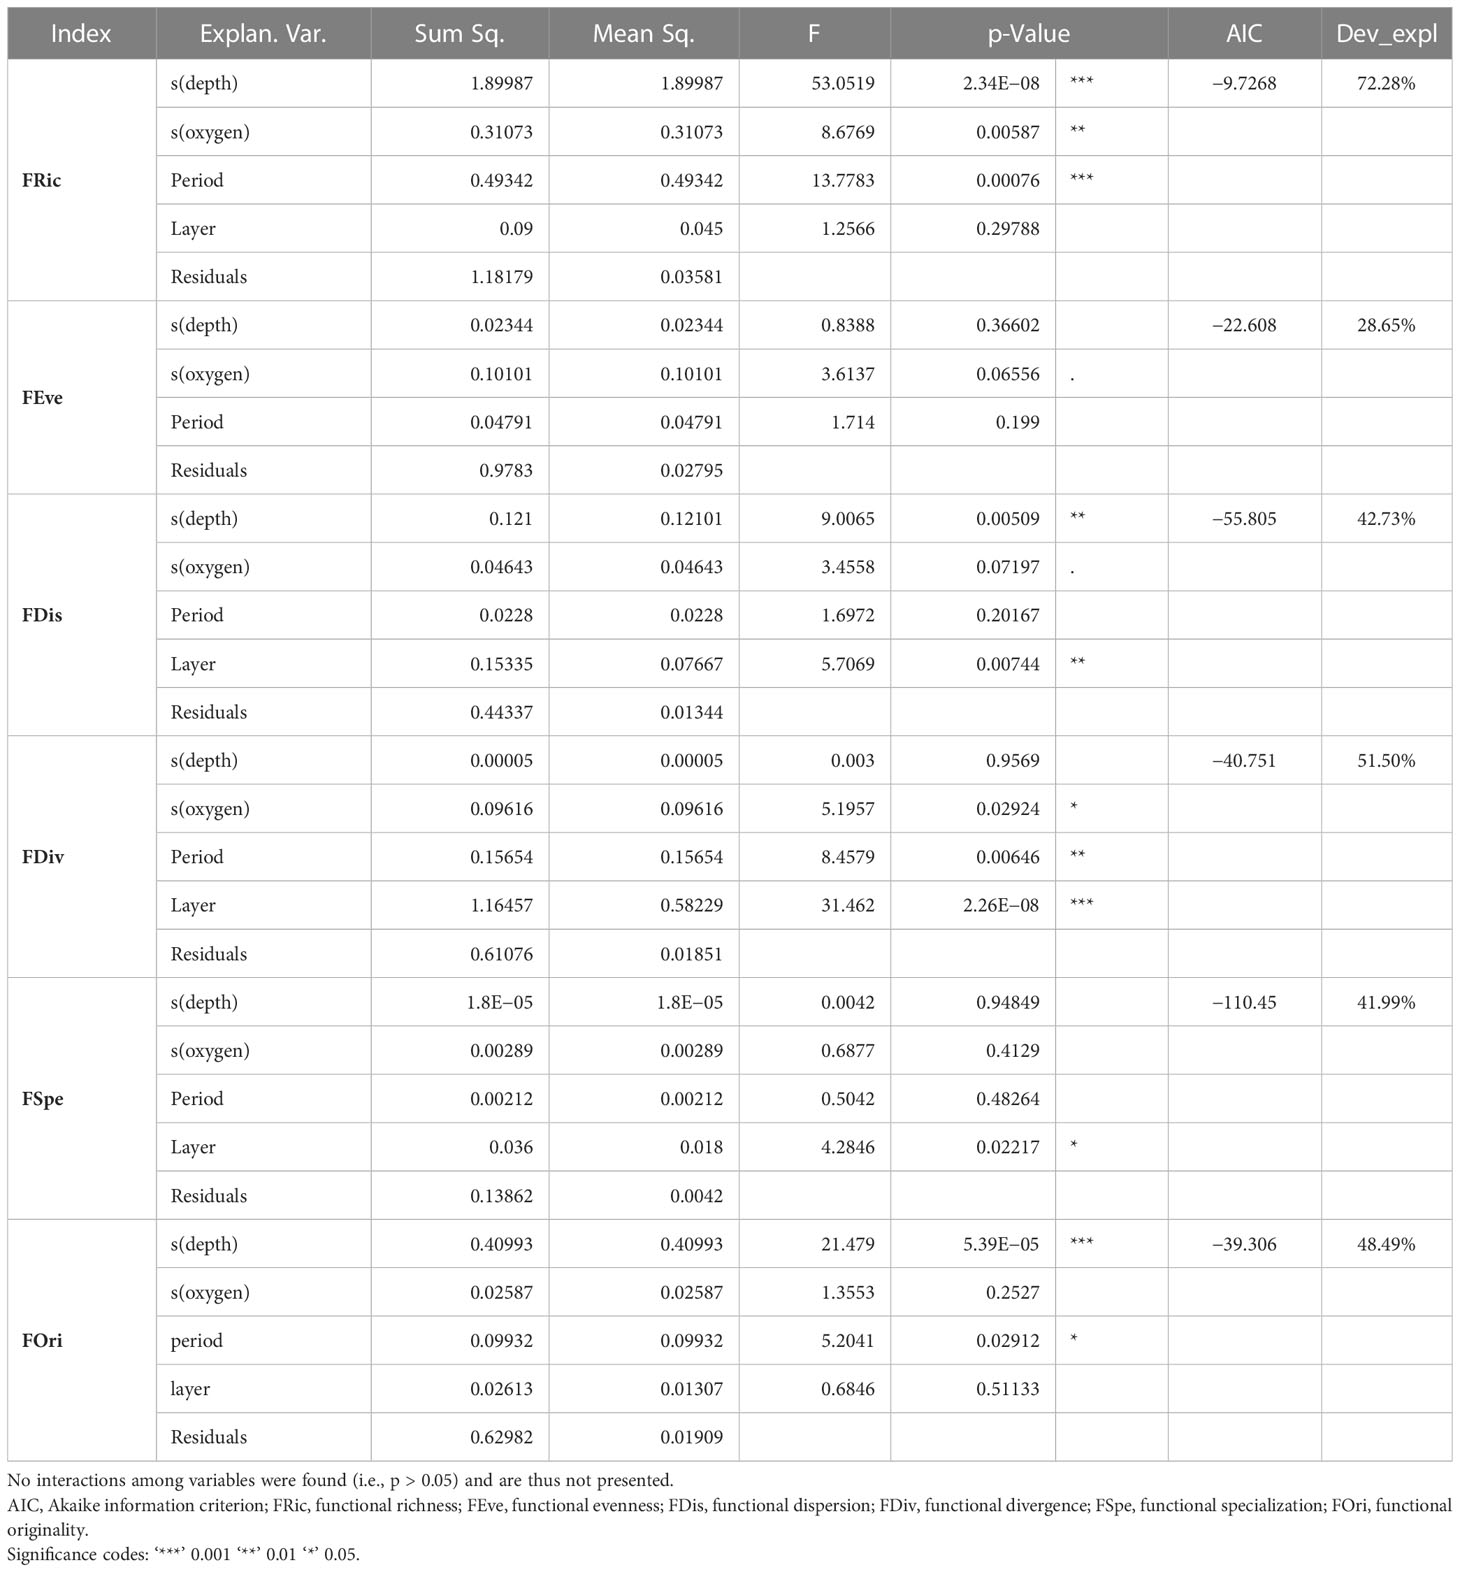
Table 5 Generalized additive models (GAMs) with Gaussian function on the relationships among functional diversity indices (Table 2) and explanatory variables.
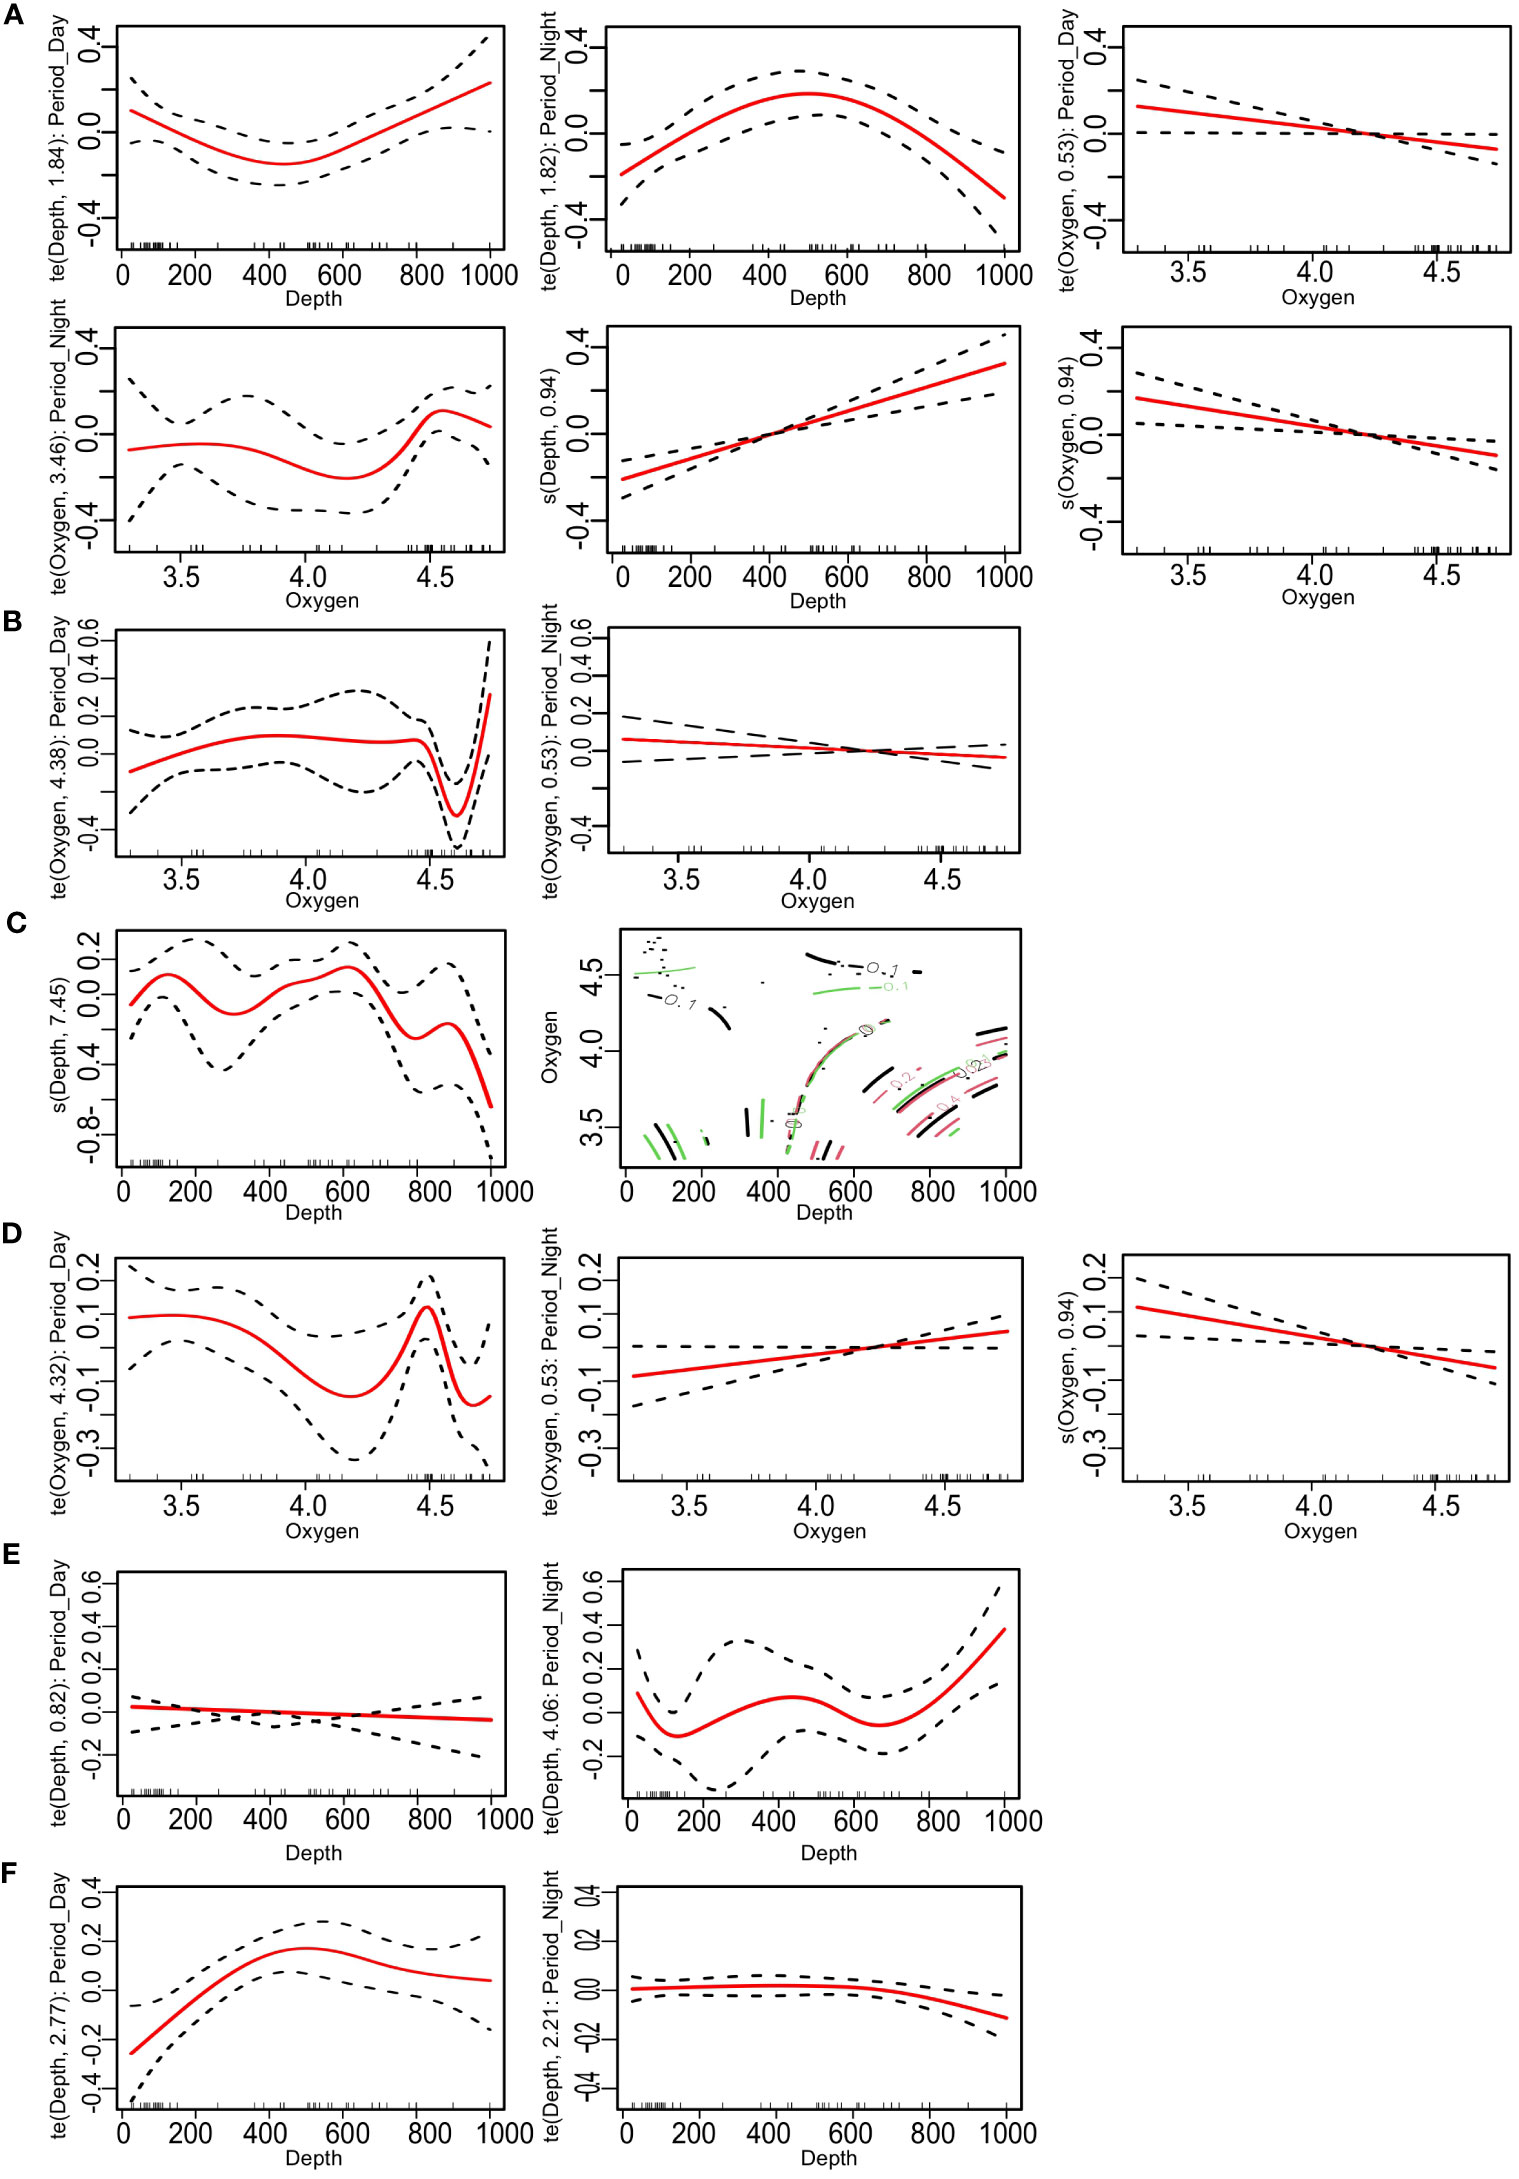
Figure 5 Generalized additive model (GAM) plots showing associations among functional diversity index (Table 2) and environmental variables (depth, oxygen, depth, time period, and oceanographic layer) with 95% confidence intervals. (A) FRic. (B) FEve. (C) FDis. (D) FDiv. (E) FSpe. (F) FOri. FRic, functional richness; FEve, functional evenness; FDis, functional dispersion; FDiv, functional divergence; FSpe, functional specialization; FOri, functional originality.
FRic exhibited the largest number of significant relationships (Table 5), with notable inverse relationships with depth according to day and night periods. Indeed, during the day, FRic increased with depth, while at night, there was a peak between 400 and 600 m and then a decrease (Figure 5A). In terms of the relationship with oxygen, FRic decreased with depth during the day, but at night, there was a peak at 4.5 dissolved oxygen, followed by a slight decrease (Figure 5A).
Concerning FEve, only a significant relationship with oxygen during the day was observed (Figure 5B; Table 5), with a sharp decrease at 4.5 dissolved oxygen before a rapid increase. Regarding FDiv, depth and the interaction between oxygen and depth were significant (Table 5). FDiv decreased with depth and had different mean values according to depth and the level of dissolved oxygen (Figure 5C). It notably reached an intermediate value of 0.4 at approximately 750–900-m depth and 3.4–3.7 of dissolved oxygen (red line at the bottom right of the interaction plot; Figure 5C).
FDis exhibited opposite trends with dissolved oxygen, depending on the period considered, with a peak at 4.5 dissolved oxygen during the day, while a slight increase occurred at night (Figure 5D; Table 5). Regarding FOri, the interaction between depth and night was significant (Table 5), increasing with depth (Figure 5E; Table 5). Finally, for FSpe, the interaction between depth and day was significant (Table 5), with an increase of FSpe up to 500 m and then a slight decrease (Figure 5F).
The FCA showed positive correlations among some traits and depth according to the period (day and night) considered (Figure S10). The data collected during the day revealed that depth positively correlated with lure apparatus structure, non-migratory behavior, teeth type 01 (long, slender, sharp), and skin color black (Figure S10). During the night, no significant correlations were found between functional traits and environmental variables (Figure S10).
Our study presents the first assessment of the FD of the mesopelagic fish community across contrasted environmental conditions. Examining the vertical gradient from the surface to 1,000-m depth, we discovered differences in niche occupancy across depth and period (day/night) and high functional diversity of fish in the deepest assemblages. We also observed low sharing of functional traits among species, indicating a wide range of unique trait combinations among major functional entities and groups. Likewise, assemblages of the different depth layers displayed low functional redundancy and over-redundancy among species. Overall, these results indicate that species play complementary functional roles. Our findings suggest that for mesopelagic fish communities, relatively high taxonomic species richness is not a proxy of functional redundancy and related insurance to buffer functions in case of species loss. Finally, we also offer insights into the relationships between traits and environmental factors. Here, we discuss these main results and the implications of our findings in the studied area.
The functional diversity analysis showed high functional diversity, with at least 10 major functional groups identified. Generally, the primary groups exhibit low functional redundancy, indicating that species perform a wide array of functions and ecological roles within the ecosystem. Furthermore, 107 species exhibited a unique composition of functional traits, emphasizing a significant potential for providing distinct contributions to ecosystem functioning. In addition, the functional diversity indices, computed at the station level (alpha diversity), were relatively high for the deepest assemblages, suggesting a higher degree of specialization among the species considered, and a wider range of functions performed by mesopelagic fishes. Furthermore, our analyses took into account the day and nighttime periods and thus the migration, partial, or non-migration behaviors of species, which can explain some patterns discussed below.
Indeed, regarding more specifically the indices analyzed, the alpha mean values of most indices were slightly to highly superior in the upper and lower mesopelagic layers than in the epipelagic layer, except for FEve (day) and FSpe (night). Lower mean alpha values of FEve were observed in the epipelagic layer compared to other layers, indicating potentially more efficient resource use by species with particular traits (Schleuter et al., 2010) during nighttime for species making vertical migration. Moreover, there was an increase in the mean alpha value of FEve during the day, where a regular distribution of species in the niche space and complementary resource use by species is observed that should be associated with the migration behavior of species. The high mean alpha values of FDiv in all analyzed situations (depth strata and time periods) suggest a high degree of niche partitioning (Mason et al., 2005). Furthermore, in all situations, FOri was higher in the lower mesopelagic layer, indicating that species in this depth strata, for those that did not migrate until this layer, are more isolated from each other from a functional point of view. It may indicate lower competition among species with a similar set of trait values in this layer (Brandl et al., 2016). However, we observed an increase in this index in the upper mesopelagic layer during the night period, for which the mean value of FOri became near one of the lower mesopelagic layers. Compared to the three layers, the epipelagic layer exhibits higher functional redundancy, except during the day period, which could potentially lead to higher community resilience (Rice et al., 2013), where only a few species were found, such as Bramma spp., Gempylus serpens, and Zu cristatus. This could be due to the higher migration of species with similar functional features during nighttime at the epipelagic layer. Finally, the mean alpha values of functional specialization (FSpe) found in the mesopelagic community, in particular during the day, may indicate greater ecological stability of the overall assemblages during that timea period, but also greater species vulnerability to environmental changes.
When comparing different depths, the mean alpha functional richness index (FRic) was found to be higher in the lower depths (Figure 4), along with a higher number of species (Figure S3). Eduardo et al. (2022) also observed higher species richness in the lower mesopelagic waters, while Martinez et al. (2021) noted an increase in morphological disparity of deep-sea fish, suggesting the deep sea as a potential hotspot for fish evolution. Tuset et al. (2014) also highlighted a depth effect on the morphospace established from morphological features of mesopelagic fishes. Gluchowska et al. (2017) similarly noted that depth-related variables are crucial in structuring the functional diversity of zooplankton assemblages, with mesopelagic assemblages being more diverse and uniformly distributed than epipelagic ones. Likewise, Mindel et al. (2016) found that for abyssal fishes (1,000–4,000 m), while abundance decreases with depth, there is an increase in functional diversity, with more distinct traits found in deeper layers, probably also because resources are scarcer. Overall, it highlights that the relationship between depth and functional diversity may depend on the type and features of the ecosystem studied.
This study found a significant correlation among depth (salinity and temperature being correlated with depth), teeth type 1 (long, slender, and sharp), the presence of a lure apparatus structure, non-migration behavior, and black skin color, but only during the day period (Figure S10). Interestingly, the family Stomiidae predominantly has these traits, especially for teeth type 1 (77.5% of species), the presence of a luring apparatus (70% of species), and black skin (41.1% of species).
Teeth type 1 enables these fish to easily hold and pierce prey, which, when combined with a wide jaw opening of some species (e.g., M. niger and E. pelecanoides), increases the likelihood of capturing prey. The black color, in contrast, provides effective camouflage, allowing these species to blend into their dark environment and evade predators or sneak up on prey. It also minimizes bioluminescent reflections, reducing detection by organisms using bioluminescence for communication or hunting. For example, some species found in the lower mesopelagic layer exhibit a coloration recently defined as ultra-black (e.g., Eustomias spp. and Melamphaes spp.), which absorbs most light and make them formidable hunters (Davis et al., 2020b), knowing also that some species have many photophores and silver body.
The presence of lure apparatus and non-migratory behavior related to depth are also notable examples of characteristics associated with species inhabiting deeper waters (other species of Stomiiformes with lure apparatus in the inferior mouth occurred in the upper layer). The non-migratory behavior may be related to preventing species in deeper strata from expending energy to move. While this might limit feeding opportunities, this appears to be counterbalanced by ambush-feeding strategies employed by certain species, such as anglefishes, which utilize bioluminescent lures to attract their prey. These lure apparatuses imitate the bioluminescence of their prey’s food sources or conspecifics, enticing unsuspecting prey toward them and facilitating easier capture (Widder, 2010).
In addition to the traits that exhibit a significant correlation with depth, mesopelagic fishes present other important adaptations that allow them to explore and use deep environments that are important to be mentioned. For example, in some bristlemouths (Gonostomatidae), the eyes are small, yet the relative pupil diameter and aphakic gap are large. This adaptation substantially improves retinal illumination for peripheral targets in low-light environments, such as the mesopelagic zone (Davis et al., 2020a). Moreover, certain species possess multiple rhodopsin genes, which encode the protein crucial for vision in low-light conditions. For instance, Diretmus argenteus has 38 copies of the rhodopsin gene and two other distinct opsins (Turner et al., 2009). This enables the detection of bioluminescence wavelengths, suggesting an advantage in food capture and predator evasion tactics. However, such traits were not correlated with any specific layer, likely due to the movement of species between various layers.
The first underlying hypothesis suggested by the observed patterns is that deeper and more stable environments led to more species specialization and thus encompass more different and functional complementary species as we quantified (Table S3; Figures 3, 4, S4–8). Indeed, environmental gradients play an important role in morphological evolution, impacting the nature and pattern of trait variation in organisms (Conover and Schultz, 1995; Goldberg and Lande, 2006; Mullen and Hoekstra, 2008; Juarez et al., 2019). Notably, depth-related factors like light, temperature, and oxygen can act as a barrier for some mesopelagic fishes, for which displacement represents a higher energetic expenditure (Robison, 2004). Some other species can inhabit areas with reduced oxygen levels (Olivar et al., 2017; Assunção et al., 2023). They may use these less oxygenated layers as protection from predators or as an energy-saving strategy during the day, leaving this zone at night. It is also known that environmental heterogeneity generates diversifying selection, so if there are no constraints on the ecological niche evolution, the breadth of adaptation should evolve to match the amount of environmental variation (Via and Lande, 1985). Therefore, ecological specialists should occur more in environments that are relatively homogeneous in space and time, such as in deep zones, whereas ecological generalists should occur more in environments that are heterogeneous in either dimension (Kassen, 2002).
In stable environments where photosynthetic primary production is absent, species specialization can also be an evolutionary advantage (Kassen, 2002). For instance, specialization is one of the primary mechanisms allowing sympatric species to coexist through the division of resources. Lanternfishes (Myctophidae) and hatchet fishes (Sternoptychidae), the two most abundant mesopelagic fish families in our samples, differ in their prey composition, space occupation, and morphology, displaying high specialization and multidimensional niche partitioning (Tuset et al., 2018; Eduardo et al., 2020b; Eduardo et al., 2021).
A second and linked underlying hypothesis suggested by the observed diversity patterns is a “limiting similarity” among species (MacArthur and Levins, 1967), presented in the Introduction section. While environmental filtering may contribute to structuring the fish communities studied (Figure 5; Table 5), our results supported a predominance of the limiting similarity hypothesis. Concurrently, competition theory (Schoener, 1974; Abrams, 1992) could also be an evolutionary process, where shorter trophic chains and fewer alternative resources available may reduce interspecific dietary overlap, leading to greater adaptation and specialization in deep environments. In these areas, where photosynthetic food availability is lower, adaptation and species specialization could minimize competition and functional similarity. Such specialization may, therefore, increase functional diversity, as demonstrated for some coral reef fish (Bender and Luiz, 2019).
Furthermore, environmental stability for mesopelagic fishes can vary across the bathymetric layers. On the one hand, environmental conditions in the epipelagic zone are affected by factors such as solar radiation, wind, and nutrient availability, which can vary on a daily or seasonal basis, leading to fluctuations in temperature, salinity, and nutrient concentrations. On the other hand, the mesopelagic zone is more stable in terms of temperature and salinity, as it is less influenced by surface-related factors (Priede, 2017).
The relationship between environmental variables and functional diversity indices provides insights into possible changes that may occur in functional space due to environmental variations. Our results showed that the variations in the functional diversity of fishes are partly related to environmental variables (Figures 5, S9; Table 5). Therefore, if oceanographic processes and the period of year cause the mesopelagic environment to move closer to the surface, species with unique traits could be exposed to increased anthropogenic interaction, resulting in potential changes to the mesopelagic fish community.
The preservation and management of the deep environment are of particular concern, as human interest in this zone is increasing in different areas worldwide, with potential impacts from fisheries (Hidalgo and Browman, 2019), deep-sea mining, plastic pollution (Drazen et al., 2020; Ferreira et al., 2022; Justino et al., 2022), and climate change (warming, deoxygenation, and acidification, Ramirez-Llodra et al., 2011; Barry et al., 2013). Notably, while the study area is a well-oxygenated zone when compared to other mesopelagic areas in the world (Priede, 2017), the expansion of oxygen minimum zones (Gilly et al., 2013) could be of particular concern. If mesopelagic species are adapted to the stability of deep-sea waters, disturbances may threaten mesopelagic communities. Regarding the mesopelagic fish communities off north-western Brazil, we have highlighted a relatively low sharing of functional trait values among species, with more than half of them having unique trait combinations. It emphasizes a considerable potential for providing distinct species contributions to ecosystem functioning. However, it also underlines the relative functional uniqueness of species and thus the potential vulnerability of fish communities facing threats in cases where some species decrease in abundance or even disappear. Overall, this calls for particular attention to dedicated and accurate management measures for mesopelagic fish communities in the studied area.
The raw data supporting the conclusions of this article will be made available by the authors, without undue reservation.
All methods were approved and conducted in accordance with regulations of the Brazilian Ministry of Environment (SISBIO authorization number: 47270–5). Operations of the RV Antea were approved by the Brazilian Navy Authority (“Estado-Maior da Armada”) under the Ordinances 178 (9 August 2015) and 4 (24 January 2017).
KCA, BM, TF, and LE contributed to the conceptualization, methodology, and writing of the original draft preparation. KCA, LE, MMM, RL, and MFM collected the biological data (individual samples and species traits). KCA performed data analyses and visualization. All authors contributed to the provided work. All authors contributed to the article and approved the submitted version.
This study is a contribution to the LMI TAPIOCA, program CAPES/COFECUB (88881.142689/2017-01), EU H2020 TRIATLAS project (grant agreement 817578). The Ph.D. grant of KCA was provided by the Ministry of Education scholarship (Brazilian federal government). Research grant to MMM was provided by CNPq (“Conselho Nacional de Desenvolvimento Científico e Tecnologico”; 314644/2020-2).
We acknowledge the French oceanographic fleet for funding the at-sea survey ABRACOS 1 and 2 and the officers and crew of the RV Antea for their contribution to the success of the operations. The present study could not have been done without the work of all participants from the BIOIMPACT Laboratory (Recife, Brazil).
The authors declare that the research was conducted in the absence of any commercial or financial relationships that could be construed as a potential conflict of interest.
All claims expressed in this article are solely those of the authors and do not necessarily represent those of their affiliated organizations, or those of the publisher, the editors and the reviewers. Any product that may be evaluated in this article, or claim that may be made by its manufacturer, is not guaranteed or endorsed by the publisher.
The Supplementary Material for this article can be found online at: https://www.frontiersin.org/articles/10.3389/fmars.2023.1117806/full#supplementary-material
Abrams P. (1983). The theory of limiting similarity. Annu. Rev. Ecol. Systematics 14, 359–376. doi: 10.1146/annurev.es.14.110183.002043
Abrams P. A. (1992). Why don’t predators have positive effects on prey populations? Evol. Ecol. 6, 449–457. doi: 10.1007/BF02270691
Assunção R. V., Silva A. C., Roy A., Bourlès B., Silva C. H. S., Ternon J.-F., et al. (2020). 3D characterisation of the thermohaline structure in the southwestern tropical Atlantic derived from functional data analysis of in situ profiles. Prog. Oceanography 187, 102399. doi: 10.1016/j.pocean.2020.102399
Assunção R., Lebourges-Dhaussy A., Silva A. C., Roudaut G., Ariza A., Eduardo L. N., et al. (2023). Fine-scale vertical relationships between environmental conditions and sound scattering layers in the Southwestern Tropical Atlantic. PLoS ONE 18 (8), e0284953. doi: 10.1371/journal.pone.0284953
Barry J., Mol A. P., Zito A. R. (2013). Climate change ethics, rights, and policies: an introduction. Environmental Politics 22 (3), 361–376. doi: 10.1080/09644016.2013.788861
Bender M. G., Luiz O. J. (2019). Specialization boosts reef fish functional diversity. Nat. Ecol. Evol. 3, 153–154. doi: 10.1038/s41559-018-0760-7
Bertrand A., Ballón M., Chaigneau A. (2010). Acoustic observation of living organisms reveals the upper limit of the oxygen minimum zone. PloS One 5, e10330. doi: 10.1371/journal.pone.0010330
Boswell K. M., D’Elia M., Johnston M. W., Mohan J. A., Warren J. D., Wells R. J. D., et al. (2020). Oceanographic structure and light levels drive patterns of sound scattering layers in a low-latitude oceanic system. Front. Mar. Sci. 7. doi: 10.3389/fmars.2020.00051
Braak C.J.F.t., Peres-Neto P., Dray S. (2017). A critical issue in model-based inference for studying trait-based community assembly and a solution. PeerJ 5, e2885. doi: 10.7717/peerj.2885
Brandl S. J., Emslie M. J., Ceccarelli D. M., Richards Z. T. (2016). Habitat degradation increases functional originality in highly diverse coral reef fish assemblages. Ecosphere 7, e01557. doi: 10.1002/ecs2.1557
CBD (2014). Ecologically or Biologically Significant Marine Areas (EBSAs). Special Places in the World’s Oceans, 2nd ed (Secretariat of the Convention on Biological Diversity, Recife).
Conover D. O., Schultz E. T. (1995). Phenotypic similarity and the evolutionary significance of countergradient variation. Trends Ecol. Evol. 10, 248–252. doi: 10.1016/S0169-5347(00)89081-3
Cornwell W. K., Schwilk D. W., Ackerly D. D. (2006). A trait-based test for habitat filtering: convex hull volume. Ecology 87, 1465–1471. doi: 10.1890/0012-9658(2006)87[1465:ATTFHF]2.0.CO;2
Davis A. L., Sutton T. T., Kier W. M., Johnsen S. (2020a). Evidence that eye-facing photophores serve as a reference for counterillumination in an order of deep-sea fishes. Proc. R. Soc. B: Biol. Sci. 287, 20192918. doi: 10.1098/rspb.2019.2918
Davis A. L., Thomas K. N., Goetz F. E., Robison B. H., Johnsen S., Osborn K. J. (2020b). Ultra-black camouflage in deep-sea fishes. Curr. Biol. 30, 3470–3476.e3. doi: 10.1016/j.cub.2020.06.044
Davison P., Asch R. G. (2011). Plastic ingestion by mesopelagic fishes in the North Pacific Subtropical Gyre. Mar. Ecol. Prog. Ser. 432, 173–180. doi: 10.3354/meps09142
Dee L. E., Miller S. J., Peavey L. E., Bradley D., Gentry R. R., Startz R., et al. (2016). Functional diversity of catch mitigates negative effects of temperature variability on fisheries yields. Proc. R. Soc. B: Biol. Sci. 283, 20161435. doi: 10.1098/rspb.2016.1435
Devictor V., Clavel J., Julliard R., Lavergne S., Mouillot D., Thuiller W., et al. (2010). Defining and measuring ecological specialization. J. Appl. Ecol. 47, 15–25. doi: 10.1111/j.1365-2664.2009.01744.x
Dossa A. N., Silva A. C., Chaigneau A., Eldin G., Araujo M., Bertrand A. (2021). Near-surface western boundary circulation off Northeast Brazil. Prog. Oceanography 190, 102475. doi: 10.1016/j.pocean.2020.102475
Dray S., Legendre P. (2008). Testing the species traits–environment relationships: the fourth-corner problem revisited. Ecology 89, 3400–3412. doi: 10.1890/08-0349.1
Drazen J. C., Smith C. R., Gjerde K. M., Haddock S. H., Carter G. S., Choy C. A., et al. (2020). Midwater ecosystems must be considered when evaluating environmental risks of deep-sea mining. Proc. Natl. Acad. Sci. 117, 17455–17460. doi: 10.1073/pnas.2011914117
Eduardo L. N., Bertrand A., Mincarone M. M., Santos Silva L. V., Frédou T., Assunção R. V., et al. (2020b). Hatchetfishes (Stomiiformes: Sternoptychidae) biodiversity, trophic ecology, vertical niche partitioning and functional roles in the western tropical Atlantic. Prog. Oceanogr. 186, 102389. doi: 10.1016/j.pocean.2020.102389
Eduardo L. N., Bertrand A., Lucena-Frédou F., Villarins B. T., Martins J. R., Afonso G. V. F., et al. (2022). Rich and underreported: First integrated assessment of the diversity of mesopelagic fishes in the Southwestern Tropical Atlantic. Front. Mar. Sci. 9. doi: 10.3389/fmars.2022.937154
Eduardo L. N., Bertrand A., Mincarone M. M., Martins J. R., Frédou T., Assunção R. V., et al. (2021). Distribution, vertical migration, and trophic ecology of lanternfishes (Myctophidae) in the Southwestern Tropical Atlantic. Prog. Oceanography 199, 102695. doi: 10.1016/j.pocean.2021.102695
Eduardo L. N., Lucena-Frédou F., Lanco Bertrand S., Lira A. S., Mincarone M. M., Nunes G. T., et al. (2023). From the light blue sky to the dark deep sea: Trophic and resource partitioning between epipelagic and mesopelagic layers in a tropical oceanic ecosystem. Sci. Total Environ. 878, 163098. doi: 10.1016/j.scitotenv.2023.163098
Ferreira G. V. B., Justino A. K. S., Eduardo L. N., Lenoble V., Fauvelle V., Schmidt N., et al. (2022). Plastic in the inferno: Microplastic contamination in deep-sea cephalopods (Vampyroteuthis infernalis and Abralia veranyi) from the southwestern Atlantic. Mar. pollut. Bull. 174, 113309. doi: 10.1016/j.marpolbul.2021.113309
Fock H. O., Pusch C., Ehrich S. (2004). Structure of deep-sea pelagic fish assemblages in relation to the Mid-Atlantic Ridge (45°–50°N). Deep Sea Res. Part I: Oceanographic Res. Papers 51, 953–978. doi: 10.1016/j.dsr.2004.03.004
Gause G. F. (1932). Experimental studies on the struggle for existence: I. Mixed population of two species of yeast. J. Exp. Biol. 9 (4), 389–402.
Gagic V., Bartomeus I., Jonsson T., Taylor A., Winqvist C., Fischer C., et al. (2015). Functional identity and diversity of animals predict ecosystem functioning better than species-based indices. Proc. R. Soc. B: Biol. Sci. 282, 20142620. doi: 10.1098/rspb.2014.2620
Gilly W. F., Beman J. M., Litvin S. Y., Robison B. H. (2013). Oceanographic and biological effects of shoaling of the oxygen minimum zone. Annu. Rev. Mar. Sci. 5, 393–420. doi: 10.1146/annurev-marine-120710-100849
Gjøsæter J., Kawaguchi K. (1980). A review of the world resources of mesopelagic fish. FAO Fish. Tech. Pap. 193, 1–151.
Gloeckler K., Choy C. A., Hannides C. C. S., Close H. G., Goetze E., Popp B. N., et al. (2018). Stable isotope analysis of micronekton around Hawaii reveals suspended particles are an important nutritional source in the lower mesopelagic and upper bathypelagic zones. Limnology Oceanography 63, 1168–1180. doi: 10.1002/lno.10762
Gluchowska M., Trudnowska E., Goszczko I., Kubiszyn A. M., Blachowiak-Samolyk K., Walczowski W., et al. (2017). Variations in the structural and functional diversity of zooplankton over vertical and horizontal environmental gradients en route to the Arctic Ocean through the Fram Strait. PloS One 12, e0171715. doi: 10.1371/journal.pone.0171715
Goldberg E., Lande R. (2006). Ecological and reproductive character displacement of an environmental gradient. Evolution 60, 1344–1357. doi: 10.1111/j.0014-3820.2006.tb01214.x
Hidalgo M., Browman H. I. (2019). Developing the knowledge base needed to sustainably manage mesopelagic resources. ICES J. Mar. Sci. 76, 609–615. doi: 10.1093/icesjms/fsz067
Holm S. (1979). A simple sequentially rejective multiple test procedure. Scandinavian J. Stat 6, 65–70.
Johnson T. F., Isaac N. J. B., Paviolo A., González-Suárez M. (2021). Handling missing values in trait data. Global Ecol. Biogeography 30, 51–62. doi: 10.1111/geb.13185
Juarez B. H., Speiser D. I., Oakley T. H. (2019). Context-dependent evolution of ostracod morphology along the ecogeographical gradient of ocean depth. Evolution 73, 1213–1225. doi: 10.1111/evo.13748
Justino A. K. S., Ferreira G. V. B., Schmidt N., Eduardo L. N., Fauvelle V., Lenoble V., et al. (2022). The role of mesopelagic fishes as microplastics vectors across the deep-sea layers from the Southwestern Tropical Atlantic. Environ. pollut. 300, 118988. doi: 10.1016/j.envpol.2022.118988
Kassen R. (2002). The experimental evolution of specialists, generalists, and the maintenance of diversity. J. Evolutionary Biol. 15, 173–190. doi: 10.1046/j.1420-9101.2002.00377.x
Kleyer M., Dray S., Bello F., Lepš J., Pakeman R. J., Strauss B., et al. (2012). Assessing species and community functional responses to environmental gradients: which multivariate methods? J. Vegetation Sci. 23, 805–821. doi: 10.1111/j.1654-1103.2012.01402.x
Kraft N. J. B., Adler P. B., Godoy O., James E. C., Fuller S., Levine J. M. (2015). Community assembly, coexistence and the environmental filtering metaphor. Funct. Ecol. 29, 592–599. doi: 10.1111/1365-2435.12345
Laliberté E., Legendre P. (2010). A distance-based framework for measuring functional diversity from multiple traits. Ecology 91, 299–305. doi: 10.1890/08-2244.1
Lechêne A., Lobry J., Boët P., Laffaille P. (2018). Change in fish functional diversity and assembly rules in the course of tidal marsh restoration. PloS One 13, e0209025. doi: 10.1371/journal.pone.0209025
Lefcheck J. S., Duffy J. E. (2015). Multitrophic functional diversity predicts ecosystem functioning in experimental assemblages of estuarine consumers. Ecology 96, 2973–2983. doi: 10.1890/14-1977.1
Legendre P., Galzin R., Harmelin-Vivien M. L. (1997). Relating behavior to habitat: solutions to thefourth-corner problem. Ecology 78, 547–562. doi: 10.1890/0012-9658(1997)078[0547:RBTHST]2.0.CO;2
Levin L. A., Baker M., Thompson A. (2019). Deep-ocean climate change impacts on habitats, fish and fisheries (Rome: Food and Agriculture Organisation (FAO) of the United Nations).
MacArthur R. H. (1958). Population ecology of some warblers of northeastern coniferous forests. Ecology 39, 599–619. doi: 10.2307/1931600
MacArthur R., Levins R. (1967). The limiting similarity, convergence, and divergence of coexisting species. Am. Nat. 101 (921), 377–385. doi: 10.1086/282505
Magneville C., Loiseau N., Albouy C., Casajus N., Claverie T., Escalas A., et al. (2022). mFD: an R package to compute and illustrate the multiple facets of functional diversity. Ecography 2022, 1–15. doi: 10.1111/ecog.05904
Maire E., Grenouillet G., Brosse S., Villéger S. (2015). How many dimensions are needed to accurately assess functional diversity? A pragmatic approach for assessing the quality of functional spaces. Global Ecol. Biogeography 24, 728–740. doi: 10.1111/geb.12299
Martinez C. M., Friedman S. T., Corn K. A., Larouche O., Price S. A., Wainwright P. C. (2021). The deep sea is a hot spot of fish body shape evolution. Ecol. Lett. 24, 1788–1799. doi: 10.1111/ele.13785
Mason N. W. H., Mouillot D., Lee W. G., Wilson J. B. (2005). Functional richness, functional evenness and functional divergence: the primary components of functional diversity. Oikos 111, 112–118. doi: 10.1111/j.0030-1299.2005.13886.x
McGill B. J., Enquist B. J., Weiher E., Westoby M. (2006). Rebuilding community ecology from functional traits. Trends Ecol. Evol. 21, 178–185. doi: 10.1016/j.tree.2006.02.002
Mindel B. L., Neat F. C., Trueman C. N., Webb T. J., Blanchard J. L. (2016). Functional, size and taxonomic diversity of fish along a depth gradient in the deep sea. PeerJ 4, e2387. doi: 10.7717/peerj.2387
Mouillot D., Albouy C., Guilhaumon F., Lasram F. B. R., Coll M., Devictor V., et al. (2011). Protected and threatened components of fish biodiversity in the Mediterranean Sea. Curr. Biol. 21, 1044–1050. doi: 10.1016/j.cub.2011.05.005
Mouillot D., Bellwood D. R., Baraloto C., Chave J., Galzin R., Harmelin-Vivien M., et al. (2013a). Rare species support vulnerable functions in high-diversity ecosystems. PloS Biol. 11, e1001569. doi: 10.1371/journal.pbio.1001569
Mouillot D., Graham N. A. J., Villéger S., Mason N. W. H., Bellwood D. R. (2013b). A functional approach reveals community responses to disturbances. Trends Ecol. Evol. 28 (3), 167–177. doi: 10.1016/j.tree.2012.10.004
Mouillot D., Villéger S., Parravicini V., Kulbicki M., Arias-González J. E., Bender M., et al. (2014). Functional over-redundancy and high functional vulnerability in global fish faunas on tropical reefs. Proc. Natl. Acad. Sci. U.S.A. 111, 13757–13762. doi: 10.1073/pnas.1317625111
Mullen L. M., Hoekstra H. E. (2008). Natural selection along an environmental gradient: A classic cline in mouse pigmentation. Evolution 62, 1555–1570. doi: 10.1111/j.1558-5646.2008.00425.x
Naeem S. (2006). Biodiversity and ecosystem functioning in restored ecosystems: extracting principles for a synthetic perspective. Foundations Restor. Ecol., 210–237.
Olivar M. P., Hulley P. A., Castellón A., Emelianov M., López C., Tuset V. M., et al. (2017). Mesopelagic fishes across the tropical and equatorial Atlantic: Biogeographical and vertical patterns. Prog. Oceanography 151, 116–137. doi: 10.1016/j.pocean.2016.12.001
Pietsch T. W. (1976). Dimorphism, parasitism and sex: reproductive strategies among deepsea ceratioid anglerfishes. Copeia 1976, 781–793. doi: 10.2307/1443462
Priede I. G. (2017). Deep-sea fishes: biology, diversity, ecology and fisheries (New York: Cambridge University Press).
Proud R., Cox M. J., Brierley A. S. (2017). Biogeography of the global ocean’s mesopelagic zone. Curr. Biol. 27, 113–119. doi: 10.1016/j.cub.2016.11.003
R Core Team (2022) A language and environment for statistical computing. Available at: http://www.R-project.org.
Ramirez-Llodra E., Tyler P. A., Baker M. C., Bergstad O. A., Clark M. R., Escobar E., et al. (2011). Man and the last great wilderness: human impact on the deep sea. PLoS One 6 (8), e22588. doi: 10.1371/journal.pone.0022588
Rice J., Daan N., Gislason H., Pope J. (2013). Does functional redundancy stabilize fish communities? ICES J. Mar. Sci. 70, 734–742. doi: 10.1093/icesjms/fst071
Robison B. H. (2004). Deep pelagic biology. J. Exp. Mar. Biol. Ecol. 300, 253–272. doi: 10.1016/j.jembe.2004.01.012
Schleuter D., Daufresne M., Massol F., Argillier C. (2010). A user’s guide to functional diversity indices. Ecol. Monogr. 80, 469–484. doi: 10.1890/08-2225.1
Schmitz O. J., Sylvén M., Atwood T. B., Bakker E. S., Berzaghi F., Brodie J. F., et al. (2023). Trophic rewilding can expand natural climate solutions. Nature Climate Change 13 (4), 324–333. doi: 10.1038/s41558-023-01631-6
Schoener T. W. (1974). Resource Partitioning in Ecological Communities: Research on how similar species divide resources helps reveal the natural regulation of species diversity. Science 185, 27–39. doi: 10.1126/science.185.4145.27
Silva A., Chaigneau A., Dossa A., Eldin G., Araujo M., Bertrand A. (2021). Surface circulation and vertical structure of upper ocean variability around fernando de noronha archipelago and rocas atoll during spring 2015 and fall 2017. Front. Mar. Sci. 8. doi: 10.3389/fmars.2021.598101
Sutton T. T. (2013). Vertical ecology of the pelagic ocean: classical patterns and new perspectives. J. fish Biol. 83, 1508–1527. doi: 10.1111/jfb.12263
Sutton T. T., Hulley P. A., Wienerroither R., Zaera-Perez D., Paxton J. R. (2020). Identification guide to the mesopelagic fishes of the central and south east Atlantic Ocean. FAO Species Identification Guide for Fishery Purposes. Rome, FAO. 2020. doi: 10.4060/cb0365en
Tchamabi C. C., Araujo M., Silva M., Bourlès B. (2017). A study of the Brazilian Fernando de Noronha island and Rocas atoll wakes in the tropical Atlantic. Ocean Model. 111, 9–18. doi: 10.1016/j.ocemod.2016.12.009
ter Braak C. J. F., Cormont A., Dray S. (2012). Improved testing of species traits–environment relationships in the fourth-corner problem. Ecology 93, 1525–1526. doi: 10.1890/12-0126.1
TibshIrani R., Walther G., Hastie T. (2001). Estimating the number of clusters in a data set via the gap statistic. J. R. Stat. Society: Ser. B (Statistical Methodology) 63, 411–423. doi: 10.1111/1467-9868.00293
Travassos P., Hazin F. H. V., Zagaglia J. R., Advíncula R., Schober J. (1999). Thermohaline structure around seamounts and islands off North-Eastern Brazil. Arch. Fishery Mar. Res. 47, 211–222.
Turner J. R., White E. M., Collins M. A., Partridge J. C., Douglas R. H. (2009). Vision in lanternfish (Myctophidae): Adaptations for viewing bioluminescence in the deep-sea. Deep Sea Res. Part I: Oceanographic Res. Papers 56, 1003–1017. doi: 10.1016/j.dsr.2009.01.007
Tuset V. M., Farré M., Lombarte A., Bordes F., Wienerroither R., Olivar P. (2014). A comparative study of morphospace occupation of mesopelagic fish assemblages from the Canary Islands (North-eastern Atlantic). Ichthyol Res. 61, 152–158. doi: 10.1007/s10228-014-0390-2
Tuset V. M., Olivar M. P., Otero-Ferrer J. L., López-Pérez C., Hulley P. A., Lombarte A. (2018). Morpho-functional diversity in Diaphus spp. (Pisces: Myctophidae) from the central Atlantic Ocean: Ecological and evolutionary implications. Deep Sea Res. Part I: Oceanographic Res. Papers 138, 46–59. doi: 10.1016/j.dsr.2018.07.005
Van Der Valk A. G. (1981). Succession in wetlands: a gleasonian appraoch. Ecology 62, 688–696. doi: 10.2307/1937737
Via S., Lande R. (1985). Genotype-environment interaction and the evolution of phenotypic plasticity. Evolution 39, 505–522. doi: 10.1111/j.1558-5646.1985.tb00391.x
Villéger S., Mason N. W. H., Mouillot D. (2008). New multidimensional functional diversity indices for a multifaceted framework in functional ecology. Ecology 89, 2290–2301. doi: 10.1890/07-1206.1
Villéger S., MIranda J. R., Hernández D. F., Mouillot D. (2010). Contrasting changes in taxonomic vs. functional diversity of tropical fish communities after habitat degradation. Ecol. Appl. 20, 1512–1522. doi: 10.1890/09-1310.1
Sutton T. T., Hulley P. A., Wienerroither R., Zaera-Perez D., Paxton J. R. (2020). Identification guide to the mesopelagic fishes of the central and south east Atlantic Ocean. In FAO Species Identification Guide for Fishery Purposes (Rome: FAO) 2020. doi: 10.4060/cb0365en
Weiher E., Clarke G. D. P., Keddy P. A. (1998). Community assembly rules, morphological dispersion, and the coexistence of plant species. Oikos 81, 309–322. doi: 10.2307/3547051
Widder E. A. (2010). Bioluminescence in the ocean: origins of biological, chemical, and ecological diversity. Science 328, 704–708. doi: 10.1126/science.1174269
Keywords: biodiversity, trait-based approach, functional indices, functional niche, conservation, deep sea, tropical Atlantic
Citation: Aparecido KC, Frédou T, Eduardo LN, Mincarone MM, Lima RS, Morais MFdS and Mérigot B (2023) Living in darkness: functional diversity of mesopelagic fishes in the western tropical Atlantic. Front. Mar. Sci. 10:1117806. doi: 10.3389/fmars.2023.1117806
Received: 06 December 2022; Accepted: 31 July 2023;
Published: 01 September 2023.
Edited by:
Alexandra Anh-Thu Weber, Swiss Federal Institute of Aquatic Science and Technology, SwitzerlandReviewed by:
Victor Manuel Tuset, Instituto de Oceanografía y Cambio Global (IOCAG), SpainCopyright © 2023 Aparecido, Frédou, Eduardo, Mincarone, Lima, Morais and Mérigot. This is an open-access article distributed under the terms of the Creative Commons Attribution License (CC BY). The use, distribution or reproduction in other forums is permitted, provided the original author(s) and the copyright owner(s) are credited and that the original publication in this journal is cited, in accordance with accepted academic practice. No use, distribution or reproduction is permitted which does not comply with these terms.
*Correspondence: Kátia Cristina Aparecido, a2F0eS5jcmlzdGluYUBnbWFpbC5jb20=
Disclaimer: All claims expressed in this article are solely those of the authors and do not necessarily represent those of their affiliated organizations, or those of the publisher, the editors and the reviewers. Any product that may be evaluated in this article or claim that may be made by its manufacturer is not guaranteed or endorsed by the publisher.
Research integrity at Frontiers
Learn more about the work of our research integrity team to safeguard the quality of each article we publish.