 Sheng Lin
 Wen-Zhou Zhang
 Yuntao Wang
 Fei Chai2
94% of researchers rate our articles as excellent or good
Learn more about the work of our research integrity team to safeguard the quality of each article we publish.
Find out more
ORIGINAL RESEARCH article
Front. Mar. Sci., 24 January 2023
Sec. Marine Ecosystem Ecology
Volume 10 - 2023 | https://doi.org/10.3389/fmars.2023.1117301
This article is part of the Research TopicEddy-Current Interactions in the Ocean and their Impacts on Climate, Ecology, and BiologyView all 16 articles
Eddies are ubiquitous mesoscale dynamics in oceans worldwide that prominently influence the upper ocean. Specifically, the presence of preexisting eddies can modulate oceanic responses to passing typhoons, for which the underlying mechanism requires further investigation. In 2013, Typhoon Soulik traveled over 2,000 km in the western North Pacific, encountering multiple eddies, offering a suitable opportunity for investigating the impact of eddies on typhoon-induced upper ocean responses. A coupled ocean-atmosphere model was developed for this event, and the simulations were validated with multiple observations. The surface cold wake after Typhoon Soulik was successfully reproduced by the coupled model, showing a multicore structure, which was due to the preexisting mesoscale cyclonic eddies along the typhoon path. An experimental case excluding eddies was also tested in the numerical model. The comparison between the control and experimental cases revealed that sea surface cooling was enhanced by eddies via the vertical mixing and horizontal advection of eddy-related currents. In particular, vertical mixing enhanced sea surface cooling beneath the typhoon center due to the stronger vertical stratification within the preexisting cyclonic oceanic eddies. The eddy-related current with a horizontal temperature gradient contributed to advection, enhancing sea surface cooling at the cooling center and leading to a rightward-shifted pattern of enhanced sea surface cooling. This study enriches the understanding of the complex upper ocean dynamics under the combined effects of typhoons and eddies.
Tropical cyclones (TCs), as intense atmospheric cyclonic systems, drive strong air-sea interactions (Emanuel, 1986), leading to prominent oceanic responses, i.e., sea surface cooling (e.g., Price, 1981; Ginis, 2002; Lin et al., 2017). TC-induced vertical mixing and transport, e.g., upwelling and downwelling, determine changes in sea surface temperature (SST). In particular, upwelling and downwelling induced by TCs occur underneath the center of a storm and the surrounding region, respectively (Yablonsky and Ginis, 2009; Chiang et al., 2011; Wang, 2020), and they are simultaneously impacted by preexisting environmental conditions, i.e., oceanic geostrophic flows and mesoscale eddies (Jaimes and Shay, 2015). As the most vigorous motion in the ocean, eddies are ubiquitously distributed in oceans worldwide and frequently encounter passing TCs. For example, Ma et al. (2017) found that over 90% of TCs have encountered oceanic mesoscale eddies in the western North Pacific, and the upper ocean responses, e.g., reduction in SST and phytoplankton bloom, to TCs are largely modulated by these eddies (Shay et al., 2000; Lin et al., 2005; Jaimes and Shay, 2010; Ma et al., 2017; Liu and Tang, 2018; Li et al., 2020; Lu et al., 2020; Qiu et al., 2021). Over anticyclonic eddies, downwelling can be predominantly enhanced, leading to a warming response to the TC (Oey et al., 2006; Jaimes and Shay, 2009; Halliwell et al., 2011), while cyclonic eddies (CEs) can influence the intensity and occurrence time of maximum SST cooling (Zheng et al., 2008; Ma et al., 2020).
After the passage of TCs, significant sea surface cooling in CEs often occurs, as shown in both observations and numerical simulations (e.g., Walker et al., 2005; Sun et al., 2010). Preexisting CEs resulted in a relatively unstable thermodynamic structure, making it easy for subsurface cold water to outcrop (Zheng et al., 2008). For example, an oceanic mixed layer cooling of 4.8°C occurs in CEs, in contrast to only 0.1°C in anticyclone eddies (Jaimes et al., 2011). The enhanced cooling in CEs results from the combined effects of upwelling and mixing that overturn the strong vertical thermal gradients and shear (Zheng et al., 2015). The circulation of preexisting CEs can intensify typhoon-induced upwelling (Jan et al., 2011; Xu et al., 2017).
Ning et al. (2019) investigated oceanic responses to a TC with a specific focus on the impact of the CE along its track. Although significant cooling occurred inside the CE, they found that CE-induced horizontal advection weakened sea surface cooling and increased subsurface warming because the eddy transported trapped warmer water westward as it propagated. Due to the limited observational data, they could not quantitatively estimate the respective impact of typhoon-induced mixing and eddy-induced horizontal advection on the surface ocean response to the typhoon. Yablonsky and Ginis (2013) discussed the impact of anticyclonic ocean eddy circulation on hurricane-induced sea surface cooling based on model experiments. They found that an anticyclonic eddy located to the right of the hurricane track in the Northern Hemisphere enhanced sea surface cooling, as the eddy-induced circulation advected the hurricane-induced cold wake. However, the impacts of the cyclonic current and surrounding horizontal temperature gradient on the oceanic responses to TCs were often neglected in previous studies.
On July 12-13, 2013, Typhoon Soulik propagated through the western North Pacific, where it encountered three preexisting CEs and induced a unique multicore structure of sea surface cooling. In this study, we examined the SST response to Typhoon Soulik under the impact of CEs and investigated the underlying mechanisms via a coupled atmosphere-ocean model. Specifically, the effect of eddy-related advection was quantified to assess its importance compared with other processes. The paper is organized as follows: the data and numerical model configuration are introduced in section 2; the results and discussion on the mechanisms of preexisting CEs for generating multicore sea surface cooling by Typhoon Soulik are presented in section 3; and a conclusion is summarized in section 4.
The best track data of the typhoon, including its center location, pressure at sea level, and maximum sustained wind speed at 6-h intervals, were provided by the Joint Typhoon Warning Center (JTWC). SST data were obtained from the Tropical Rain Measuring Mission’s Microwave Imager (TMI), which has a daily temporal resolution and a spatial resolution of 0.25°×0.25°. The microwave measurements applied by TMI SST data are not contaminated by clouds; thus, this product has been widely used in previous studies for assessing the SST response to TCs (e.g., Vincent et al., 2012a; Mei and Pasquero, 2013). Argo profile data, including measurements of temperature and salinity, were obtained from the Coriolis Global Data Acquisition Center of France (Argo, 2000). Sea level anomaly (SLA) data were obtained from the Archiving, Validation, and Interpretation of Satellite Oceanographic (AVISO) and had the same temporal and spatial resolutions as the SST data. The SLA data are based on radar altimeters, which are also not limited to cloud-free regions. The SLA data were used to detect eddies following the methods of Zhang et al. (2018), who modified the algorithm from Chaigneau et al. (2009) and Chelton et al. (2011).
The coupled ocean-atmosphere-wave-sediment transport (COAWST) modeling system (Warner et al., 2008; Warner et al., 2010) was applied with oceanic and atmospheric components of the Regional Ocean Modeling System (ROMS, version 3.7) (Shchepetkin and McWilliams, 2005) and the Weather Research and Forecasting (WRF) model (version 4.0.3) (Skamarock et al., 2008), respectively. The Model Coupling Toolkit was used to transform the variables between the different components in the COAWST modeling system (Larson et al., 2005). In particular, the WRF model transferred sea surface wind stress, latent heat, sensible heat, shortwave radiation and longwave radiation data to the ROMS model. Meanwhile, the WRF model received the SST, which was continuously updated by the ROMS model. The time interval of exchange between the two models was 120 seconds. The COAWST modeling system has been widely used in many studies to investigate air-sea interaction processes during TCs (Zhao and Chan, 2016; Prakash and Pant, 2017; Wu et al., 2018).
The spatial domain for both the WRF and ROMS models was 116°E to 150°E and 9°N to 33°N (Figure 1A), with a horizontal resolution of 0.05×° 05°. Thirty-six and 40 vertical sigma levels were set in the WRF and ROMS models, respectively. The topography in the ROMS model was based on ETOPO1 (https://www.ngdc.noaa.gov/mgg/global/global.html). The WRF Single-Moment 6-class scheme was chosen as the microphysics scheme. Longwave and shortwave radiation was computed via the Rapid Radiative Transfer Model and Dudhia scheme. The planetary boundary layer scheme and cumulus parameterization used in the WRF model were the Yonsei University scheme and Kain-Fritsch scheme, respectively. A generic length-scale mixing closure was applied in the ROMS vertical mixing parameterization scheme. Third-order upwind horizontal advection and fourth-order centered vertical advection were adopted for the temperature and salinity simulations.
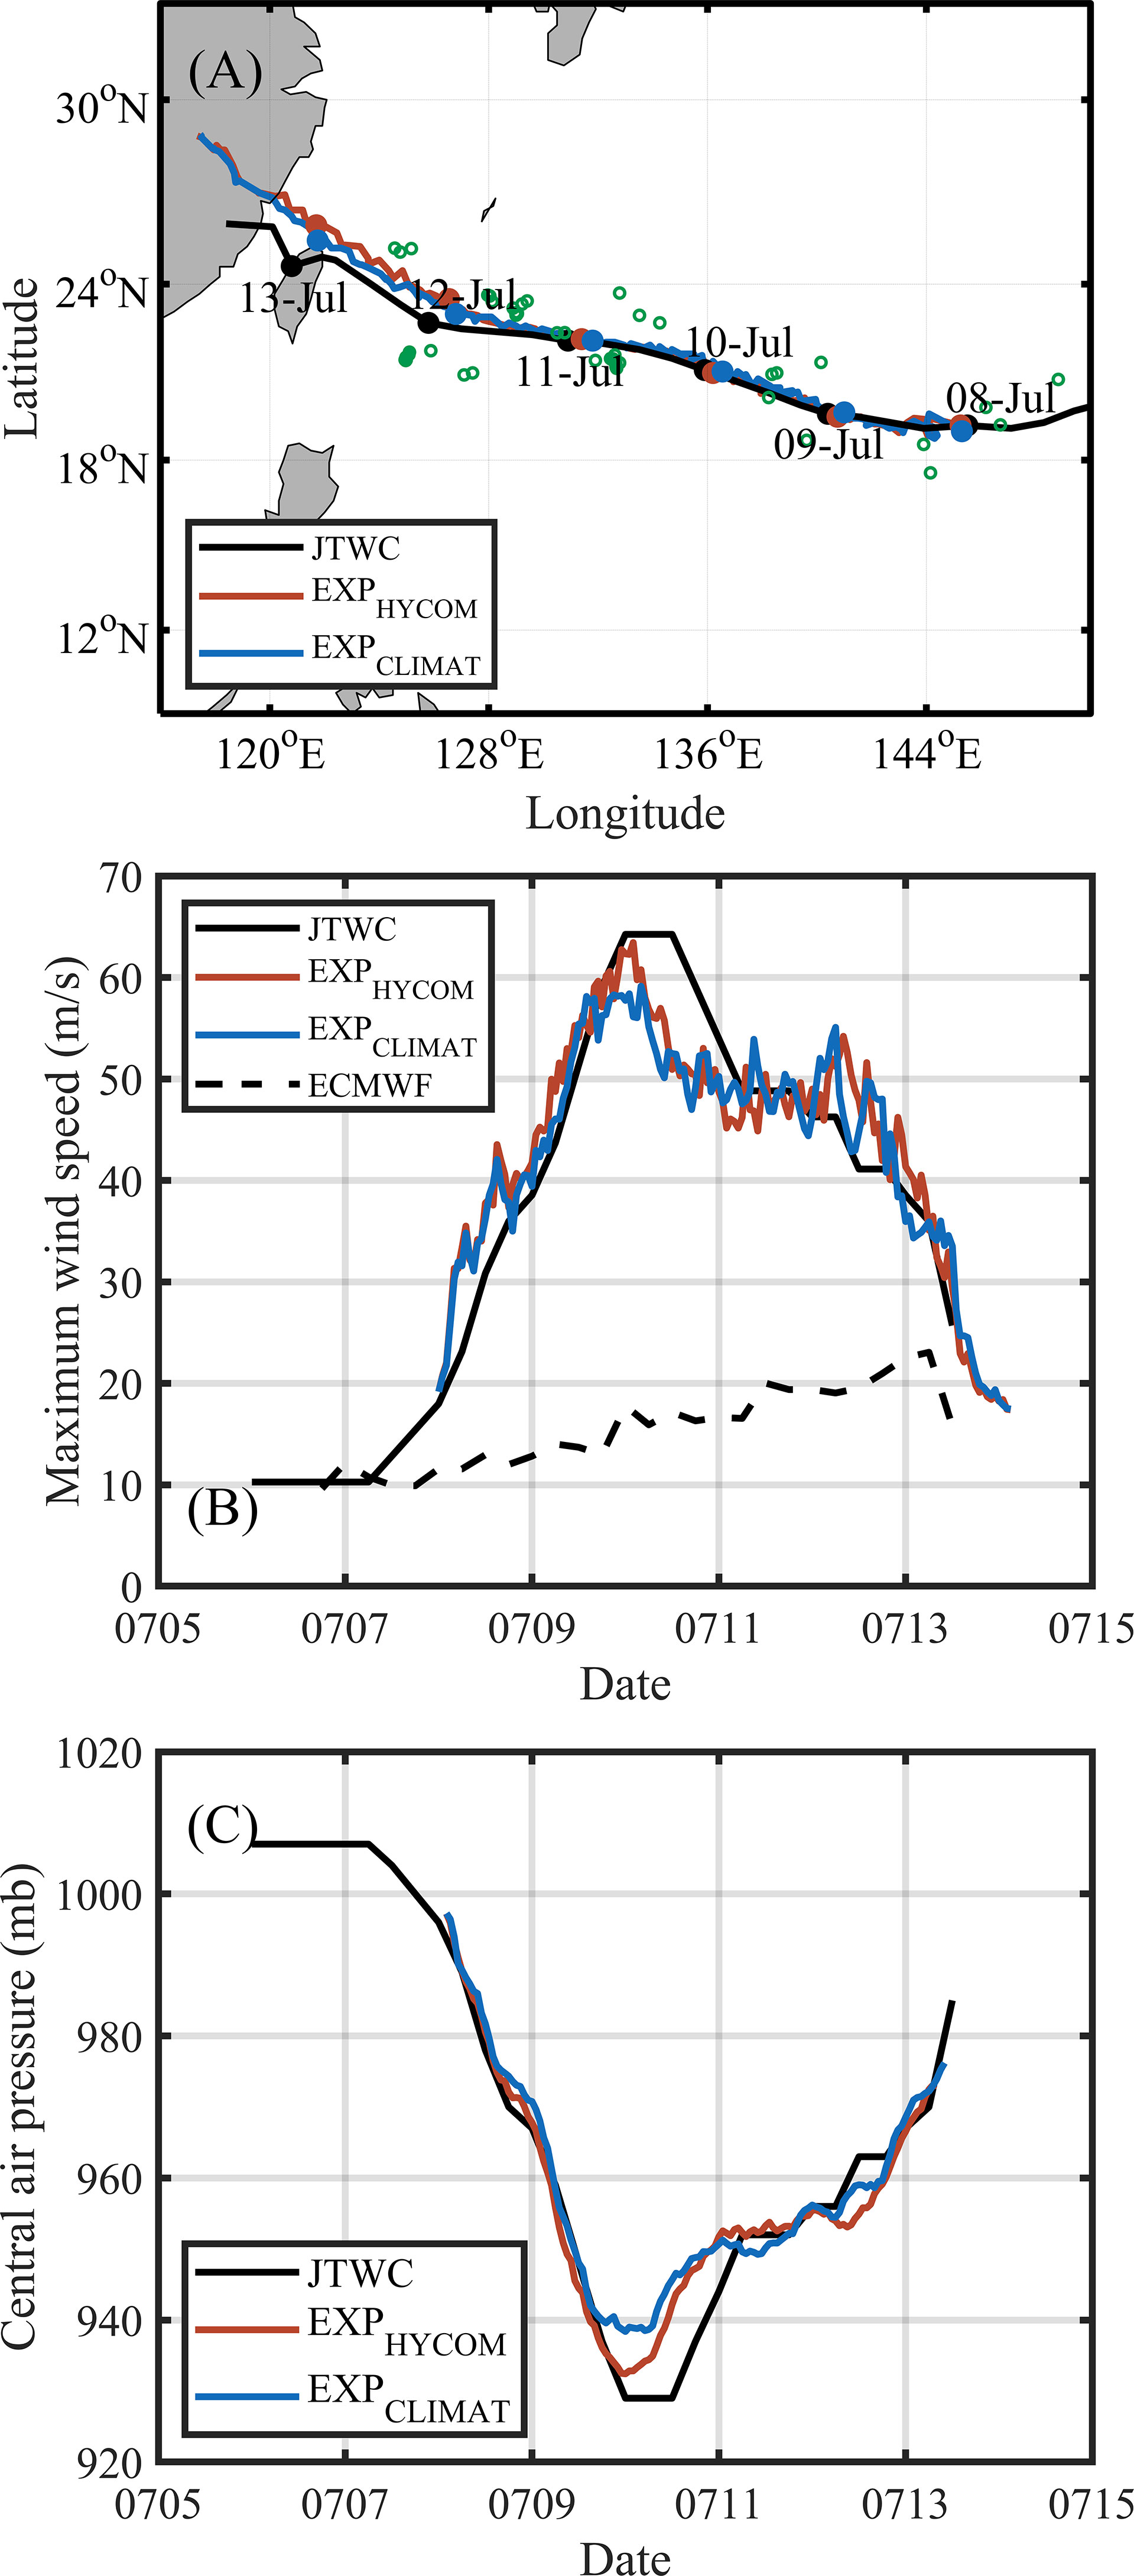
Figure 1 Comparisons of the (A) tracks, (B) maximum wind speeds, and (C) central surface air pressures of Typhoon Soulik between the best track data (JTWC) and the simulated results. Green circles are the locations of Argo observations within 200 km of the track from July 7 to July 17. In (B), the dashed line shows the maximum wind speeds of Typhoon Soulik (2013) obtained from the ECMWF reanalysis data.
The initial and boundary data of the WRF were from the National Centre for Environmental Prediction Final Analysis. To identify preexisting mesoscale cyclonic eddies, the initial conditions, e.g., temperature, salinity, current and water level, for the ROMS were obtained from the Hybrid Coordinate Ocean Model (HYCOM) and Navy Coupled Ocean Data Assimilation (NCODA) system (Cummings, 2005). HYCOM is a primitive equation ocean general circulation model with a resolution of 0.08° in the zonal direction and a nonuniform resolution in the meridional direction, i.e., 0.08° from 40°S to 40°N and 0.04° in the remaining regions, which can resolve mesoscale eddies. Through the NCODA system, the assimilation of available satellite altimeter observations, SST, and in situ vertical temperature and salinity profiles simulates the preexisting mesoscale eddies consistently with the observations. The lateral boundary information in the ROMS was also obtained from the HYCOM.
ROMS was initialized to start on July 5, 2013, with a simple setup of a 3-day model time (July 5-7) before the formation of Typhoon Soulik as a tropical storm on July 8. WRF was initialized to start on July 8 and was instantly coupled with the ROMS model. The control run simulation was conducted by incorporating near real-time eddies from the HYCOM, which was referred to as EXPHYCOM.
To examine the effect of preexisting CEs on the upper ocean response to Typhoon Soulik and the underlying mechanism, we conducted an experimental simulation where the preexisting CEs were not included. The oceanic initial fields on July 5, 2013, were replaced by seven-year (2010-2016) averaged climatology fields in July from HYCOM, which was referred to as EXPCLIMAT.
To diagnose the oceanic response, a temperature budget analysis was performed based on the following equation (Wei et al., 2014):
where the left-hand term is the temperature change rate and the right-hand terms are advection (1), horizontal diffusion (2), and vertical diffusion (3). In the ROMS model, the vertical boundary condition at the sea surface (z = ζ(x, y, t)) for temperature is , where the surface heat flux is contained in the vertical diffusion (vertical mixing) term. Each term on the right-hand side of equation (1) can be integrated over time to obtain its accumulated contribution to the change in temperature since 0000 UTC on July 8.
Typhoon Soulik developed as a tropical storm at 0000 UTC on July 8 and rapidly intensified to a category 4 tropical cyclone (Saffir–Simpson hurricane scale) with a maximum wind speed of 64 m/s and a minimum central surface air pressure of 929 mb on July 10, located at 21.1°N, 135.9°E (Figure 1). Figure 1A shows the tracks simulated in both experiments, along with the best track from the JTWC. Both the simulated tracks matched the best track well before passing the area at approximately 128°E, where the simulated tracks started slightly shifting to the north compared to the corresponding observations.
The intensity of Typhoon Soulik, as simulated by EXPHYCOM, was consistent with the JTWC data in the developing period, i.e., until it reached the maximum wind speed of 63.4 m/s and the central surface air pressure of 932 mb at 0200 UTC on July 10, 2013, and after July 11, 2013. The main difference was the duration of their maximum intensity: the maximum typhoon intensity was maintained for 12 hours in the JTWC, but it dropped gradually after reaching the maximum in the EXPHYCOM. In comparison, Typhoon Soulik, as simulated in EXPCLIMAT, had a maximum wind speed of 59.1 m/s, which was weaker than that in the observations and in EXPHYCOM.
Argo profiles within 200 km of the track of Soulik from July 7 to July 17, 2013, were chosen to validate the model performance (green circles in Figure 1A). Figure 2 shows the temperature and salinity comparisons between EXPHYCOM and the corresponding Argo data. The model results for temperature and salinity were interpolated to the locations and depths of the Argo samples for comparison. A great temperature match was found between the simulation and the Argo data, with a correlation coefficient (R) > 0.99, although the salinity simulations showed some bias, and their influence on sea surface cooling was limited.
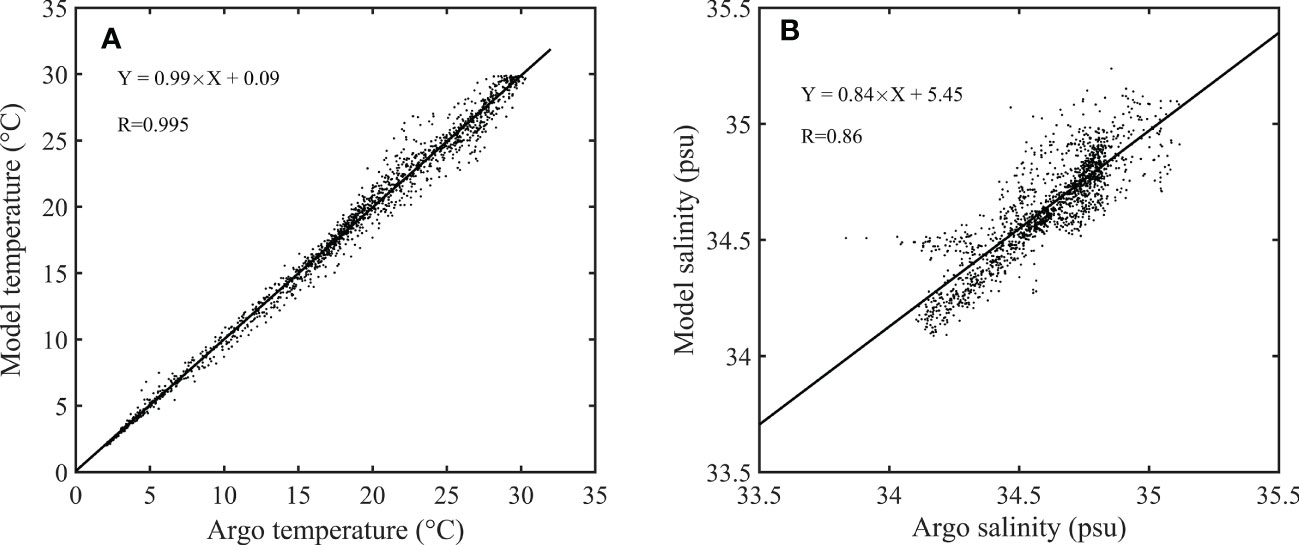
Figure 2 Comparisons of Argo observations with the corresponding results of EXPHYCOM for (A) temperature and (B) salinity. In the linear fitting formulas, Y is the model results, and X is the corresponding Argo observations. R is the correlation coefficient between the model results and Argo data.
The remote sensing of SST during Typhoon Soulik (Figure 3) revealed that the SST near its track was mostly higher than 29°C on July 6 and 7, 2013. The SST slightly dropped (by less than 1°C) to the north of the track on July 8, and significant cooling occurred later on July 10. Although sea surface cooling took place along the entire track, a detailed examination found that the cooling was not homogeneously distributed but presented a multicore structure, identified as several spatial peaks of sea surface cooling, with a minimum SST of less than 24°C. During the period from July 10 to July 12, the maximum wind speed of Typhoon Soulik gradually decreased in association with a stable translation speed, i.e., approximately 6 m/s. Wei et al. (2017) determined that large-scale sea surface cooling occurred during the passage of Typhoon Soulik with a prognostic algorithm where only wind was incorporated; however, multicore sea surface cooling was captured by a machine learning algorithm where ocean parameters, e.g., SST, sea surface height, and temperature at 100 m depth, were incorporated. Considering the inconsistent patterns of typhoon intensity and translation speed in relation to the spatial features of sea surface cooling, the multicore sea surface cooling was attributed to other factors, e.g., oceanic conditions.
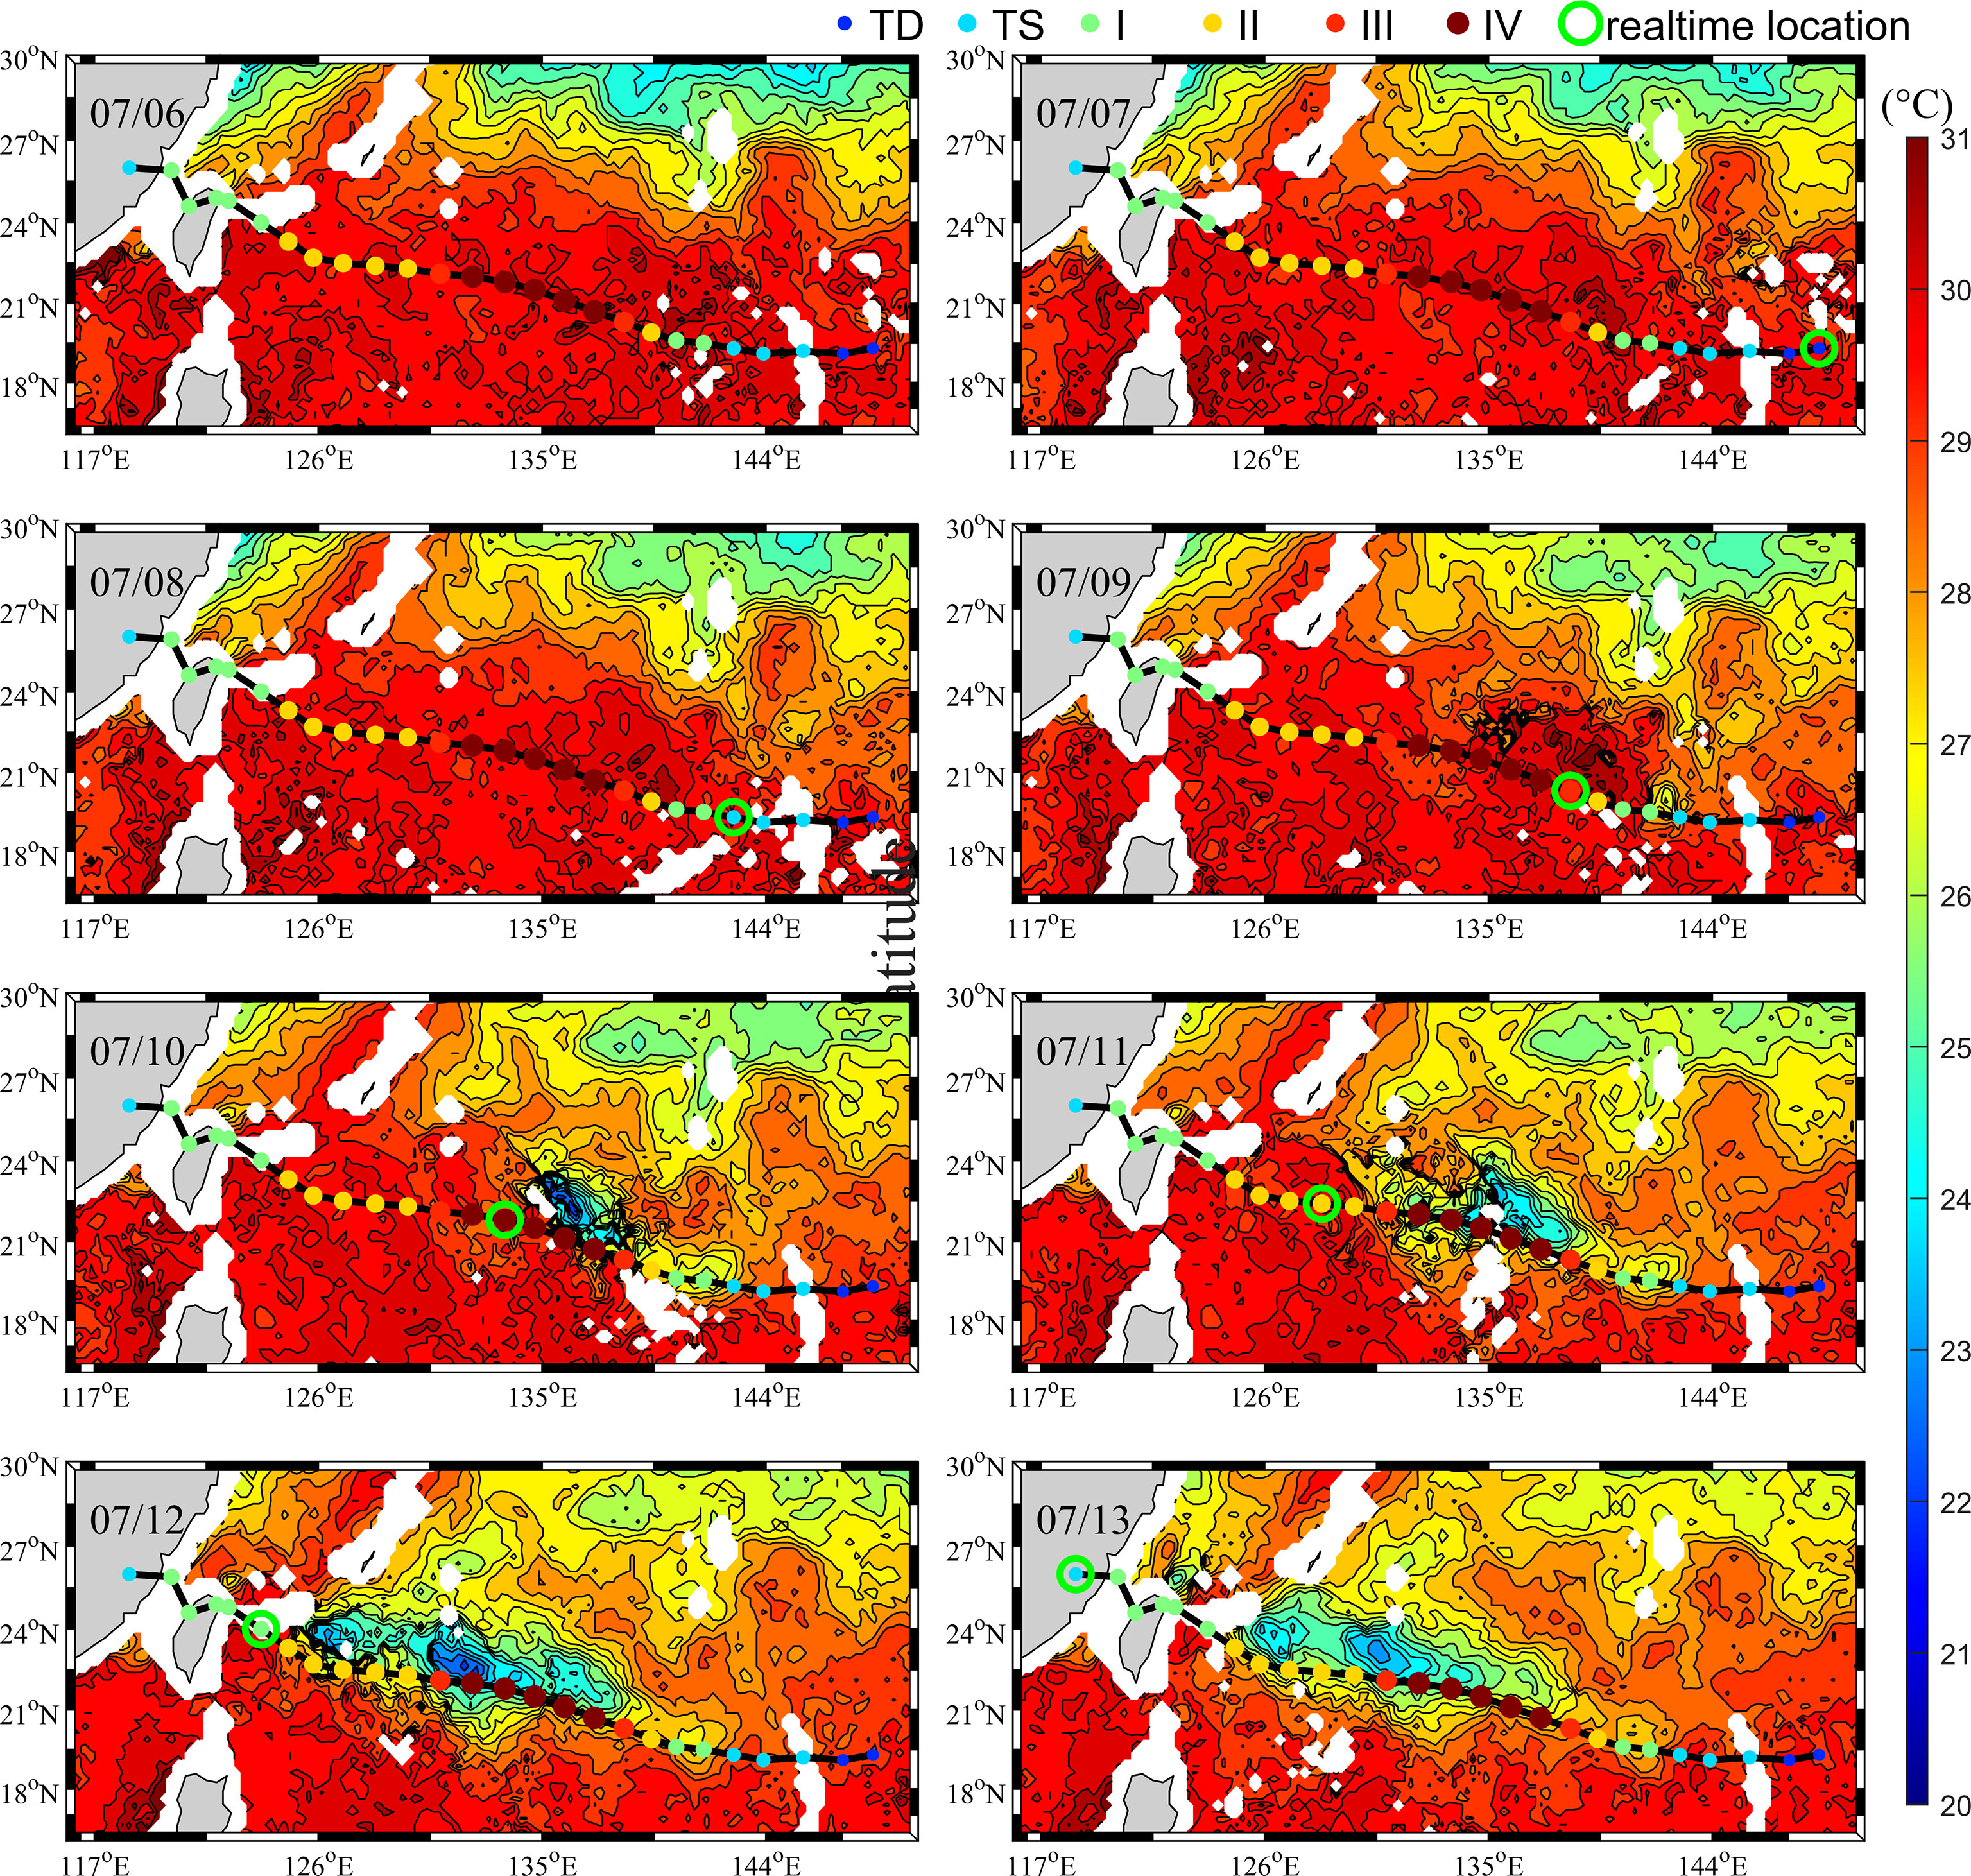
Figure 3 Remote sensing SST observations from July 6 to July 13, 2013. Colored dots show the intensities and locations of Typhoon Soulik (2013) at 6-hour time intervals. TD, TS, I, II, III and IV represent tropical depression, tropical storm, and category 1, category 2, category 3 and category 4 tropical cyclone grades, respectively, according to the Saffir-Simpson hurricane wind scale. The enlarged green circle is the real-time location of the typhoon center at 0000 UTC on each day.
The SLA before, during and after Typhoon Soulik (Figure 4) captured several eddies on July 6, 2013, before the formation of the typhoon. Three CEs, located between 125°E and 139°E, stayed at roughly the same positions before, during and after the passage of the typhoon. The maximum sea surface cooling induced by Typhoon Soulik (Figure 5) was the minimum value in the SST anomaly, defined as the difference with that at each location during its passage on July 8. The cold core features became more prominent in the anomalous field, and their locations were consistent with those of the three cold eddies (CE1, CE2, and CE3) (Figure 5). Thus, the cold cores induced by Typhoon Soulik were associated with the preexisting CEs, and the spatial peaks with the maximum sea surface cooling within the three cold eddies, referred to as the cooling centers, were marked as C1, C2 and C3 (Figure 5). The SST anomalies at the C1, C2 and C3 cooling centers were -8.10°C, -7.95°C and -6.60°C, respectively.
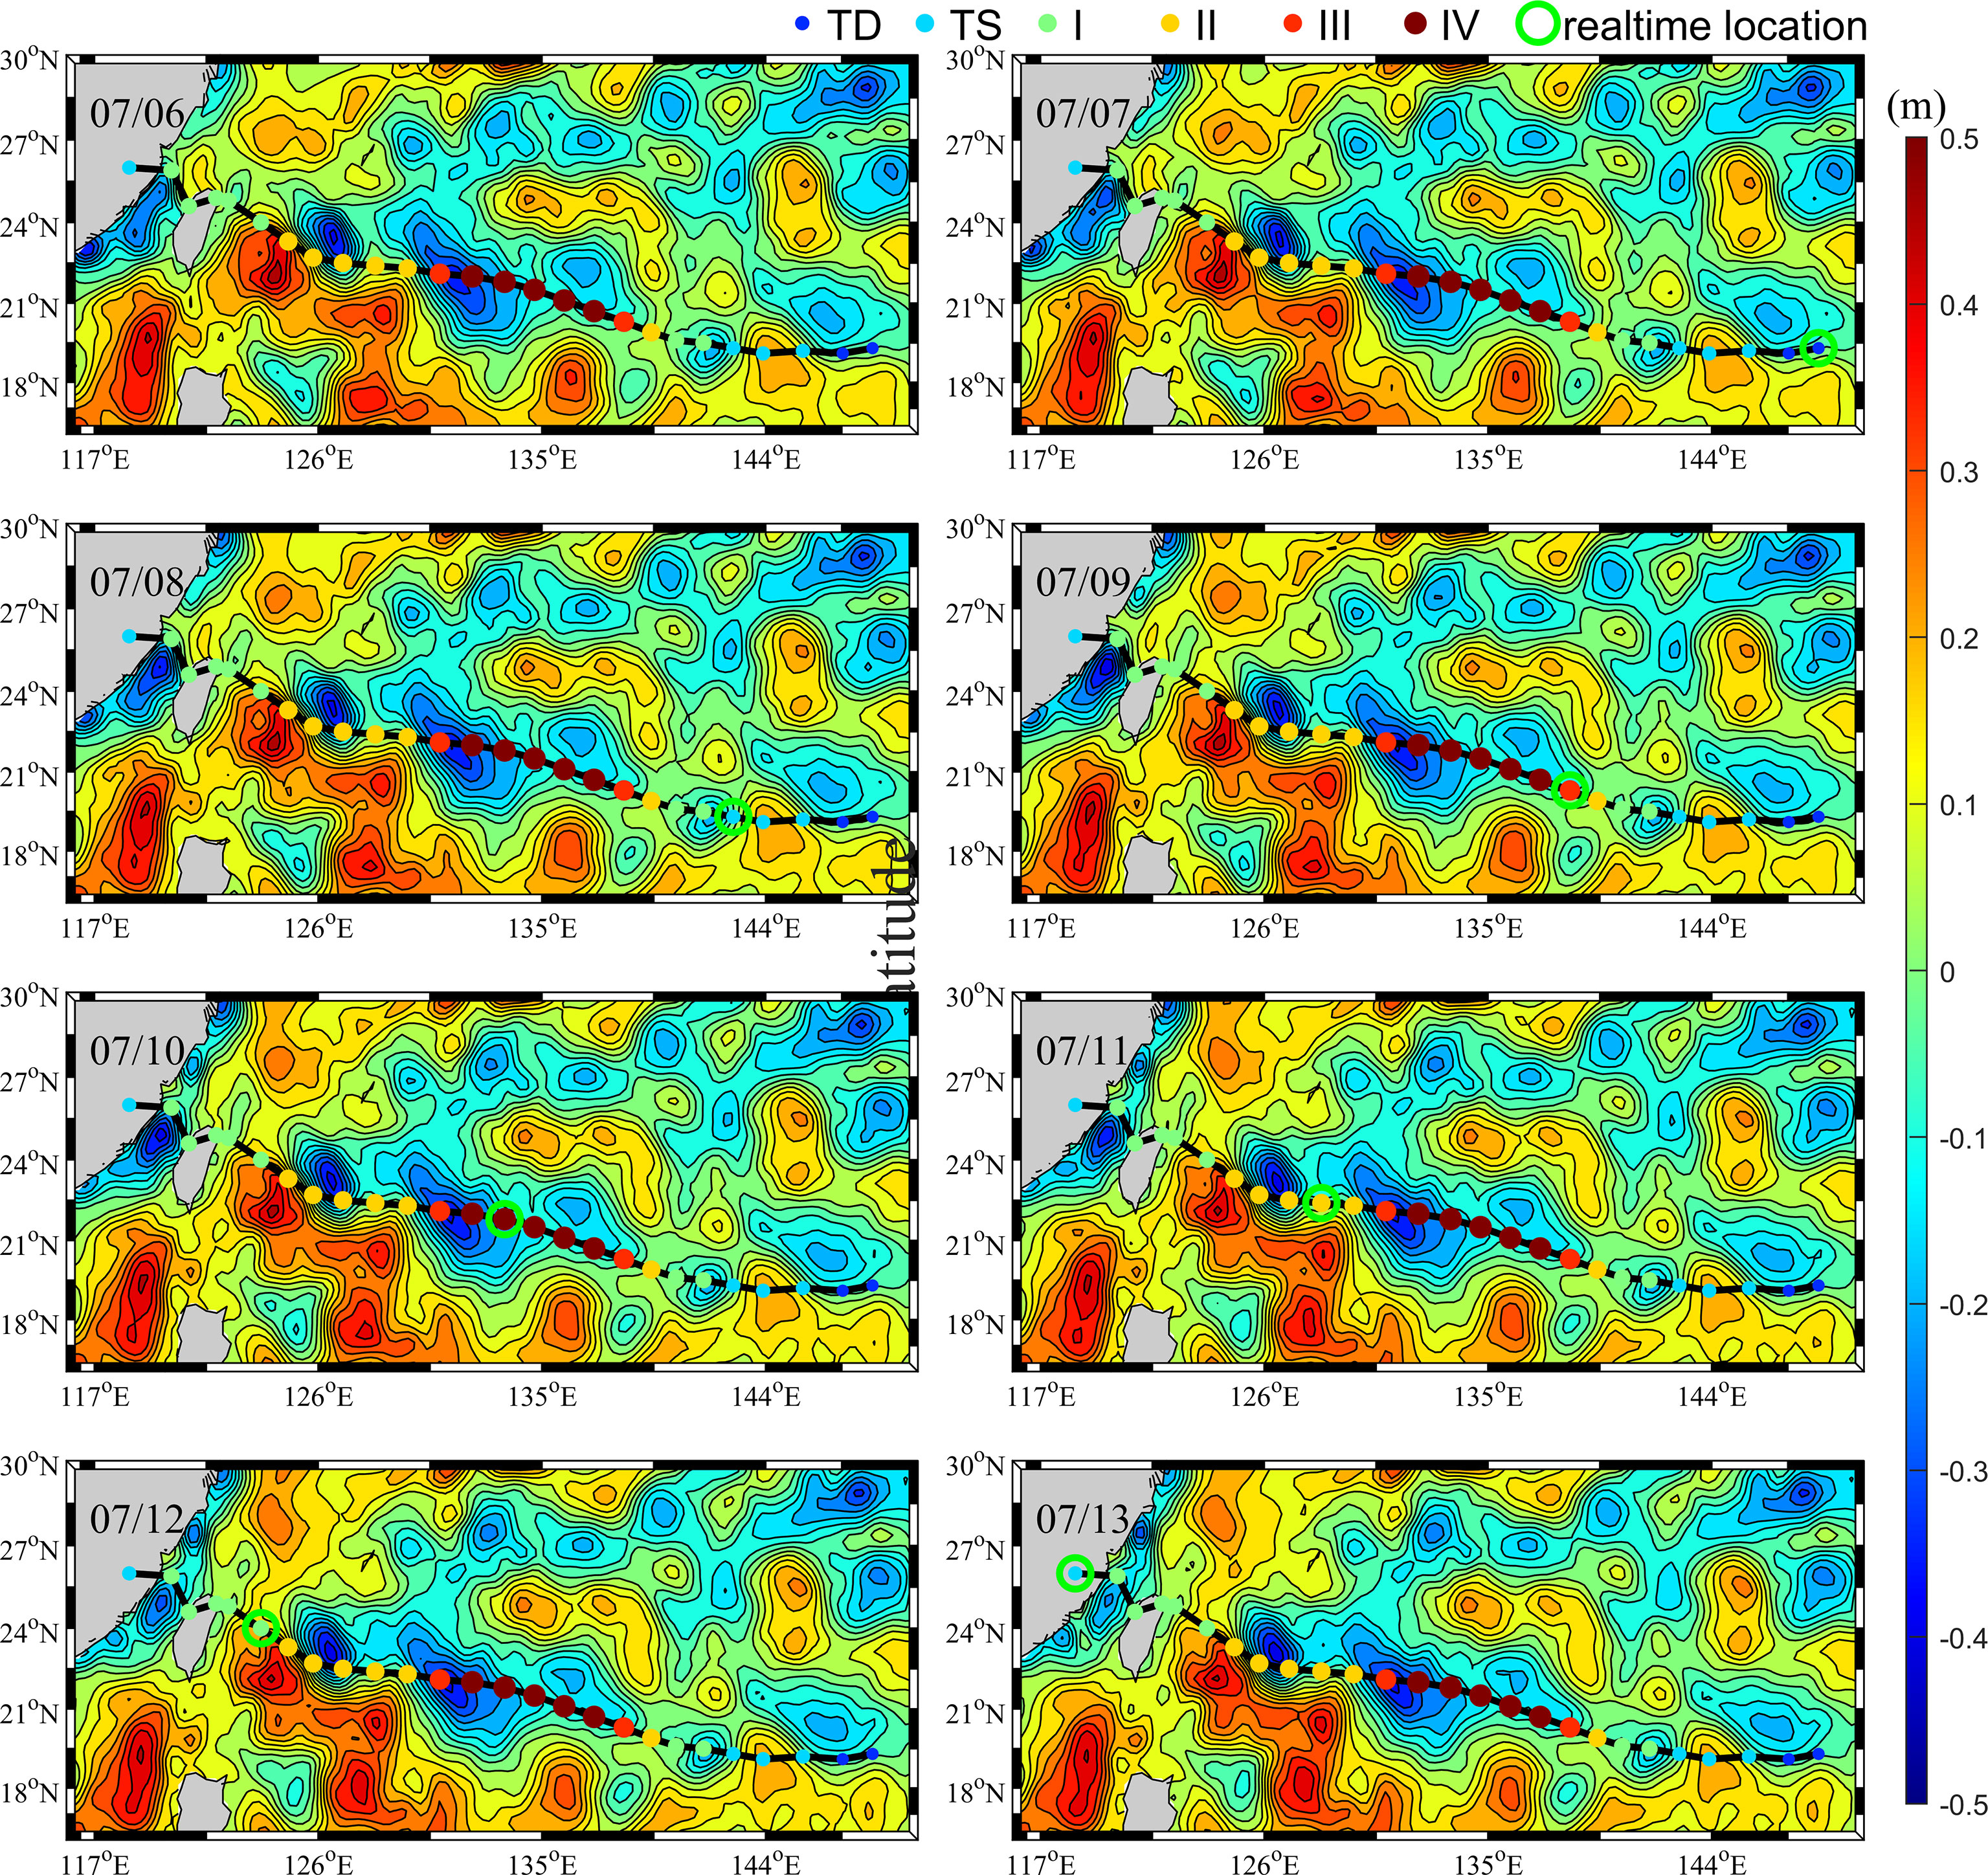
Figure 4 Remote sensing SLA observations from July 6 to July 13, 2013. The symbols in this figure are the same as those in Figure 3.
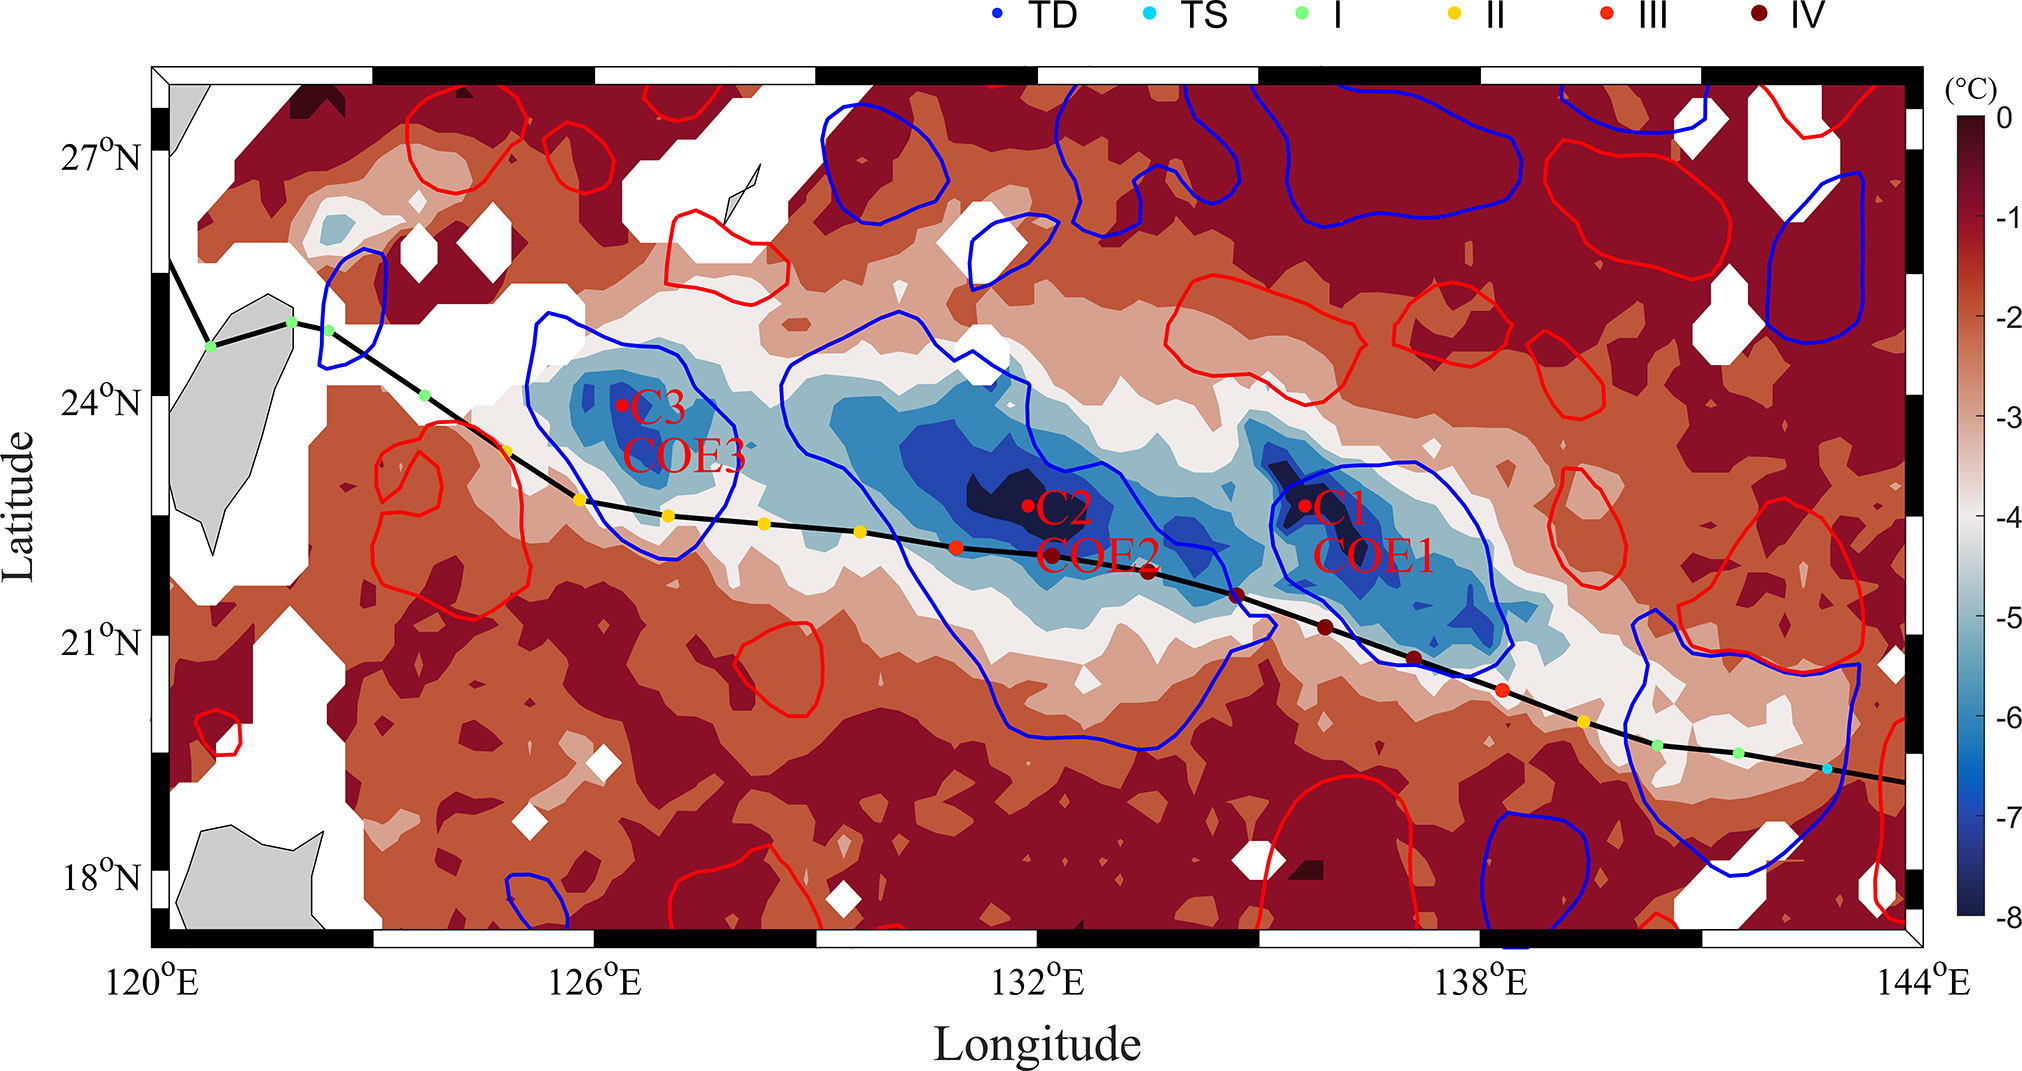
Figure 5 Spatial distribution of maximum sea surface cooling from remote sensing (color shading) during Typhoon Soulik and the preexisting mesoscale eddies on July 6 (blue and red contours). The blue (red) contours delineate the edges of the CEs and anticyclonic eddies. The red dots (C1, C2 and C3) are the cooling centers within the corresponding preexisting CEs (CE1, CE2 and CE3). The other symbols are the same as those in Figure 3.
The upper ocean response to Typhoon Soulik was simulated by the coupled atmosphere and ocean model. The sea level on July 8 in the EXPHYCOM simulation (Figure 6A) included eddies, and the spatial pattern of the CEs was highly consistent with the AVISO data (Figure 4). Similarly, the maximum sea surface cooling for each grid in EXPHYCOM (Figures 6C) showed a multicore structure similar to that of the remote sensing of SST (Figure 5), indicating that the cooling associated with the CEs was successfully reproduced by the model. Furthermore, the cooling centers in the model (M1, M2, M3) that occurred within the CEs were highly consistent with those in the altimetry data (C1, C2, C3) (Figure 5). The maximum sea surface cooling at the M1, M2 and M3 cooling centers was -6.73°C, -7.35°C and -8.31°C, respectively.
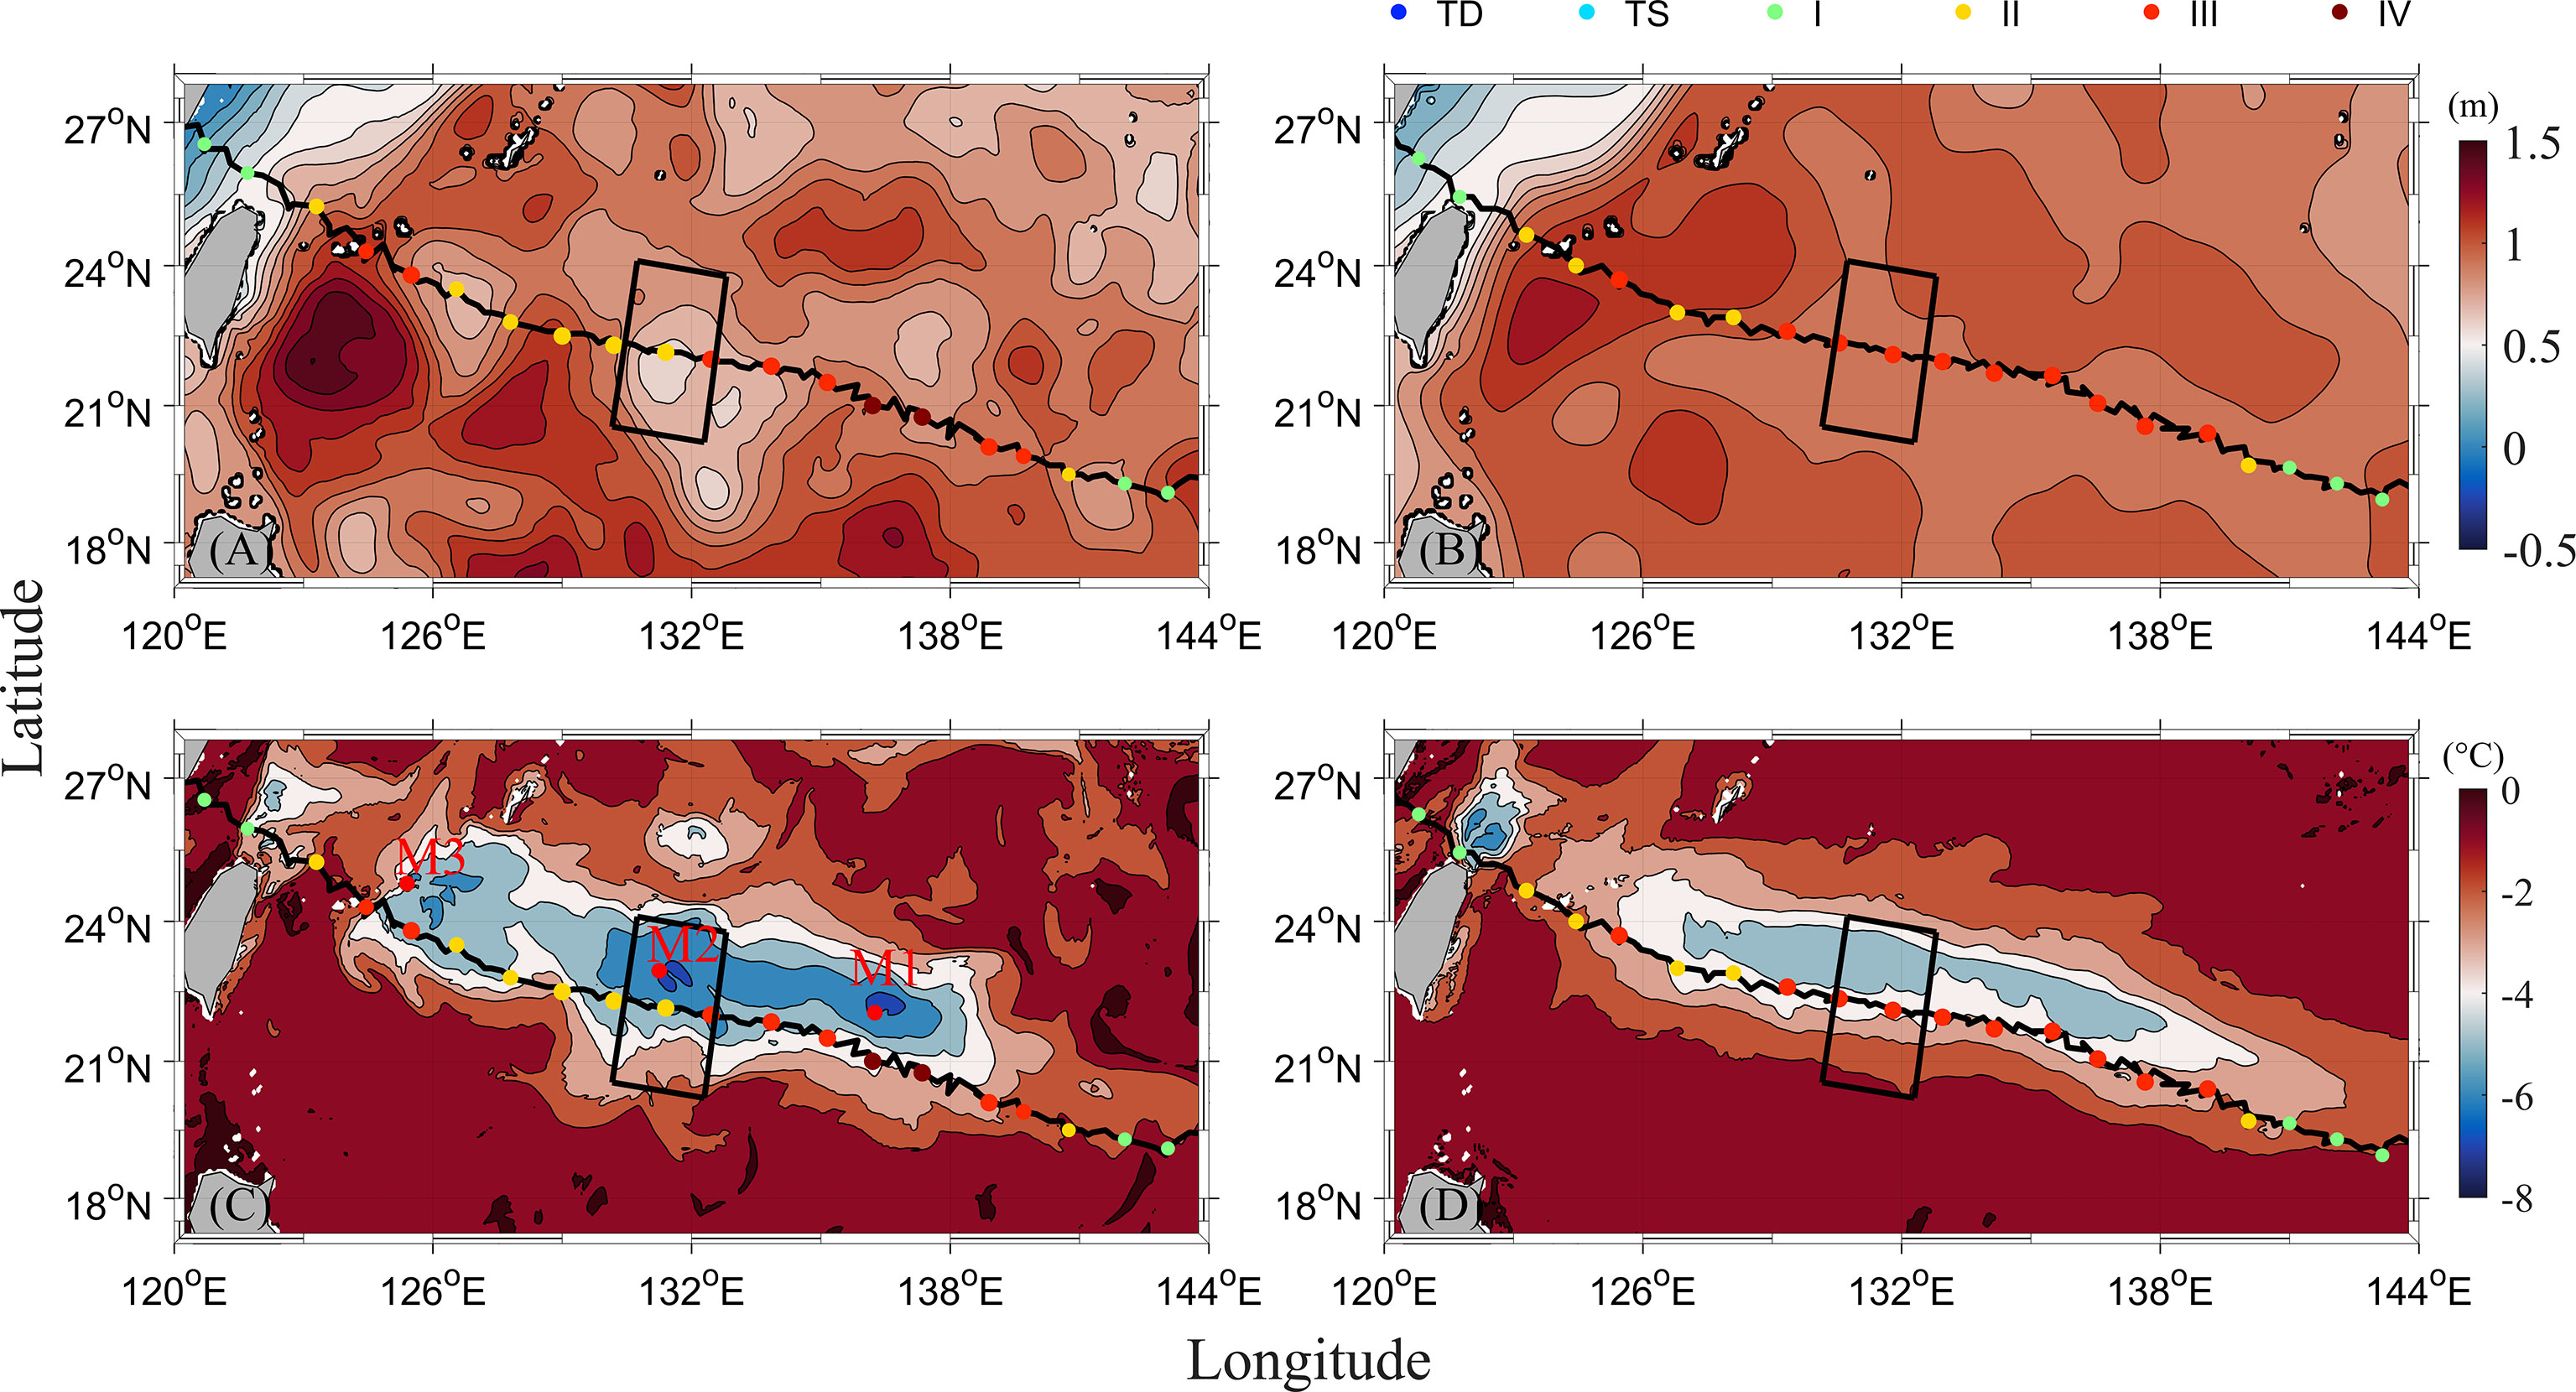
Figure 6 Sea level on July 8 (A, B) and corresponding maximum sea surface cooling distribution (C, D) in (A, C) EXPHYCOM and (B, D) EXPCLIMAT. The red dots (M1, M2 and M3) in (C) are the cooling centers within the corresponding preexisting CEs (refer to those in Figure 5). The black box shows the domain for CE2. The black curve is the track of Typhoon Soulik. The other symbols are the same as those in Figure 3.
The sea level on July 8 in the EXPCLIMAT simulation did not capture the occurrence of CEs (Figure 6B), and there was no multicore sea surface cooling. The maximum sea surface cooling showed a continuous band pattern (Figure 6D) with a weaker value (-4.85°C) compared with that in EXPHYCOM (-8.31°C) and in the observation (-8.1°C). In EXPCLIMAT without the CEs, the maximum SST cooling at the same positions as M3, M2 and M1 were only -2.11°C, -4.68°C and -4.48°C, respectively. As the CEs were not present in the initial field, the continuous band of the SST cooling response in EXPCLIMAT indicated that the three cold cores induced by Typhoon Soulik in EXPHYCOM were related to the preexisting CEs. Considering that the sea surface cooling at M2 in EXPHYCOM was closer to the corresponding observations than those at M1 and M3, the following discussion focuses on the dynamic mechanisms of CE2.
The mixed layer depth and the strength of stratification beneath it were found to be the two major oceanic parameters influencing the wind-induced cooling amplitude (Vincent et al., 2012b). The vertical temperature profiles at M2 showed similar mixed layer depths before the passage of Typhoon Soulik in EXPHYCOM and EXPCLIMAT (Figure 7), but the temperature gradient below the mixed layer was larger in EXPHYCOM than in EXPCLIMAT. A large temperature gradient in a CE makes vertical mixing and upwelling more efficient, facilitating sea surface cooling (Wu et al., 2007; Zheng et al., 2010). Consistently, the colder water entrained from the upper thermocline was demonstrated to enhance sea surface cooling when there was a large temperature gradient at the base of the mixed layer (Wu et al., 2007).
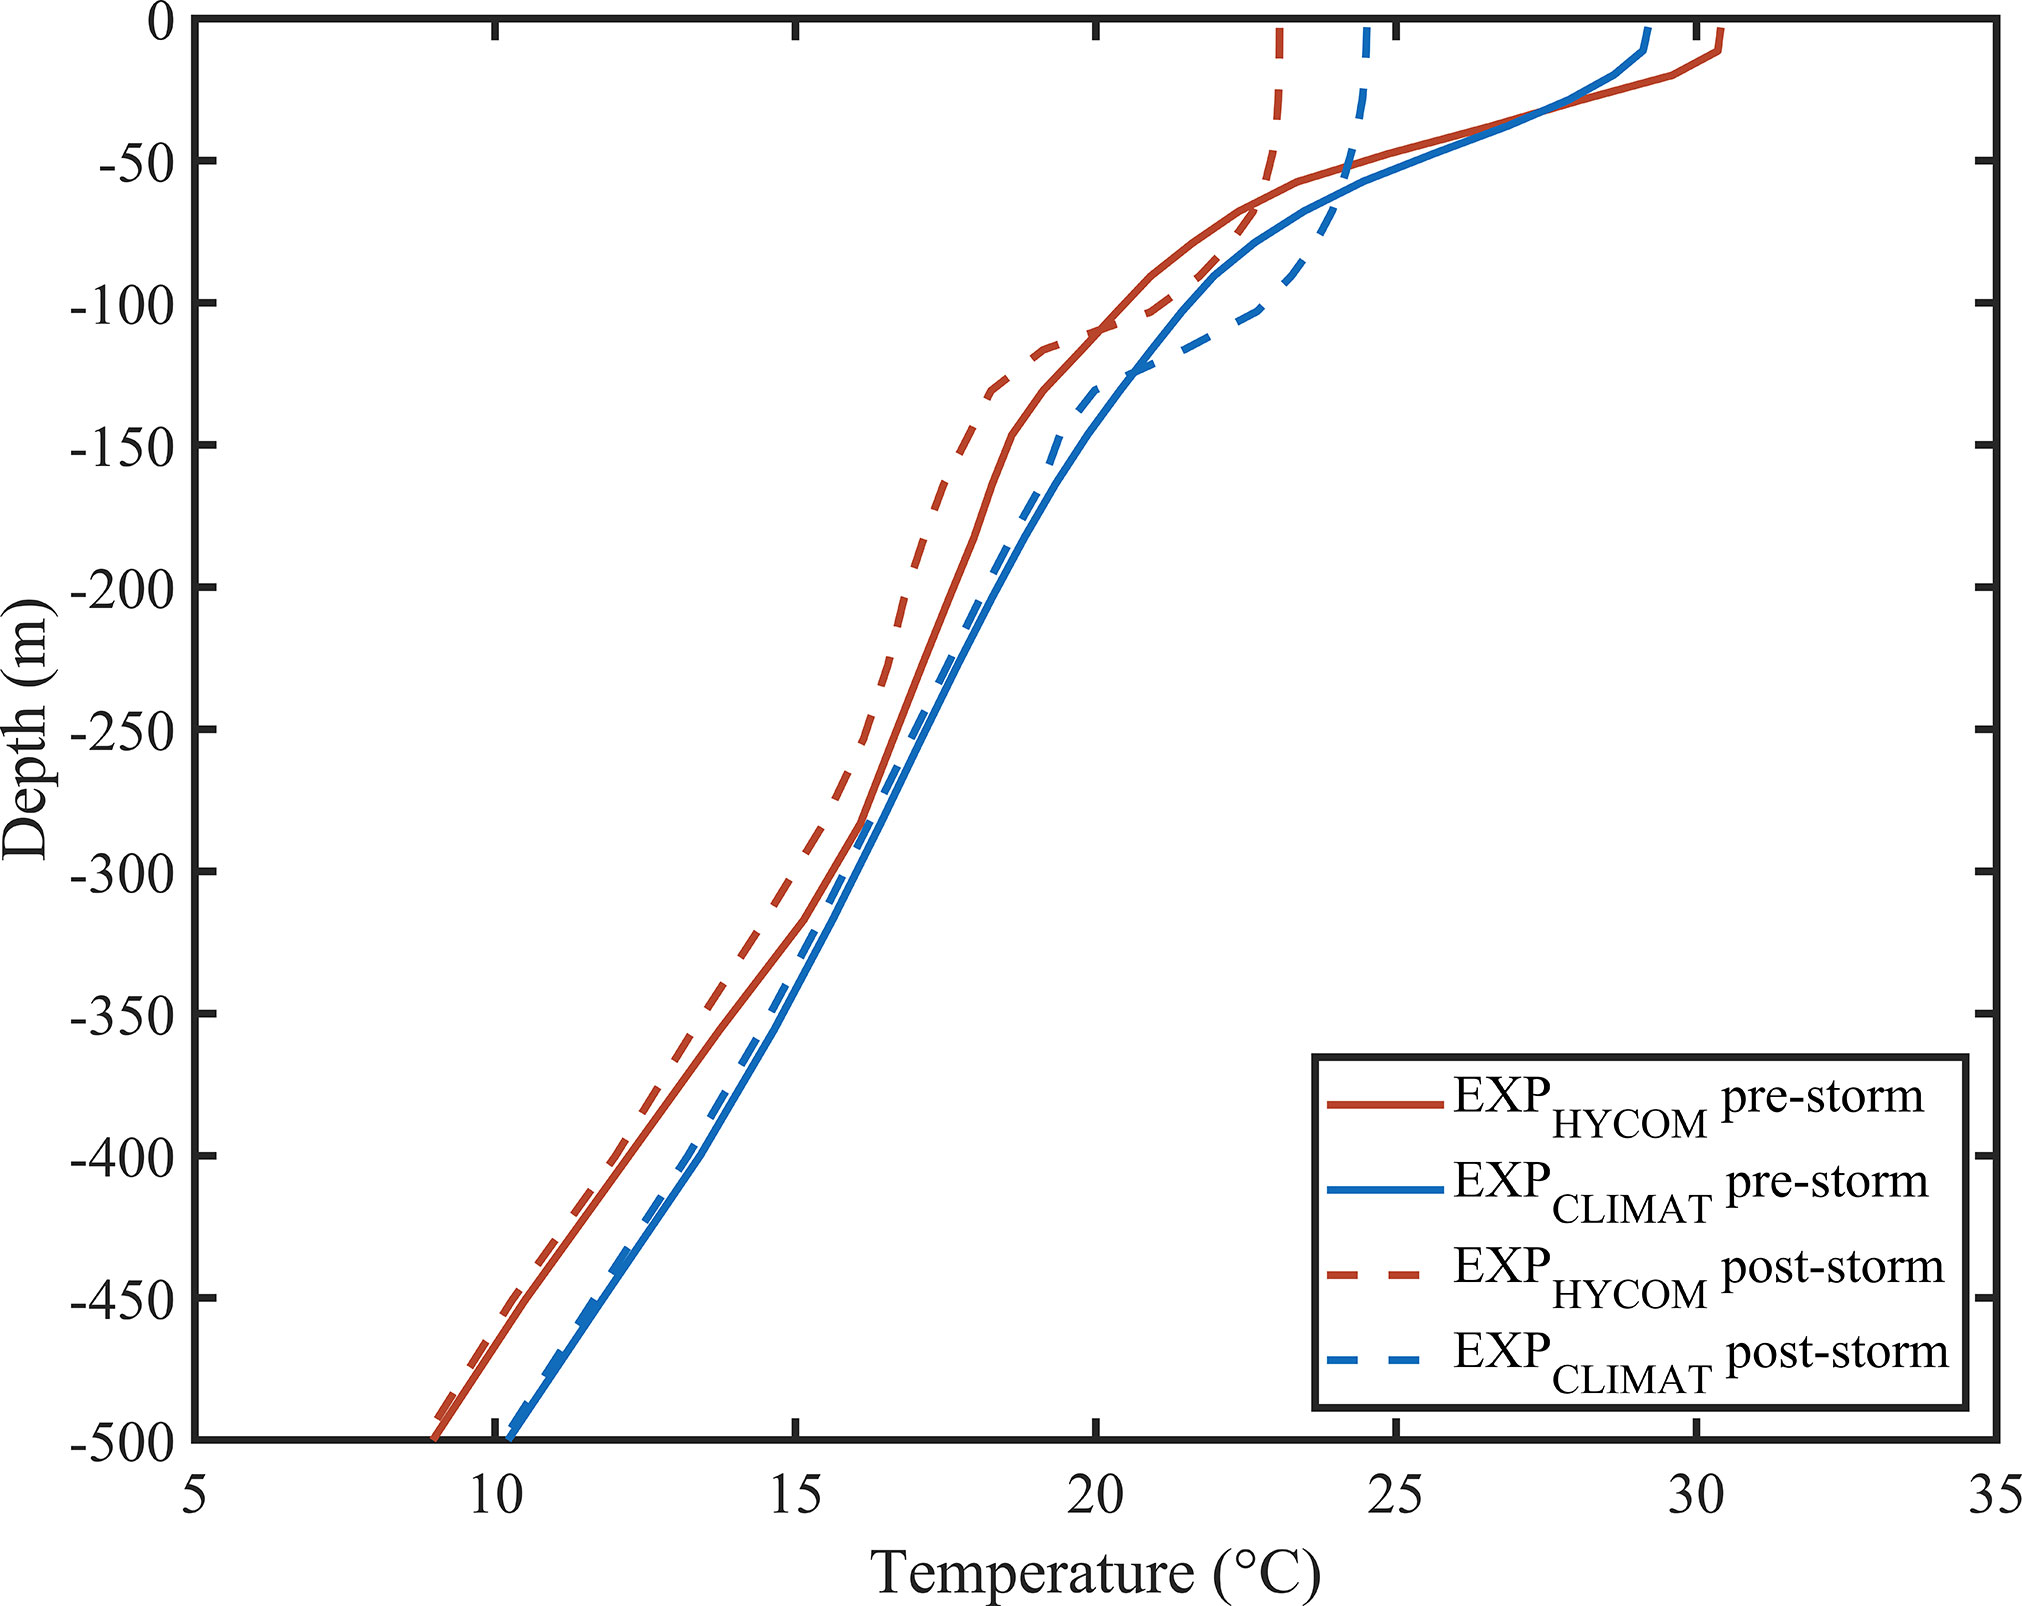
Figure 7 Vertical temperature profiles on July 8 (solid lines) and when the maximum sea surface cooling occurred after the passage of Soulik (dashed line) in EXPHYCOM (red) and EXPCLIMAT (blue) at M2.
A region around M2, which was 200 km along the track and within 200 km from the TC track on both the right and left sides (see the black box in Figure 6), was chosen for further dynamic analysis. Typhoon Soulik passed the region at approximately 0100 UTC on July 11, 2013. The maximum sea surface cooling occurred 18 and 20 hours after the typhoon passage in EXPHYCOM and EXPCLIMAT, respectively. The oscillation period of the temperature anomaly was close to the inertial period at M2, i.e., 30 hours, indicating the existence of near-inertial oscillations (Price, 1983; Gill, 1984; Shay and Elsberry, 1987). To eliminate the influence of the near-inertial oscillations on the contribution of mixing and advection to SST anomalies, the sea surface cooling was obtained by averaging the SST anomalies during one inertial period from 3 to 33 hours after the typhoon passage (Figures 8A, B). The SST anomaly without CE2 in EXPCLIMAT was relatively uniform along the track (Figure 8B), which was in agreement with previous research where the composite method was applied along the track (e.g., Mei and Pasquero, 2013). In contrast, several semicircular SST anomaly contours (black contours) between 100 km and 200 km to the right of the track in EXPHYCOM illustrated a prominent along-track variation in the SST anomaly, probably leading to a cooling core. The SST anomaly contours to the right of the track had the same shapes as the outermost zeta contour (red dashed curve) in EXPHYCOM (Figure 8A), demonstrating that the along-track variation was associated with the preexisting CE2.
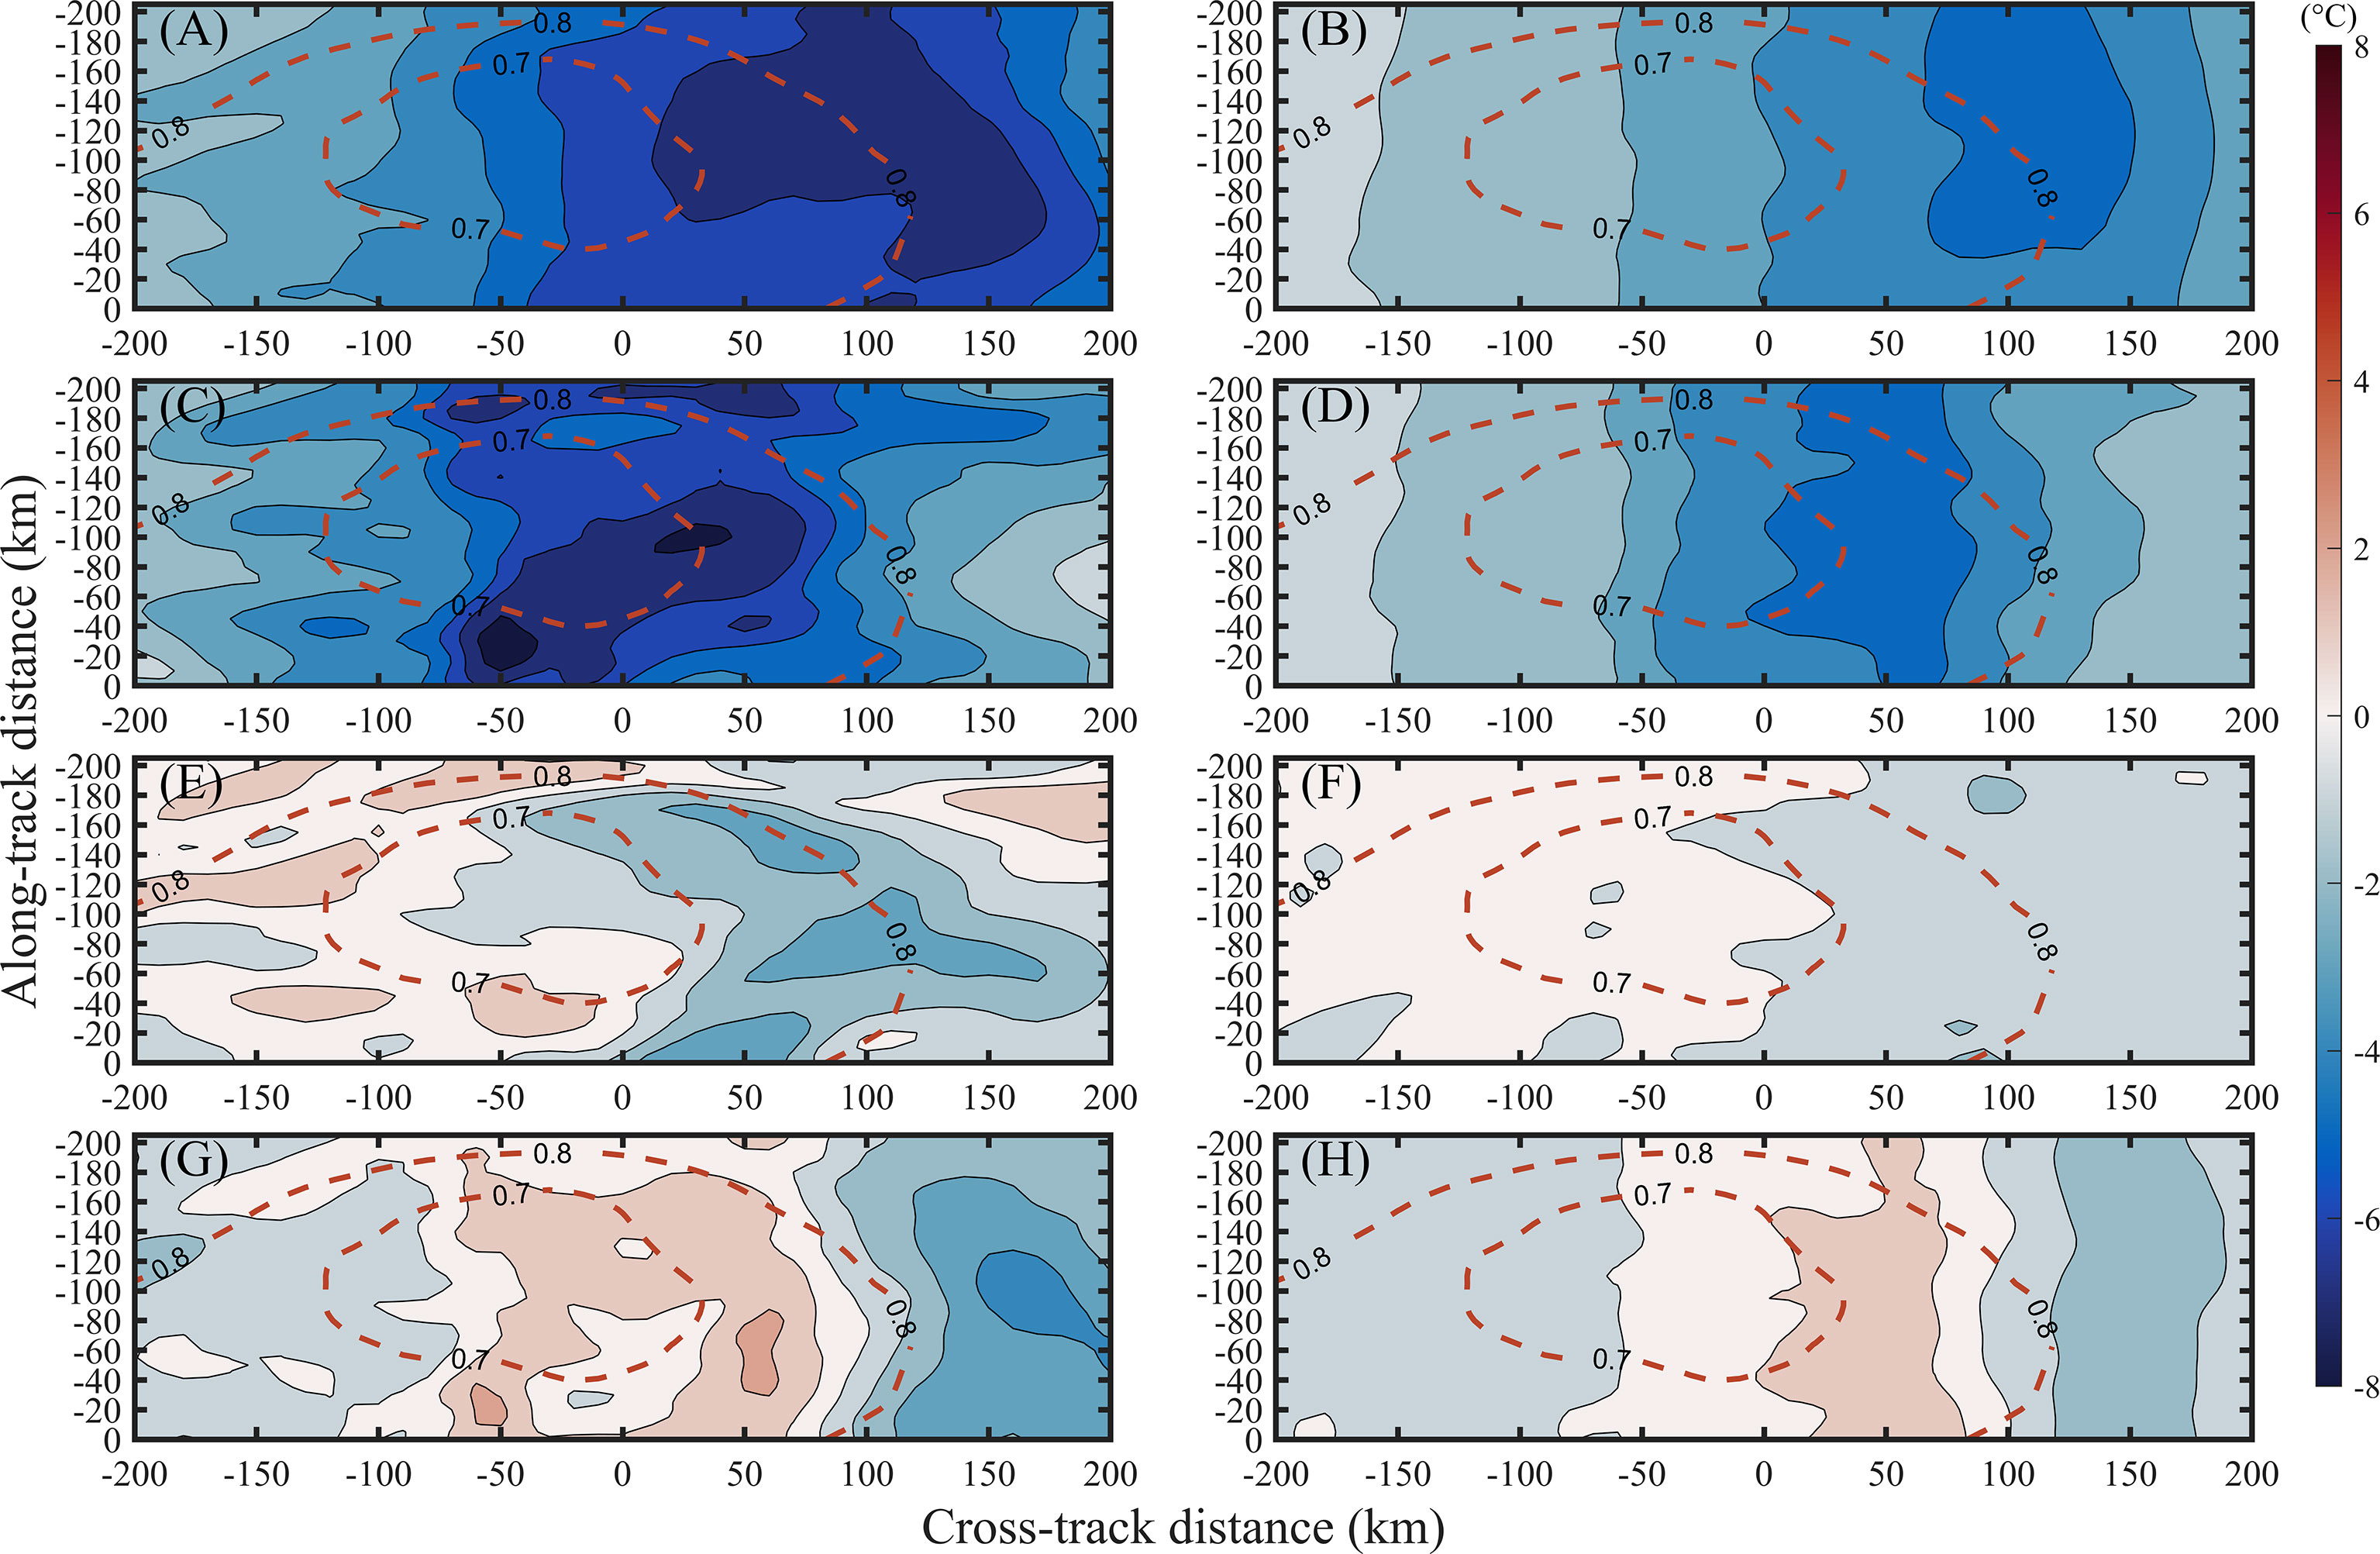
Figure 8 Modeled (A, B) SST anomalies and corresponding contributions of (C, D) mixing, (E, F) along-track advection and (G, H) cross-track advection to the SST anomaly within the defined domain (see Figure 6 for the location) in EXPHYCOM (A, C, E, G) and EXPCLIMAT (B, D, F, H). Red dashed curves indicate the initial zeta contours (0.7 m and 0.8 m) before the passage of the typhoon. Along-track distances of 0 and -200 km represent the east and west edges of the domain (see black box in Figure 6), respectively. Cross-track distances of -200 and 200 km represent the left and right edges of the domain (see black box in Figure 6), respectively.
Both experiments showed rightward-shifted patterns of sea surface cooling (Figures 8A, B), which is a well-known feature of the SST response to typhoons in the Northern Hemisphere. The clockwise rotation of the wind stress tends to resonate with the wind-induced inertial currents, enhancing vertical mixing and resulting in a rightward strengthening of surface cooling (Price, 1981). This pattern was prominent in EXPCLIMAT (Figure 8D), where the maximum sea surface cooling induced by mixing (-4.4°C) appeared 50 km to the right of the track. However, there was no obvious signal in EXPHYCOM (Figure 8C); instead, the maximum sea surface cooling induced by mixing (-6.0°C) appeared 40 km to the left of the track. The mean sea surface cooling within 200 km that was induced by mixing in EXPHYCOM was 1.5°C higher than that in EXPCLIMAT. Thus, the rightward-shifted cold wake in EXPHYCOM was attributed to horizontal advection rather than mixing.
The SST anomaly and corresponding contribution of a long-track advection in EXPHYCOM showed a similar cambered shape on the right side of the TC track (Figures 8A, E), indicating that the cooling pattern in EXPHYCOM was mainly caused by a long-track advection. However, the contribution of a long-track advection was relatively uniform along the track in EXPCLIMAT and was negative (positive) on the right (left) side (Figure 8F). The advection-induced cambered SST anomaly in EXPHYCOM was consistent with the outermost zeta contour (Figure 8E), indicating the impact of the geostrophic eddy current. The contribution of the cross-track advection in both experiments showed the same pattern: positive in the central area and negative in the surroundings. In contrast with the result in EXPCLIMAT, EXPHYCOM also presented a more important contribution of cross-track advection due to the influence of CE2, although along-track advection was more prominent. The contribution of vertical advection was negligible in both experiments for the change in SST (not shown), which was consistent with the results of Lin et al. (2017).
Overall, the contributions of mixing, along-track advection and cross-track advection to the SST anomaly were all enhanced by CE2 (Figure 8), resulting in an intensified rightward-shifted cold wake during Typhoon Soulik. The enhanced SST anomaly that was induced by mixing mainly occurred in the central area, i.e., within 50 km of the track of the typhoon, without the rightward-shifted signal. Thus, eddy-related advection played a dominant role in the rightward-shifted cold wake in EXPHYCOM.
A temperature budget analysis at M2 was conducted to further quantify the contributions of mixing and advection to the rightward-shifted cold wake (Figures 9, 10). In both EXPHYCOM and EXPCLIMAT, strong sea surface cooling, e.g., a temperature anomaly of more than -1°C, appeared immediately before the passage of the typhoon and rapidly deepened to approximately 50 m within several hours (Figures 9A, B). The sea surface cooling was -6.94°C in EXPHYCOM (Figure 9A), while the contributions of vertical mixing and advection were -4.24°C and -2.71°C, respectively (Figures 9D, G). Thus, vertical mixing dominated the SST response, with a contribution of 61% to sea surface cooling, which is in agreement with the results of previous studies (e.g., Price, 1981; Lin et al., 2017). The accumulated contribution of total advection to the surface temperature anomaly gradually increased as Typhoon Soulik approached, reaching its maximum on July 11, right after the typhoon passed M2. Advection contributed 39% to sea surface cooling; in contrast, horizontal diffusion had a negligible contribution (not shown).
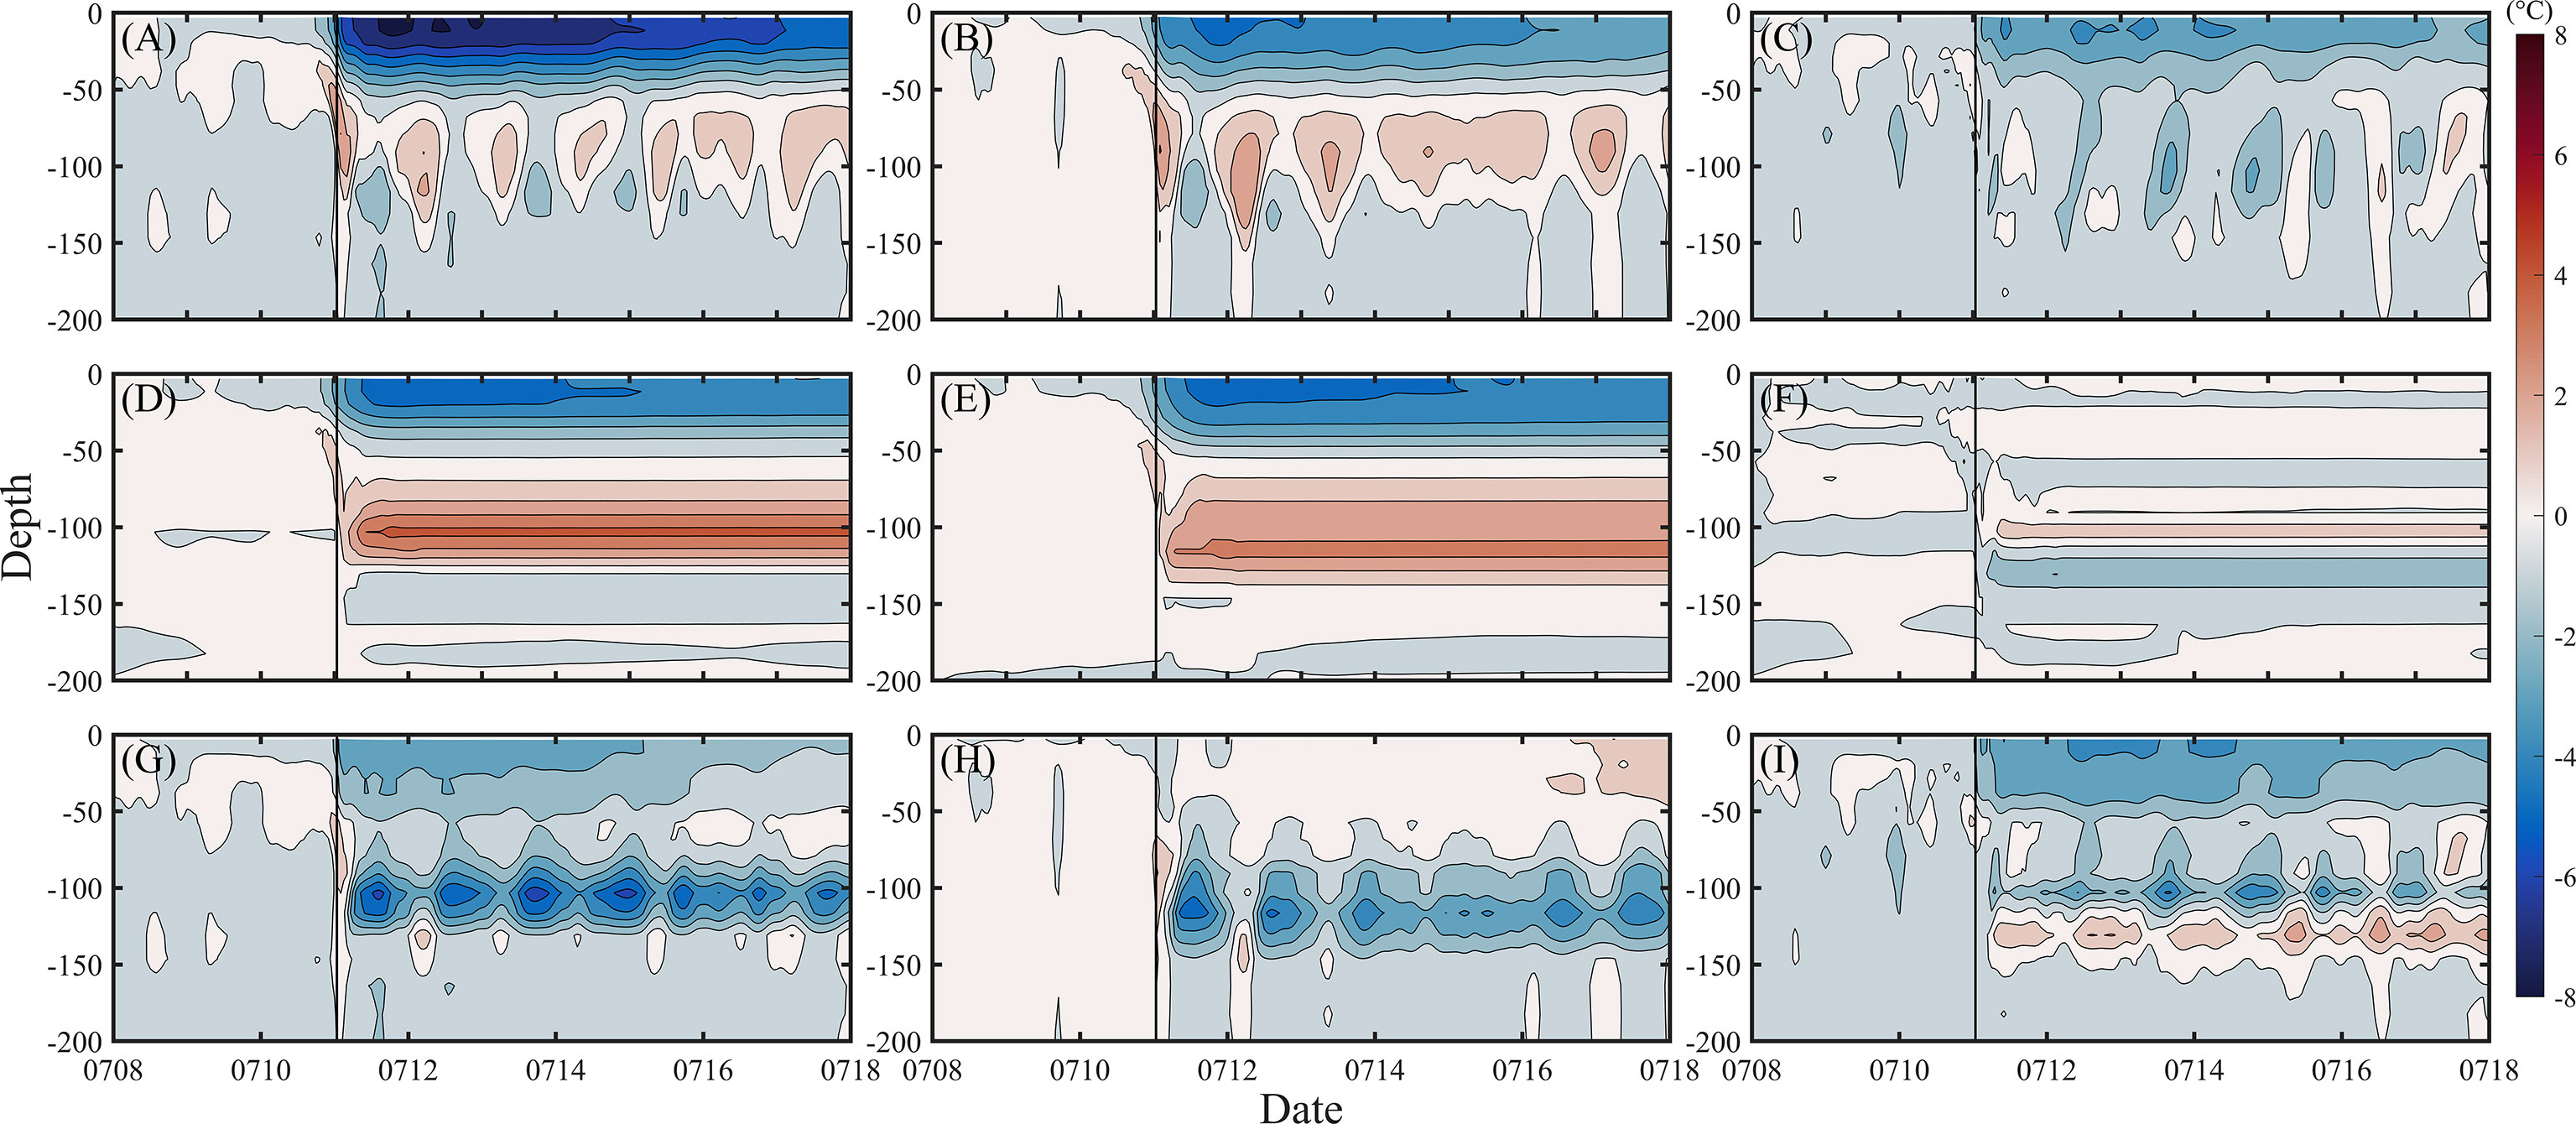
Figure 9 Modeled upper ocean temperature anomaly at M2 in (A) EXPHYCOM, (B) EXPCLIMAT, and (C) their difference; accumulated contribution of vertical mixing to the temperature anomaly in (D) EXPHYCOM, (E) EXPCLIMAT and (F) their difference; accumulated contribution of advection to the temperature anomaly in (G) EXPHYCOM, (H) EXPCLIMAT and (I) their difference. The differences are obtained by subtracting the EXPCLIMAT values from the EXPHYCOM values.
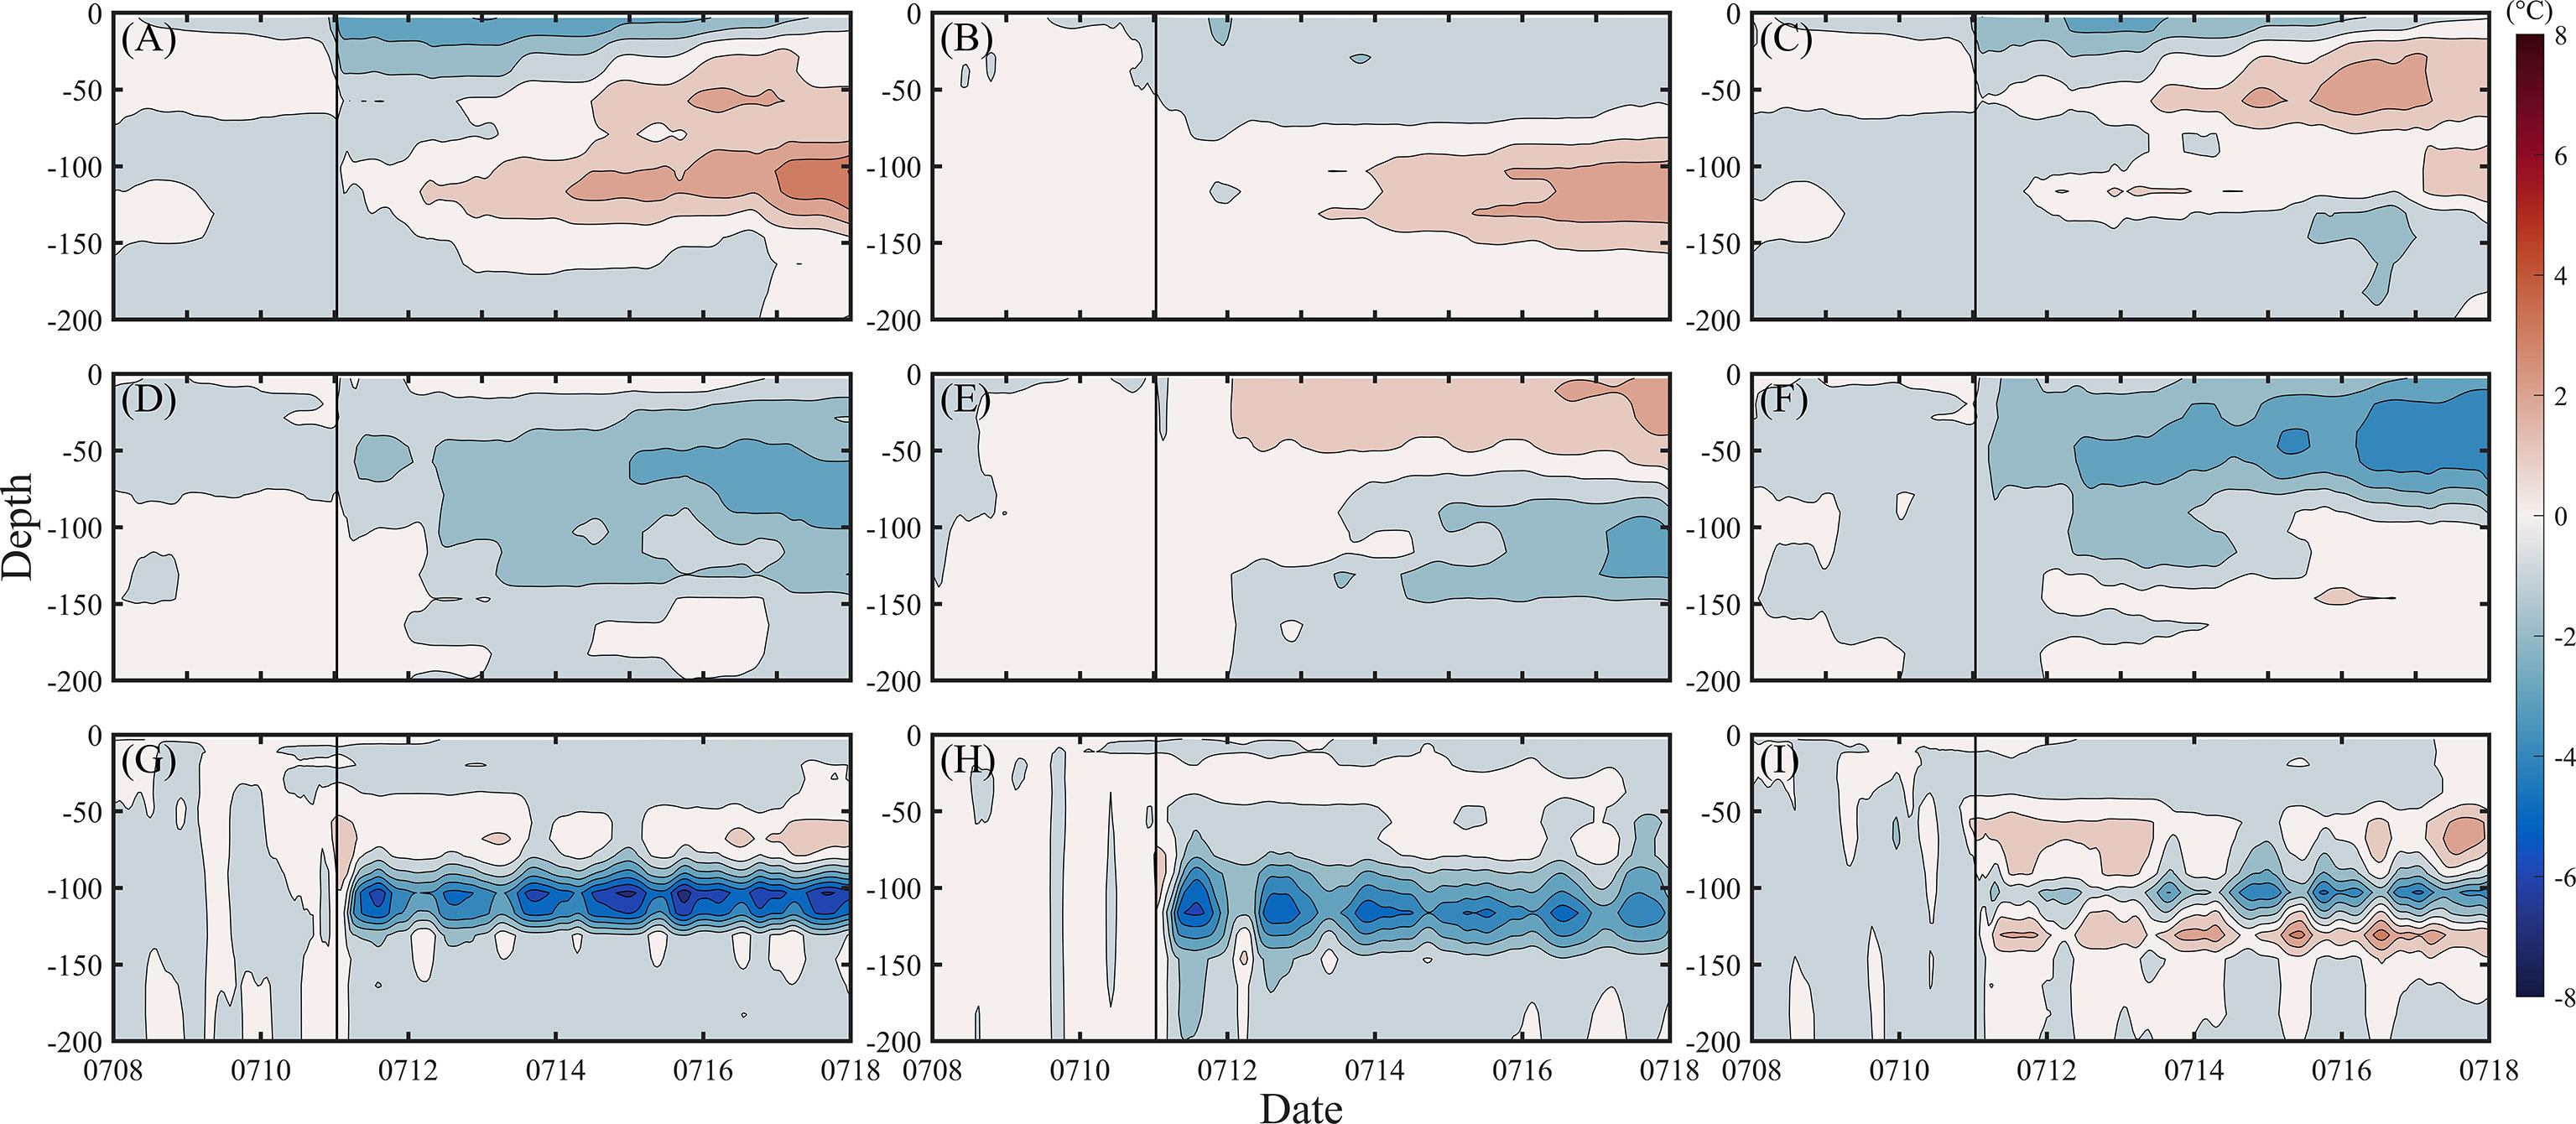
Figure 10 Modeled accumulated contribution of a long-track advection to the temperature anomaly in (A) EXPHYCOM, (B) EXPCLIMAT and (C) their difference; modeled accumulated contribution of cross-track advection to the temperature anomaly in (D) EXPHYCOM, (E) EXPCLIMAT and (F) their difference; modeled accumulated contribution of vertical advection to the temperature anomaly in (G) EXPHYCOM, (H) EXPCLIMAT and (I) their difference. The differences are obtained by subtracting the EXPCLIMAT values from the EXPHYCOM values.
The sea surface cooling in EXPCLIMAT was -4.26°C (Figure 9B), and the contributions of vertical mixing and advection were -4.30°C and 0.06°C, respectively (Figures 9E, H). Compared to EXPHYCOM, vertical mixing played a more important role in EXPCLIMAT by contributing all of the sea surface cooling. Without preexisting CEs, advection was driven by typhoon-generated currents, which suppressed cooling by introducing a small positive temperature anomaly.
Under the influence of the typhoon, the sea surface cooling in EXPHYCOM was 2.68°C greater than that in EXPCLIMAT (Figure 9C). The vertical mixing in EXPHYCOM actually caused a smaller temperature anomaly in sea surface cooling compared to that in EXPCLIMAT (Figure 9F). Instead, the total advection in EXPHYCOM induced a much larger decrease in SST (-2.71°C) than that (+0.06°C) in EXPCLIMAT (Figure 9I). The advection in EXPHYCOM was induced by a combined impact of typhoon-generated currents and eddy-related currents, and the latter processes were not incorporated in EXPCLIMAT. Thus, advection due to eddy-related currents played a dominant role in enhancing sea surface cooling by introducing an additional negative temperature anomaly at M2.
The representativeness of the cooling pattern at M2 was further assessed over an area of 1°, i.e., 111 km in the along-track direction and 111 km in the cross-track direction, centering around M2. During the passage of the typhoon, the area-averaged sea surface temperature anomaly in EXPHYCOM (-6.27°C) was -2.20°C lower than that in EXPCLIMAT (-4.07°C). Correspondingly, the enhancement of sea surface cooling due to vertical mixing (-4.09°C and -3.31°C) and advection (-2.18°C and -0.76°C) contributed 35% and 65% in EXPHYCOM and EXPCLIMAT, respectively. The advection still played a dominant role in the eddy-induced enhancement of the area-averaged sea surface cooling at M2, indicating that M2 can represent the cooling core area related to the eddy-induced dynamics.
The advection effect consists of three terms: (along-track advection), (cross-track advection), and (vertical advection), and their contributions at M2 are shown in Figure 10. In EXPHYCOM, along-track advection (-2.72°C) contributed a majority of the temperature anomaly (-2.71°C) induced by advection (Figure 10A). The cross-track advection contributed a negligible role of 0.01°C (Figure 10D). In EXPCLIMAT, cross-track advection caused a positive temperature anomaly (0.89°C) that was mostly offset by along-track advection (-0.84°C) (Figures 10B, E). In both EXPHYCOM and EXPCLIMAT, the contribution of vertical advection to sea surface cooling was negligible due to the small vertical temperature gradient and vertical current in the mixed layer (Figures 10G, H). In comparison, upwelling caused an obvious negative temperature anomaly in the subsurface at an approximately 100 m depth due to the large vertical temperature gradient in the thermocline (Figures 10G, H). However, this negative temperature anomaly was mostly counteracted by the positive temperature anomaly that was induced by vertical mixing (Figures 9D, E).
A comparison of the three advection terms between EXPHYCOM and EXPCLIMAT is shown in Figures 10C, F, I. At the forcing stage (-0.5 to 0.5 days, Sanford et al., 2011), along-track advection was almost the sole advection process that directly induced a negative temperature anomaly (Figure 10C). The cross-track advection enhanced sea surface cooling after the forcing stage (Figure 10F). The along-track and cross-track advection terms contributed -1.88°C (68%) and -0.89°C (32%), respectively, to the enhancement of the average sea surface cooling. The difference in vertical advection was insignificant since the process offered a limited contribution to sea surface cooling in both EXPHYCOM and EXPCLIMAT.
The averaged along-track and cross-track components of the current at M2 from July 8 to July 10, 2013, were both negative (in the moving direction of the typhoon or to the left of the typhoon track) with values of -0.24 m/s and -0.05 m/s, respectively (Figures 11A, B). For a CE, negative along-track and cross-track components of the current indicate that it is located to the northwest of the eddy (Yang et al., 2013; Zhang et al., 2018). The corresponding along-track temperature gradient is negative, and the cross-track temperature gradient is positive. Specifically, the average at M2 was -5.7×10⁻⁶°C/m, and the average was 5.5×10⁻⁶°C/m in EXPHYCOM during this period. Therefore, the along-track advection was negative, and the cross-track advection was positive, which is in agreement with the model results at M2 before the approach of the typhoon (Figure 10A). Since the magnitudes of the along-track current and temperature gradient were higher than their corresponding cross-track values, along-track advection was dominant before July 10, resulting in a negative temperature anomaly due to eddy advection. The advection-induced temperature anomaly averaged from 0000 UTC on July 8 to 0000 UTC on July 10 at M2 in EXPHYCOM was -0.082°C.
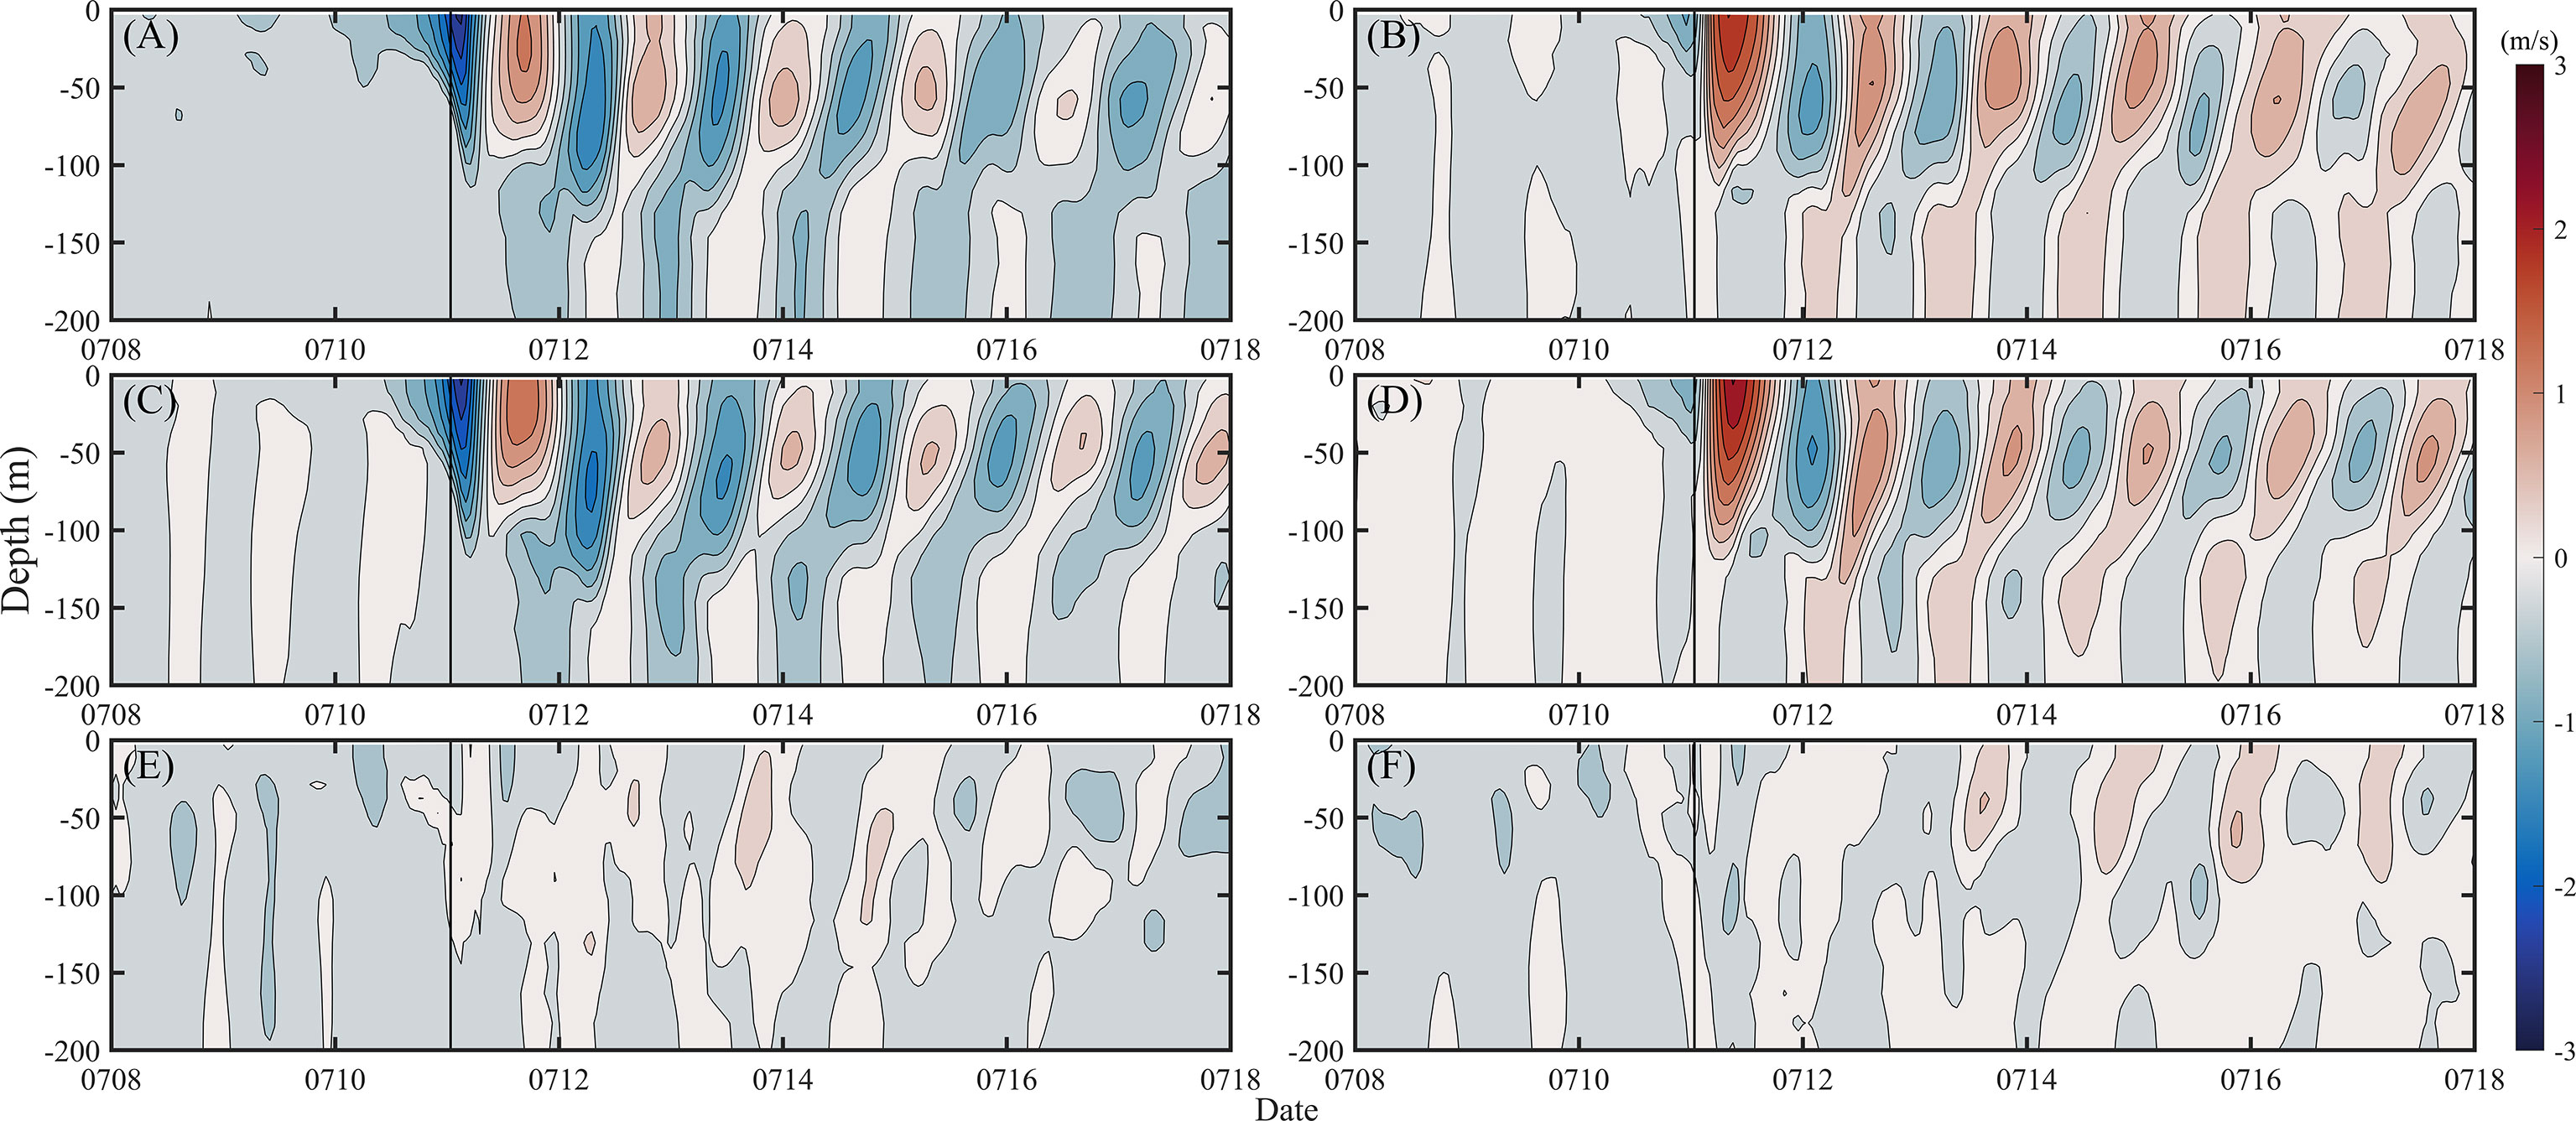
Figure 11 The along-track velocity of (A) EXPHYCOM and (C) EXPCLIMAT, the cross-track velocity of (B) EXPHYCOM and (D) EXPCLIMAT, and the difference in the (E) along-track velocity and (F) cross-track velocity between EXPHYCOM and EXPCLIMAT.
On July 10, a cold wake appeared to the east of M2 (Figure 3) that increased the magnitude of the negative along-track temperature gradient at M2. Together with a strengthened along-track negative velocity (Figure 11), it induced a negative along-track advection effect , resulting in enhanced sea surface cooling at M2.
In this study, the along-track current located to the northwest of CE2 and to the right side of Typhoon Soulik also produced forward advection of the cold wake. Thus, the along-track advection enhanced the typhoon-induced sea surface cooling at M2 by strengthening the westward current and increasing the negative along-track temperature gradient. After July 10, although both the along-track velocity and temperature gradient fluctuated with time, the accumulated contribution of a long-track advection to the surface temperature anomaly was always negative (Figure 10), persistently enhancing sea surface cooling.
Typhoon Soulik drove a negative at M2, associated with a positive cross-track component of the current immediately after its passage. Thus, the cross-track advection effect, , was positive (Figure 10E). In contrast, the preexisting CE2 drove positive and negative cross-track current components at M2 that weakened the negative temperature gradient and the positive current, respectively. As a result, the cross-track advection effect decreased (enhanced cooling) due to the effect of CE2 in EXPHYCOM (Figure 10D), which was not reflected in EXPCLIMAT (Figure 10E).
Although a larger temperature gradient was identified below the mixed layer at M2 within the preexisting CE in EXPHYCOM (Figure 7), vertical mixing did not drive a larger temperature anomaly for sea surface cooling compared with that in EXPCLIMAT. In contrast, advection played a more important role in the enhancement of sea surface cooling. Considering the stable location of the eddy during the passage of the typhoon, the advection was mainly attributed to the eddy-related anticlockwise current instead of the eddy movement, as demonstrated in Ning et al. (2019).
To determine why the contribution of mixing to the surface temperature anomaly at M2 was smaller in EXPHYCOM than in EXPCLIMAT, the contribution of advection to the subsurface temperature anomaly and the vertical temperature gradient due to the preexisting CE was examined to understand the subsequent contribution of mixing to the surface temperature anomaly. When the advection of the cold wake associated with the preexisting CE enhanced the sea surface cooling at M2, it also affected the subsurface temperature anomaly (Figures 9G, I). In the subsurface layer (70-130 m), the accumulated temperature anomaly induced by advection was initially positive and rapidly became negative in both EXPHYCOM and EXPCLIMAT due to the passage of Typhoon Soulik. Vertical advection played a dominant role in the temperature anomaly in this layer (Figures 10G, H), while the contributions of a long-track and cross-track advections were very small (Figures 10A, B, D, E).
The vertical advection tended to strengthen the vertical temperature gradient by inducing subsurface cooling, which enhanced the mixing-induced sea surface cooling (Figures 10G, H). This was in agreement with the results of previous studies that more than half of the storm-core sea surface cooling was neglected if the effect of upwelling was not considered for slow-translating TCs (Yablonsky and Ginis, 2009; Chiang et al., 2011). However, there was little difference in the value of subsurface cooling induced by upwelling in EXPHYCOM and EXPCLIMAT (Figures 10G–I), indicating that CEs made little contribution to the change in the vertical temperature gradient induced by vertical advection.
The along-track advection reduced the vertical temperature gradient, as it induced obviously greater sea surface cooling compared with that in the subsurface (Figures 10A, B). Moreover, as the sea surface cooling induced by a long-track advection in EXPHYCOM was more significant than that in EXPCLIMAT, the reduction in the vertical temperature gradient induced by a long-track advection was larger in EXPHYCOM than that in EXPCLIMAT, indicating the modification effect of the preexisting CE on the vertical temperature gradient by a long-track advection.
The sea surface cooling induced by cross-track advection was larger than that at the subsurface in EXPHCYOM, indicating a decrease in the vertical temperature gradient induced by cross-track advection (Figure 10D). However, there was only a small difference in the temperature anomaly between the surface and subsurface in EXPCLIMAT (Figure 10E), implying a negligible contribution to the vertical temperature gradient. Therefore, compared to the result without CEs, preexisting CEs in EXPHCYOM could decrease the vertical temperature gradient by cross-track advection.
Overall, preexisting CEs tended to reduce the vertical temperature gradient by horizontal advection, which may offset the larger temperature gradient at M2 within the preexisting CEs, resulting in less sea surface cooling induced by mixing with a larger temperature gradient.
Considering that the effect of eddy-related advection on the SST response was related to the relative locations of the mesoscale ocean eddies to the typhoon track, the eddy-related current could lead to forward advection of the typhoon-induced cold wake when the along-track component of the eddy-related current was consistent with the moving direction of a typhoon. The scenario was also valid for the effect of anticyclonic oceanic eddies; for example, when a preexisting oceanic anticyclonic eddy was located to the right of a typhoon track, the along-track current in the fourth quadrant of the eddy led to forward advection of the cold wake, enhancing sea surface cooling (Yablonsky and Ginis, 2013). On the other hand, Ning et al. (2019) found that CE-induced horizontal advection weakened sea surface cooling and increased subsurface warming. Due to the complex oceanic dynamics during the passage of typhoons and the coeffect of mesoscale eddies, further study is required for more cases with three-dimensional observations.
Based on remote sensing SST data, a unique multicore structure of sea surface cooling was observed after the passage of Typhoon Soulik (2013) in the western North Pacific. The spatial pattern of the three sea surface cooling cores matched the locations of the three preexisting CEs well, suggesting the impact of preexisting CEs on enhancing sea surface cooling during the passage of Typhoon Soulik.
The multicore structure of the SST response during Typhoon Soulik was perfectly reproduced by a coupled ocean-atmosphere model. Two numerical experiments with and without preexisting CEs were conducted to determine the mechanisms of the eddy in modulating the typhoon-induced SST cooling structure.
The numerical experiment comparison demonstrated that the strengthened vertical stratification and eddy-related current in preexisting CEs enhanced sea surface cooling with a rightward-shifted pattern. Compared with the climatological initial field, the strengthened vertical stratification with a larger temperature gradient below the mixed layer in the CEs drove intensified vertical mixing, leading to greater sea surface cooling. The enhanced SST anomaly induced by mixing was located beneath the center of the typhoon, without a rightward-shifted signal. Advection due to eddy-related currents drove the rightward-shifted pattern of enhanced sea surface cooling. Additionally, along-track advection contributed to the enhancement of sea surface cooling at the cooling center. As the typhoon moved westward, a cold wake was introduced to the east of the CE, which strengthened the along-track temperature gradient. The eddy-driven westward current, together with the strengthened negative along-track temperature gradient, induced along-track advection of the cold wake that further enhanced the sea surface cooling at the cooling center.
Previous studies have identified the relationship between preexisting CEs and sea surface cooling during the passage of typhoons. A larger temperature gradient in a CE elevated typhoon-induced vertical mixing and upwelling, thus enhancing sea surface cooling. Meanwhile, the translation of a CE can also impact the temperature response to a tropical cyclone (Ning et al., 2019). Our study suggested another possible mechanism for a CE to modulate and intensify typhoon-induced sea surface cooling via horizontal advection due to eddy-related currents.
The Argo data were provided by the International Argo Program (http://www.argo.ucsd.edu), a part of the Global Ocean Observing System. The tropical cyclone data were obtained from the Joint Tropical Cyclone Warning Center (https://www.metoc.navy.mil/jtwc/jtwc.html). The SST data were taken from the Tropical Rain Measuring Mission Microwave Imager (https://data.remss.com/SST/daily/mw/v05.0/), and the SLA data were taken from AVISO (ftp://ftp.aviso.oceanobs.com).
W-ZZ designed the study. SL conducted the analysis and wrote the first draft. YW reviewed and modified the manuscript. CF provided valuable insights and suggestions on the topic. All authors contributed to the article and approved the submitted version.
This work was jointly funded by the National Natural Science Foundation of China (No. 41776015, 42030708), Fundamental Research Fund of Second Institute of Oceanography, MNR (No. JB2117), the State Key R&D project (2022YFF0801404), and the project supported by Southern Marine Science and Engineering Guangdong Laboratory (Zhuhai) (No. SML2021SP207).
The authors declare that the research was conducted in the absence of any commercial or financial relationships that could be construed as a potential conflict of interest.
All claims expressed in this article are solely those of the authors and do not necessarily represent those of their affiliated organizations, or those of the publisher, the editors and the reviewers. Any product that may be evaluated in this article, or claim that may be made by its manufacturer, is not guaranteed or endorsed by the publisher.
Argo (2000). Argo float data and metadata from global data assembly centre (Argo GDAC). doi: 10.17882/42182
Chaigneau A., Eldin G., Dewitte B. (2009). Eddy activity in the four major upwelling systems from satellite altimetry, (1992–2007). Prog. Oceanogr. 83, 117–123. doi: 10.1016/j.pocean.2009.07.012
Chelton D. B., Gaube P., Schlax M. G., Early J. J., Samelson R. M. (2011). The influence of nonlinear mesoscale eddies on near-surface oceanic chlorophyll. Science 334, 328–332. doi: 10.1126/science.1208897
Chiang T.-L., Wu C.-R., Oey L.-Y. (2011). Typhoon kai-tak: an ocean’s perfect storm. J. Phys. Oceanogr. 41, 221–233. doi: 10.1175/2010jpo4518.1
Cummings J. A. (2005). Operational multivariate ocean data assimilation. Q. J. R. Meteor. Soc 131, 3583–3604. doi: 10.1256/qj.05.105
Emanuel K. A. (1986). An air-sea interaction theory for tropical cyclones. part I: steady-state maintenance. J. Atmos. Sci. 43, 585–605. doi: 10.1175/1520-0469(1986)043<0585:Aasitf>2.0.Co;2
Gill A. E. (1984). On the behavior of internal waves in the wakes of storms. J. Phys. Oceanogr. 14, 1129–1151. doi: 10.1175/1520-0485(1984)014<1129:otboiw>2.0.co;2
Ginis I. (2002). Tropical cyclone-ocean interactions in atmosphere-ocean interactions, advances in fluid machanics series. Ed. Perrie W. A. (Southampton, UK: WIT Press), 83–114.
Halliwell G. R., Shay L. K., Brewster J. K., Teague W. J. (2011). Evaluation and sensitivity analysis of an ocean model response to hurricane Ivan. Mon. Weather. Rev. 139, 921–945. doi: 10.1175/2010mwr3104.1
Jaimes B., Shay L. K. (2009). Mixed layer cooling in mesoscale oceanic eddies during hurricanes Katrina and Rita. Mon. Weather. Rev. 137, 4188–4207. doi: 10.1175/2009mwr2849.1
Jaimes B., Shay L. K. (2010). Near-inertial wave wake of hurricanes Katrina and Rita over mesoscale oceanic eddies. J. Phys. Oceanogr. 40, 1320–1337. doi: 10.1175/2010jpo4309.1
Jaimes B., Shay L. K. (2015). Enhanced wind-driven downwelling flow in warm oceanic eddy features during the intensification of tropical cyclone Isaac, (2012): observations and theory. J. Phys. Oceanogr. 45, 1667–1689. doi: 10.1175/jpo-d-14-0176.1
Jaimes B., Shay L. K., Halliwell G. R. (2011). The response of quasigeostrophic oceanic vortices to tropical cyclone forcing. J. Phys. Oceanogr. 41, 1965–1985. doi: 10.1175/jpo-d-11-06.1
Jan S., Chen C. C., Tsai Y. L., Yang Y. J., Wang J., Chern C. S., et al. (2011). Mean structure and variability of the cold dome northeast of Taiwan. Oceanography 24, 100–109. doi: 10.5670/oceanog.2011.98
Larson J., Jacob R., Ong E. (2005). The model coupling toolkit: a new fortran90 toolkit for building multiphysics parallel coupled models. Int. J. High Perform. Comput. Appl. 19, 277–292. doi: 10.1177/1094342005056115
Lin I. I., Wu C. C., Emanuel K. A., Lee I. H., Wu C. R., Pun I. F. (2005). The interaction of supertyphoon Maemi, (2003) with a warm ocean eddy. Mon. Weather. Rev. 133, 2635–2649. doi: 10.1175/Mwr3005.1
Lin S., Zhang W.-Z., Shang S.-P., Hong H.-S. (2017). Ocean response to typhoons in the western north pacific: composite results from argo data. Deep. Sea. Res. Pt. I. 123, 62–74. doi: 10.1016/j.dsr.2017.03.007
Li J., Sun L., Yang Y., Cheng H. (2020). Accurate evaluation of Sea surface temperature cooling induced by typhoons based on satellite remote sensing observations. Water 12 (5), 1413. doi: 10.3390/w12051413
Liu F., Tang S. (2018). Influence of the interaction between typhoons and oceanic mesoscale eddies on phytoplankton blooms. J. Geophys. Res. Oceans. 123, 2785–2794. doi: 10.1029/2017JC013225
Lu Z., Wang G., Shang X. (2020). Strength and spatial structure of the perturbation induced by a tropical cyclone to the underlying eddies. J. Geophys. Res. Oceans. 125, e2020JC016097. doi: 10.1029/2020jc016097
Ma Z., Fei J., Lin Y., Huang X. (2020). Modulation of clouds and rainfall by tropical cyclone’s cold wakes. Geophys. Res. Lett. 47, e2020GL088873. doi: 10.1029/2020GL088873
Ma Z., Fei J., Liu L., Huang X., Li Y. (2017). An investigation of the influences of mesoscale ocean eddies on tropical cyclone intensities. Mon. Wea. Rev. 145, 1181–1201. doi: 10.1175/MWR-D-16-0253.1
Mei W., Pasquero C. (2013). Spatial and temporal characterization of sea surface temperature response to tropical cyclones. J. Climate. 26, 3745–3765. doi: 10.1175/jcli-d-12-00125.1
Ning J., Xu Q., Zhang H., Wang T., Fan K. (2019). Impact of cyclonic ocean eddies on upper ocean thermodynamic response to typhoon soudelor. Remote Sens. 11 (8), 938. doi: 10.3390/rs11080938
Oey L. Y., Ezer T., Wang D. P., Fan S. J., Yin X. Q. (2006). Loop current warming by hurricane Wilma. Geophys. Res. Lett. 33, L08613. doi: 10.1029/2006gl025873
Prakash K. R., Pant V. (2017). Upper oceanic response to tropical cyclone phailin in the bay of Bengal using a coupled atmosphere-ocean model. Ocean. Dynam. 67, 51–64. doi: 10.1007/s10236-016-1020-5
Price J. F. (1981). Upper ocean response to a moving hurricane. J. Phys. Oceanogr. 11, 153–175. doi: 10.1175/1520-0485(1981)011<0153:uortah>2.0.co;2
Price J. F. (1983). Internal wave wake of a moving storm. part 1: scales, energy budget and observations. J. Phys. Oceanogr. 13, 949–965. doi: 10.1175/1520-0485(1983)013<0949:iwwoam>2.0.co;2
Qiu C., Liang H., Sun X., Mao H., Wang D., Yi Z., et al. (2021). Extreme Sea-surface cooling induced by eddy heat advection during tropical cyclone in the north Western pacific ocean. Front. Mar. Sci. 8. doi: 10.3389/fmars.2021.726306
Sanford T. B., Price J. F., , Girton J. B. (2011). Upper-ocean response to hurricane Frances (2004) observed bypProfiling em-apex floats. J. Phys. Oceanogr. 41, 1041–1056. doi: 10.1175/2010jpo4313.1
Shay L. K., Elsberry R. L. (1987). Near-inertial ocean current response to hurricane Frederic. J. Phys. Oceanogr. 17, 1249–1269. doi: 10.1175/1520-0485(1987)017<1249:Niocrt>2.0.Co;2
Shay L. K., Goni G. J., Black P. G. (2000). Effects of a warm oceanic feature on hurricane opal. Mon. Weather. Rev. 128, 1366–1383. doi: 10.1175/1520-0493(2000)128<1366:Eoawof>2.0.Co;2
Shchepetkin A. F., McWilliams J. C. (2005). The regional oceanic modeling system (ROMS): a split-explicit, free-surface, topography-following-coordinate oceanic model. Ocean. Model. 9, 347–404. doi: 10.1016/j.ocemod.2004.08.002
Skamarock W. C., Klemp J. B., Dudhia J., Gill D. O., Barker D. M., Wang W., et al. (2008). A description of the advanced research WRF version 3. NCAR technical note-475+ STR. (University Corporation for Atmospheric Research). doi: 10.13140/RG.2.1.2310.6645
Sun L., Yang Y., Xian T., Lu Z., Fu Y. (2010). Strong enhancement of chlorophyll a concentration by a weak typhoon. Mar. Ecol. Prog. Ser. 404, 39–50. doi: 10.3354/meps08477
Vincent E. M., Lengaigne M., Madec G., Vialard J., Samson G., Jourdain N. C., et al. (2012a). Processes setting the characteristics of sea surface cooling induced by tropical cyclones. J. Geophys. Res. 117, C02020. doi: 10.1029/2011jc007396
Vincent E. M., Lengaigne M., Vialard J., Madec G., Jourdain N. C., Masson S. (2012b). Assessing the oceanic control on the amplitude of sea surface cooling induced by tropical cyclones. J. Geophys. Res. 117, C05023. doi: 10.1029/2011jc007705
Walker N. D., Leben R. R., Balasubramanian S. (2005). Hurricane-forced upwelling and chlorophyll a enhancement within cold-core cyclones in the gulf of Mexico. Geophys. Res. Lett. 32, L18610. doi: 10.1029/2005gl023716
Wang Y. (2020). Composite of typhoon induced sea surface temperature and chlorophyll-a responses in the south China Sea. J. Geophys. Res. Oceans. 125, e2020JC016243. doi: 10.1029/2020JC016243
Warner J. C., Armstrong B., He R., Zambon J. B. (2010). Development of a coupled ocean–atmosphere–wave–sediment transport (COAWST) modeling system. Ocean. Model. 35, 230–244. doi: 10.1016/j.ocemod.2010.07.010
Warner J. C., Sherwood C. R., Signell R. P., Harris C. K., Arango H. G. (2008). Development of a three-dimensional, regional, coupled wave, current, and sediment-transport model. Comput. Geosci. 34, 1284–1306. doi: 10.1016/j.cageo.2008.02.012
Wei J., Jiang G.-Q., Liu X. (2017). Parameterization of typhoon-induced ocean cooling using temperature equation and machine learning algorithms: an example of typhoon Soulik, (2013). Ocean. Dynam. 67, 1179–1193. doi: 10.1007/s10236-017-1082-z
Wei J., Liu X., Wang D.-X. (2014). Dynamic and thermal responses of the kuroshio to typhoon Megi, (2004). Geophys. Res. Lett. 41, 8495–8502. doi: 10.1002/2014gl061706
Wu C.-C., Lee C.-Y., Lin I. I. (2007). The effect of the ocean eddy on tropical cyclone intensity. J. Atmos. Sci. 64, 3562–3578. doi: 10.1175/jas4051.1
Wu R., Zhang H., Chen D., Li C., Lin J. (2018). Impact of typhoon Kalmaegi, (2014) on the south China Sea: simulations using a fully coupled atmosphere-ocean-wave model. Ocean. Model. 131, 132–151. doi: 10.1016/j.ocemod.2018.08.004
Xu F., Yao Y., Oey L., Lin Y. (2017). Impacts of pre-existing ocean cyclonic circulation on sea surface chlorophyll-a concentrations off northeastern Taiwan following episodic typhoon passages. J. Geophys. Res. Oceans. 122, 6482–6497. doi: 10.1002/2016jc012625
Yablonsky R. M., Ginis I. (2009). Limitation of one-dimensional ocean models for coupled hurricane–ocean model forecasts. Mon. Weather. Rev. 137, 4410–4419. doi: 10.1175/2009mwr2863.1
Yablonsky R. M., Ginis I. (2013). Impact of a warm ocean eddy’s circulation on hurricane-induced sea surface cooling with implications for hurricane intensity. Mon. Weather. Rev. 141, 997–1021. doi: 10.1175/mwr-d-12-00248.1
Yang G., Wang F., Li Y., Lin P. (2013). Mesoscale eddies in the northwestern subtropical pacific ocean: statistical characteristics and three-dimensional structures. J. Geophys. Res. Oceans. 118, 1906–1925. doi: 10.1002/jgrc.20164
Zhang W.-Z., Ni Q., Xue H. (2018). Composite eddy structures on both sides of the Luzon strait and influence factors. Ocean. Dynam. 68, 1527–1541. doi: 10.1007/s10236-018-1207-z
Zhao X., Chan J. C. L. (2016). Changes in tropical cyclone intensity with translation speed and mixed-layer depth: idealized WRF-ROMS coupled model simulations. Q. J. R. Meteor. Soc. 143, 152–163. doi: 10.1002/qj.2905
Zheng Z.-W., Ho C.-R., Kuo N.-J. (2008). Importance of pre-existing oceanic conditions to upper ocean response induced by super typhoon hai-tang. Geophys. Res. Lett. 35, L20603. doi: 10.1029/2008gl035524
Zheng Z.-W., Ho C.-R., Zheng Q., Lo Y.-T., Kuo N.-J., Gopalakrishnan G. (2010). Effects of preexisting cyclonic eddies on upper ocean responses to category 5 typhoons in the western north pacific. J. Geophys. Res. 115, C09013. doi: 10.1029/2009jc005562
Keywords: oceanic response, typhoon, coupled atmosphere-ocean model, cyclonic eddy, horizontal advection
Citation: Lin S, Zhang W-Z, Wang Y and Chai F (2023) Mechanism of oceanic eddies in modulating the sea surface temperature response to a strong typhoon in the western North Pacific. Front. Mar. Sci. 10:1117301. doi: 10.3389/fmars.2023.1117301
Received: 06 December 2022; Accepted: 04 January 2023;
Published: 24 January 2023.
Edited by:
Xueming Zhu, Southern Marine Science and Engineering Guangdong Laboratory (Zhuhai), ChinaReviewed by:
Chao Chen, Zhejiang Ocean University, ChinaCopyright © 2023 Lin, Zhang, Wang and Chai. This is an open-access article distributed under the terms of the Creative Commons Attribution License (CC BY). The use, distribution or reproduction in other forums is permitted, provided the original author(s) and the copyright owner(s) are credited and that the original publication in this journal is cited, in accordance with accepted academic practice. No use, distribution or reproduction is permitted which does not comply with these terms.
*Correspondence: Wen-Zhou Zhang, endlbnpob3VAeG11LmVkdS5jbg==; Yuntao Wang, eXVudGFvLndhbmdAc2lvLm9yZy5jbg==
Disclaimer: All claims expressed in this article are solely those of the authors and do not necessarily represent those of their affiliated organizations, or those of the publisher, the editors and the reviewers. Any product that may be evaluated in this article or claim that may be made by its manufacturer is not guaranteed or endorsed by the publisher.
Research integrity at Frontiers
Learn more about the work of our research integrity team to safeguard the quality of each article we publish.