
94% of researchers rate our articles as excellent or good
Learn more about the work of our research integrity team to safeguard the quality of each article we publish.
Find out more
ORIGINAL RESEARCH article
Front. Mar. Sci., 03 July 2023
Sec. Marine Megafauna
Volume 10 - 2023 | https://doi.org/10.3389/fmars.2023.1116941
This article is part of the Research TopicPopulation Structure and Connectivity of Marine Turtles in the Pacific and Indian OceansView all 15 articles
 Suzanne E. Roden1*
 John B. Horne2
 Michael P. Jensen3
 Nancy N. FitzSimmons4
 George H. Balazs5Richard Farman6Jennifer Cruce Horeg7
 Jessy Hapdei8
 Maike Heidemeyer9
 T. Todd Jones10
 Lisa M. Komoroske11Colin J. Limpus12
 Shawn Murakawa10Rotney Piedra13Laura Sarti-Martínez14Tammy Summers15Miri Tatarata16Elizabeth Vélez17Patricia Zárate18
 Peter H. Dutton1
This study builds upon the current understanding of green turtle population genetic structure in the Pacific that has largely been based on mitochondrial DNA (mtDNA), by examining nuclear DNA (nDNA) diversity, regional connectivity, and male-mediated gene flow. A total of 1,111 nesting green turtle samples were analyzed with 10 microsatellite markers from 20 Pacific rookeries. Population differentiation (FST) was significant (p <0.05) in all but 8 of 190 pairwise rookery comparisons. Pairwise FST values and discriminant analysis of principal components (DAPC) revealed a defined East-West split consistent with mtDNA studies. Additionally, isolation-by-distance was evaluated with estimated effective migration surfaces (EEMS). The data indicated structure throughout the Pacific rookeries largely in agreement with stock structure defined by mtDNA studies, except for some areas on the Central American and Australian continental shelves, providing evidence of possible male-mediated gene flow. The series of analyses performed did indicate that male-mediated gene flow has likely occurred where breeding migration corridors of separate populations overlap with courtship areas. This may occur primarily along the margins of continents, including along Mexico and Central America in the East Pacific. Our study provides an ocean-wide baseline nDNA dataset for green turtle rookeries in the Pacific and reexamines the current thinking regarding the role of male turtles in the population dynamics of management units (MU) and to what extent nuclear gene flow occurs among designated MUs.
The green turtle (Chelonia mydas) is a highly migratory marine megaherbivore with a circumtropical species distribution but the global population has been substantially reduced from historic levels (Jackson, 2001). As a species, it has responded well to conservation protection in many instances (Broderick et al., 2006; Chaloupka and Balazs, 2007; Chaloupka et al., 2008; Valdivia et al., 2019), but multiple potential anthropogenic threats including pollution, incidental fishery bycatch, unregulated harvesting, and climate change still pose challenges for long-term persistence (Witherington et al., 2006; Wallace et al., 2011). All green turtle populations worldwide are presently listed as either Endangered or Threatened under the US Endangered Species Act (Seminoff et al., 2015) and the IUCN Red List of Threatened Species (Seminoff, 2004).
Due to complex life histories, involving early developmental oceanic phases and breeding migrations by adults (Seminoff et al., 2008; Dutton et al., 2019; Mettler et al., 2019; Shimada et al., 2020; Ferreira et al., 2021), green turtle ecology plays out on a broad geographic scale. Outside of the breeding season, population boundaries may overlap across large sections of the ocean as turtles from different breeding populations share foraging areas (Naro-Maciel et al., 2014). Conservation efforts, therefore, need to extend across international marine jurisdictions and require multinational coordination (Riskas et al., 2016).
Analysis of genetic markers provides a way to determine the population structure of wild animals (Allendorf, 2017; Larson et al., 2017). Various processes that act on genetic variation can differentiate populations into biologically meaningful units, and an important component of conservation and management is to identify and delineate the appropriate population units to conserve. However, the power to detect genetic structure can vary between different genetic markers and result in a lack of concordance, especially between mitochondrial (mt) DNA markers and nuclear (n) DNA markers (Toews and Brelsford, 2012; Teske et al., 2018).
As a molecular marker, mtDNA is useful for sea turtles because it is maternally inherited and captures signals of natal homing (Bowen and Karl, 2007). Mature female green turtles exhibit fidelity to both foraging and nesting habitats and show strong philopatry to natal nesting beaches/regions (Limpus et al., 1992; FitzSimmons et al., 1997a; Shimada et al., 2020). As such, mtDNA has been extensively used to identify different levels of conservation units, from evolutionarily significant units (ESUs) to discrete population segments (DPSs) and management units (MUs) (Moritz, 1994; Komoroske et al., 2017). More than three decades of population genetic studies using mtDNA have led to a good understanding of mtDNA stock structure of the major populations for all marine turtle species (Dutton et al., 1999; Dutton et al., 2013; Shamblin et al., 2014; Komoroske et al., 2017; Jensen et al., 2019; FitzSimmons et al., 2020). A total of 11 Distinct Population Segments (DPS) worldwide have been identified for C. mydas, under the US Endangered Species Act, based largely on mtDNA data (Seminoff et al., 2015). These are similar to the Regional Management Units (RMUs) delineated in Wallace et al. (2010). These DPS and RMU designations often include several smaller Management Units (MU) (genetic stocks) defined by mtDNA haplotype data (Moritz, 1994), as RMUs attempt to encompass the distribution of individuals across foraging and migratory habitats that may overlap in certain regions (Wallace et al., 2010).
The mitochondrial phylogeny of C. mydas populations across the Pacific Ocean displays a large genetic barrier between the West and Central/East Pacific rookeries with the Central/East Pacific populations all grouping within the same monophyletic clade (Jensen et al., 2019). The East Pacific clade is supported by unique morphological characteristics that were historically recognized as C. mydas agassizii (Álvarez-Varas et al., 2021). However, mtDNA frequently lacks resolving power due to a slow rate of nucleotide substitution (Avise et al., 1992) combined with the occurrence of shared control region haplotypes among rookeries (Komoroske et al., 2017). More recently, the use of additional Single Nucleotide Polymorphisms (SNPs) from whole mitogenome sequencing and short tandem repeats (mtSTR) with high mutation rates has helped improve the resolution of green turtle population structure (Frey et al., in prep; Tikochinski et al., 2012; Shamblin et al., 2015; Tikochinski et al., 2018; Shamblin et al., 2020; Karaman et al., 2022). However, exclusive use of these maternally linked mtDNA markers incompletely represent population connectivity by not accounting for male-mediated genetic patterns (FitzSimmons and Limpus, 2014; Komoroske et al., 2017). Therefore, the addition of nuclear DNA (nDNA) data allows inference of patterns that are biparentally determined to increase the resolution in population structure, including site fidelity and rookery connectivity.
Population genetic studies of green turtles using nDNA markers, such as microsatellite loci or SNPs, have been smaller in scope, regionally focused or have relied on relatively sparse sampling designs than those using mtDNA (FitzSimmons et al., 1995; FitzSimmons et al., 1997b; Roden et al., 2013; Bradshaw et al., 2018; Hamabata et al., 2020). Moreover, nDNA microsatellite results are often not congruent across studies and therefore are not fully comparable to larger and more geographically comprehensive mtDNA datasets for this species (e.g. Jensen et al., 2019). The absence of this type of broad-scale data potentially skews our perception of green turtle population patterns and means that the conservation action plans, which draw heavily on the mtDNA perspective to define the appropriate conservation units, could be improved. The purpose of this study was to create a nDNA population genetic dataset for Pacific green turtles that may be compared to the latest mtDNA findings (Jensen et al., 2019). To accomplish this we built on the previously published data of Roden et al. (2013), which used a suite of nDNA (microsatellites and SNPs) to assess population structure among five major Pacific green turtle rookeries. In the present study, we extend the microsatellite data to 20 green turtle rookeries scattered across the Pacific and bordering the Indian Ocean. These new pan-Pacific microsatellite data allow us to identify the extent of concordance between mtDNA and nDNA diversity at an ocean-basin scale, revise our understanding of population genetic structure, and may be used as a baseline for a number of macroecology and conservation genetic applications (Horne et al. 2023).
A total of 1,111 turtle blood or tissue samples were collected from 20 Chelonia mydas rookeries located across the East, Central, and West Pacific (Figure 1, Table 1, Supplementary Table 1). Here, a rookery (or deme) generally includes one or more beach nesting sites that are in close geographic proximity (<50 km) and are likely to be used by females from the same breeding population with a shared demographic history. Tagging studies show that females often nest on multiple nearby beaches (Alvarado and Figueroa, 1991; Dethmers et al., 2006; Fonseca et al., 2018) and this supported combining some adjacent nesting beaches into rookery units (Dutton et al., 2014b; Jensen et al., 2019) (Supplementary Table 1).
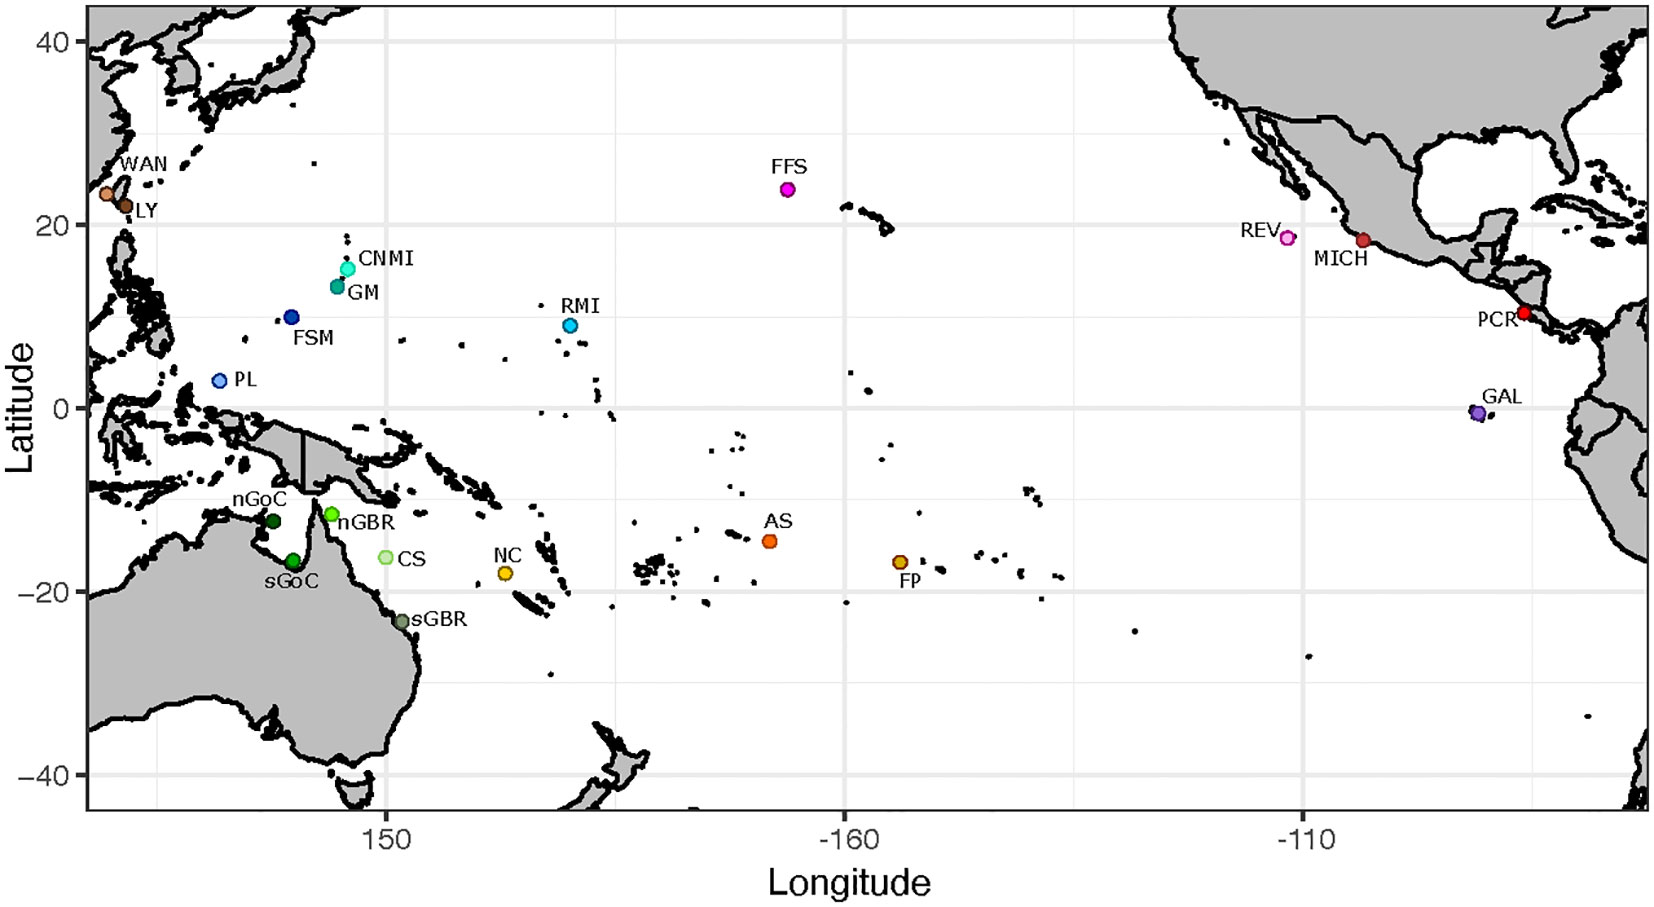
Figure 1 Map of rookery sites/sampling locations: WAN, Wan-An; Taiwan; LY, Lanyu; Taiwan; CNMI, Commonwealth of the Northern Mariana Islands; GM, Guam; FSM, Federated States of Micronesia; RMI, Republic of the Marshall Islands; PL, Palau; nGoC, northern Gulf of Carpentaria (Arnhemland);; sGoC, southern Gulf of Carpentaria (Bountiful Island); nGBR, Great Barrier Reef; Australia (Bramble Cay; Raine Is); sGBR, Great Barrier Reef; Australia (Lady Musgrave Is; Heron Is; Northwest Is); CS, Coral Sea; NC, New Caledonia; AS, American Samoa; FP, French Polynesia; FFS, French Frigate Shoals; Hawaii; REV, Isla Revillagigedo; Mexico; MICH, Colola; Michoacán; Mexico; PCR, Pacific Costa Rica; Guanacaste (Nombre de Jesus; Isla San Jose; Playa Colorada); GAL, Galapagos Islands; Ecuador.
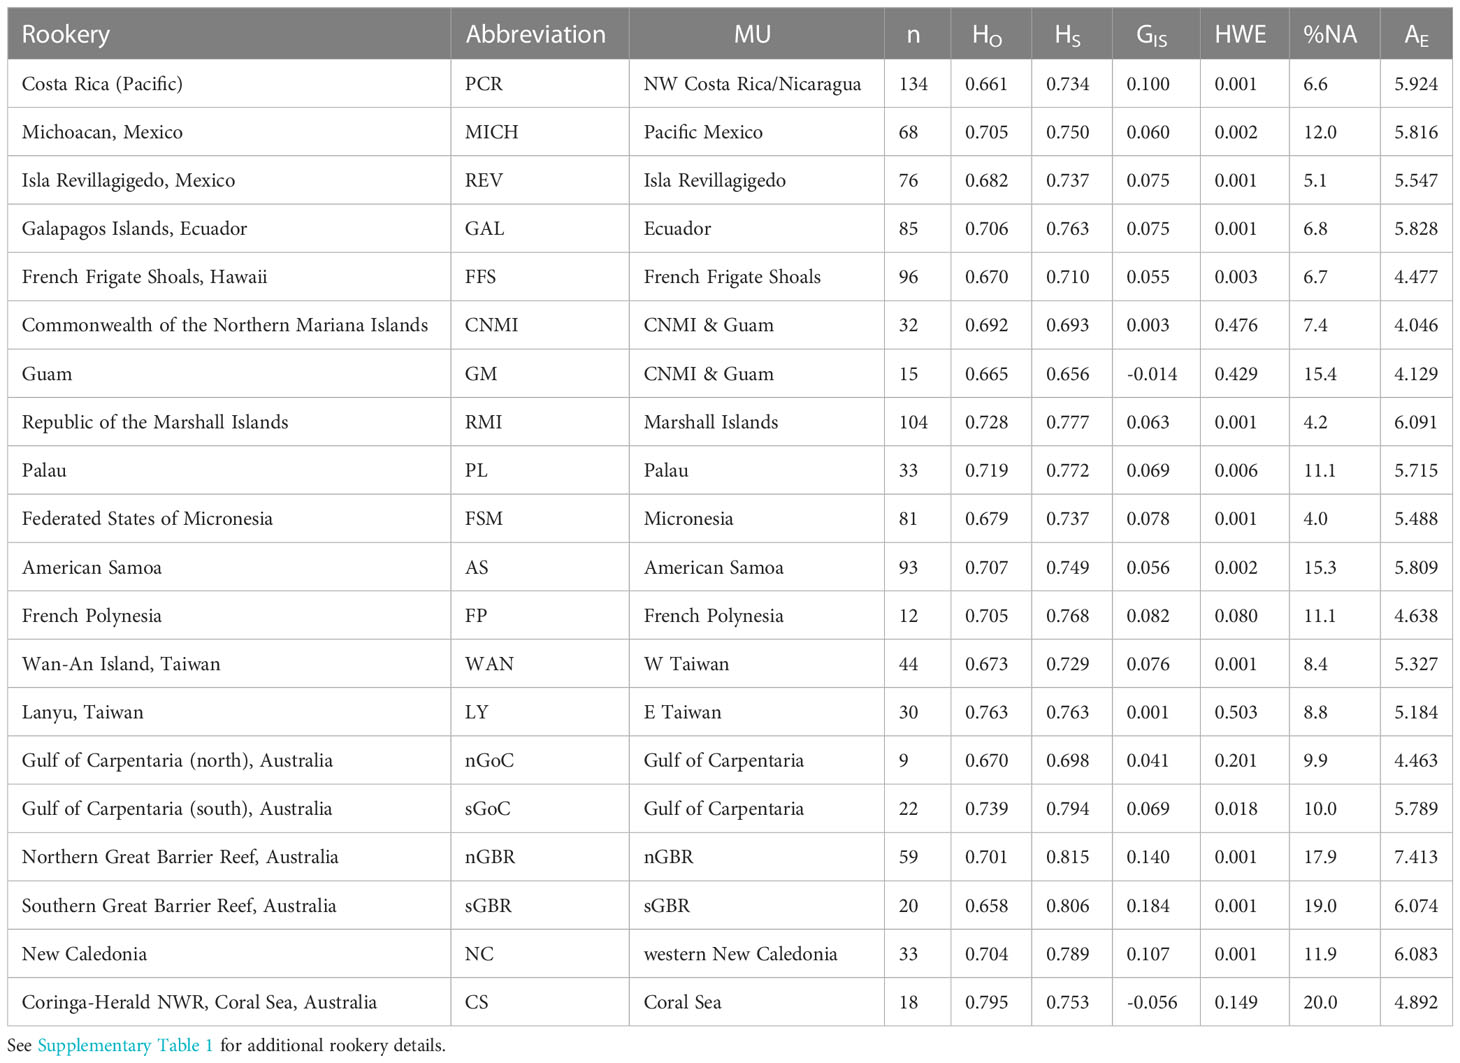
Table 1 Green turtle rookery sites and associated statistics across ten genomic microsatellite loci: sample collection location (rookery), rookery abbreviation, MtDNA management Unit (MU), number of samples genotyped (n), observed heterozygosity (HO), within-population heterozygosity (HS), global fixation index GIS (within -population inbreeding coefficient), p-values indicating the significance of departure from Hardy-Weinberg Equilibrium (HWE), percent missing data (%NA), and effective number of alleles (AE).
Samples, including some previously used in FitzSimmons et al. (1997a; 1997b); Dethmers et al. (2006); Roden et al. (2013), and Dutton et al. (2014a; 2014b) were collected between 1989 and 2017 from nesting females and dead hatchlings. Samples were preserved in 70% ethanol, a NaCl saturated 20% DMSO solution, or saturated NaCl solution as outlined in Dutton (1996). All samples were archived, stored (-20°C), processed, and analyzed at the Southwest Fisheries Science Center in La Jolla, California. Genomic DNA was extracted from tissues using multiple methods appropriate to tissue type, storage method, and condition (FitzSimmons et al., 1997b; Roden et al., 2013; Dutton et al., 2014b).
All samples in the study were genotyped using polymerase chain reaction (PCR) with ten microsatellite loci characterized in Dutton and Frey (2009); Frey et al. (2013), and Roden et al. (2013). Loci included A6, B108, B116, C102, D1, D108, D115, D2, D102, and D107 and each forward primer was labeled with one fluorescent tag, HEX or FAM. Microsatellite loci were amplified using approximately 2-15 ng template DNA and reaction conditions outlined in Dutton and Frey (2009) with the following adjustments: 0.1 mM each dNTP, 0.2 mg/ml bovine serum albumin (BSA), and 0.06 U/μl Taq DNA polymerase.
All PCR products, including positive and negative controls, were checked for amplification using 2% agarose gels with ethidium bromide staining (Sambrook et al., 1989). Amplified products were diluted and pooled in pairs of two loci per capillary (B116/D2, D115/C102, D107/D1, D108/D102, A6/B108). Pairs were chosen to avoid overlapping size ranges and genotyped with an ABI Prism 3730 DNA Analyzer using a ROX 500 fluorescent size standard (ABI, USA) and accompanying GeneMapper software v4.0 (Applied Biosystems) (see Supplementary Table 2 for genotype data). To facilitate consistency and normalization of allele sizes, standard reference samples with known genotypes were included within each PCR reaction plate to serve as positive controls. Approximately 20% of all samples were PCR amplified multiple times to replicate genotypes and assess the genotyping error rate across the microsatellite loci.
Possible duplicate samples were identified using StrataG (Archer et al., 2017) as samples sharing >90% of their genotype profiles, and removed if determined to be true duplicates. Samples with >30% missing data across 10 loci were also removed. To assess whether any of the loci were affected by PCR artifacts, we used Micro-Checker (Van Oosterhout et al., 2004) combined with the null.all() function of the PopGenReport R-package (Brookfield, 1996) to test for potential null alleles and allelic dropout. In addition, adjusted genotypes were generated in Micro-Checker for a locus with signs of a null allele to evaluate any influence on population structure analysis results. The number of missing genotype calls were also tested for correlation with the number of homozygous genotypes per rookery for each locus. If the relationship between missing data and homozygotes was positive and statistically significant, this was considered evidence of genotyping errors caused by null alleles or large allele dropout (Wang et al., 2012; Dharmarajan et al., 2013). The variation of GIS and GST was plotted to test for correlation in order to look for evidence that Wahlund effects or null alleles might be the cause of heterozygote deficiencies (Waples, 2015; De Meeûs, 2018). Genetic diversity estimates (number of alleles, observed heterozygosity, unbiased expected heterozygosity, allelic richness, effective number of alleles Ae, and fixation indices) were calculated in GenoDive v.3.0 (Meirmans, 2020). Tests for linkage disequilibrium (LD) and deviation from Hardy-Weinberg equilibrium (HWE) were performed in both Genepop v.4.7.0 (Rousset, 2008) and GenoDive v.3.0 to produce a comprehensive set of results. HWE results were reported after adjusting for multiple tests using a 95% confidence threshold and a Benjamini and Hochberg (1995) correction.
The program POWSIM v.4.0 (Ryman and Palm, 2006) was used to evaluate the statistical power of our microsatellite assay to detect genetic differentiation at various levels of FST for different sample sizes. This analysis simulates sampling from a specified number of populations that have reached predefined levels of divergence and estimates the probability of false negatives for population differentiation at the expected degree of divergence (Ryman et al., 2006). Genetic drift to FST levels of 0.001, 0.0025, 0.005, 0.01, 0.02, 0.03, and 0.04 was simulated using an effective population size (Ne) of 5,000 and varying the number of generations (t) accordingly (Ryman et al., 2006). The statistical power of our 10 microsatellite loci was assessed to determine their effectiveness in detecting differentiation across all rookeries, based on sample sizes of 10, 20, 50, 70, and 100 individuals. Analysis was repeated for regional subsets of 5 populations in the North Central and East Pacific, and 15 populations in the Western and South Pacific. Power is expressed as the proportion of significant outcomes (1,000 replicates, rejecting the null hypothesis (H0) of no allele frequency difference, or FST = 0 at p <0.05).
Tests for population differentiation with pairwise comparisons using several statistical divergence metrics including FST fixation index (Weir and Cockerham, 1984), F’ST (Meirmans and Hedrick, 2011), G’ST (Hedrick, 2005), G’’ST (Meirmans and Hedrick, 2011) and Jost’s D allelic differentiation measure (Jost, 2008) were performed in the R package StrataG v.2.1 (Archer et al., 2017) with strata schemes ranging from broad to fine scale. All pairwise comparison p-values were calculated using 10,000 permutations. Pairwise FST significance tests were reported after a Benjamini and Hochberg false-discovery rate correction (Benjamini and Hochberg, 1995). Furthermore, pairwise FST results that indicated a lack of significant differentiation were used to group some collection sites in close proximity into a single stratum.
Pairwise FST values were plotted on two axes after a principal coordinate analysis ordination (PCoA) in the R package APE v. 5.0 (Paradis and Schliep, 2019) to visualize emergent spatial patterns. Discriminant analysis of principal components (DAPC) was performed with the R package Adegenet v. 2.1.3 (Jombart and Ahmed, 2011) to explore spatial genetic patterns among rookeries. DAPC first transforms the data into uncorrelated principal components and then uses linear discriminant analysis to give the best differentiation of populations. Effectively, the analysis minimizes within population genetic variation while maximizing between population variation to visually represent the population structure in multivariate space. DAPC also provides a useful comparison to other estimates of population structure, as it does not assume LD or HWE and can be used to assess biases introduced by violations of these assumptions in other analyses. Loading values from DAPC were also used to deconstruct which loci contributed the most to the conserved variance on each discriminant analysis eigenvalue.
The relationship between genetic variation and geographic distance was explored using the program EEMS (Petkova et al., 2016). This analysis calculates the squared genetic differences across all markers (dissimilarity) between individually georeferenced genotypes and identifies areas that deviate from a linear isolation-by-distance (IBD) null model. Further, it divides the genetic variation into among-deme (rookery) and within-deme dissimilarity and interpolates them geographically to assess population connectivity (m) and genetic diversity (q) gradients, respectively. Custom migration matrices were given as input to test varying connectivity scenarios, from one-dimensional stepping-stone models to a full island model where all rookeries are allowed to directly exchange migrants with each other. The best migration matrix was chosen based on the fit between the observed and expected dissimilarity values and consistency with other population genetic analyses. Each analysis was run for 10 million iterations, discarding the first 3 million as burn-in and sampled from the MCMC using a thinning interval of 3,000. Analyses were run multiple times with different starting seeds to ensure random sampling, and the convergence of the MCMC was determined by visually assessing trace plots of log likelihoods.
Genotypes were generated for 1,111 individuals (representing 20 rookeries) across 10 microsatellite loci. After QC tests to remove potential duplicates and samples with greater than 30% missing genotype data, 1,064 samples were analyzed. No signs of linkage disequilibrium were detected in the data. The overall genetic diversity per locus ranged from 3-24 alleles, with 1.60 to 8.78 effective alleles (Table 2) with an average genotyping error rate of 0.02 across all loci. The observed heterozygosity among populations ranged from 0.658 to 0.795 (Table 1). Four loci (D108, D1, B116, C102) showed signs of heterozygote deficiency and consequently departed from HWE (Table 2). D108 deviated significantly from HWE in 16 of 20 rookeries, D1 in 7, B116 in 7, and C102 in 4 out of 20 rookeries (p < 0.05; see Supplementary Table 3). Significant heterozygote deficits were estimated across loci in 14 out of the 20 rookeries (Table 1). Microchecker results indicated that null alleles may be present in 15 of the rookeries for D108, and to a lesser extent for D1 (seven), B116 (four) and C102 (four) and null.all() produced similar results, with D108 the primary locus with potential null alleles. There was no evidence of large allelic dropout at any loci across all rookeries. GIS values in the four affected loci were all positive (Table 2) indicating heterozygote deficiencies, but GIS was not correlated with GST making HWE departures due to Wahlund effects unlikely (Waples, 2015). Null alleles were not likely to be driving heterozygote deficits, since the number of homozygotes was not correlated with missing data in any locus (Pearson’s r = -0.08 – 0.39, p = 0.08 – 0.86) ( Wang et al., 2012; Dharmarajan et al., 2013; Dąbrowski et al., 2015) and since GIS was not correlated with GST (De Meeûs, 2018). In order to further evaluate whether artifacts introduced by null alleles, especially in D108, might affect the results of standard population structure analysis, we conducted pairwise FST tests with and without the potentially problematic loci, as well as D108 allele frequencies adjusted for null alleles (see below).
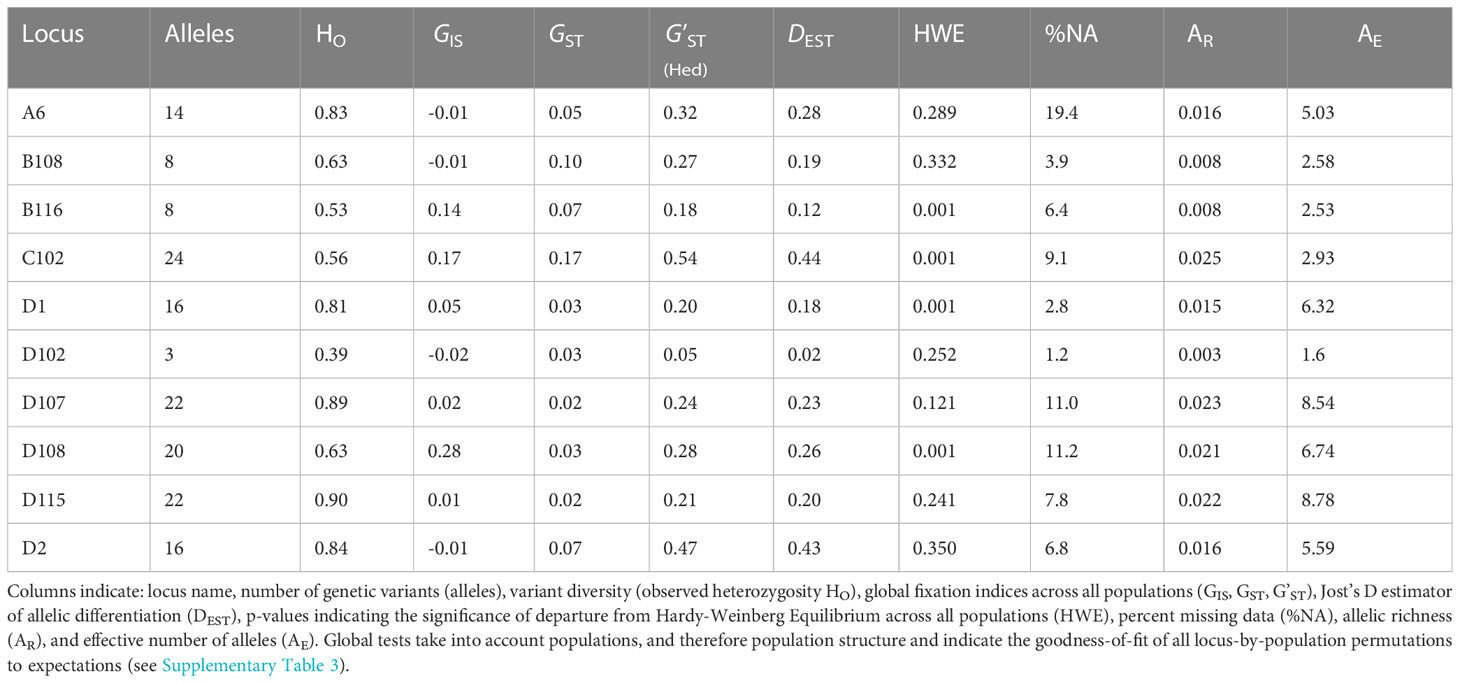
Table 2 Summary statistics for each of ten genomic microsatellite loci across all Pacific green turtle rookeries used in this study (individual locus-by-population permutations are detailed in Supplementary Table 3).
F’ST and G’’ST based on the full 10 loci yielded results that were similar to standard FST, but Jost’s D estimator sometimes indicated a lack of differentiation between rookeries where that would be unlikely, such as between Lanyu, Taiwan and Pacific Costa Rica (see Supplementary Table 4), which was inconsistent with other results. All but eight of 190 pairwise rookery comparisons indicated significant differentiation based on pairwise FST tests (p < 0.05; Figure 2, see Supplementary Table 4). Insignificant pairwise structuring was mostly found in the Southwest Pacific along the continental shelf of eastern Australia, or involved rookeries with sample sizes < 20 (Figure 2). Furthermore, population structure between the eastern and western Pacific was clear, as seen in the PCoA ordinations of pairwise FST values (Figure 3).
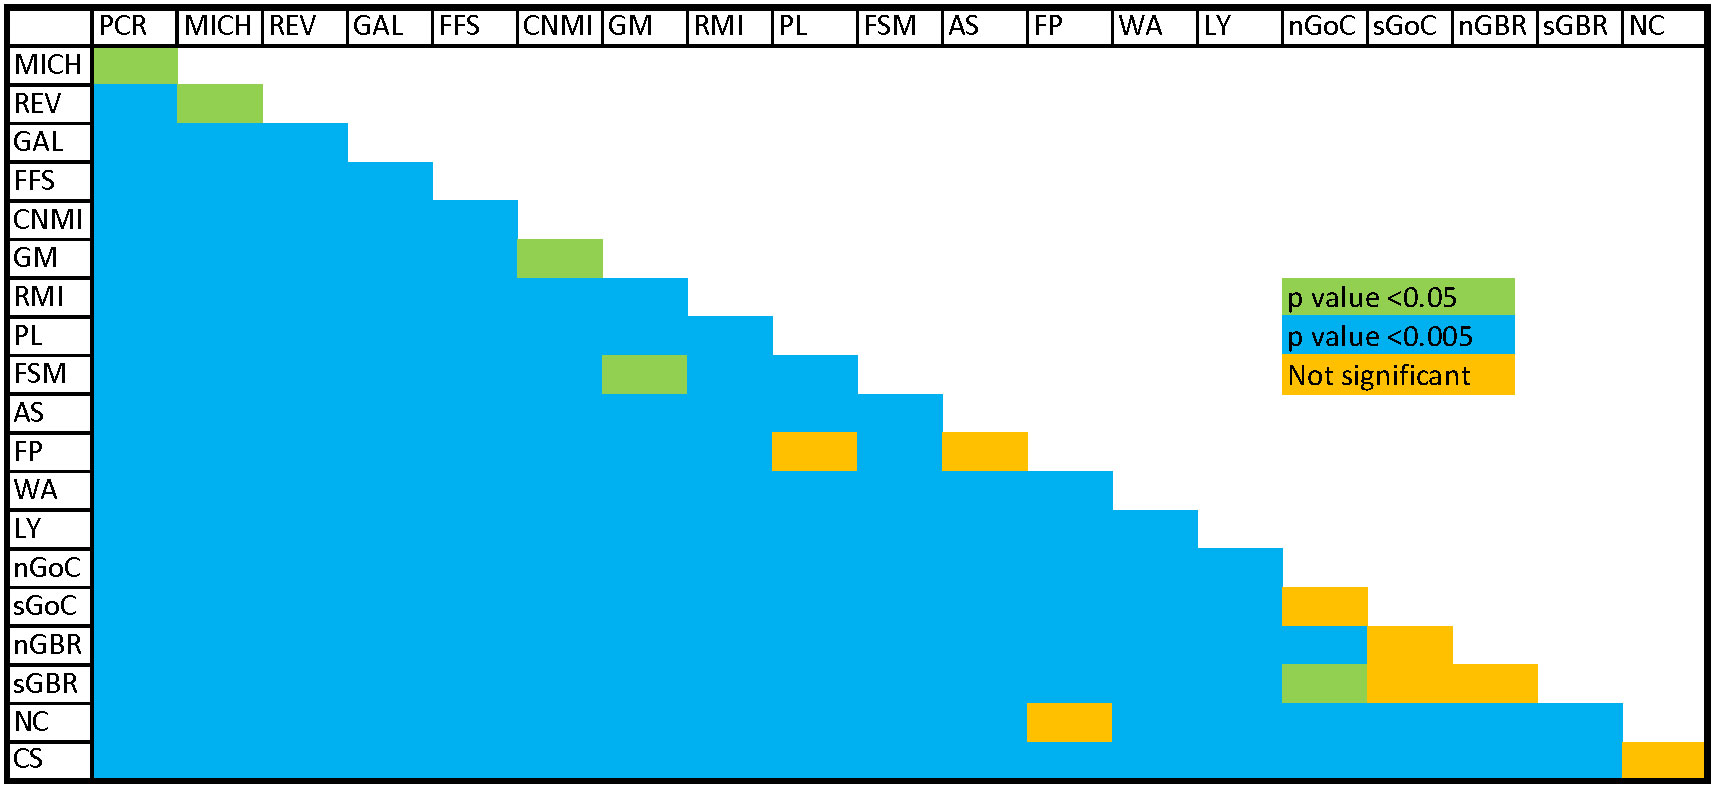
Figure 2 Results of pairwise FST tests (10 loci) (Blue, p <0.005; green, p <0.05; orange, p >0.05) PCR, Guanacaste, Costa Rica; MICH, Playa Colola, Michoacán, Mexico; REV, Islas Revillagigedo, Mexico; GAL, Galapagos Islands, Ecuador; FFS, French Frigate Shoals, Hawaii, USA; CNMI, Commonwealth of the Northern Mariana Islands, USA; GM, Guam, USA; RMI, Republic of the Marshall Islands; PL, Palau; WAN, Wan-an Island, Taiwan; LY, Lanyu Island, Taiwan; FSM, Federated States of Micronesia; AS, American Samoa, USA; FP, French Polynesia; nGoC, northern Gulf of Carpentaria, Northern Territory, Australia; sGoC, southern Gulf of Carpentaria, Queensland Australia; CS, Coral Sea Islands, Australia; sGBR, Southern Great Barrier Reef, Australia; nGBR, Northern Great Barrier Reef, Australia; NC, New Caledonia.
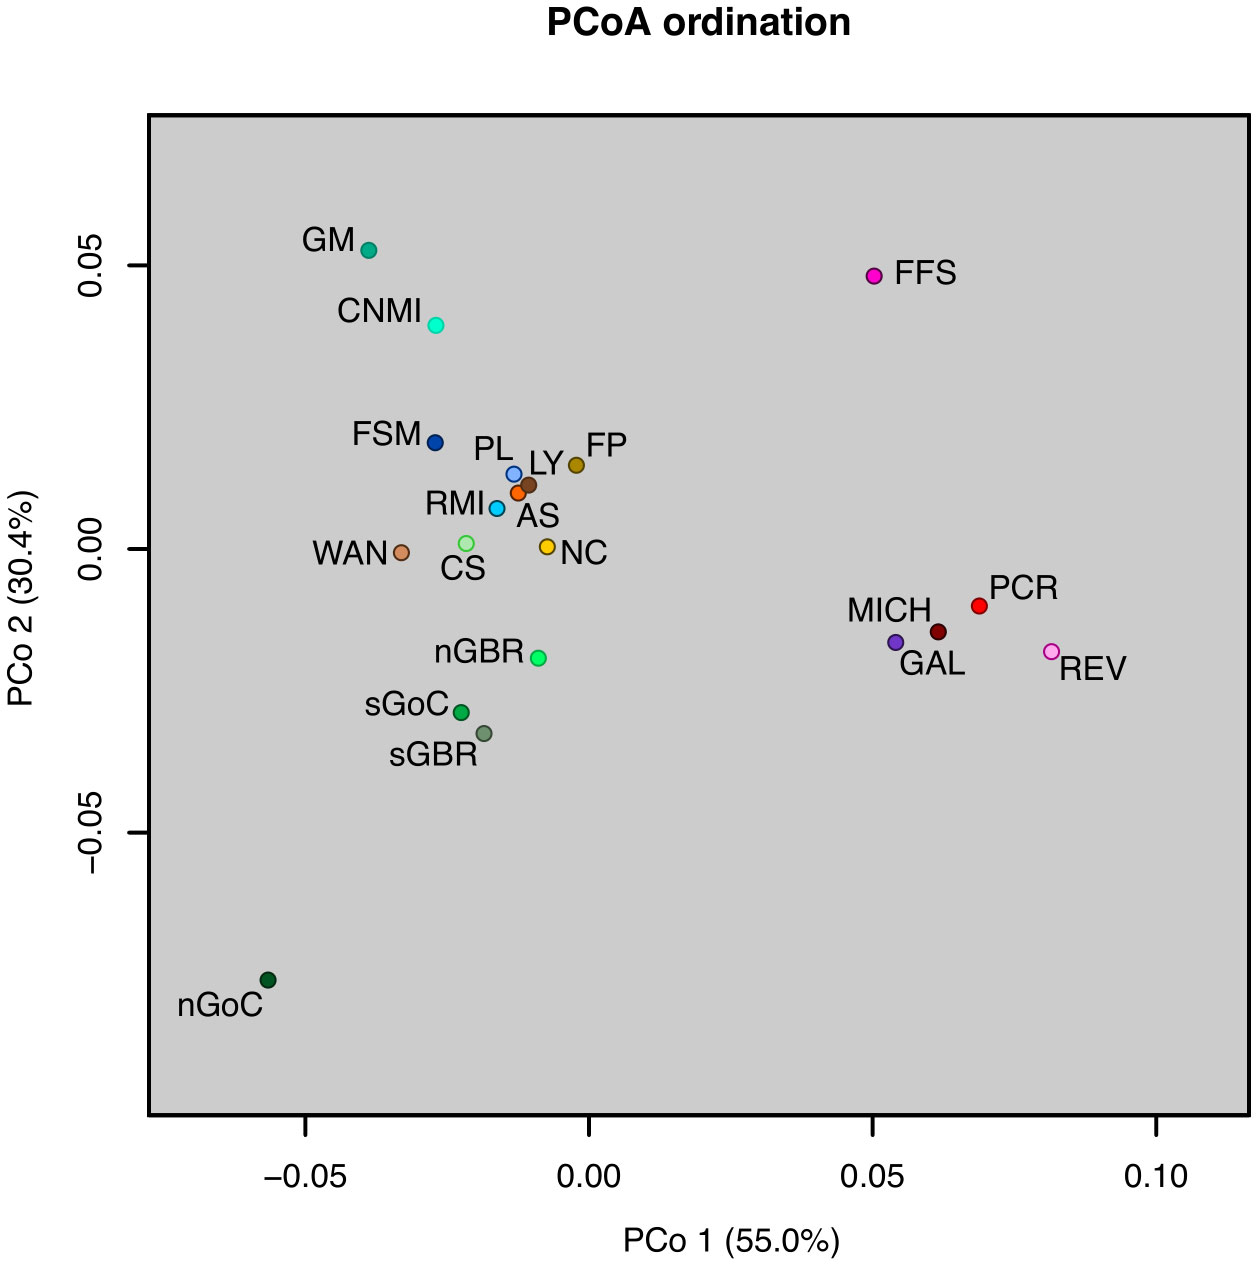
Figure 3 Principal Coordinates Analysis (PCoA) plot of pairwise FST values for 20 Pacific rookeries. The percentage of variation explained by each PCoA axis is given in parentheses. Objects ordinated closer to one another are more similar than those ordinated further away. Rookery codes follow those defined in Table 1.
Pairwise FST results based on nine loci (excluding the most potentially problematic locus, D108), yielded a similar outcome with regard to the pairwise comparisons that were not significantly different with 10 loci. However, with D108 removed, PCR and MICH as well as CS and sGBR were no longer significantly differentiated (Supplementary Table 5). When all 10 loci were included with allele frequencies for D108 adjusted for null alleles, the only difference was significant differentiation between nGoC and sGoC with the adjusted D108 dataset (Supplementary Table 6). Removal of all four potentially problematic loci (D108, B116, C102, and D1) resulted in further lack of significant differentiation between several populations in the West and Central Pacific. The broad geographic patterns of structure were still evident with the six loci dataset, as well as most of the finer scale patterns within the East Pacific (Supplementary Figure 2). In sum, while some loci displayed deviations from expectations, extensive exploration and testing of the data supported retaining every locus for subsequent analysis in order to optimize the ability to detect any finer scale structure that might exist.
Results of the POWSIM analysis for all 10 loci showed that the power to detect weak structure (FST = 0.001) was poor with sample sizes <50, but better for FST < 0.0025 with n >10 (see Supplementary Figure 1A). Power was robust for detecting weak structure (FST= 0.0025) with sample sizes >50 within the Central North and East Pacific (see Supplementary Figure 1B), and with sample sizes >20 in the Western and South Pacific (see Supplementary Figure 1C).
All DAPC results retained 100 principal components as predictors for discriminant analysis, and 98-99% of the conserved variance. The broad scale pattern for the DAPC analysis was consistent with pairwise population structure (Figures 2, 3), showing three distinct clusters for East, Central, and West Pacific rookeries (Figure 4A), and also reflected much the same spatial patterns within the East Pacific (Figure 4C), Northwest Pacific (Figure 4D), and Southcentral/Southwest Pacific (Figure 4B) as the pairwise results.
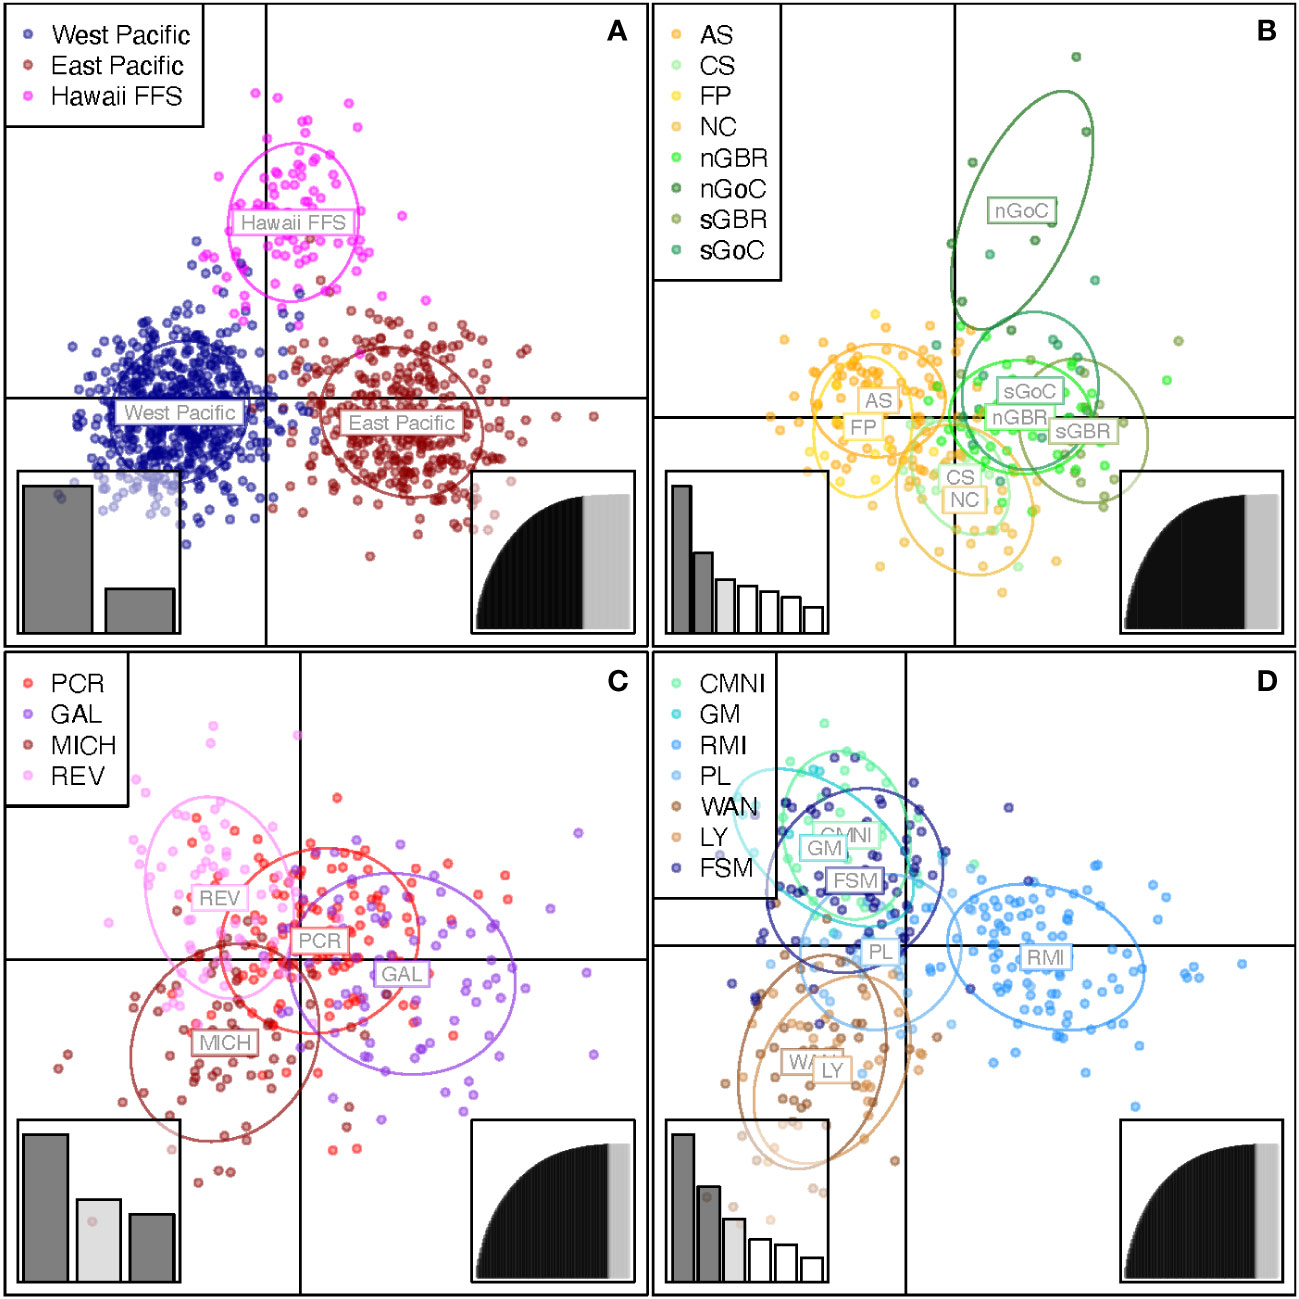
Figure 4 (A–D) DAPC scatter plots of green turtle genotypes: (A) all samples (top left), (B) southwest Pacific (top right), (C) eastern Pacific (bottom left), (D) northwest Pacific (bottom right). The number of discriminant analysis eigenvalues used for plotting is shown in the lower left-hand insert. Number of PCA eigenvalues retained as predictors for linear discriminant analysis and the proportion of the conserved genetic variation (x- and y-axes respectively) are shown in the lower right-hand insert. Rookery codes follow those defined in Table 1.
The most information-rich locus in the microsatellite panel based on the DAPC loading values was C102, which was also the most polymorphic locus, having 24 alleles (Table 2). With the exception of the Southwest Pacific, C102 alleles exhibited the highest loading values in all of our DAPC analyses, underscoring the value of retaining this locus (Pearman et al., 2022). In the broad-scale analysis, a single C102 allele accounted for 14% of the genetic variance between the East and West Pacific (axis 1, Figure 4A). Another C102 allele accounted for approximately 17% of the variance on axis 2 of the same plot, differentiating Hawaii from the rest of the Pacific (Figure 4A). The least important locus in terms of loading values appeared to be D102, which was also the least polymorphic, with only three alleles. Summing the variance contributions from all alleles for each locus revealed a positive and roughly linear relationship between loading values and the total number of alleles for all DAPC analyses (data not shown) suggesting that the informativeness of each locus was associated with allelic diversity.
EEMS analyses were performed on three subsets of the data (Northwest Pacific, Southwest Pacific, and East Pacific; Figures 5A–C, 6A–C, respectively), corresponding to the subsets used for DAPC, because the relationship between genetic dissimilarity and geographic distance was not uniform across regions. The East Pacific rookeries had the most IBD-like dissimilarity interpolations and the best migration matrix was a circular, one-dimensional stepping-stone model (Figure 5C). The coastal distance between MICH and PCR was a relatively good predictor of genetic dissimilarity between these two continental-shelf rookeries, which appear more similar to each other than to the oceanic islands of the East Pacific (Figure 5C). The most genetically diverse rookery in this region was GAL (Figure 6C). This diversity is the amount of genetic dissimilarity observed between individuals within rookeries, and not an expression of heterozygosity or the number of effective alleles, which did not identify this higher level of diversity (Table 1).
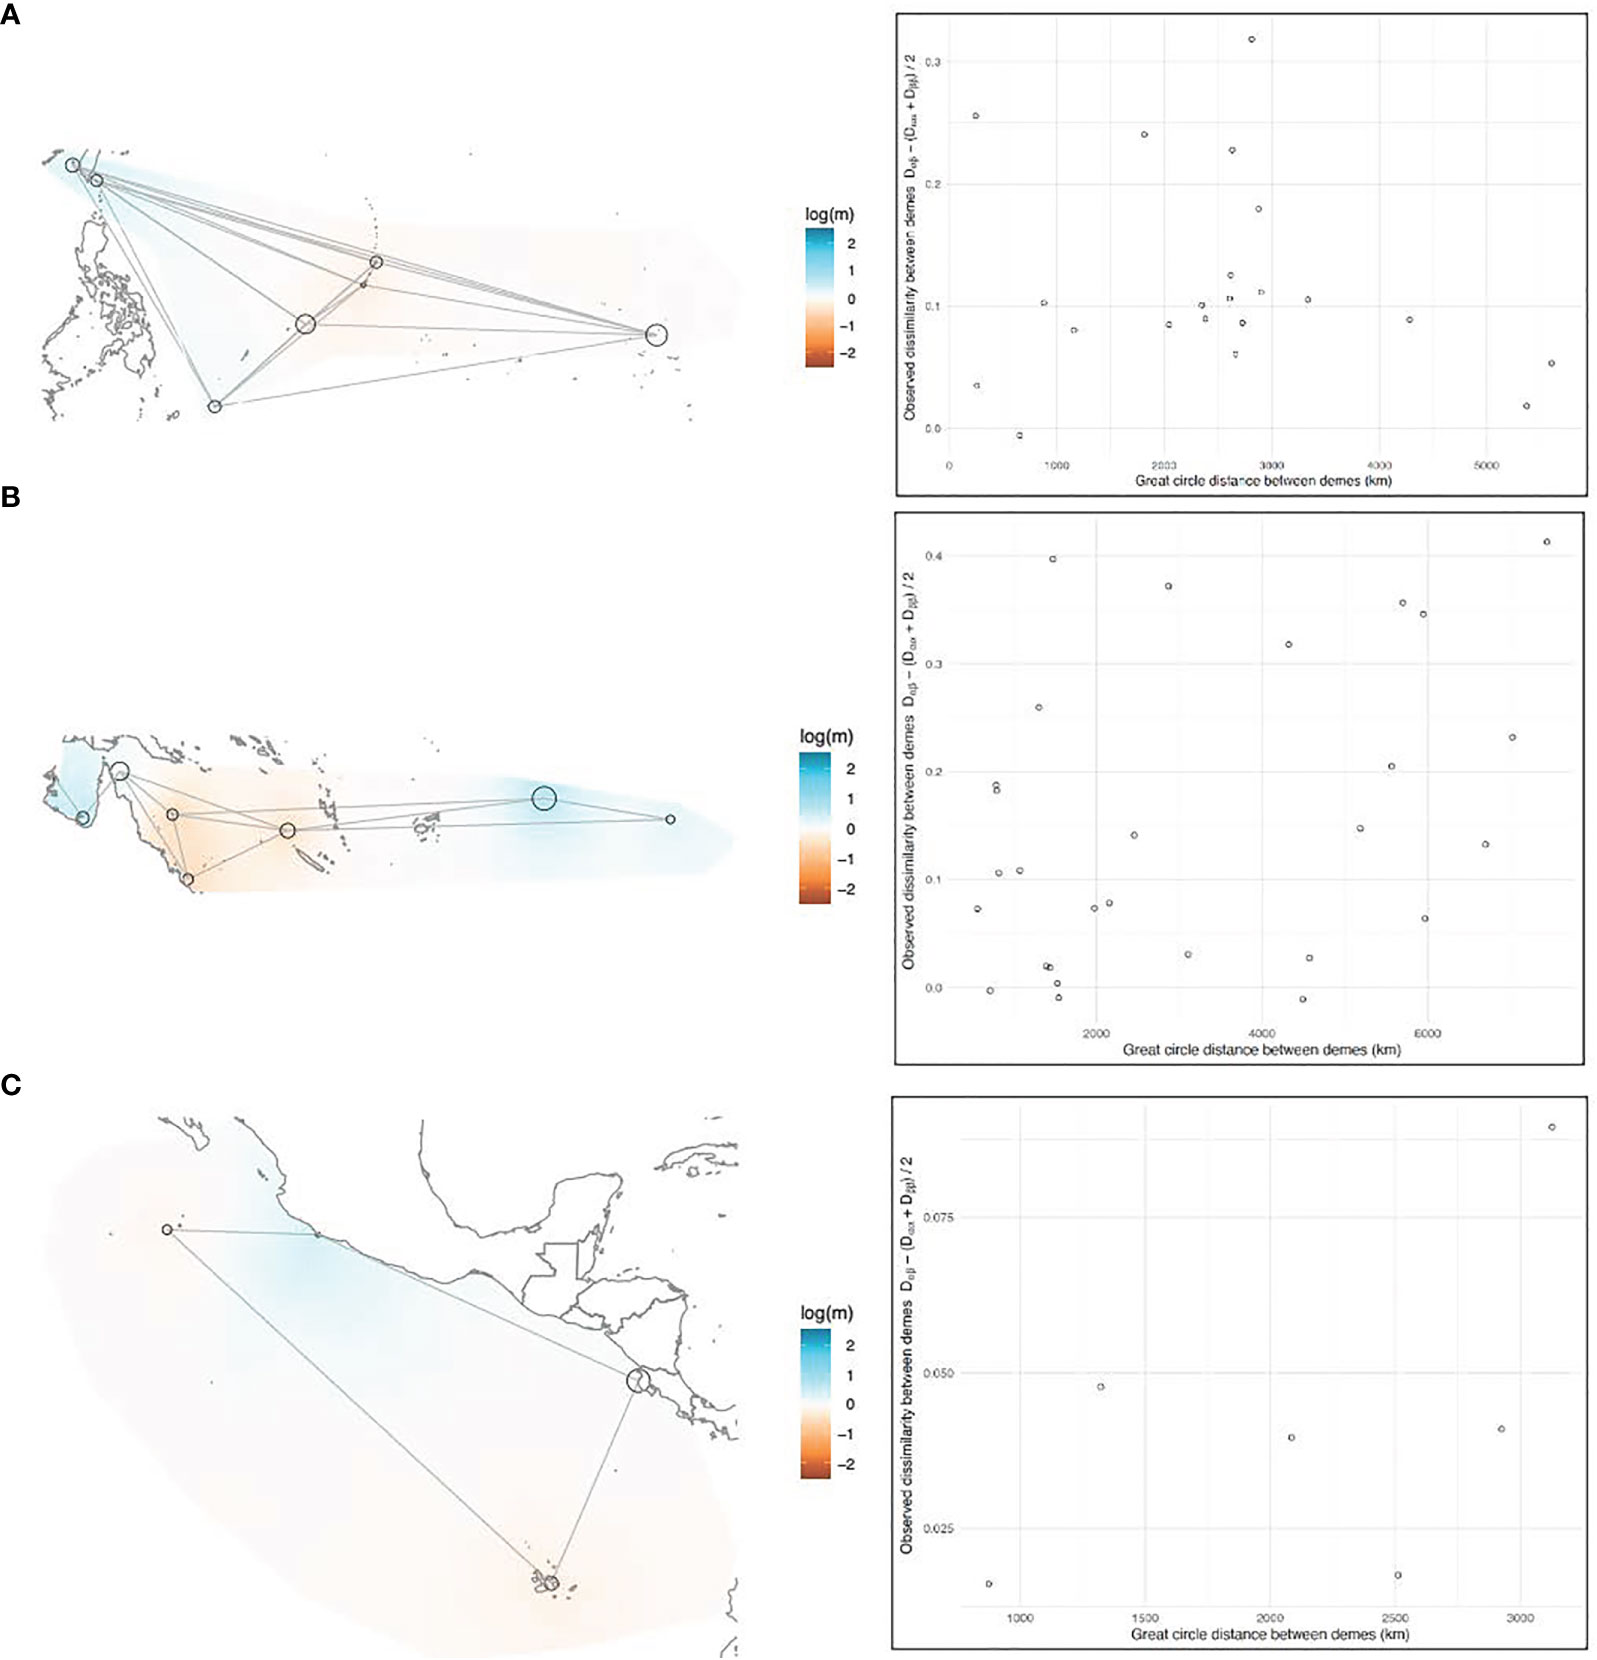
Figure 5 (A–C) EEMS results, left side: Maps of the (A) Northwestern, (B) Southwestern, and (C) Eastern Pacific showing the overlaying effective migration (m) surfaces. Black circles represent rookeries, with the diameter of the circle proportionate to the sample size. Gray lines represent the migration matrix that resulted in the best relationship between observed and fitted dissimilarity between rookeries. Migration surfaces are color-coded on a mean-centered log scale, where white patches are interpolations of linear isolation-by-distance between rookeries, and warm (red) and cool (blue) colored patches are interpolations of higher and lower migration than isolation-by-distance would predict, respectively. Right side: plotted correlation between observed genetic dissimilarity between rookeries and geographic distance (km).
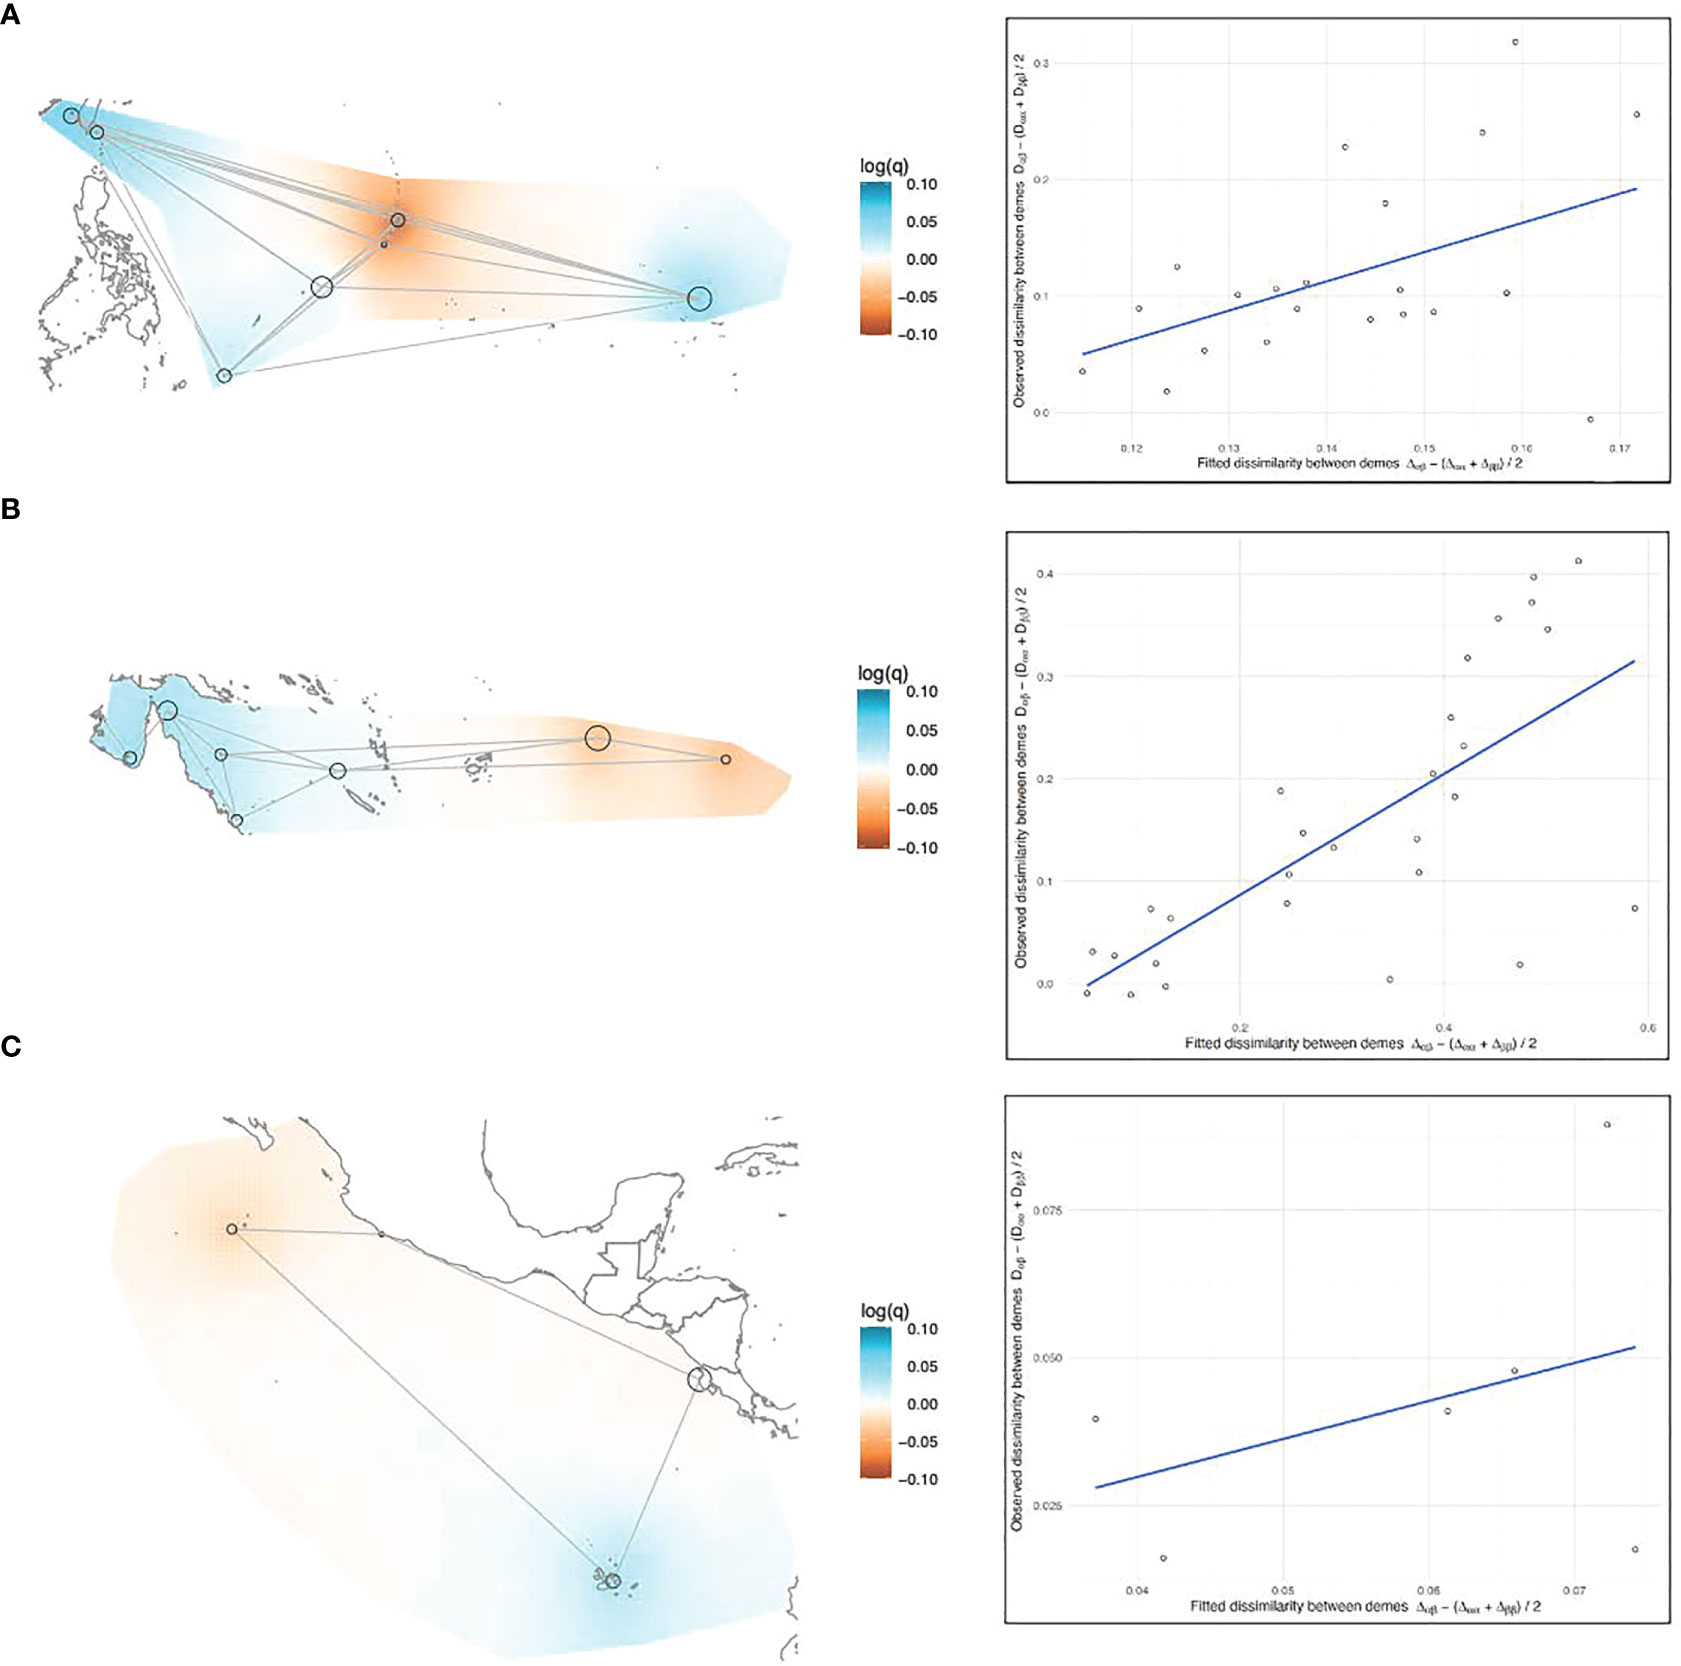
Figure 6 (A–C) EEMS results, left side: Maps of the (A) Northwestern, (B) Southwestern, and (C) Eastern Pacific showing the effective diversity (q) surfaces. Black circles represent rookeries, with the diameter of the circle proportionate to the sample size. Gray lines represent the migration matrix that resulted in the best relationship between observed and fitted dissimilarity. Diversity surfaces are interpolated gradients and color-coded on a mean-centered log scale where the colorless midpoint indicates a transition from above- to below-average diversity, or vice versa (e.g. red colored areas indicate rookeries less dissimilar [low within-deme diversity], and blue areas are more dissimilar [high within-deme diversity]). Right side: plotted relationship between observed genetic dissimilarity between rookeries and the fitted dissimilarity between rookeries predicted by the model.
In the West Pacific, geographic distance was a poor predictor of genetic dissimilarity between rookeries, above and below the equator (Figures 5A, B). In the Northwest Pacific, the migration matrix that produced the best results was a full island model. In the Southwest Pacific the best matrix was a nearly full island model, but the model fit was slightly better when AS and FP weren’t directly connected to the Australian continental-shelf rookeries. The Australian rookeries had the highest within-deme (rookery) genetic dissimilarity (e.g. diversity) in the entire Pacific (Figure 6B). Coincidentally, Australian rookeries (CS, nGBR, sGBR) also had the highest genetic dissimilarity between demes (Figure 5B), suggesting that genetic distance increased more than geographic distance among these rookeries.
Our microsatellite dataset for Pacific green turtles achieved an ocean-basin scale nDNA population analysis for an endangered marine species and showed meaningful genetic structure at regional and population-level spatial scales. The microsatellite genotypes used herein were produced from many of the same tissue and DNA extractions as the mtDNA analysis of Jensen et al. (2019), making the two studies highly comparable and complementary. On the whole, the nDNA corroborated population patterns recovered from mtDNA, with the strongest feature of both datasets being a deep genetic partition between the East and West Pacific. The genetically intermediate Hawaiian rookery was also more related to the East Pacific in the nDNA as observed with mtDNA (Dutton et al., 2014a; Jensen et al., 2019; Hamabata et al., 2020). Additionally, nDNA segregated most rookeries from each other (Figure 2), demonstrating that it too captures a natal homing signal, similar to mitochondrial genetic structure. Examples include the Northwest and Central Pacific, where most rookeries indicated significant population differentiation. This finding dispels the notion that widespread male-mediated gene flow occurs and reinforces the existence of natal homing, at least on a regional level, by males. Our results from the EEMS analysis indicating elevated within-deme (rookery) diversity in the Australian rookeries compared to the East Pacific are not surprising considering past mtDNA studies that identified the Southwest Pacific as a diversity hotspot for mtDNA. Central American rookeries display a shallower demographic history, which reflects a relatively recent recolonization of the East Pacific from Hawaii (Dutton et al., 2014a). At the same time, Australian turtle populations have much deeper lineages given that the West Pacific has sustained green turtles for much longer than the East Pacific (Jensen et al., 2019).
While the East and Central North Pacific (Hawaii) rookeries were extensively sampled, coverage in the Central, South and West Pacific was less comprehensive and included some rookeries with relatively small sample sizes. The French Polynesia rookery, for example, had only 12 samples and this may not have been adequate for detecting the level of population structure between it and Palau, American Samoa, and New Caledonia. POWSIM results indicate that our current assay is poor at detecting weak differentiation with sample sizes < 20, and a lack of structure between some minimally sampled rookeries and others could be due to a lack of power. Considering that the insularity of most sea turtle breeding populations is consistently confirmed by genetic analysis, instances where pairwise genetic structure is lacking, and the sample size is small, results should be interpreted cautiously.
Nevertheless, results of the EEMS analysis when considered together with results of the pairwise tests, provide insights that allow a more nuanced interpretation of the population structure analysis results by themselves for the under-sampled Australian rookeries. The fixation indices and DAPC results showed the nGBR and sGBR as genetically similar, and the CS rookery as differentiated from the nGBR and sGBR (Figures 2, 4B), and yet the EEMS results showed that all these three rookeries (CS, nGBR, sGBR) had the highest genetic dissimilarity between demes (Figure 5B), suggesting that genetic distance increased more than geographic distance among these rookeries, a scenario more consistent with discontinuity rather than homogeneity. Samples from the sGBR and CS were few (n = 20 and n = 18, respectively) and these small sample sizes might not adequately characterize the elevated genetic diversity that the EEMS analysis revealed for the Australian rookeries (Figure 6B). If so, then the genetic dissimilarity between these rookeries may more or less reflect the dissimilarity within them, making it difficult to delineate population boundaries. Analyses such as DAPC combine the within- and among-deme genetic variation into the same plot, and intentionally minimize within-deme variation to better represent population structure visually. EEMS analysis separates these two different variance components instead and presents them individually in continuous geographic space trying to interpolate, rather than discriminate, the boundary between defined populations. Therefore, when comparing DAPC and EEMS results it is important to consider the different ways these analyses handle the same genetic variation.
Heterozygote deficiencies in some individual loci, and in global tests including all loci in several of the sampled rookeries, are most likely features of green turtle populations that have been subjected to a number of disruptive processes, and not the result of genotyping errors. For instance, local extirpation and recolonization, driven partly by Pleistocene sea-level disturbances to nesting beaches (Dethmers et al., 2006), could have led to more genetic drift than expected under stable conditions and HWE (Dutton et al., 2014a; Horne, 2014). In addition, recent human activities that have negatively impacted green turtles (Seminoff et al., 2015) may have eroded genetic diversity even in rookeries that remain relatively large, or reduced populations to the point where they are too small, or too inbred, to obtain a truly random sample (Dharmarajan et al., 2013). Nevertheless, the idea that genetic drift is the strongest signal in our data is supported by the fact that pairwise FST values (and analogs) tended to be more geographically intuitive than pairwise Jost’s D, which estimates connectivity based on the sharing of alleles rather than fixation (Jost et al., 2018). Moreover, fixation indices are sensitive to all causes of genetic drift, such as founder effects, population bottlenecks, as well as infrequent migration (Whitlock, 2011). Lastly, the use of DAPC, a method that does not assume HWE, recovered the same general population patterns as the fixation indices.
Overall, the nDNA population patterns are in agreement with previous mtDNA studies, with a few noteworthy exceptions. The first was a signal of genetic differentiation found between CNMI and Guam that has not been previously detected using mtDNA control region sequences (Dutton et al., 2014b). However recent whole mitochondrial genome sequencing has provided greater resolution to assess green turtle population structure and shows evidence of highly significant genetic differentiation between CNMI and Guam (Frey et al., in prep) in agreement with this study. This signal of differentiation is surprising due to the proximity of Guam and CNMI and may be the result of genetic drift due to small population size or a founder effect similar to the findings in the Hawaiian Islands by Frey et al. (2013). Guam and CNMI are both very small nesting populations with less than 50 females estimated in each (Seminoff et al., 2015). It is also noteworthy that the foraging populations around CNMI and Guam consist of mostly juveniles, with adults tending to be observed around the nesting season (Martin et al., 2016; Summers et al., 2017; Gaos et al., 2020). The significant differentiation that we found between Guam and CNMI with nDNA data suggests that males (presumably homing to their natal beaches) are likely to be mating with nesting females that are reproductively receptive during the breeding season in the vicinity of the nesting beaches, rather than in mixed courtship areas, thus limiting the opportunity for male-mediated gene flow (Frey et al., in prep).
Within the East Pacific, a greater degree of connectivity was found among Central American and continental Mexican rookeries in comparison to previous mtDNA population studies. With nDNA microsatellites, we found evidence for greater connectivity between the mainland rookeries of Costa Rica and Mexico than with the island rookeries of the Galapagos and Revillagigedo. This is interesting given that telemetry and tag recaptures show green turtles from Galapagos rookeries sharing foraging grounds in Central and South America with those from Mexico and Costa Rica (Seminoff et al., 2008; Hart et al., 2015). The genetic dissimilarity of Galapagos turtles could be partly explained by differences in migration routes between males and females that nest on the continent vs. those that nest on oceanic islands. If continental green turtles maintain coastal migratory behaviors (Blanco et al., 2012; Hart et al., 2015), then Mexican and Costa Rican turtles could be using overlapping migratory pathways along the coastal shelf when moving between nesting and foraging areas, and may opportunistically interbreed where migratory pathways intersect with courtship areas when the turtles become reproductively active in these areas just prior to the nesting season. This opportunistic mating is likely driven by the behavior of migrating males given that they are reproductively active for longer periods than the females, which tend to be reproductively receptive for shorter durations at the breeding sites (Ulrich and Parkes, 1978; Crowell Comuzzie and Owens, 1990; Limpus, 1993; Owens, 1997). Furthermore, green turtle mating activity generally decreases once nesting seasons begin but in Michoacán, mating persists into the nesting season (Alvarado and Figueroa, 1991; Delgado-Trejo and Alvarado-Figueroa, 2012). In contrast, Galapagos green turtles that forage in continental shelf waters would not migrate along the same coastal routes. Instead, they would head offshore toward the high seas, where they would be less likely to have chance mating encounters (Seminoff et al., 2008). Given the great distances involved (necessitating longer migration times), it is also unlikely that Galapagos turtles would be reproductively active or encounter reproductively receptive females before they depart continental foraging grounds to start breeding migrations. The same would be true for Islas Revillagigedo green turtles that forage throughout the Baja Peninsula and Southern California, USA (Juarez-Ceron et al., 2003; Dutton et al., 2019). Additionally, lenient natal homing has been found to be more prevalent in continental nesters returning to nesting sites along continuous coastlines than for nesters homing to isolated insular coastlines (Levasseur et al., 2019; Shamblin et al., 2020), where the former may share or have very similar features, such as magnetic fields used as a cue to identify the magnetic signature of a natal beach (Brothers and Lohmann, 2018).
Conversely, the lack of nDNA structure between the three Australian breeding regions of nGBR, sGBR and sGoC (Figures 2, 4B) was somewhat unexpected because these three regions have nearly fixed mitochondrial control region differences and the phylogeographic affinity between the GoC and Indian Ocean rookeries evident in mtDNA lineages (Dethmers et al., 2006; Jensen et al., 2019). Previous work comparing nuclear and mtDNA saw significant genetic differentiation for both markers across all three nesting populations, except for nDNA between the nGBR and sGBR (FitzSimmons et al., 1997b), suggesting that male-mediated gene flow acts to homogenize these two populations. However, mating typically occurs near the nesting beaches in the months before the start of the nesting season (Wood and Wood, 1980; Limpus, 1993), and there is strong evidence that male turtles in Australia are as philopatric as the females, returning to breed in the vicinity of their natal beaches (FitzSimmons et al., 1997a) and thereby minimizing the opportunity for gene flow across populations.
Hence, the nuclear DNA connectivity between the nGBR and sGBR observed in both studies is best explained by rare mating events where breeding migration routes overlap with courtship areas (FitzSimmons et al., 1997a; FitzSimmons et al., 1997b). The sGBR male and female turtles occupy foraging areas across the entire Great Barrier Reef, Torres Strait (between Australia and Papua New Guinea) and even into the Gulf of Carpentaria (Limpus, 2008). The timing of opportunistic mating is not well understood but it is likely to occur during their breeding migration, when sGBR male and female turtles traverse major nGBR foraging and courtship areas, creating the potential for nuclear but not mitochondrial gene flow, most likely by migrating sGBR males in breeding condition traveling south and receptive nGBR females already at their courtship areas. It is important to note that courtship areas may be at least a few hundred kilometers away from nesting beaches, as observed in green turtles that nest in Tortuguero, Costa Rica, and mate along migratory routes off Panama, 240 km distant (Meylan et al., 2013). Similarly, the large nGBR courtship areas in Torres Strait are 200 km (or more) northwest from the main nesting beach at Raine Island (for nesting distribution see (DES; CMS, n.d.). At the Howick Group feeding ground (south of nGBR) which is used by both nGBR and sGBR turtles, two vitellogenic female green turtles caught during mating were satellite-tagged and immediately migrated ~340 km north to nest at Raine Island (DES; CMS, n.d.). This suggests a broad geographic range in courtship areas used by the nGBR rookery as also suggested for the sGBR rookery where courtship activity has been recorded at sites up to hundreds of kilometers distant from the main courtship areas (C.J. Limpus, unpublished data). The well-monitored foraging ground at the Howick Group (Jensen et al., 2018) could also be a site to further investigate questions of male mediated gene flow raised here.
Previously, Bountiful Island (sGoC) was shown to be distinct at four microsatellite loci and that has been attributed to differences in nesting phenology between the Gulf of Carpentaria (Austral winter) and the two GBR populations (Austral summer), which minimizes the chance of interbreeding (FitzSimmons et al., 1997b). This contrasts with our study, which finds genetic homogeneity for nuclear markers among all three rookeries. Furthermore, in this study, the nGoC and sGoC rookeries revealed different patterns of differentiation with the GBR rookeries. While the peak nesting activity differs between the Gulf of Carpentaria (April-October) and the Great Barrier Reef (October-March), low-level nesting in the Gulf of Carpentaria and the nGBR green turtle populations occurs year-round (Limpus, 2008). Tagging data (Limpus, 2008) show that some females nesting in the nGBR and sGBR take up residency in foraging areas across the Gulf of Carpentaria. Recent satellite telemetry research has tracked nGBR nesters tagged at Raine Island (nGBR) to foraging areas around Bountiful Island and other green turtle nesting areas in the GoC (DES; CMS). Hence, a similar interpopulation (opportunistic) mating scenario could be happening between the GoC and GBR populations during the months when there may be some overlap in the timing of migration. Reasons for discrepancies between the studies may include low statistical power in both nDNA studies due to low sample size, and it remains unresolved what level of admixture occurs between nesting populations in the GoC and the GBR. More research will be needed to fully resolve green turtle population dynamics along the Australian continental shelf.
In the Southwest Pacific, some green turtles from rookeries in New Caledonia reside in foraging grounds along the GBR, and vice versa, requiring them to cross the Coral Sea during breeding migrations (Limpus, 2008; Read et al., 2014). Nevertheless, there is no evidence for male-mediated gene flow between New Caledonian rookeries and those on the Australian shelf, suggesting that male turtles from New Caledonia do not breed in the GBR but return to New Caledonia to do so, and vice versa. Instead, results from this study indicate that chance mating encounters may be happening between green turtles from New Caledonian and Coral Sea rookeries while sharing foraging or migration corridors. More research is clearly needed to better understand the reproductive physiology and the mechanisms of male mediated gene flow between demographically independent nesting populations that share foraging habitats or migrate through courtship areas utilized by other genetic stocks. Sperm storage, female receptiveness, and understanding the timing and duration of vitellogenesis (females) and spermatogenesis (males) prior to the onset of their breeding migration all play a vital role in understanding these mechanisms (Kitayama et al., 2021). Additionally, the levels to which opportunistic mating might happen are highly influenced by the geography of rookeries, foraging areas, and migratory routes.
Our results prompt reconsideration of how population units for conservation have been defined for green turtles in some cases based solely on patterns of mtDNA variation. The incongruence we found in some cases between our nDNA results and mtDNA highlights the need for a more nuanced approach in determining the extent to which rookeries represent demographically independent populations for conservation (e.g., Guam and CNMI see above). Failure to recognize Guam and CNMI as separate MUs could misinform conservation expectations; both populations are severely depleted, and given the lack of demographic connectivity, it is unlikely that any recovery actions on one of the islands will influence population trends on the other (Seminoff et al., 2015). On the other hand, the increasing abundance trend of the large East Pacific nesting population in Michoacán is the result of sustained conservation measures enacted over the last 50 years to protect nests and breeding adults (Delgado-Trejo and Alvarado-Figueroa, 2012). The Michoacán population is clearly defined as a separate MU from Costa Rica based on mtDNA, however the nDNA connectivity, and implied male-mediated gene flow among these populations established in this study suggests that demographic benefits from conservation at one location extend beyond the MU boundaries. These findings provide a broader regional framework for future assessment of whole genomic variation and potential for local adaptation between the continental (Mexico and Central America) vs. island (Galapagos and Revillagigedo Islands) populations using whole genome sequencing approaches (Álvarez-Varas et al., 2021).
Furthermore, the regional genomic connectivity among mtDNA genetic stocks (MUs) indicated in this study has conservation importance with regard to the ability of certain rookeries to adapt to environmental change and can help inform metapopulation modeling approaches for sea turtles (Jensen et al., 2022). Because warmer incubation temperatures produce more female offspring, warmer temperatures due to climate change may produce a disproportionate abundance of females in green turtle populations (Chaloupka, 2004; Hawkes et al., 2007; Hays et al., 2010; Hays et al., 2017). Studies have projected a lack of male turtles in some populations in the near future. In the nGBR, immature turtles from one feeding ground (the Howick Group) were found to be 99% female (Jensen et al., 2018), and less than 1% of hatchings born at Raine Island during the 2018 and 2019 nesting seasons were estimated to be male (Booth et al., 2020). At present, the nGBR boasts one of the largest green turtle rookeries in the world (Seminoff et al., 2015), but it is very vulnerable due to climate change-related feminization. Some models suggest that climate change could exacerbate the problem and even eliminate some turtle colonies (Hawkes et al., 2007; Hays et al., 2017; Jensen et al., 2022), but do not account for scenarios involving male mediated gene flow. These models could be improved by accounting for male-mediated gene flow and a better understanding of its role in maintenance of genetic diversity and ultimately population persistence. The within-region differences discovered in the present study will need to be resolved with a more extensive population genomic assessment involving additional genome-wide variation, so that loci deviating from HWE, such as were seen in our study, can be evaluated more effectively in a genomic context where signal to noise ratios can be more finely tuned (Pearman et al., 2022).
In the meantime, however, the findings echoed with multiple analytical approaches used in this study warrant consideration because the effects of metapopulation processes are often difficult to infer from FST values alone (Pannell and Charlesworth, 2000). This lesson is more broadly applicable to other widely distributed marine species with complex, and often cryptic life history stages.
Finally, our study provides an extensive Pacific-wide nDNA baseline dataset for population assignment analyses (“stock ID”) for individual green turtles of unknown population origin, such as in fisheries bycatch, strandings, and foraging grounds. The ability to conduct such assignments has previously been limited to Mixed Stock Analysis approaches using mtDNA data that often result in large uncertainty and require adequate sample sizes (Jensen et al., 2013). Assignment of individuals with multi-locus markers is particularly useful for identifying the origin of fisheries bycatch more precisely (Stewart et al., 2016). While West Pacific rookeries are under-represented relative to those in the Central and East Pacific in this baseline dataset, it nevertheless includes regional representation that provides for ocean-scale stock assignment (Horne et al. 2023).
Rapid technological advancements make it increasingly feasible and cost effective to generate high quality whole genome sequence data that also characterizes genes under selection (Bentley et al., 2023), and thus overcome the limitations of using a relatively small number of microsatellite loci described in our study. Equally important however is the requirement to adequately sample populations. There continue to be the logistical challenges of obtaining adequate and representative samples of species such as sea turtles due to their threatened status, extensive distribution throughout the open ocean and numerous remote nesting regions of many countries. Through a coordinated, comprehensive sampling effort by an expansive network of collaborators, we present the results of a landmark study with an extensive set of samples; many previously used in published mtDNA studies. This international collaborative framework will need to be further expanded and maintained to address geographic gaps, and also temporal gaps in sampling, since some of these samples were collected over a 10-22 year timeframe, over 30 years ago, and may not adequately reflect any temporal shifts in diversity that may have occurred. There are relatively few studies that evaluate whether the geographic patterns of genetic structure vary significantly over ecological time scales in marine species (Toonen and Grosberg, 2011; Horne et al., 2012). Given their long lifespans and life history traits that include nest site fidelity and overlapping generations, it is assumed that spatial genetic patterns of population structure generally persist over decades in sea turtles, which is within the reproductive lifespan of individuals (Bjorndal et al., 2005; Formia et al., 2007; Velez-Zuazo et al., 2008; Joseph and Nishizawa, 2016). However, severely depleted sea turtle populations that have been subjected to high anthropogenic mortality that has likely reduced reproductive lifespans of adults, may be more prone to shifts in genetic diversity within shorter decadal timeframes. Vargas et al. (2022) found a difference in mtDNA haplotype frequencies in the extremely small Brazilian leatherback nesting population over a 28-year period that could represent contemporary genetic drift. Our study provides a baseline for monitoring temporal changes for green turtle rookeries into the future. Nuclear DNA (nDNA) markers are a valuable complement to gain a comprehensive understanding of population boundaries and male-mediated gene flow by incorporating the male genetic connectivity component to analysis. With highly migratory, long-lived species like marine turtles, extensive collaboration with sampling, genetic marker application, and analysis techniques are central to understanding the connectivity of populations within oceans and worldwide.
The original contributions presented in the study are included in the article/Supplementary Material. Further inquiries can be directed to the corresponding author.
Ethical review and approval was not required for the animal study because all research in this study complied with all applicable animal welfare laws. Samples are archived in the US National Marine Fisheries Service (NMFS) Marine Turtle Molecular Research Sample Collection at the Southwest Fisheries Science Center and were collected under the respective national authorizations and CITES permit conditions and imported under CITES permit (https://www.fisheries.noaa.gov/west-coast/science-data/marine-mammal-and-sea-turtle-research-tissue-collection).
SR, JBH, PD, and LK performed the data analysis, while laboratory analysis and microsatellite genotyping were done by SR. SR, JBH, and PD drafted the manuscript and figures. NF, MJ, and CL performed review and additional contributions to the manuscript. Sample collection and curation were handled by MJ, NF, GB, RF, JCH, JH, MH, TTJ, CL, SM, RP, LSM, TS, MT, EV, PZ, and PD. All authors contributed to the article and approved the submitted version.
Funding provided by National Oceanic and Atmospheric Administration’s National Marine Fisheries Service and a National Research Council Research Associateship to JBH.
We extend our gratitude to I-Juinn Cheng, Ian Bell, Brian Peck, Cristian Cayanan, Jeanette Norman, Damien Broderick, Rod Kennett, Jeff Miller, Shawn Wusstig, and Karen Frutchey for contributing samples originally used in earlier studies. We thank the students and volunteers from Facultad de Ciencias, UNAM, but specifically to Rafael Roldan Serralde and Arturo Juárez, who participated actively in the field work in Islas Revillagigedo. We thank Luis G. Fonseca, Wilberth N. Villachica and numerous volunteers for assisting and funding the collection of samples in NW Costa Rica. Kuemar would like to acknowledge: Earl Possardt of the Fish and Wildlife Service; Research Assistants; Volunteer Program of the University of Costa Rica; Cecilia Mesén from the organization Volunteers and Projects; Fundecodes and Minae-Sinac. We also thank the Commonwealth of the Northern Mariana Islands Department of Lands & Natural Resources, Division of Fish and Wildlife for supporting this research. We thank the Galapagos National Park, and all volunteers from the Charles Darwin Foundation in the field, but specifically to M. Robles, C. Chasiluisa, I. Bravo, S. Castillo, N. Beaumont, E. Cadena, J. Carrión, M. A. Fernie, C. Angulo, F. Gómez, M. Bosquirolli, S. Cahoon, E. Palácios, M. González, J. Solano, D. Páez, C. R. Hasbun, P. Swanell, A. Gaos, and I. Yáñez who participated actively and provided research assistance in the field work at the Galapagos Islands. This research was performed while JBH held a National Research Council Associateship at the National Oceanic and Atmospheric Administration. For laboratory analysis we acknowledge Erin LaCasella, Amy Frey, Victoria Pease, Gabriella Serra-Valente and Amy Lanci. We thank Summer Martin and Kelly Stewart for advice on earlier drafts of the manuscript, Eric Archer for assistance with data analysis, Robin LeRoux for management support, and Laurie Meyer for software support. Additionally, we thank all volunteers, students and researchers for sample collection and coordination with special thanks, in loving memory, to the late Shandell Brunson.
The authors declare that the research was conducted in the absence of any commercial or financial relationships that could be construed as a potential conflict of interest.
All claims expressed in this article are solely those of the authors and do not necessarily represent those of their affiliated organizations, or those of the publisher, the editors and the reviewers. Any product that may be evaluated in this article, or claim that may be made by its manufacturer, is not guaranteed or endorsed by the publisher.
The Supplementary Material for this article can be found online at: https://www.frontiersin.org/articles/10.3389/fmars.2023.1116941/full#supplementary-material
Allendorf F. W. (2017). Genetics and the conservation of natural populations: allozymes to genomes. Mol. Ecol. 26, 420–430. doi: 10.1111/mec.13948
Alvarado J., Figueroa A. (1991). Comporta miento reproductivo de la tortuga negra chelonia agassizii. Cienc. Desarro. 17, 43–49.
Álvarez-Varas R., Rojas-Hernández N., Heidemeyer M., Riginos C., Benítez H. A., Araya-Donoso R., et al. (2021). Green, yellow or black? genetic differentiation and adaptation signatures in a highly migratory marine turtle. Proc. R. Soc B Biol. Sci. 288, 20210754. doi: 10.1098/rspb.2021.0754
Archer F. I., Adams P. E., Schneiders B. B. (2017). STRATAG: an r package for manipulating, summarizing and analysing population genetic data. Mol. Ecol. Resour. 17, 5–11. doi: 10.1111/1755-0998.12559
Avise J. C., Bowen B. W., Lamb T., Meylan A. B., Bermingham E. (1992). Mitochondrial DNA evolution at a turtle’s pace: evidence for low genetic variability and reduced microevolutionary rate in the testudines. Mol. Biol. Evol. 9, 457–473. doi: 10.1093/oxfordjournals.molbev.a040735
Benjamini Y., Hochberg Y. (1995). Controlling the false discovery rate: a practical and powerful approach to multiple testing. J. R. Stat. Soc Ser. B 57, 289–300. doi: 10.1111/j.2517-6161.1995.tb02031.x
Bentley B. P., Carrasco-Valenzuela T., Ramos E. K. S., Pawar H., Souza Arantes L., Alexander A., et al. (2023). Divergent sensory and immune gene evolution in sea turtles with contrasting demographic and life histories. Proc. Natl. Acad. Sci. 120, e2201076120. doi: 10.1073/pnas.2201076120
Bjorndal K. A., Bolten A. B., Troëng S. (2005). Population structure and genetic diversity in green turtles nesting at tortuguero, Costa Rica, based on mitochondrial DNA control region sequences. Mar. Biol. 147, 1449–1457. doi: 10.1007/s00227-005-0045-y
Blanco G. S., Morreale S. J., Bailey H., Seminoff J. A., Paladino F. V., Spotila J. R. (2012). Post-nesting movements and feeding grounds of a resident East pacific green turtle chelonia mydas population from Costa Rica. Endanger. Species Res. 18, 233–245. doi: 10.3354/esr00451
Booth D. T., Dunstan A., Bell I. P., Reina R., Tedeschi J. (2020). Low male production at the world’s largest green turtle rookery. Mar. Ecol. Prog. Ser. 653, 181–190. doi: 10.3354/meps13500
Bowen B. W., Karl S. A. (2007). Population genetics and phylogeography of sea turtles. Mol. Ecol. 16, 4886–4907. doi: 10.1111/j.1365-294X.2007.03542.x
Bradshaw P. J., Broderick A. C., Carreras C., Fuller W., Snape R. T. E., Wright L. I., et al. (2018). Defining conservation units with enhanced molecular tools to reveal fine scale structuring among Mediterranean green turtle rookeries. Biol. Conserv. 222, 253–260. doi: 10.1016/j.biocon.2017.12.014
Broderick A. C., Frauenstein R., Glen F., Hays G. C., Jackson A. L., Pelembe T., et al. (2006). Are green turtles globally endangered? Glob. Ecol. Biogeogr. 15, 21–26. doi: 10.1111/j.1466-822x.2006.00195.x
Brookfield J. (1996). A simple new method for estimating null allele frequency from heterozygote deficiency. Mol. Ecol. 5, 453–455. doi: 10.1046/j.1365-294X.1996.00098.x
Brothers J. R., Lohmann K. J. (2018). Evidence that magnetic navigation and geomagnetic imprinting shape spatial genetic variation in Sea turtles. Curr. Biol. 28, 1325–1329.e2. doi: 10.1016/j.cub.2018.03.022
Chaloupka M. Y. (2004). “Southern great barrier reef green sea turtle (Chelonia mydes) stock: consequences of local sex-biased harvesting” in Species Conservation and Management: Case Studies Akcakaya H.R., Burgman M.A., Kindvall O., Wood C.C., Sjogren-Gulve P. J., Hatfield S., et al eds. (New York: Oxford University Press), 340–354.
Chaloupka M. Y., Balazs G. H. (2007). Using Bayesian state-space modelling to assess the recovery and harvest potential of the Hawaiian green sea turtle stock. Ecol. Modell. 205, 93–109. doi: 10.1016/j.ecolmodel.2007.02.010
Chaloupka M. Y., Bjorndal K. A., Balazs G. H., Bolten A. B., Ehrhart L. M., Limpus C. J., et al. (2008). Encouraging outlook for recovery of a once severely exploited marine megaherbivore. Glob. Ecol. Biogeogr. 17, 297–304. doi: 10.1111/j.1466-8238.2007.00367.x
Crowell Comuzzie D. K., Owens D. W. (1990). A quantitative analysis of courtship behavior in captive green Sea turtles (Chelonia mydas). Herpetologica 46, 195–202. http://www.jstor.org/stable/3892904
Dąbrowski M. J., Bornelöv S., Kruczyk M., Baltzer N., Komorowski J. (2015). ‘True’null allele detection in microsatellite loci: a comparison of methods, assessment of difficulties and survey of possible improvements. Mol. Ecol. Resour. 15, 477–488. doi: 10.1111/1755-0998.12326
Delgado-Trejo C., Alvarado-Figueroa J. (2012). “Current conservation status of the black Sea turtle in michoacan, Mexico,” in Sea Turtles of the Eastern pacific. Eds. Seminoff J., Wallace B. (Tucson, AZ: University of Arizona Press), 263–278.
De Meeûs T. (2018). Revisiting FIS, FST, wahlund effects, and null alleles. J. Hered. 109, 446–456. doi: 10.1093/jhered/esx106
DES; CMS Global Atlas of Marine Turtle Nesting Distribution and Migration. Available at: https://apps.information.qld.gov.au/TurtleDistribution/.
Dethmers K. E. M., Broderick D., Moritz C., FitzSimmons N. N., Limpus C. J., Lavery S., et al. (2006). The genetic structure of Australasian green turtles (Chelonia mydas): exploring the geographical scale of genetic exchange. Mol. Ecol. 15, 3931–3946. doi: 10.1111/j.1365-294X.2006.03070.x
Dharmarajan G., Beatty W. S., Rhodes J. O.E. (2013). Heterozygote deficiencies caused by a wahlund effect: dispelling unfounded expectations. J. Wildl. Manage. 77, 226–234. doi: 10.1002/jwmg.458
Dutton P. H. (1996). “Methods for collection and preservation of samples for sea turtle genetic studies,” in Proceedings of the international symposium on sea turtle conservation genetics. Eds. Bowen B. W., Witzell W. N. (Miami, Florida, Florida: NOAA Technical Memorandum NMFS-SEFSC-396), 17–24.
Dutton P. H., Bowen B. W., Owens D. W., Barragan A. R., Davis S. K. (1999). Global phylogeography of the leatherback turtle (Dermochelys coriacea). J. Zool. 248, 397–409. doi: 10.1017/S0952836999007116
Dutton P. H., Frey A. (2009). Characterization of polymorphic microsatellite markers for the green turtle (Chelonia mydas). Mol. Ecol. Resour. 9, 354–356. doi: 10.1111/j.1755-0998.2008.02443.x
Dutton P. H., Jensen M. P., Frey A., LaCasella E. L., Balazs G. H., Zárate P. M., et al. (2014a). Population structure and phylogeography reveal pathways of colonization by a migratory marine reptile (Chelonia mydas) in the central and eastern pacific. Ecol. Evol. 4, 4317–4331. doi: 10.1002/ece3.1269
Dutton P. H., Jensen M. P., Frutchey K., Frey A., LaCasella E. L., Balazs G. H., et al. (2014b). Genetic stock structure of green turtle (Chelonia mydas) nesting populations across the pacific islands. Pacific Sci. 68, 451–464. doi: 10.2984/68.4.1
Dutton P. H., LeRoux R. A., LaCasella E. L., Seminoff J. A., Eguchi T., Dutton D. L. (2019). Genetic analysis and satellite tracking reveal origin of the green turtles in San Diego bay. Mar. Biol. 166, 1–13. doi: 10.1007/s00227-018-3446-4
Dutton P. H., Roden S. E., Stewart K. R., LaCasella E. L., Tiwari M., Formia A., et al. (2013). Population stock structure of leatherback turtles (Dermochelys coriacea) in the Atlantic revealed using mtDNA and microsatellite markers. Conserv. Genet. 14, 625–636. doi: 10.1007/s10592-013-0456-0
Ferreira L. C., Thums M., Fossette S., Wilson P., Shimada T., Tucker A. D., et al. (2021). Multiple satellite tracking datasets inform green turtle conservation at a regional scale. Divers. Distrib. 27, 249–266. doi: 10.1111/ddi.13197
FitzSimmons N. N., Limpus C. J. (2014). Marine turtle genetic stocks of the indo-pacific: identifying boundaries and knowledge gaps. Indian Ocean Turt. Newsl. 20, 2–18.
FitzSimmons N. N., Limpus C. J., Norman J. A., Goldizen A., Miller J. D., Moritz C. (1997a). Philopatry of male marine turtles inferred from mitochondrial DNA markers. Proc. Natl. Acad. Sci. 94, 8912–8917. doi: 10.1073/pnas.94.16.8912
FitzSimmons N. N., Moritz C., Limpus C. J., Pope L., Prince R. (1997b). Geographic structure of mitochondrial and nuclear gene polymorphisms in Australian green turtle populations and male-biased gene flow. Genetics 147, 1843–1854. doi: 10.1093/genetics/147.4.1843
FitzSimmons N. N., Moritz C., Moore S. S. (1995). Conservation and dynamics of microsatellite loci over 300 million years of marine turtle evolution. Mol. Biol. Evol. 12, 432–440. doi: 10.1093/oxfordjournals.molbev.a040218
FitzSimmons N. N., Pittard S. D., McIntyre N., Jensen M. P., Guinea M., Hamann M., et al. (2020). Phylogeography, genetic stocks, and conservation implications for an Australian endemic marine turtle. Aquat. Conserv. Mar. Freshw. Ecosyst. 30, 440–460. doi: 10.1002/aqc.3270
Fonseca L. G., Tomillo P. S., Villachica W. N., Quirós W. M., Pesquero M., Heidemeyer M., et al. (2018). Discovery of a major East pacific green turtle (Chelonia mydas) nesting population in Northwest Costa Rica. Chelonian Conserv. Biol. 17, 169–176. doi: 10.2744/CCB-1264.1
Formia A., Broderick A. C., Glen F., Godley B. J., Hays G. C., Bruford M. W. (2007). Genetic composition of the ascension island green turtle rookery based on mitochondrial DNA: implications for sampling and diversity. Endanger Species Res. 3, 145–158. doi: 10.3354/esr003145
Frey A., Dutton P. H., Balazs G. H. (2013). Insights on the demography of cryptic nesting by green turtles (Chelonia mydas) in the main Hawaiian islands from genetic relatedness analysis. J. Exp. Mar. Bio. Ecol. 442, 80–87. doi: 10.1016/j.jembe.2013.01.030
Gaos A. R., Martin S. L., Jones T. T. (2020). Sea Turtle tagging in the Mariana islands training and testing (MITT) study area. PIFSC data report, DR-20-003. doi: 10.25923/qq2e-e198
Hamabata T., Matsuo A., Sato M. P., Kondo S., Kameda K., Kawazu I., et al. (2020). Natal origin identification of green turtles in the north pacific by genome-wide population analysis with limited DNA samples. Front. Mar. Sci. 7. doi: 10.3389/fmars.2020.00658
Hart C. E., Blanco G. S., Coyne M. S., Delgado-Trejo C., Godley B. J., Jones T. T., et al. (2015). Multinational tagging efforts illustrate regional scale of distribution and threats for East pacific green turtles (Chelonia mydas agassizii). PloS One 10, e0116225. doi: 10.1371/journal.pone.0116225
Hawkes L. A., Broderick A. C., Godfrey M. H., Godley B. J. (2007). Investigating the potential impacts of climate change on a marine turtle population. Glob. Change Biol. 13, 923–932. doi: 10.1111/j.1365-2486.2006.01320.x
Hays G. C., Fossette S., Katselidis K. A., Schofield G., Gravenor M. B. (2010). Breeding periodicity for Male Sea turtles, operational sex ratios, and implications in the face of climate change. Conserv. Biol. 24, 1636–1643. doi: 10.1111/j.1523-1739.2010.01531.x
Hays G. C., Mazaris A. D., Schofield G., Laloë J.-O. (2017). Population viability at extreme sex-ratio skews produced by temperature-dependent sex determination. Proc. R. Soc London B Biol. Sci. 284. doi: 10.1098/rspb.2016.2576
Hedrick P. W. (2005). A standardized genetic differentiation measure. Evolution 59, 1633–1638. doi: 10.1111/j.0014-3820.2005.tb01814.x
Horne J. B. (2014). Thinking outside the barrier: neutral and adaptive divergence in indo-pacific coral reef faunas. Evol. Ecol. 28, 991–1002. doi: 10.1007/s10682-014-9724-9
Horne J. B., Momigliano P., Welch D. J., Newman S. J., van H. (2012). Searching for common threads in threadfins: phylogeography of Australian polynemids in space and time. Mar. Ecol. Prog. Ser. 449, 263–276. doi: 10.3354/meps09557
Horne J. B., Roden S. E., LaCasella E. L., Frey A., Martin S. L., Jones T. T., et al (2023). Origins of green turtle fishery bycatch in the central pacific revealed by mixed genetic markers. Front. Mar. Sci, 10. doi: 10.3389/fmars.2023.1112842
Jackson J. B. C. (2001). What was natural in the coastal oceans? Proc. Natl. Acad. Sci. 98, 5411–5418. doi: 10.1073/pnas.091092898
Jensen M. P., Allen C. D., Eguchi T., Bell I. P., LaCasella E. L., Hilton W. A. W. A., et al. (2018). Environmental warming and feminization of one of the largest sea turtle populations in the world. Curr. Biol. 28, 154–159. doi: 10.1016/j.cub.2017.11.057
Jensen M. P., Eguchi T., FitzSimmons N. N., McCarthy M. A., Fuentes M. M. P. B., Hamann M., et al. (2022). Integrating climate change and management scenarios in population models to guide the conservation of marine turtles. Bull. Mar. Sci. 98, 131–154. doi: 10.5343/bms.2021.0033
Jensen M. P., FitzSimmons N. N., Bourjea J., Hamabata T., Reece J. S., Dutton P. H. (2019). The evolutionary history and global phylogeography of the green turtle (Chelonia mydas). J. Biogeogr. 46, 860–870. doi: 10.1111/jbi.13483
Jensen M. P., FitzSimmons N. N., Dutton P. H., Michael P. (2013). “Molecular genetics of sea turtles,” in The biology of Sea turtles, volume 3. Eds. Wyneken J., Lohmann K. J., Musick J. A. (Boca Raton, FL: CRC Press), 135–154.
Jombart T., Ahmed I. (2011). Adegenet 1.3-1: new tools for the analysis of genome-wide SNP data. Bioinformatics 27, 3070–3071. doi: 10.1093/bioinformatics/btr521
Joseph J., Nishizawa H. (2016). Genetic structure and diversity of green turtles (Chelonia mydas) from two rookeries in the South China Sea. J. Sustainability Sci. Manage. Special (1), 41–47. http://umt-ir.umt.edu.my:8080/handle/123456789/6948
Jost L. (2008). G ST and its relatives do not measure differentiation. Mol. Ecol. 17, 4015–4026. doi: 10.1111/j.1365-294X.2008.03887.x
Jost L., Archer F., Flanagan S., Gaggiotti O., Hoban S., Latch E. (2018). Differentiation measures for conservation genetics. Evol. Appl. 11, 1139–1148. doi: 10.1111/eva.12590
Juarez-Ceron J. A., Sarti-Martinez A. L., Dutton P. H. (2003). “First study of the green/black turtles of the revillagigedo archipelago: a unique nesting stock in the Eastern pacific,” in Proceedings of the twenty- second annual symposium on Sea turtle biology and conservation. Ed. Seminoff J. A. (Miami, FL: NOAA Technical Memorandum NMFS-SEFSC-503), 70.
Karaman S., Turkozan O., Carreras C., Yılmaz C., Sönmez B., Candan O., et al. (2022). Population genetic diversity of green turtles, chelonia mydas, in the Mediterranean revisited. Mar. Biol. 169, 77. doi: 10.1007/s00227-022-04068-1
Kitayama C., Tomiyasu J., Bochimoto H., Kondo S., Tokuda K., Ogawa R., et al. (2021). Histological findings of sperm storage in green turtle (Chelonia mydas) oviduct. Sci. Rep. 11, 19416. doi: 10.1038/s41598-021-98917-6
Komoroske L. M., Jensen M. P., Stewart K. R., Shamblin B. M., Dutton P. H. (2017). Advances in the application of genetics in marine turtle biology and conservation. Front. Mar. Sci. 4. doi: 10.3389/fmars.2017.00156
Larson S. E., Daly-Engel T. S., Phillips N. M. (2017). “Chapter three - review of current conservation genetic analyses of northeast pacific sharks,” in Northeast pacific shark biology, research and conservation part a. Eds. Larson S. E., Lowry M. B. (Cambridge, MA: Academic Press), 79–110. doi: 10.1016/bs.amb.2017.06.005
Levasseur K., Stapleton S. P., Fuller M., Quattro J. (2019). Exceptionally high natal homing precision in hawksbill sea turtles to insular rookeries of the Caribbean. Mar. Ecol. Prog. Ser. 620, 155–171. doi: 10.3354/meps12957
Limpus C. J. (1993). The green turtle, chelonia mydas, in Queensland: breeding males in the southern great barrier reef. Wildl. Res. 20, 513–523. doi: 10.1071/WR9930513
Limpus C. (2008). A biological review of Australian marine turtles. 2. green turtle chelonia mydas (Linnaeus). Rep. Queensl. Environ. Prot. Agency.
Limpus C. J., Miller J. D., Parmenter C. J., Reimer D., McLachlan N., Webb R. (1992). Migration of green (Chelonia mydas) and loggerhead (Caretta caretta) turtles to and from eastern Australian rookeries. Wildl. Res. 19, 347–358. doi: 10.1071/WR9920347
Martin S. L., Van Houtan K. S., Jones T. T., Aguon C. F., Gutierrez J. T., Tibbatts R. B., et al. (2016). Five decades of marine megafauna surveys from Micronesia. Front. Mar. Sci. 2. doi: 10.3389/fmars.2015.00116
Meirmans P. G. (2020). Genodive version 3.0: easy-to-use software for the analysis of genetic data of diploids and polyploids. Mol. Ecol. Resour. 20, 1126–1131. doi: 10.1111/1755-0998.13145
Meirmans P. G., Hedrick P. W. (2011). Assessing population structure: F(ST) and related measures. Mol. Ecol. Resour. 11, 5–18. doi: 10.1111/j.1755-0998.2010.02927.x
Mettler E., Clyde-Brockway C. E., Honarvar S., Paladino F. V. (2019). Migratory corridor linking Atlantic green turtle, chelonia mydas, nesting site on bioko island, equatorial Guinea to ghanaian foraging grounds. PloS One 14, e0213231. doi: 10.1371/journal.pone.0213231
Meylan A. B., Meylan P. A., Ordoñez Espinosa C. (2013). Sea Turtles of bocas del toro province and the comarca ngobe-bugle, republic of Panama. Chelonia Conserv. Biol. 12, 17–33. doi: 10.2744/CCB-0948.1
Moritz C. (1994). Defining “Evolutionarily significant units” for conservation. Trends Ecol. Evol. 9, 373–375. doi: 10.1016/0169-5347(94)90057-4
Naro-Maciel E., Gaughran S. J., Putman N. F., Amato G., Arengo F., Dutton P. H., et al. (2014). Predicting connectivity of green turtles at Palmyra atoll, central pacific: a focus on mtDNA and dispersal modelling. J. R. Soc Interface 11, 20130888. doi: 10.1098/rsif.2013.0888
Owens D. W. (1997). “Hormones in the life history of sea turtles,” in The biology of Sea turtles. Eds. Lutz P. L., Musick J. A. (Boca Raton, FL: CRC Press), 315–341.
Pannell J. R., Charlesworth B. (2000). Effects of metapopulation processes on measures of genetic diversity. Philos. Trans. R. Soc London. Ser. B Biol. Sci. 355, 1851–1864. doi: 10.1098/rstb.2000.0740
Paradis E., Schliep K. (2019). Ape 5.0: an environment for modern phylogenetics and evolutionary analyses in r. Bioinformatics 35, 526–528. doi: 10.1093/bioinformatics/bty633
Pearman W. S., Urban L., Alexander A. (2022). Commonly used hardy–Weinberg equilibrium filtering schemes impact population structure inferences using RADseq data. Mol. Ecol. Resour. 00, 1–15. doi: 10.1111/1755-0998.13646
Petkova D., Novembre J., Stephens M. (2016). Visualizing spatial population structure with estimated effective migration surfaces. Nat. Genet. 48, 94–100. doi: 10.1038/ng.3464
Read T. C., Wantiez L., Werry J., Farman R. (2014). Migrations of green turtles (Chelonia mydas) between nesting and foraging grounds across the coral Sea. PloS One 9, e100083. doi: 10.1371/journal.pone.0100083
Riskas K. A., Fuentes M. M. P. B., Hamann M. (2016). Justifying the need for collaborative management of fisheries bycatch: a lesson from marine turtles in Australia. Biol. Conserv. 196, 40–47. doi: 10.1016/j.biocon.2016.02.001
Roden S. E., Morin P. A., Frey A., Balazs G. H., Zárate P. M., Cheng I.-J. J., et al. (2013). Green turtle population structure in the pacific: new insights from single nucleotide polymorphisms and microsatellites. Endanger. Species Res. 20, 227–234. doi: 10.3354/esr00500
Rousset F. (2008). genepop’007: a complete re-implementation of the genepop software for windows and Linux. Mol. Ecol. Resour. 8, 103–106. doi: 10.1111/j.1471-8286.2007.01931.x
Ryman N., Palm S. (2006). POWSIM: a computer program for assessing statistical power when testing for genetic differentiation. Mol. Ecol. Notes 6, 600–602. doi: 10.1111/j.1471-8286.2006.01378.x
Ryman N., Palm S., André C., Carvalho G. R., Dahlgren T. G., Jorde P. E., et al. (2006). Power for detecting genetic divergence: differences between statistical methods and marker loci. Mol. Ecol. 15, 2031–2045. doi: 10.1111/j.1365-294X.2006.02839.x
Sambrook J., Fritsch E. F., Maniatis T. (1989). Molecular cloning: a laboratory manual, vol. 3 (New York, New York: Cold Spring Harbour Laboratory Press).
Seminoff J. A. (2004). Sea turtles, red listing, and the need for regional assessments. Marine Turtle Newsletter 106, 4–6.
Seminoff J. A., Allen C. D., Balazs G. H., Dutton P. H., Eguchi T., Haas H., et al. (2015). Status review of the green turtle (Chelonia mydas) under the U.S. endangered species act. NOAA technical memorandum (NOAA-NMFS-SWFSC-539), 571.
Seminoff J. A., Zárate P. M., Coyne M. S., Foley D. G. D., Parker D. M., Lyon B. N., et al. (2008). Post-nesting migrations of galápagos green turtles chelonia mydas in relation to oceanographic conditions: integrating satellite telemetry with remotely sensed ocean data. Endanger. Species Res. 4, 57–72. doi: 10.3354/esr00066
Shamblin B. M., Bolten A. B., Abreu-Grobois F. A., Bjorndal K. A., Cardona L., Carreras C., et al. (2014). Geographic patterns of genetic variation in a broadly distributed marine vertebrate: new insights into loggerhead turtle stock structure from expanded mitochondrial DNA sequences. PloS One 9, e85956. doi: 10.1371/journal.pone.0085956
Shamblin B. M., Dutton P. H., Bjorndal K. A., Bolten A. B., Naro-maciel E., Santos A. J. B., et al. (2015). Deeper mitochondrial sequencing reveals cryptic diversity and structure in Brazilian green turtle rookeries. Chelonian Conserv. Biol. 14, 167–172. doi: 10.2744/CCB-1152.1
Shamblin B. M., Hart K. M., Martin K., Ceriani S. A., Bagley D., Mansfield K. L., et al. (2020). Green turtle mitochondrial microsatellites indicate finer-scale natal homing to isolated islands than to continental nesting sites. Mar. Ecol. Prog. Ser. 643, 159–171. doi: 10.3354/meps13348
Shimada T., Limpus C. J., Hamann M., Bell I. P., Esteban N., Groom R., et al. (2020). Fidelity to foraging sites after long migrations. J. Anim. Ecol. 89, 1008–1016. doi: 10.1111/1365-2656.13157
Stewart K. R., LaCasella E. L., Roden S. E., Jensen M. P., Stokes L. W., Epperly S. P., et al. (2016). Nesting population origins of leatherback turtles caught as bycatch in the U.S. pelagic longline fishery. Ecosphere 7, e01272. doi: 10.1002/ecs2.1272/epdf
Summers T. M., Jones T. T., Martin S. L., Hapdei J. R., Ruak J. K., Lepczyk C. A. (2017). Demography of marine turtles in the nearshore environments of the northern Mariana islands. Pacific Sci. 71, 269–286. doi: 10.2984/71.3.3
Teske P. R., Golla T. R., Sandoval-Castillo J., Emami-Khoyi A., van der Lingen C. D., von der Heyden S., et al. (2018). Mitochondrial DNA is unsuitable to test for isolation by distance. Sci. Rep. 8, 8448. doi: 10.1038/s41598-018-25138-9
Tikochinski Y., Bendelac R., Barash A., Daya A., Levy Y., Friedmann A. (2012). Mitochondrial DNA STR analysis as a tool for studying the green sea turtle (Chelonia mydas) populations: the Mediterranean Sea case study. Mar. Genom. 6, 17–24. doi: 10.1016/j.margen.2012.01.002
Tikochinski Y., Bradshaw P., Daya A., Demetropoulos A., Mastrogiacomo A., Broderick A., et al. (2018). Mitochondrial DNA short tandem repeats unveil hidden population structuring and migration routes of an endangered marine turtle. Aquat. Conserv.: Mar. Freshw. Ecosyst. 28, 788–797. doi: 10.1002/aqc.2908
Toews D. P. L., Brelsford A. (2012). The biogeography of mitochondrial and nuclear discordance in animals. Mol. Ecol. 21, 3907–3930. doi: 10.1111/j.1365-294X.2012.05664.x
Toonen R. J., Grosberg R. K. (2011). “Causes of chaos: spatial and temporal genetic heterogeneity in the intertidal anomuran crab petrolisthes cinctipes,” in Phylogeography and population genetics in Crustacea (Boca Raton, Florida: CRC press), 75–107.
Ulrich G. F., Parkes A. S. (1978). The green sea turtle (Chelonia mydas): further observations on breeding in captivity. J. Zool. 185, 237–251. doi: 10.1111/j.1469-7998.1978.tb03324.x
Valdivia A., Wolf S., Suckling K. (2019). Marine mammals and sea turtles listed under the U.S. endangered species act are recovering. PloS One 14, e0210164. doi: 10.1371/journal.pone.0210164
Van Oosterhout C., Hutchinson W. F., Wills D. P. M., Shipley P. (2004). MICRO-CHECKER: software for identifying and correcting genotyping errors in microsatellite data. Mol. Ecol. Notes. 4, 535–538. doi: 10.1111/j.1471-8286.2004.00684.x
Vargas S. M., Barcelos A. C., Rocha R. G., Guimarães P., Amorim L., Martinelli A., et al. (2022). Genetic monitoring of the critically endangered leatherback turtle (Dermochelys coriacea) in the south West Atlantic. Reg. Stud. Mar. Sci. 55, 102530. doi: 10.1016/j.rsma.2022.102530
Velez-Zuazo X., Ramos W. D., van Dam R. P., Diez C. E., Abreu-Grobois F. A., McMillan W. O. (2008). Dispersal, recruitment and migratory behaviour in a hawksbill sea turtle aggregation. Mol. Ecol. 17, 839–853. doi: 10.1111/j.1365-294X.2007.03635.x
Wallace B. P., DiMatteo A. D., Bolten A. B., Chaloupka M. Y., Hutchinson B. J., Abreu-Grobois F. A., et al. (2011). Global conservation priorities for marine turtles. PloS One 6, 12–13. doi: 10.1371/journal.pone.0024510
Wallace B. P., DiMatteo A. D., Hurley B. J., Finkbeiner E. M., Bolten A. B., Chaloupka M. Y., et al. (2010). Regional management units for marine turtles: a novel framework for prioritizing conservation and research across multiple scales. PloS One 5, e15465. doi: 10.1371/journal.pone.0015465
Wang C., Schroeder K. B., Rosenberg N. A. (2012). A maximum-likelihood method to correct for allelic dropout in microsatellite data with no replicate genotypes. Genetics 192, 651–669. doi: 10.1534/genetics.112.139519
Waples R. S. (2015). Testing for hardy–Weinberg proportions: have we lost the plot? J. Hered. 106, 1–19. doi: 10.1093/jhered/esu062
Weir B. S., Cockerham C. C. (1984). Estimating f-statistics for the analysis of population structure. Evol. (N. Y). 38, 1358–1370. doi: 10.2307/2408641
Whitlock M. C. (2011). G’ST and d do not replace FST. Mol. Ecol. 20, 1083–1091. doi: 10.1111/j.1365-294X.2010.04996.x
Witherington B. E., Bresette M. J., Herren R. (2006). “Chelonia mydas – green turtle,” in Biology and conservation of Florida turtles. chelonian research monographs, vol. 3 . Ed. Meylan P. A., (Lunenburg, MA: Chelonian Research Foundation) 90–104.
Keywords: Chelonia mydas, nuclear markers, population genetics, male-mediated gene flow, conservation units, stock structure
Citation: Roden SE, Horne JB, Jensen MP, FitzSimmons NN, Balazs GH, Farman R, Cruce Horeg J, Hapdei J, Heidemeyer M, Jones TT, Komoroske LM, Limpus CJ, Murakawa S, Piedra R, Sarti-Martínez L, Summers T, Tatarata M, Vélez E, Zárate P and Dutton PH (2023) Population structure of Pacific green turtles: a new perspective from microsatellite DNA variation. Front. Mar. Sci. 10:1116941. doi: 10.3389/fmars.2023.1116941
Received: 06 December 2022; Accepted: 09 May 2023;
Published: 03 July 2023.
Edited by:
David M. P. Jacoby, Lancaster University, United KingdomReviewed by:
Kevin Feldheim, Field Museum of Natural History, United StatesCopyright © 2023 At least a portion of this work is authored by John B. Horne, Suzanne E. Roden, T.Todd Jones, Shawn Murakawa, and Peter H. Dutton on behalf of the U.S. Government and as regards Dr. Horne, Ms. Roden, Dr. Jones, Ms. Murakawa, and Dr. Dutton and the U.S. Government, is not subject to copyright protection in the United States. This is an open-access article distributed under the terms of the Creative Commons Attribution License (CC BY). The use, distribution or reproduction in other forums is permitted, provided the original author(s) and the copyright owner(s) are credited and that the original publication in this journal is cited, in accordance with accepted academic practice. No use, distribution or reproduction is permitted which does not comply with these terms.
*Correspondence: Suzanne E. Roden, c3V6YW5uZS5yb2RlbkBub2FhLmdvdg==
Disclaimer: All claims expressed in this article are solely those of the authors and do not necessarily represent those of their affiliated organizations, or those of the publisher, the editors and the reviewers. Any product that may be evaluated in this article or claim that may be made by its manufacturer is not guaranteed or endorsed by the publisher.
Research integrity at Frontiers
Learn more about the work of our research integrity team to safeguard the quality of each article we publish.