 Yansong Liu
 Qiang Ren1,2,3*
 Fei Yu
 Chuanjie Wei
 Feng Nan
- 1Institute of Oceanology, Chinese Academy of Sciences, Qingdao, China
- 2Key Laboratory of Ocean Circulation and Waves, Institute of Oceanology, Chinese Academy of Sciences, Qingdao, China
- 3Laboratory for Ocean and Climate Dynamics, Qingdao National Laboratory for Marine Science and Technology, Qingdao, China
- 4University of Chinese Academy of Sciences, Qingdao, China
Surface and Subsurface currents in the Philippine Sea have been reported previously, and the debate persists regarding whether they are related to the strength of ENSO (El Niño/Southern Oscillation). We investigated the mean vertical structure and variability of the currents along the western boundary of the Philippine Sea using mooring observations at about 8°N, 127°E from August 2014 to January 2016. The southward Mindanao Current (MC) exists in the upper 600 m countered by the northward Mindanao Undercurrent (MUC) observed below 600 m to the depth of 2,000 m, with a core at approximately 1,000 m. During the development of El Niño from July to December 2015, the core velocity and depth of the MC were noticeably increased, consistent with the Niño 3.4 index, and the current at 2,000 m was observed to be southward, which indicated that the MC may extend to 2,000 m under the influence of El Niño. The MUC was stronger around November 2015, corresponding to the peak phase of the Niño 3.4 index. The intraseasonal variability with a period of 70-110 days from the surface to 2,000 m is also discussed based on power spectral analysis. Subsurface eddies are likely the source of the intraseasonal variability of current in the Philippine Sea from the model outputs.
1 Introduction
Western boundary currents (WBCs) are swift, narrow oceanic currents found in all major oceanic gyres (Hu et al., 2015). The Pacific WBCs impact global ocean circulation and variability by supplying heat and moisture into the atmosphere, exchanging water with the Indian Ocean, and transporting mass between the equatorial and subtropical Pacific (Nakamura et al., 2004). In the Northern Hemisphere, the low-latitude WBC in the Pacific is characterized as the Mindanao Current (MC). Since the southward flow of the MC was indicated (Hu and Cui, 1989), various measurements, including satellite altimeters, hydrographic observations, and Argo floats, were used to analyze the structure and multiscale variability of the MC (Nakamura and Kazmin, 2003). Many previous studies have found that the MC is a stable, 200-km-wide coastal jet with a maximum speed of 1 m s-1 (Lukas et al., 1991; Wijffels et al., 1995; Wang et al., 2015). The Mindanao Undercurrent (MUC) is of particular interest because there have been few observations regarding its behavior at depth, and there is continuing debate regarding the nature of the MUC as being transient or a permanent current (Hu and Cui, 1989, Guan, 1990; Lukas et al., 1991; Wijffels et al., 1995; Qu et al., 2012).
The temporal variability of the MC/MUC was observed to consist of intraseasonal, seasonal, and interannual signals. For example, on the basis of 2-yr mooring measurements from 2010 to 2012 and from November 2017 to December 2019 using a subsurface mooring at about 8°N 127°E, intraseasonal variability with a period of 60-80 days was suggested through the entire water column, including the MC and MUC (Zhang et al., 2014; Azminuddin et al., 2022). Seasonal and interannual variability in the MC was investigated using mooring data at the same location with 4-yr observations (Hu et al., 2016; Wang et al., 2016). Combined with the high-resolution numerical model, the intraseasonal variability of the subthermocline current east of Mindanao was also characterized and determined to be caused by subthermocline eddies (Wang et al., 2014; Azminuddin et al., 2022).
The 2015-2016 El Niño was one of the strongest events of the tropical Pacific Ocean in the observed history, with the similar strength to the 1982-1983 and 1997-1998 events. The Pacific low latitude western boundary currents are believed to play a key role in the heat budget of the warm pool that is an important factor in the El Niño/Southern Oscillation (ENSO) (Lukas et al., 1996). However, debate persists regarding whether the MC/MUC is related to the strength of ENSO. Lukas (1988) found that fluctuations in MC have no apparent relationship with the strength of ENSO by analyzing sea level records. Qiu and Lukas (1996) and Zhang et al. (2014) also suggested that the interannual variation in the MC does not always correspond to ENSO. However, based on mooring observations, Kashino et al. (2005) suggested that the MC core velocity was high during the onset of the 2002/03 El Niño. A stronger MC was also measured during the 2006/07 El Niño using onboard observation measurements (Kashino et al., 2009). Meanwhile, results from a high-resolution ocean general circulation model (OGCM) showed that MC transport increased during El Niño (Kim et al., 2004). Moreover, the MUC was particularly strong in December 2006 (Kashino et al., 2009). It is therefore possible that the MUC is also affected by the ENSO phenomenon. Schonau and Rudnick (2017) reported that the transport in the subthermocline is strongly poleward during La Niña and equatorward during El Niño according to glider observations. Hui et al. (2022) also reported the interannual variation of EKE below the thermocline east of the Philippine coast which is closely related to the modulation of the ENSO events.
In this study, we analyzed direct mooring observations at 8°N, 127°E along the western boundary of the Philippine Sea from August 2014 to January 2016. The vertical structure and variability of the low-latitude western boundary current east of Philippines during the 2015/2016 El Niño were investigated as well.
2 Data and methods
In August 2014, a mooring was deployed at 8°N, 127°E (Figure 1A) during the cruise in the West Pacific conducted by the Institute of Oceanology, Chinese Academy of Science (IOCAS), which was recovered successfully by R/V Science in January 2016. To acquire the full-depth current velocity, self-contained instruments, including acoustic Doppler current profilers (ADCPs), and single point current meters (Aqds-6000), were mounted on the mooring (Figure 1B). Two 75-KHz ADCPs were equipped on the main float at a depth of 400 m, looking upward and downward respectively. The ADCPs were configured to measure velocities every hour in 60 bins with a bin size of 8 m. The observation period was from 30 August 2014 to 13 January 2016. Below 1000 m, three Aqds-6000 current meters produced by Nortek were moored at 1,000 m, 2,000 m, and 5,900 m, respectively. The measurement interval of Aqds-6000 current meters were also set to hourly. In this study, the data measured by ADCPs and Aqds-6000 at 1,000 m and 2,000 m were used to investigate variability in the flows of the MC and MUC.
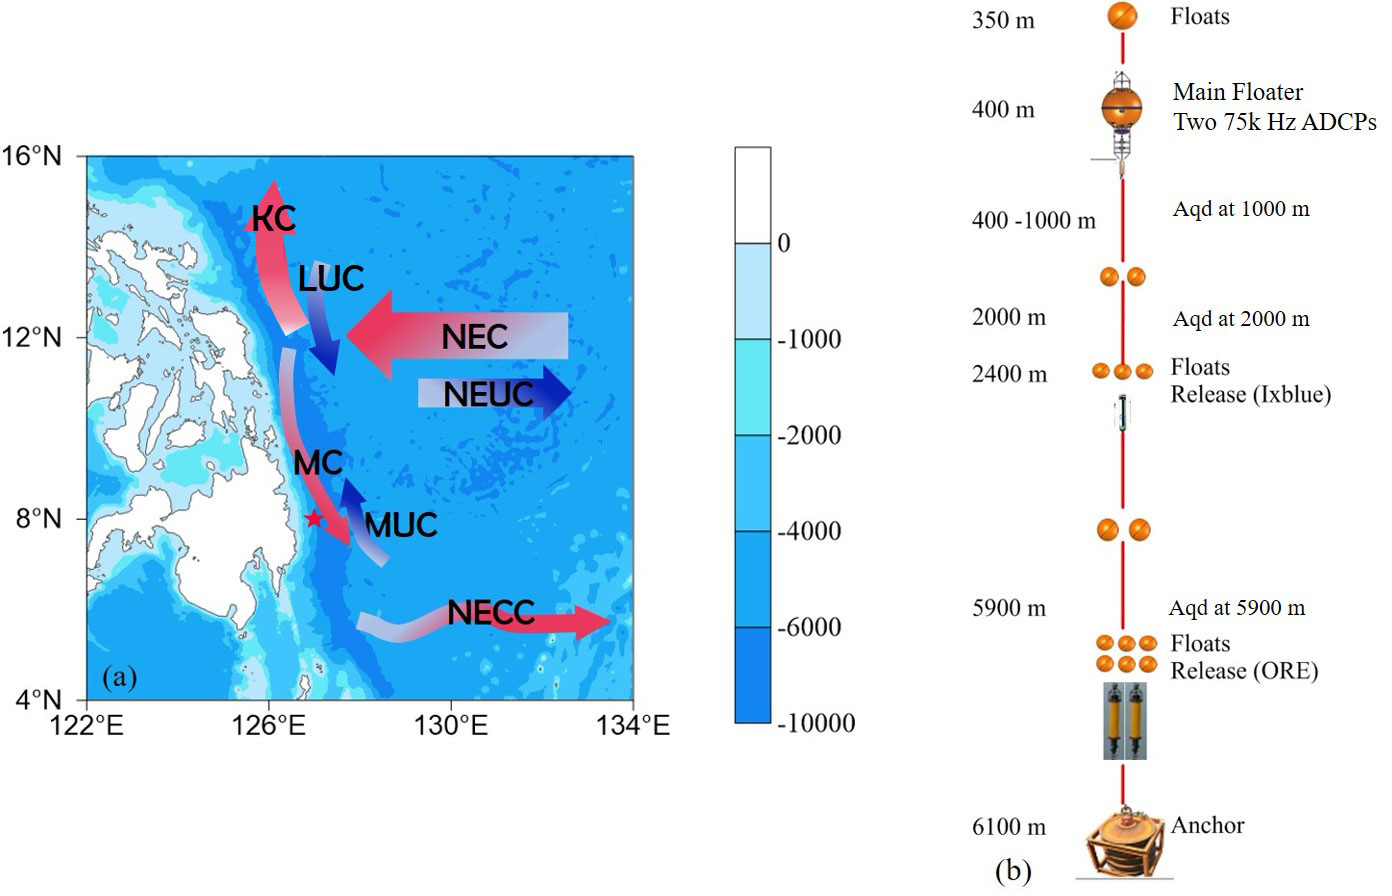
Figure 1 (A) Bottom topography and surface (red arrows) and subsurface (blue arrows) currents around Philippines. NEC, North Equatorial Current; NEUC, North Equatorial Current; MC, Mindanao Current; MUC, Mindanao Undercurrent; NECC, North Equatorial Counter Current; KC, Kuroshio Current; LUC, Luzon Undercurrent. The red triangle denotes the mooring at 8°N, 127°E. (B) Vertical structure of the mooring system.
Data quality was strictly controlled after being downloaded from all equipment. Current speeds larger than 2 m s-1 are cut off, and the percentage of good beams (PG) less than 60% was not considered. The pitch and roll of the current instrument of less than 20° is adopted. Due to the impact of surface refection of sound beams, the data at the upper 50 m were cut off. The resolution for the current measurement of the ADCPs and Aqd-6000 current meters is less than 1 mm s-1, while the accuracy of measurement is less than 1% of the measured value ±5 mm s-1. To remove the tidal signal, daily averaged data were used in the following analysis. Values of the Niño 3.4 index were provided by the Climate Prediction Center of the National Oceanic and Atmospheric Administration (NOAA) during the mooring period (http://origin.cpc.ncep.noaa.gov/products/analysis_monitoring/ensostuff/ONI_v5.php). Therefore, mooring observations were conducted under the 2015/2016 El Niño conditions and are suitable for comparing differences in the ocean state between this condition and normal conditions.
The OFES (Oceanic General Circulation Model for the Earth Simulator) model is based on the third version of the Modular Ocean Model (MOM 3.0) and has a horizontal resolution of 0.1° and 54 vertical levels. The 3-day model outputs from 2014 to 2016 are used in this study. Detailed descriptions about this model can be found in Masumoto et al. (2004) and Sasaki et al. (2008). OFES outputs have been widely applied to the investigation of the general circulation in the western Pacific and these studies indicate that the model outputs are generally consistent with observations (e.g., Wang et al., 2014; Song et al., 2017; Zhang et al., 2021). Therefore, OFES is believed as a suitable model products to explore the ocean currents in the western Pacific.
The daily gridded and merged sea level anomaly (SLA) with a horizontal resolution of 0.25°×0.25° for the period from 2014 to 2016 is also used in this study. The data set is distributed by Copernicus Marine Environment Monitoring Service (CMEMS). The SLA is estimated by Optimal Interpolation, merging the L3 along-track measurement from the different altimeter missions available.
3 Results
3.1 Vertical structure
Figure 2 shows the horizontal currents and statistical values measured by ADCPs. From the time series of meridional velocity recorded by ADCPs (Figure 2A), the southward MC plays a dominant role in the upper 600 m and extends over 1,000 m at particular times. The data were first interpolated vertically onto 50-900 m of 5 m vertical resolution and then derived the annual mean values from 1 January 2015 to 31 December 2015. According to the lines of the mean value and standard deviation (Figure 2B), the annual mean value of meridional velocity reaches up to -102.77 cm s-1 at the depth of 85 m. The zonal velocity is weak compared with the meridional velocity. Therefore, the meridional velocity is used to approximate the intensity of MC and MUC. The observations reported by Zhang et al. (2014) and Hu et al. (2016) were made at the same location during the period from December 2010 to August 2014. The maximum mean MC velocity from August 2014 to January 2016 was stronger than that reported by Zhang et al. (2014) (-73 cm s-1) and Hu et al. (2016) (-78 cm s-1) but weaker than that at 6°50’N, 126°43’E reported by Kashino et al. (2005) (-138 cm s-1). This difference may be attributed to interannual variation. The standard deviation at 85 m was approximately 15 cm s-1, which is much smaller than the mean value, indicating that the MC is an exceptionally stable current. This is consistent with previous studies. Below 600 m, the mean current flows to the north are part of the MUC, which had a maximum mean velocity of 4.84 cm s-1 at the around depth of 865 m with a standard deviation of 10.9 cm s-1.
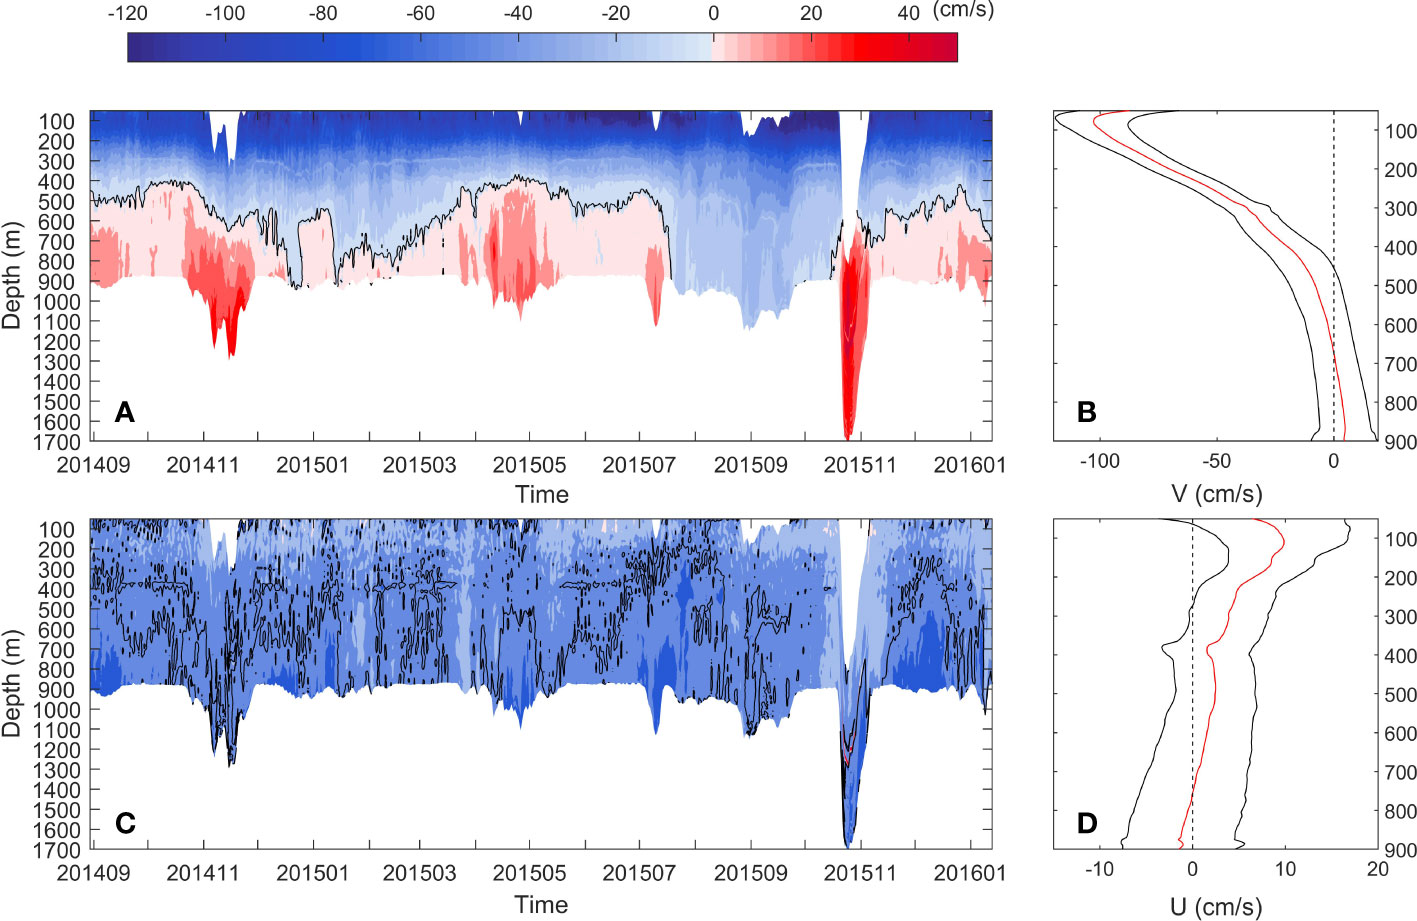
Figure 2 Time series of daily averaged velocity (cm s-1) measured by ADCPs at 8°N, 127°E from September 2014 to January 2016, with annual mean velocity (red line), standard deviation (black line) in meridional (A, B) and zonal (C, D) currents (cm s-1).
To compare the velocity between the upper layer and 1,000 m, the velocity recorded by ADCPs at 800 m depth after interpolation is illustrated in Figure 3A. The horizontal currents recorded by Aqds-6000 current meters below 1000 m are shown in Figures 3B, C. As described above, the currents at 800-m and 1,000-m depths are regarded as part of the MUC. In particular, increased mean values of meridional velocities with depth are observed, from 5.71 cm s-1 at 800 m to 11.58 cm s-1 at 1,000 m (Table 1). This means that the northward-flowing MUC has a core at depth around 1,000 m or between 1000-2000 m from August 2014 to January 2016. For the 2,000-m depth, the mean zonal and meridional velocities are -2.09 and 1.49 cm s-1, with standard deviations of 4.21 and 7.08 cm s-1, respectively. Note that the maximum daily velocity magnitudes at the depth of 2,000 m exceed 12 cm s-1 and 20 cm s-1 for the zonal and meridional velocities, respectively, which are much stronger than the mean current. It should be noted that from mid-July to October 2015, the current at 2,000 m had a velocity around 10 cm s-1, consistent with the current above 1,000 m, which indicates that the MC extended to 2,000 m during the onset period of the 2015/2016 El Niño event. Actually, the depth of the current meters varies as the pressure sensors show in Figure 3 (green lines). The lines and vectors at depths of 800 m, 1,000 m, and 2,000 m show the velocity at deeper depths. For example, the pressure increased approximately 900 m, 800 m, and 600 m in October 2015, and the lines and vector at that time actually illustrated the velocity at depths of 1,700 m, 1,800 m and 2,600 m. This means that the depth of the MC can reach depths deeper than 2,000 m. The phenomena extend our understanding of the variation in the MC during El Niño events.
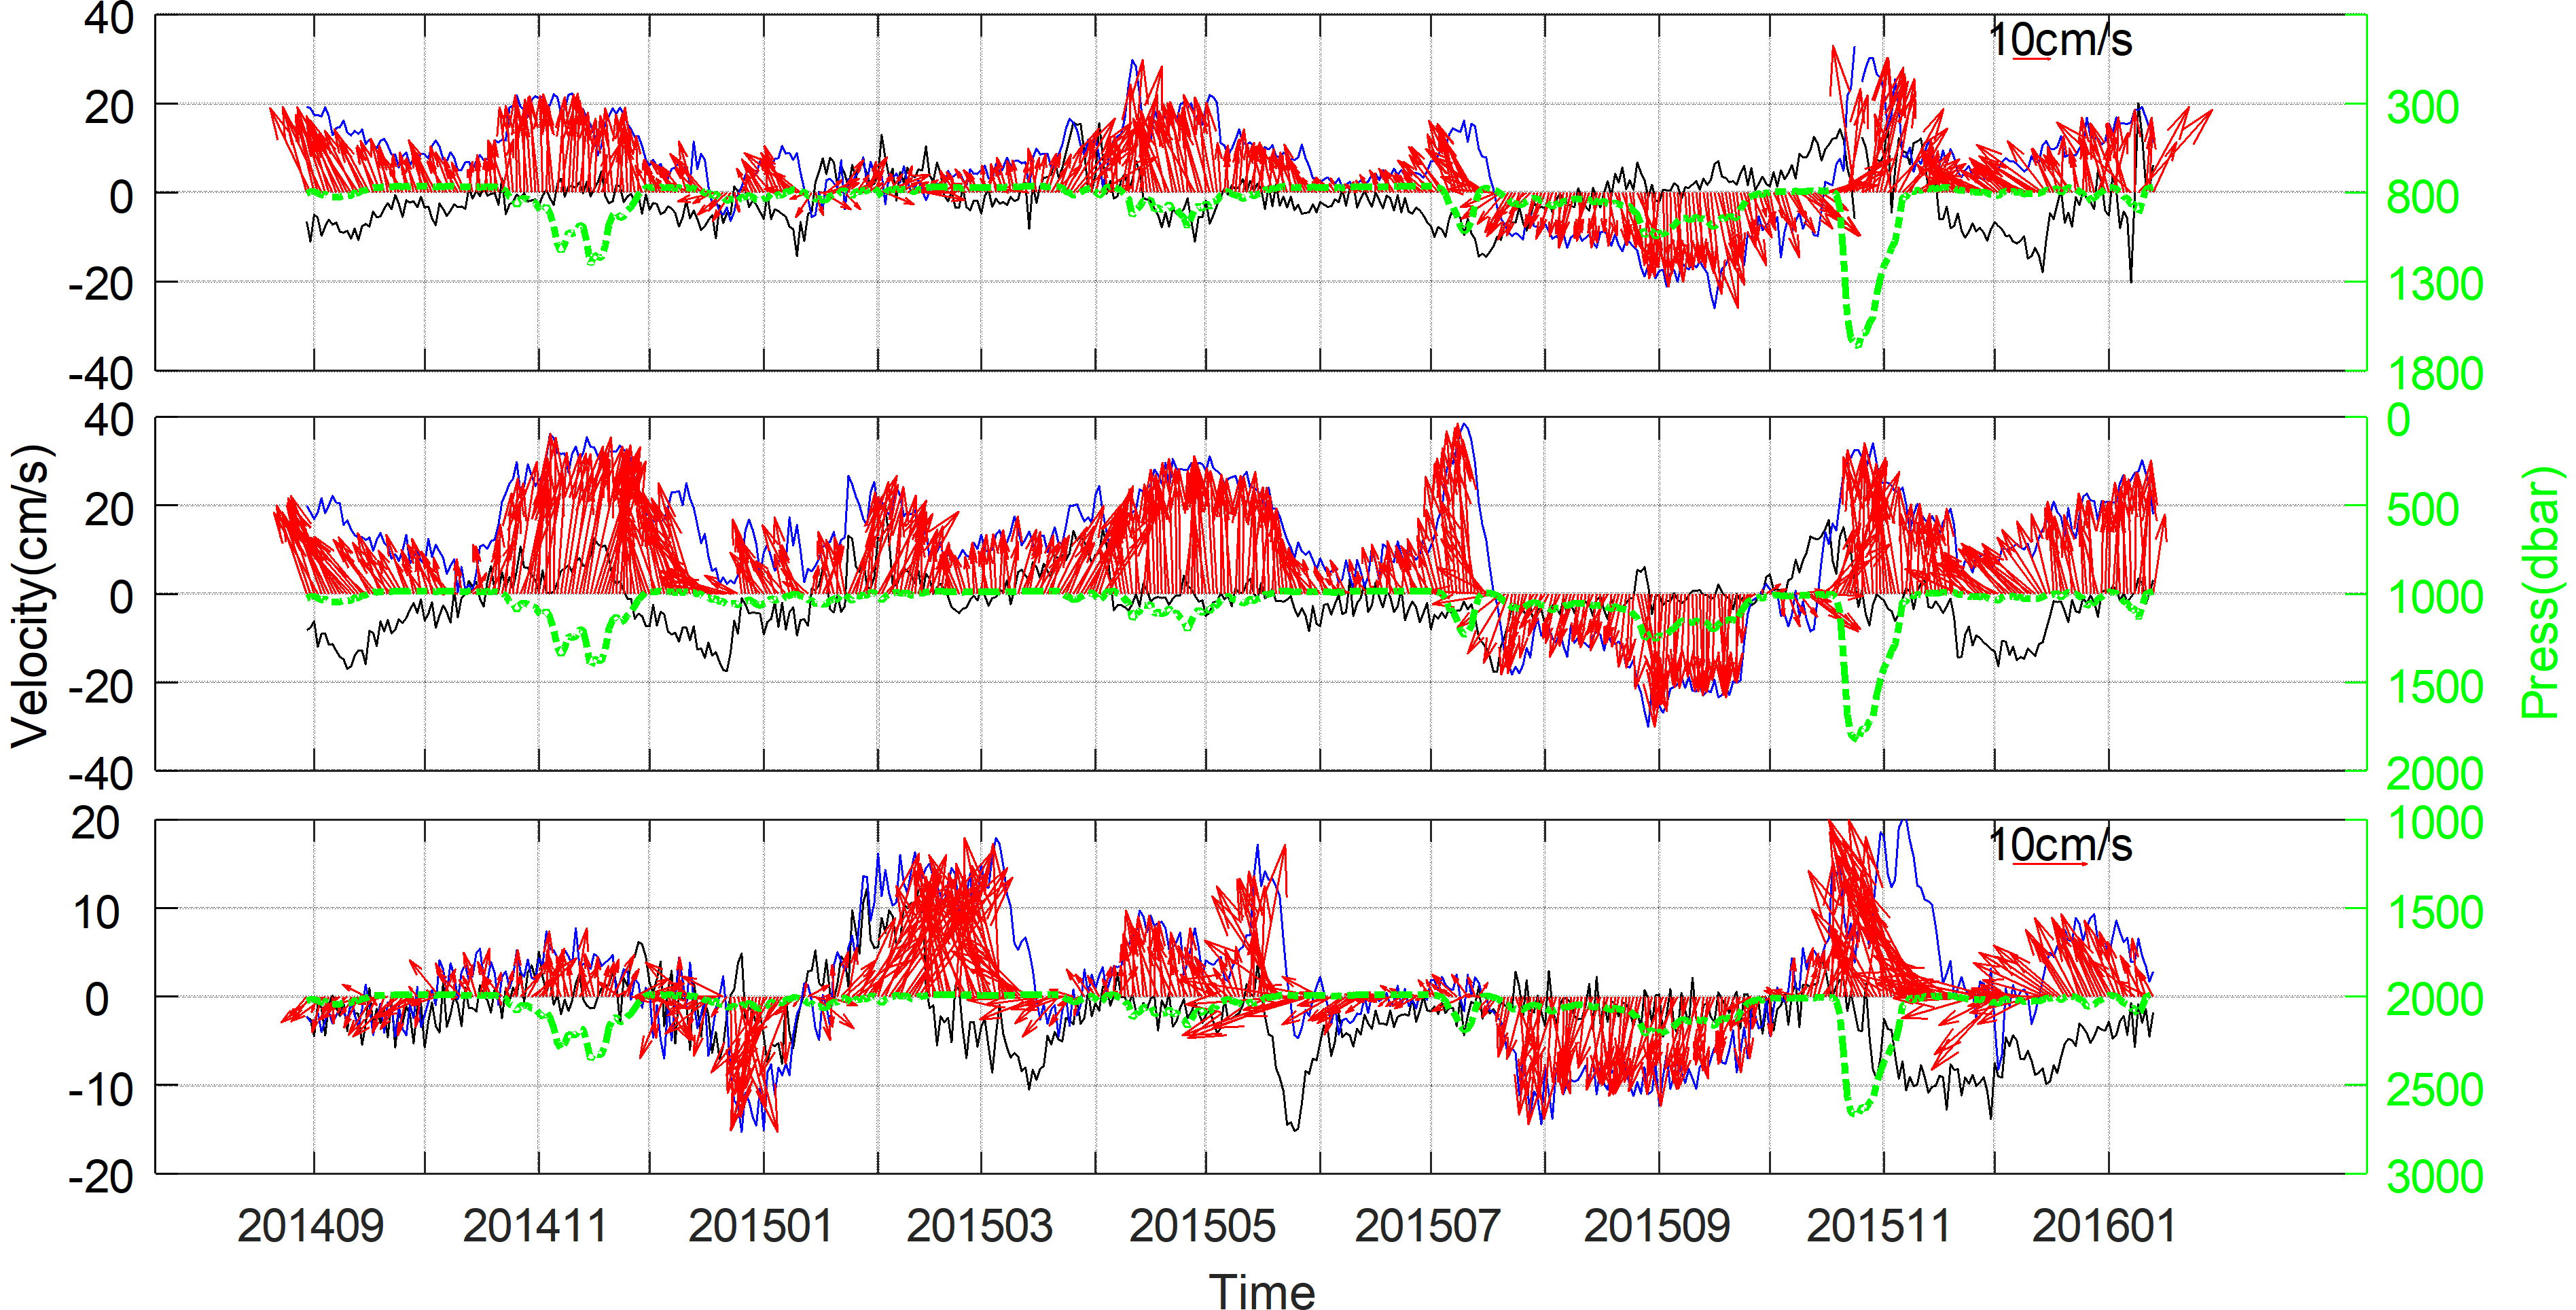
Figure 3 Time series of daily averaged zonal (black line) and meridional (blue line) velocity and flow vector (red line) at 127°E/8°E by (A) ADCPs at 800 m, and Aqds-6000 current meters at (B) 1000 m, and (C) 2000 m from August 2014 to January 2016 (units are cm s-1).
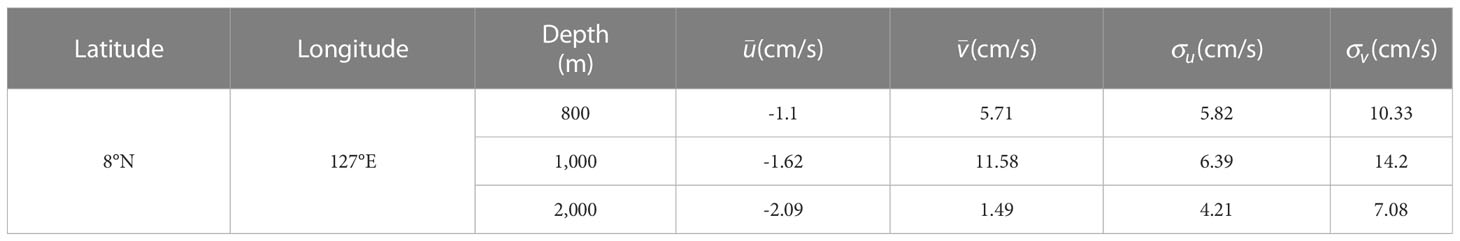
Table 1 Velocity statistics from mooring data at different layers in terms of mean values and standard deviation.
According to the Niño 3.4 index, the ENSO phase was positive (El Niño) during the mooring observations period, and was strongest in November and December 2015. To investigate the variability of the MC, the meridional velocity at 150 m and the depth of meridional velocity of little than -5 cm s-1 are regarded as the core velocity and depth of the MC. Figure 4 displays a monthly time series plot of the core velocity (blue line), the depth (black line) of the MC and the Niño 3.4 index (red line). During the development of El Niño from July to December 2015, the core velocity and depth of the MC were obviously increased and compared with the Niño 3.4 index. Notably, it seems that the variability of the MC precedes the El Niño by 2-3 months. The stronger MC during El Niño is consistent with the observations of (Kashino et al, 2005; Kashino et al, 2009) and the numerical results of Kim et al. (2004).
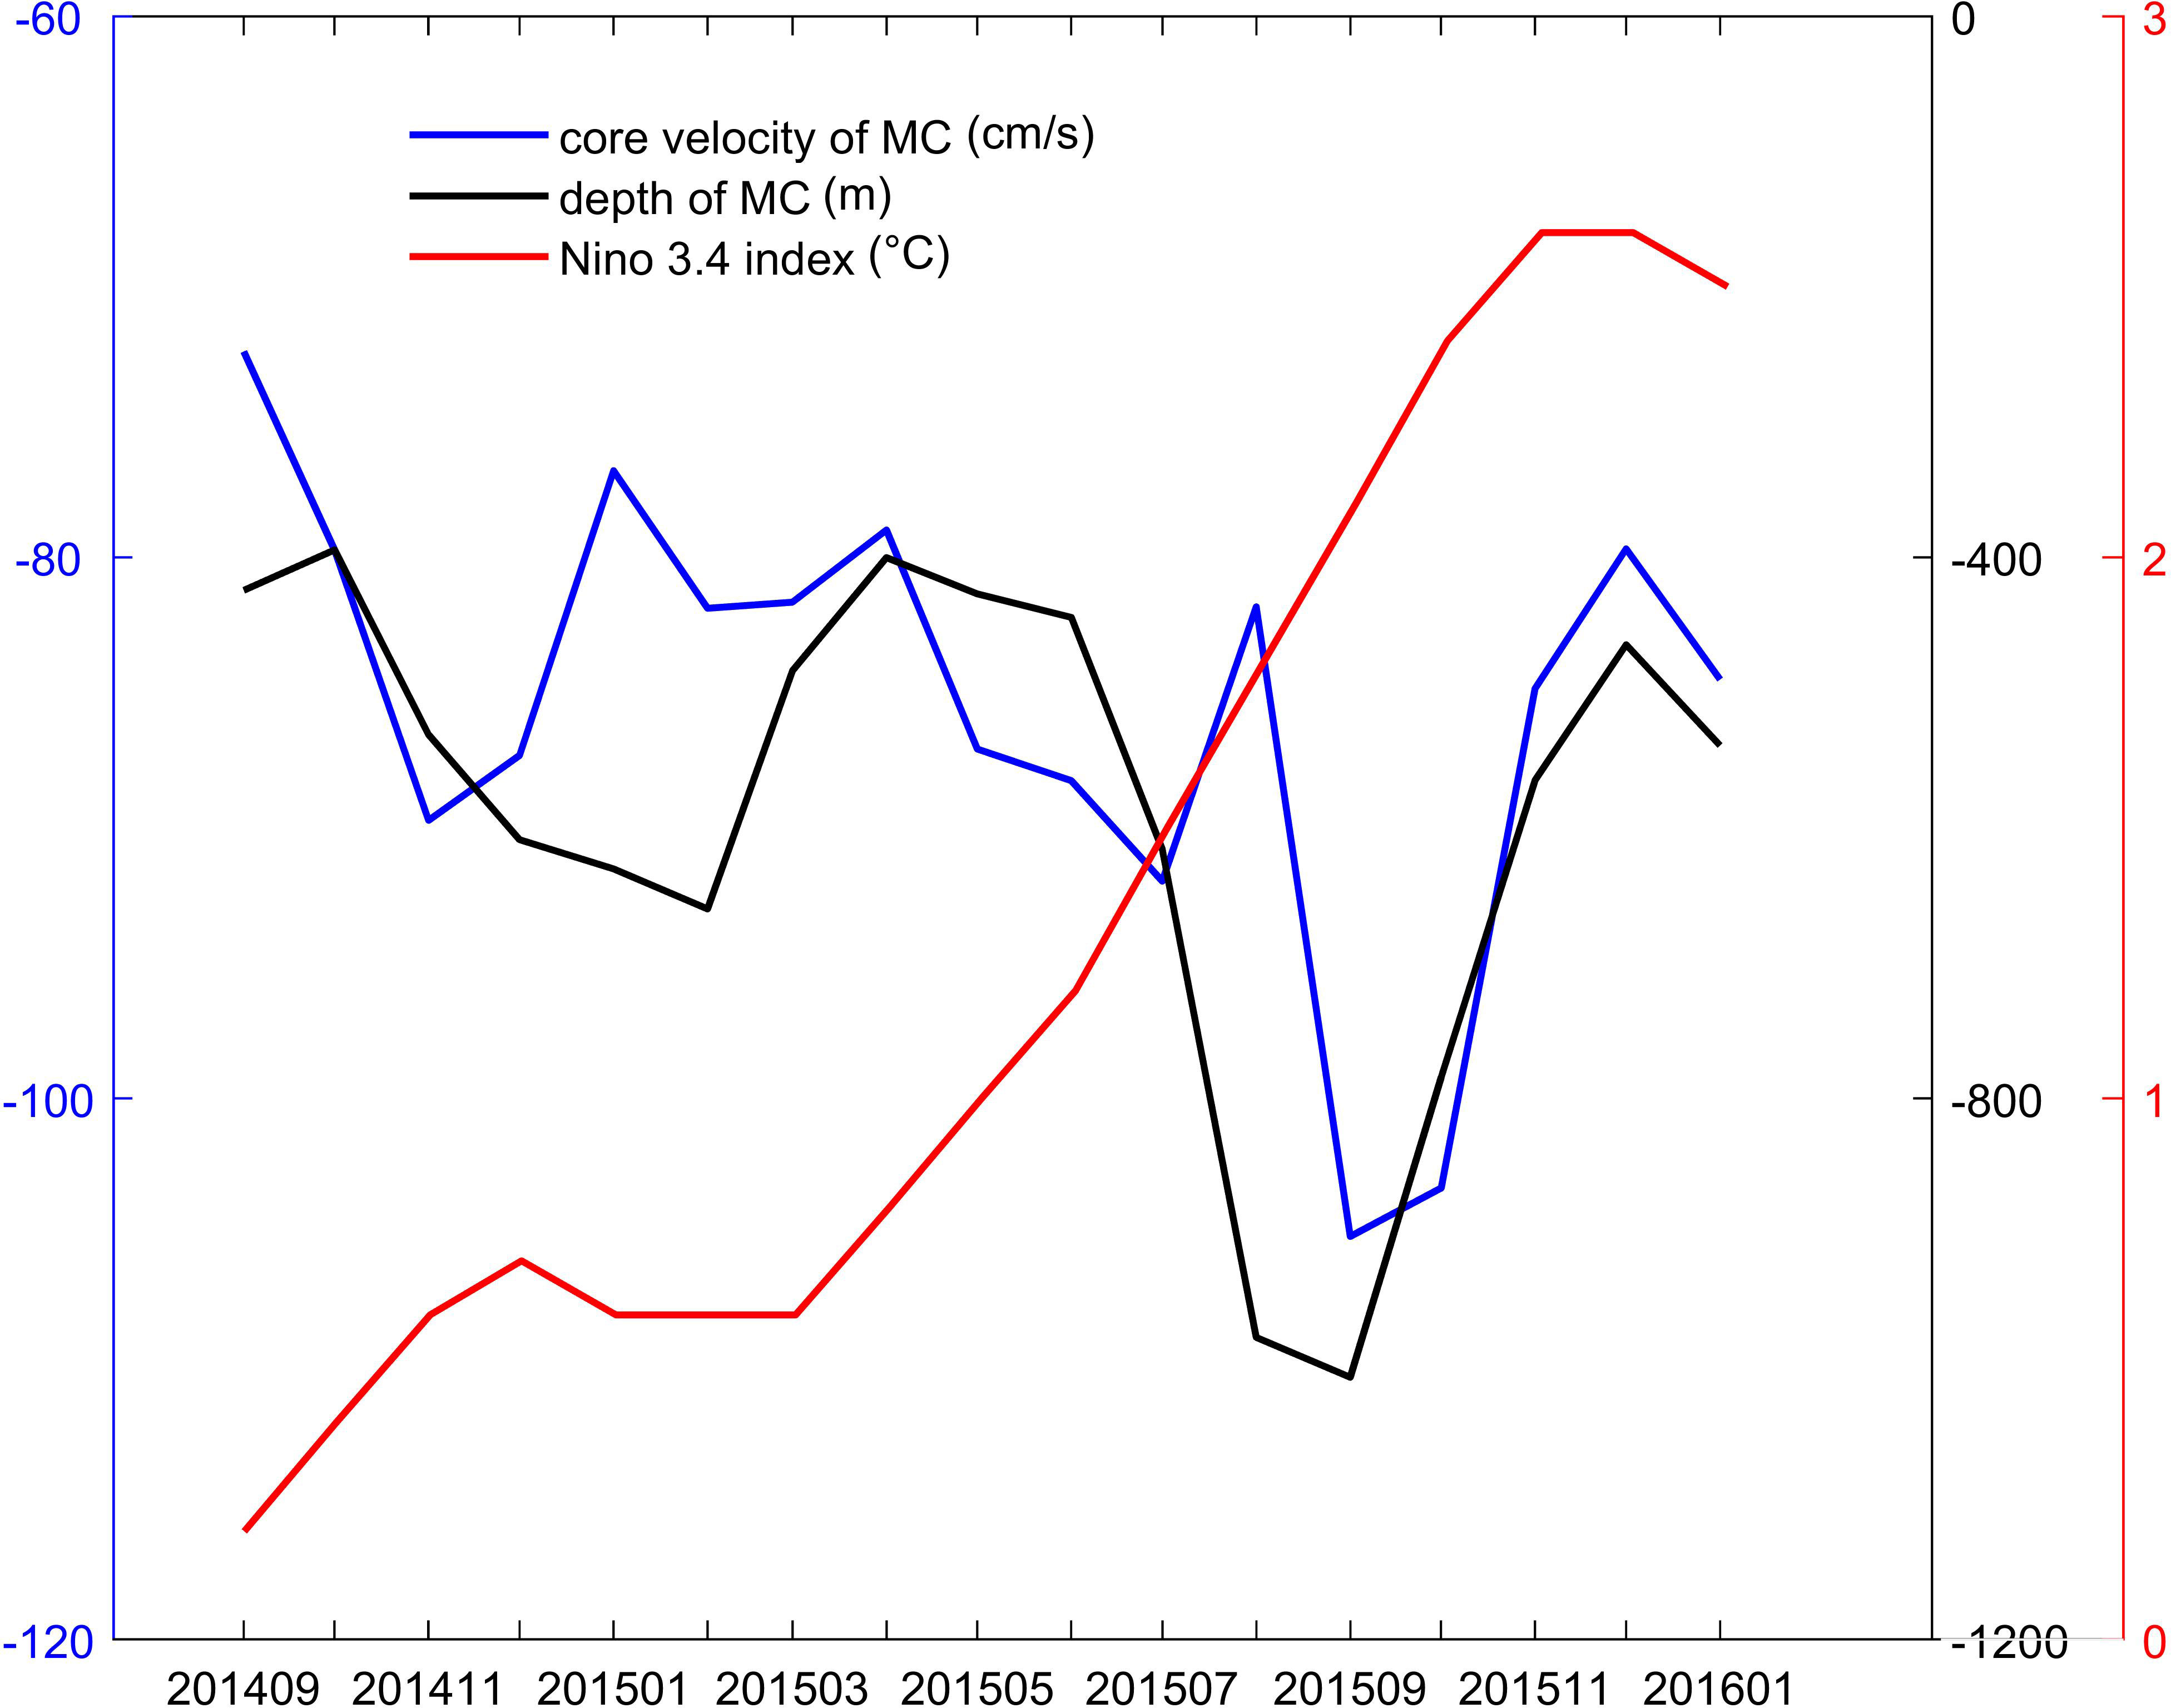
Figure 4 Monthly time series of the core velocity (cm s-1) (blue) and depth (m) (black) of MC and Niño 3.4 index (°C) (red) from September 2014 to January 2016.
Another notable feature for the structure of velocity is the strength of the MUC during El Niño. The vertical averaged meridional velocity from the depth at that velocity is greater than 5 cm s-1 to the deepest record by ADCPs was calculated to represent the strength of the MUC. Figure 5 shows the time series of the smoothed velocity of the MUC and Niño 3.4 index. Over the observation duration, the peaks of the averaged velocity were observed in November 2014 and November 2015. Correspondingly, the crests of the Niño 3.4 index are observed in November 2015. The consistent between Nino 3.4 index and the strength of the MUC imply that the undercurrent was modulated by El Niño. It is possible that El Niño affected the MUC through active subsurface ocean eddies which are suggested to be closely related to the variability of the MUC (Firing et al., 2005; Wang et al., 2014). It is worth noting that the pressure (green lines in Figure 3) in late October and early November 2015 increased significantly and was consistent with the Niño 3.4 index but preceded about 1 months. The MUC could be strengthened by 2015/2016 El Niño, increased the displacement of ADCPs and the current meters on the mooring.
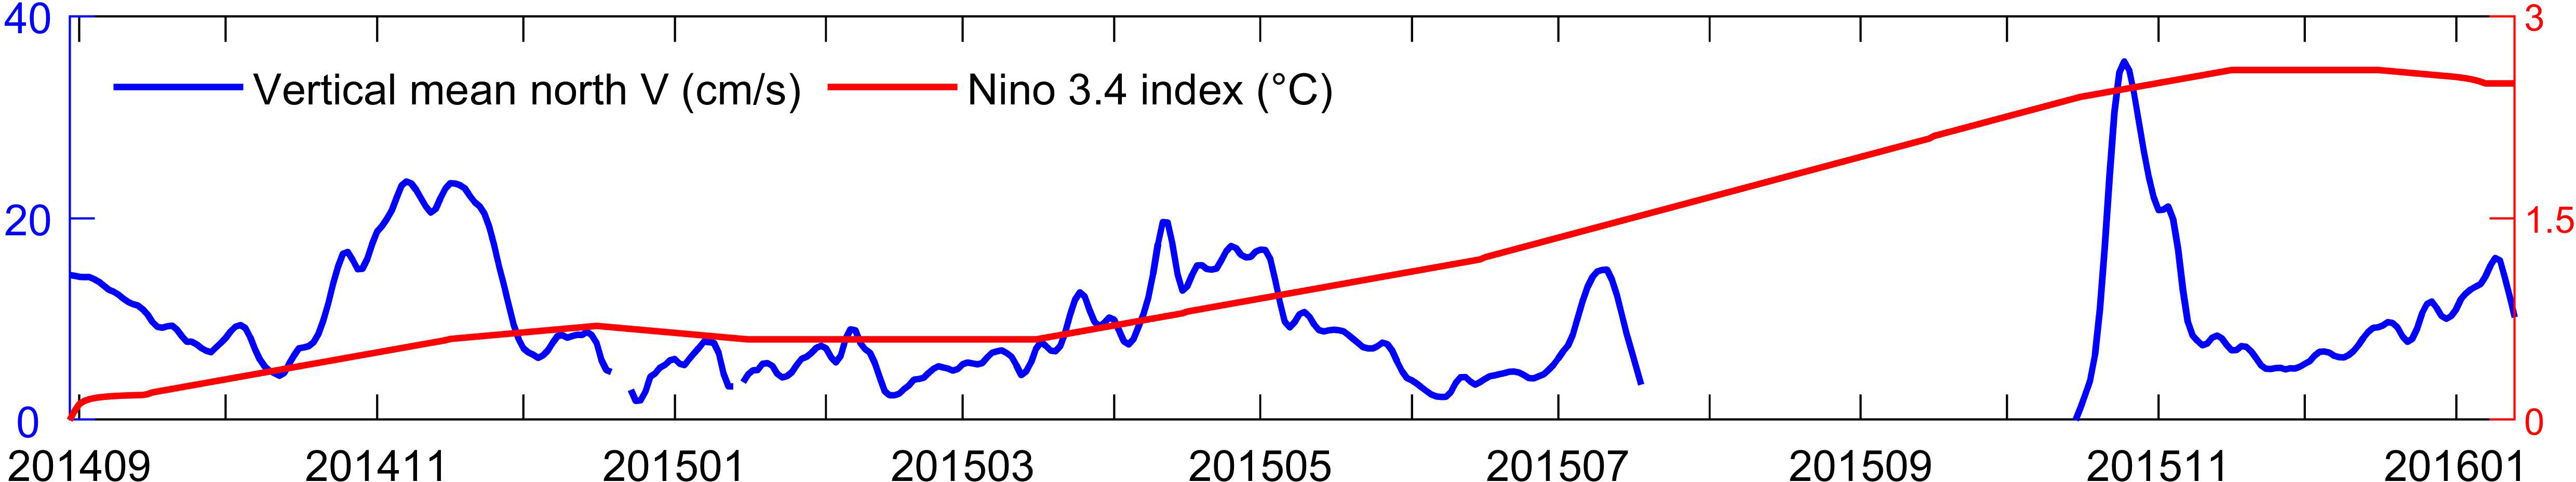
Figure 5 Time series of smoothed vertical mean north meridional velocity (cm s-1) (blue) and Niño 3.4 index (°C) (red) from August 2014 to January 2016.
3.2 Variability from direct observations
Mooring measurements not only provide the mean velocity structure of the currents but also enable us to investigate the variability of these currents. To clarify the variability from observations measured by ADCPs and Aqds-6000 current meters, we used power spectral analysis. The power spectra of the zonal and meridional velocity time series at all depths between 50 m and 800 m with the ADCPs-measured data are shown in Figure 6. The coherent peak exhibiting zonal velocity for a period of around 70 days comprised almost the entire water column from the surface to 800 m. However, for meridional velocity, the peak of approximately 110 days is significant only above 300 m, and the period of 180 days is significant below 300 m. Figure 7 illustrates the power spectra of zonal and meridional velocity recorded by Aqds-6000 current meters below 1,000 m. For the zonal velocity, the strongest with a 95% confidence level peak corresponds to the period of 110 days at 1,000 m and 80 days at 2,000 m. For the meridional velocity, only the peak at approximately 80 days at 1,000 m is above 95% confidence level. If the confidence level was reduced to 90%, the peak of 80 days at 2,000 m passed the significance test. In total, the intraseasonal variability of a period of 80-110 days was detected in the upper 300 m and 1,000 m layers for the meridional velocity. For the zonal velocity, the whole water column from the surface to 2000 m had similar features. Zhang et al. (2014); Wang et al. (2014) and Wang et al. (2017) also mentioned the intraseasonal variability with a band of 60-80 days from the current meter measurements at the same mooring location. The difference from their studies may be attributed to the interannual variability.
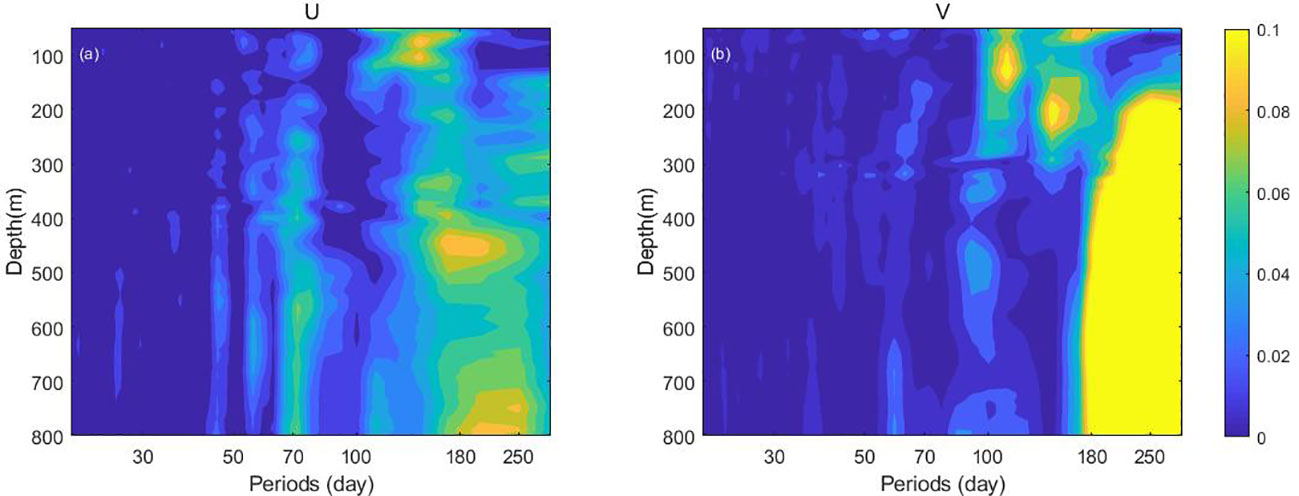
Figure 6 Power Spectral Density of velocity measured by ADCPs in (A) zonal and (B) meridional currents.
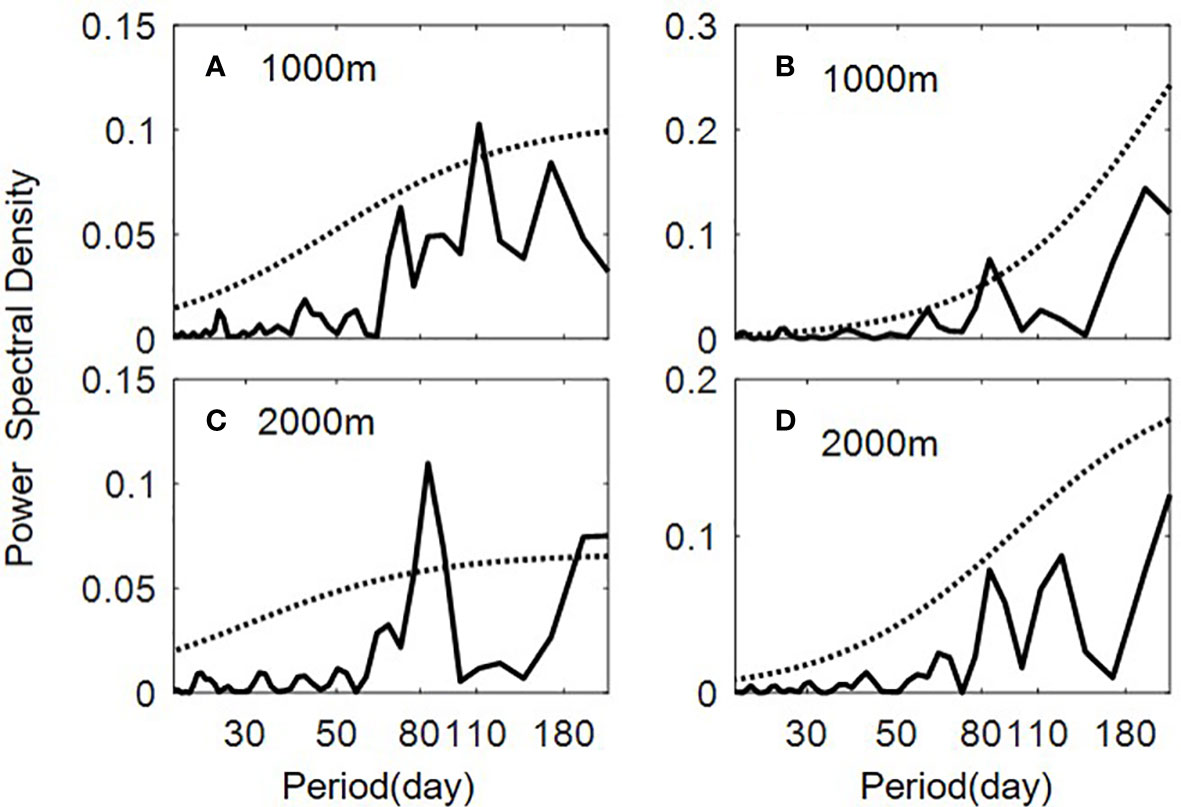
Figure 7 Power Spectral Density of zonal (left) and meridional (right) velocity recorded by Aqds-6000 current meters at (A, B) 1000 m, and (C, D) 2000 m. Dashed lines means the significance test of 95% confidence level.
To better understand the intraseasonal variability from surface to bottom, the horizontal velocities were processed with a 30-150 days bandpass Butterworth filter. The mean current in the depth range of 50-150 m was regarded as the MC, and the current at the 1,000-m depth was regarded as the MUC. The filtered velocities clearly show the vertically coherent intraseasonal signal of the MC/MUC (Figure 8), and the amplitude of these signals reaches 20 cm/s and then decreases with depth. In this region, intraseasonal variability is most likely attributed to eddy activity (Qu et al., 2012; Wang et al., 2014).
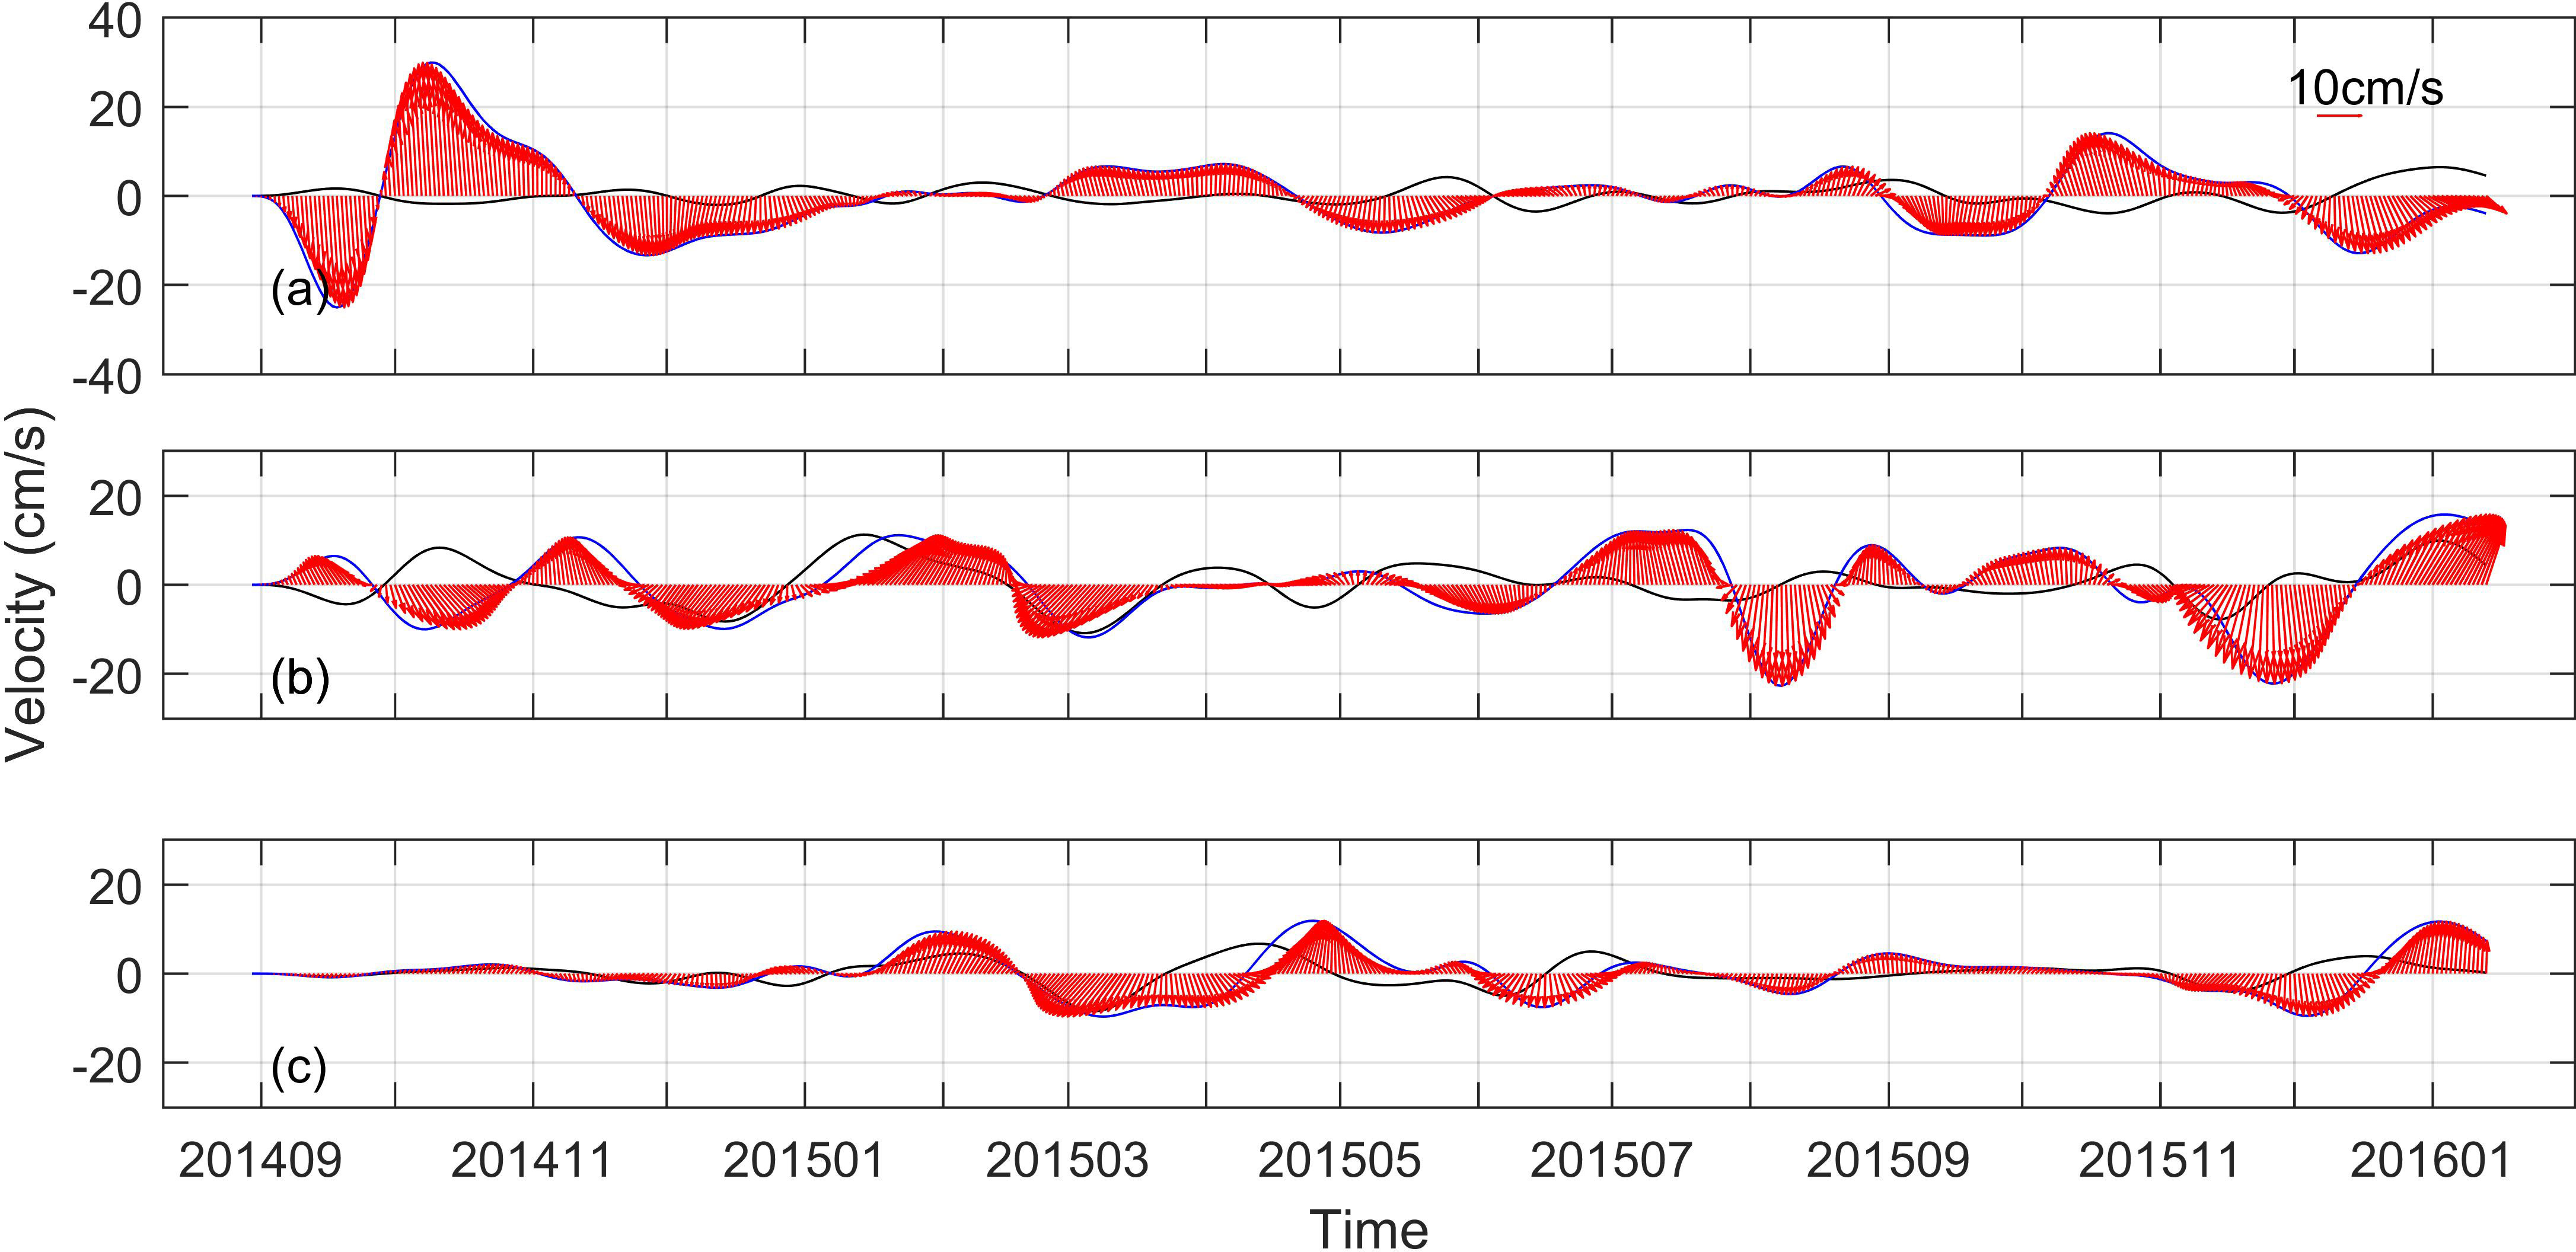
Figure 8 Flow vector anomaly (cm s-1) under a 30-180 days band-pass filter at 8˚N, 127˚E (A) between 50-150 m, (B) at 1000 m, and (C) 2000 m from September 2014 to January 2016 (unit are cm s-1).
4 Discussion
Zhang et al. (2014); Hu et al. (2016) and Azminuddin et al. (2022) reported results at the same mooring location from 2010 to 2014 and from 2017 to 2019. Complementary observations from 2014 to 2016 were investigated in this study. The difference from previous reports is the mean meridional velocity maximum exceeding 100 cm s-1 at the depth of 85 m, which is much stronger than the former but weaker than the one reported by Kashino et al. (2005). The reason for this is likely the response of the current to the 2015/2016 El Niño. Previous studies suggested that the MC is related to the ENSO (Kim et al., 2004; Kashino et al., 2005; Kashino et al., 2009). As described above in this study, the core velocity and depth of the MC obviously increased during the development of El Niño from July to October 2015. At the same time, the velocity at 2,000 m was observed southward, consistent with the MC. It seems that the MC can extend to 2000 m under the condition of El Niño. In particular, the variability of the MC precedes the El Niño by 2-3 months, which means that the stronger MC transported more cool water and likely exacerbated the development of El Niño. To better understand how the El Niño affects the MC and MUC and reaches at least 2000 m, we considered the SLA (Figure 9) at the mooring station. As illustrated, the strong MC during El Niño 2015/16 was associated with an increase in SLA around 8°N, 127°E, from July 2015 to January 2016. Remote effects caused by Rossby wave propagation (with a propagation speed of about 21 cm/s) from the east rather than local wind variability appear to have contributed to this change.
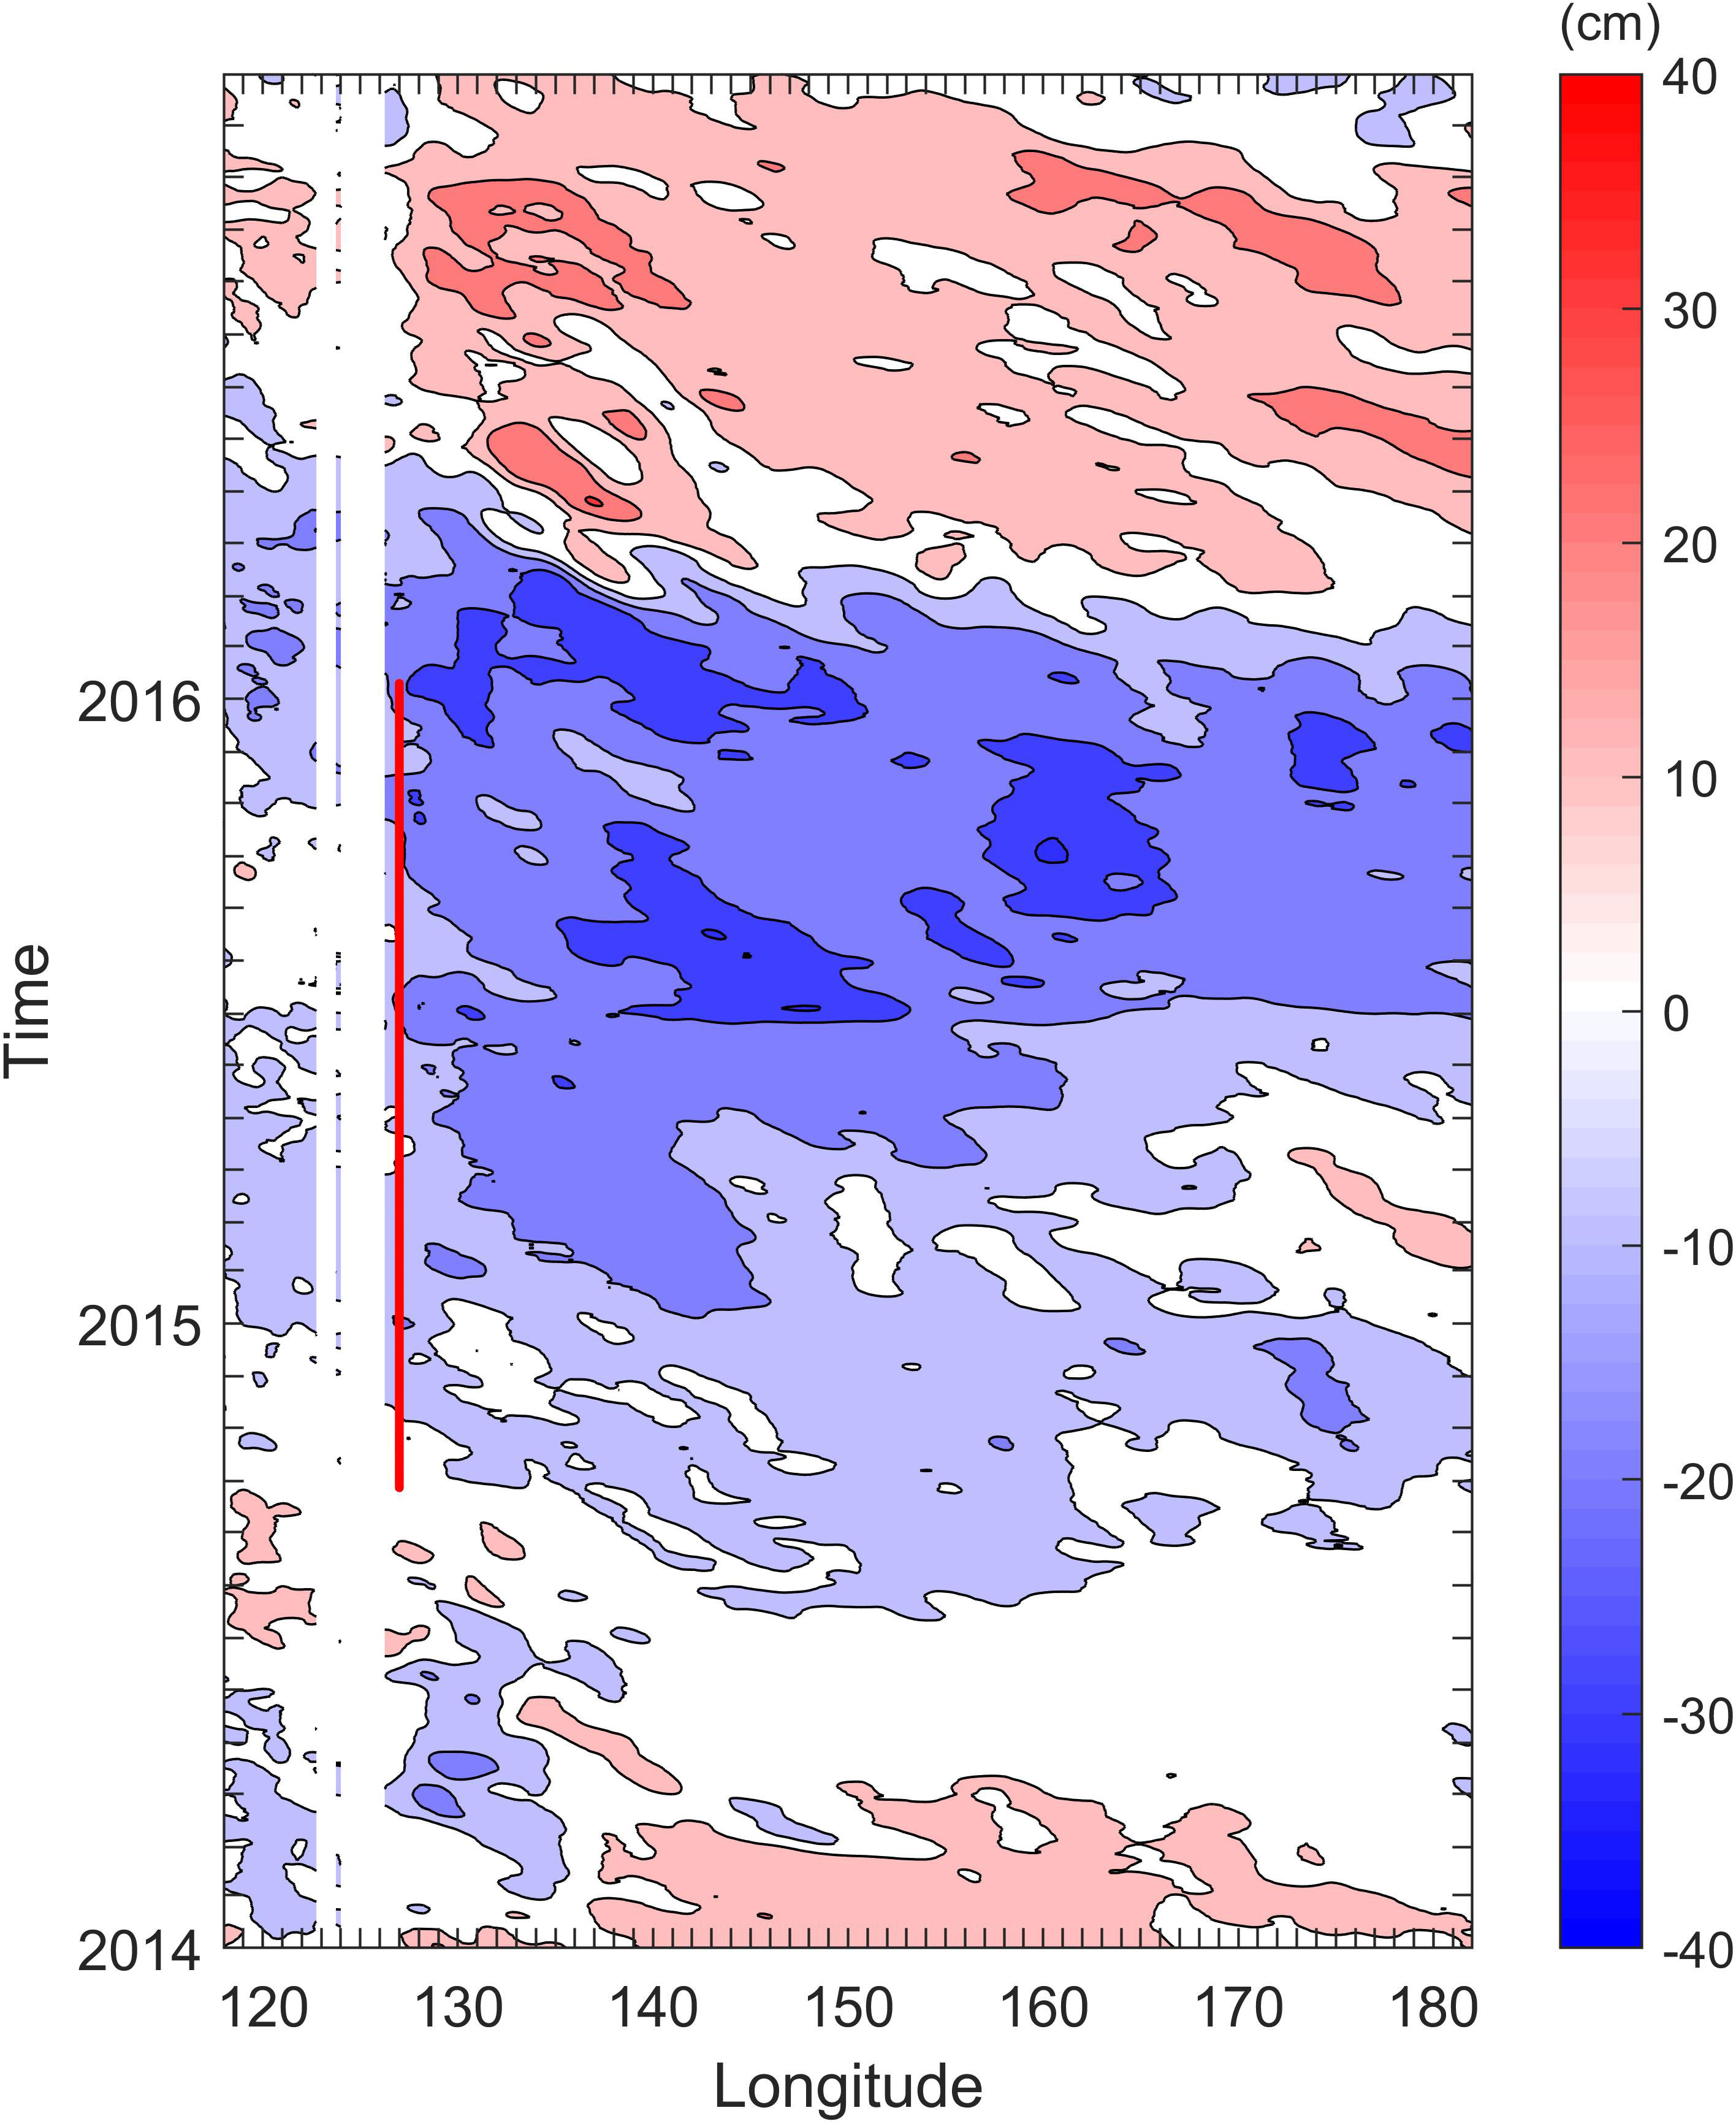
Figure 9 Time-longitude diagram of Sea level anomaly along 8°N from CMEMS. The red line presents the mooring current observed period.
Below the MC, the reversed MUC is observed with the maximum mean value of 11.58 cm s-1 at 1,000 m depth. The velocity at 1,000 m is stronger than that at 800 m. This implies that the core of the MUC is likely at a depth of around 1,000 m or between 1000-2000 m. Over the observation period, the MUC was strengthened in November 2014 and November 2015. However, the intensity in November 2015 was stronger than in 2014. The strengthened MUC in May 2015 can be explained by the semiannual signal of MUC (Wang et al, 2016; Ren, et al., 2018). Correspondingly, the crests of the Niño 3.4 index are observed in November to December 2015. It seems that El Niño also affects the strength of the MUC. The relationship between the MUC and El Niño needs to be further researched. If the variability of the MC or MUC preceded the El Niño as described above, the prediction of MC or MUC will be helpful for the development of El Niño.
The other difference between our data and the results of previous studies is the intraseasonal variability of currents in the Philippine Sea, which may be attributed to the extended deeper MC and enhanced MUC during the 2015/2016 El Niño. We analyzed the OFES outputs to investigate the source of the intraseasonal variability of current in the Philippine Sea. The mean EKE at 605 m along 8°N from August 2014 to February 2016 (Figure 10) and the meridional velocity anomaly (Figure 11) show that locally enhanced subsurface eddies are possible energy sources. This result is in accordance with previous studies. Zhang et al, 2017 and Hui et al. (2022) suggested that the strong intraseasonal variability is induced by westward-translating subthermocline eddies. Wang et al. (2014) used mooring observations and a high-resolution numerical model to characterize the intraseasonal variability of the subthermocline current east of Mindanao. This variability was principally caused by the activity of subthermocline eddies from three different pathways. On the basis of OFES, Chiang and Qu (2013) found that subthermocline eddies with a 50-60 days period originating from the equatorial South Pacific Ocean can propagate northwestward and reach the Mindanao coast at a typical propagation speed of 12 cm s-1. Dutrieux (2009) and Zhang et al. (2014) suggested that most of the eddy energy might be attributed to the mixed horizontal and vertical shear instability of subthermocline currents. When El Niño occurs, negative sea surface height anomalies propagated westward in the form of the first-mode baroclinic Rossby wave, exerting impacts on the western boundary currents east of Philippine coast and further modulating the variation of subthermocline currents.
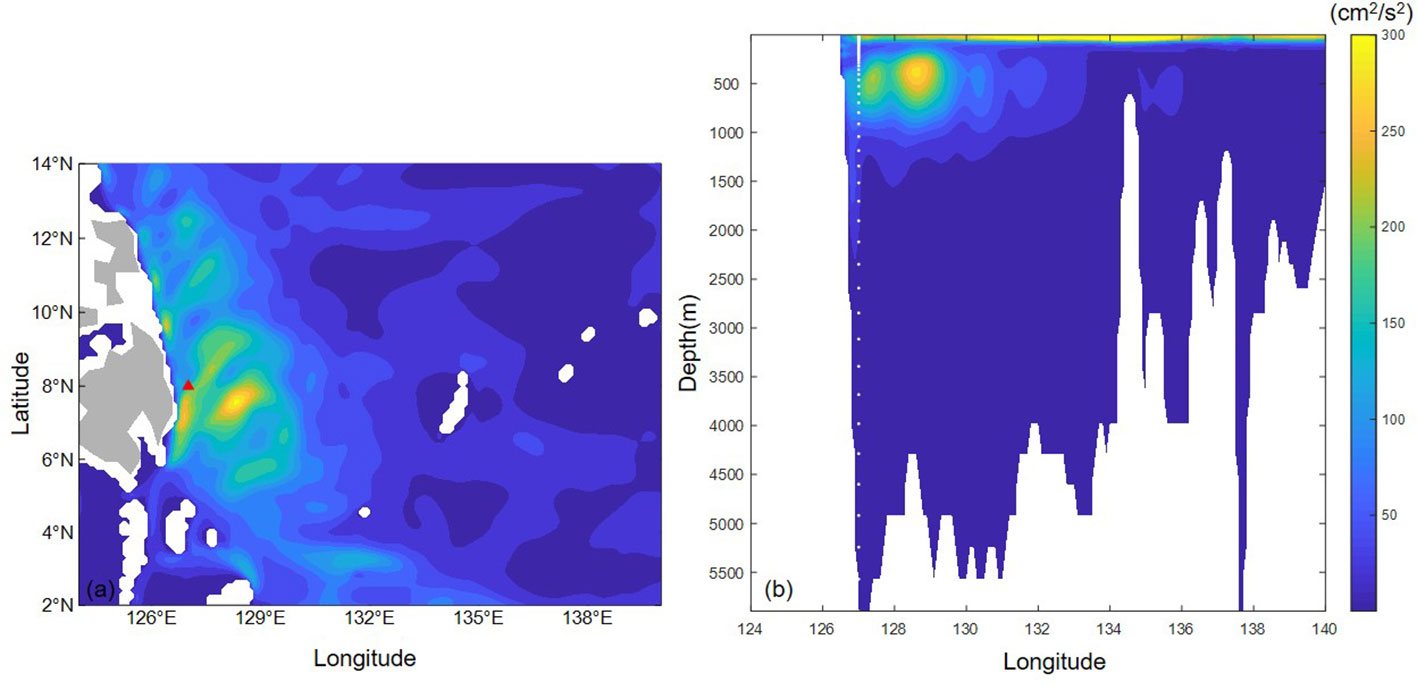
Figure 10 Mean EKE at 605 m (A) and along 8°N (B) during September 2014 to February 2016 derived from the OFES outputs.
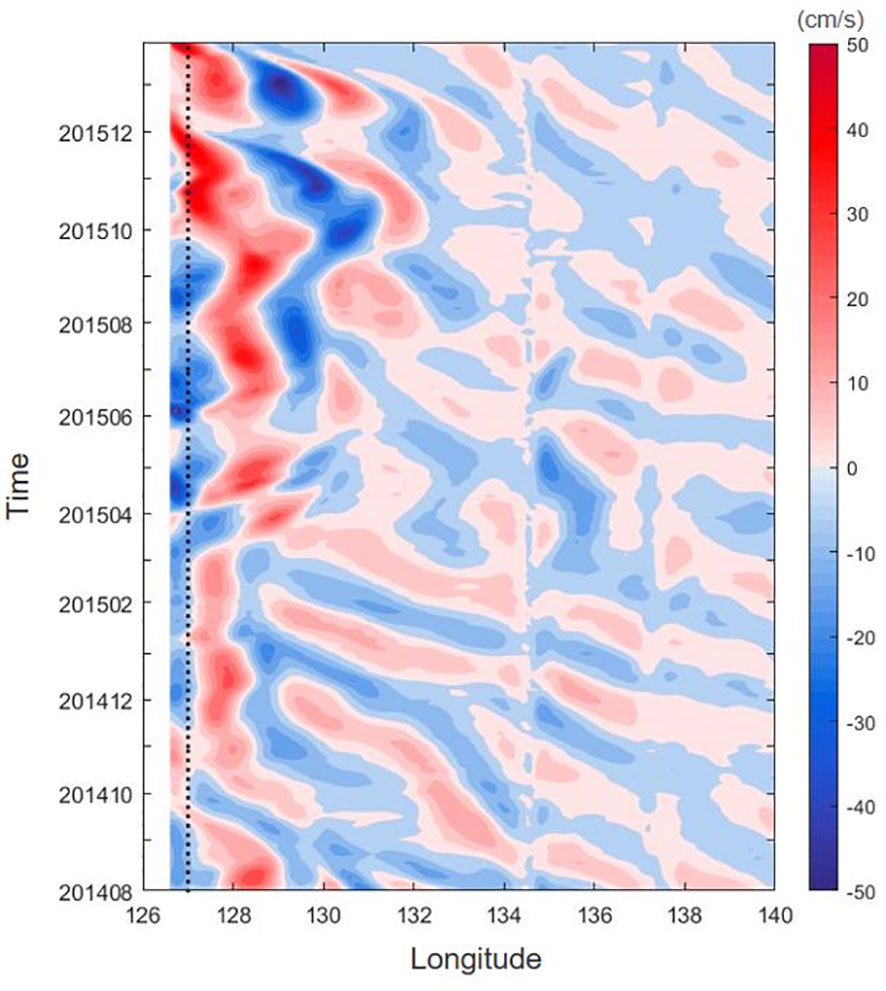
Figure 11 The meridional velocity anomaly at 605 m along 8°N from September 2014 to February 2016 derived from the OFES outputs. Black dotted-line indicates the mooring position.
5 Conclusions
On the basis of direct mooring observations at 8°N, 127°E, the vertical structure and current variability in different ocean layers was investigated during the 2015/2016 El Niño. In the upper 600 m, the MC is characterized by a stable southward flow with an annual mean velocity maximum exceeding 102.77 cm/s at 85 m. In addition, the intraseasonal variability of currents in the Philippine Sea was described by investigating power spectra and bandpass filtered data. Moreover, changes in the MC and MUC during the 2015/2016 El Niño clearly show significant extension of the depth of the MC from July to October 2015 and enhancement of the MUC corresponding with the Niño 3.4 index. The intraseasonal variability of currents from the surface to the 2,000 m layer was also evaluated preliminarily. These results provide the first description of the vertical structure and variability of low-latitude western boundary currents east of Philippines during the 2015/2016 El Niño. However, although this study highlights the impact of ENSO events on the MC and MUC, the detailed dynamics regulating this process should be further investigated. The multicore structure of the MUC (Hu and Cui, 1989) must be considered to understand the vertical structure of western boundary currents. Moreover, as discussed above, subthermocline eddies should not be ignored in studying the MC/MUC. Therefore, further hydrographic observations and more numerical simulations are needed to produce a broad understanding of these vital current systems.
Data availability statement
The raw data supporting the conclusions of this article will be made available by the authors, without undue reservation.
Author contributions
YL and FY initiated the idea and structured the article and QR analysed the data. YL wrote the manuscript. XD and CW contributed to the observation. FN contributed to discussion of MC and MUC. All authors contributed to the article and approved the submitted version.
Funding
This work was jointly supported by the Natural Science Foundation of Shandong Province (grant no. ZR2020MD057; no. ZR202110110019), the National Key R&D Program of China, National Nature Science Foundation of China (grant no. 42206032) and the Shandong Joint Fund for Marine Science Research Centers (grant no. U1406401).
Acknowledgments
We thank the scientists and crews of R/V Science for their efforts in deploying and recovering the mooring.
Conflict of interest
The authors declare that the research was conducted in the absence of any commercial or financial relationships that could be construed as a potential conflict of interest.
Publisher’s note
All claims expressed in this article are solely those of the authors and do not necessarily represent those of their affiliated organizations, or those of the publisher, the editors and the reviewers. Any product that may be evaluated in this article, or claim that may be made by its manufacturer, is not guaranteed or endorsed by the publisher.
References
Azminuddin F., Lee J. H., Jeon D., Shin C.-W., Villanoy C., Lee S., et al. (2022). Effect of the intensified sub-thermocline eddy on strengthening the Mindanao undercurrent in 2019. J. Geophys. Res.: Oceans 127, e2021JC017883. doi: 10.1029/2021JC017883
Chiang T. L., Qu T. D. (2013). Subthermocline eddies in the western equatorial pacific as shown by an eddy-resolving OGCM. J. Phys. Oceanogr. 43, 1241–1253. doi: 10.1175/JPO-D-12-0187.1
Dutrieux P. (2009). Tropical Western pacific currents and the origin of the intraseasonal variability below the thermocline (Hunolulu: Univ. of Hawaii at Manoa).
Firing E., Kashino Y., Hacker P. (2005). Energetic subthermocline currents observed east of Mindanao. Deep-Sea Reas. Part II 52, 605–613. doi: 10.1016/j.dsr2.2004.12.007
Guan B. (1990). A note on the deep circulation in the area east of Taiwan and the Philippines. Chin. J. Oceanol. Limnol. 8 (2), 167–176.
Hu D., M. Cui (1989). "The western boundary current in the far-western Pacific Ocean," in Proceedings of Western International Meeting and Workshop on TOGA COARE. Eds J., Picaut R., Lukas Delcroix T. Inst. Fr. de Rech. Sci. our le Deev. en Coop., Noumeea 123–134.
Hu S. J., Hu D. X., Guan C., Wang F., Zhang L. L., Wang F. J., et al. (2016). Interannual variability of the Mindanao Current/Undercurrent in direct observations and numerical simulations. J. Phys. Oceanogr. 46, 483–499. doi: 10.1175/JPO-D-15-0092.1
Hu D. X., Wu L. X., Cai W. J., Gupta A. S., Ganachaud A., Qiu B., et al. (2015). Pacific western boundary currents and their roles in climate. Nature 522, 299–308. doi: 10.1038/nature14504
Hui Y., Zhang L., Wang Z., Wang F., Hu D. (2022). Interannual modulation of subthermocline eddy kinetic energy east of the Philippines. J. Geophys. Res.: Oceans 127, e2022JC018452. doi: 10.1029/2022JC018452
Kashino Y., Espana N., Syamsudin F., Richards K. J., Jensen T., Dutrieux P., et al. (2009). Observations of the north equatorial current, Mindanao current, and kuroshio current system during the 2006/07 El niño and 2007/08 la niña. J. Oceanogr 65, 325–333. doi: 10.1007/s10872-009-0030-z
Kashino Y., Ishida A., Kuroda Y. (2005). Variability of the Mindanao current: Mooring observation results. Geophys. Res. Lett. 32, L18611. doi: 10.1029/2005GL023880
Kim Y., Qu T. D., Jensen T., Miyama T., Mitsudera H., Kang H. W., et al. (2004). Seasonal and interannual variations of the north equatorial current bifurcation in a high-resolution OGCM. J. Geophys. Res. 109, C03040. doi: 10.1029/2003JC002013
Lukas R. (1988). Interannual fluctuations of the Mindanao current inferred from sea level. J. Geophys. Res. 93 (C6), 6744–6748. doi: 10.1029/JC093iC06p06744
Lukas R., Firing E., Hacker P., Richardson P. L., Collins C. A., Fine R., et al. (1991). Observations of the Mindanao current during the Western equatorial pacific ocean circulation study. J. Geophys. Res. 96 (C4), 7089–7104. doi: 10.1029/91JC00062
Lukas R., Yamagata T., McCreary J. P. (1996). Pacific low-latitude western boundary currents and the Indonesian throyghflow. J. Geophys. Res. 96, 7089–7104. doi: 10.1029/91JC00062
Masumoto Y., Sasaki H., Kagimoto T., Komori N., Ishida A., Sasai Y., et al. (2004). A fifty-year eddy resolving simulation of the world ocean: Preliminary outcomes of OFES (OGCM for the earth simulator). J. Earth Simulator 1, 35–56.
Nakamura H., Kazmin A. S. (2003). Decadal changes in the north pacific oceanic frontal zones as revealed in ship and satellite observations. J. Geophys. Res. 108, 3078. doi: 10.1029/1999JC000085
Nakamura H., Sampe T., Tanimoto Y., Shimpo A. (2004). Observed associations among stormtracks, jet streams and midlatitude oceanic fronts. AGU Geophys. Monogr. Ser. 147, 329–346. doi: 10.1029/147GM18
Qiu B., Lukas R. (1996) Seasonal and interannual variability of the north equatorial current, the Mindanao current, and the kuroshio along the pacific western boundary. J. Geophys. Res. Oceans 101 (C5), 12315–12330. doi: 10.1029/95JC03204
Qu T. D., Chiang T. L., Wu C. R., Dutrieux P., Hu D. X. (2012). Mindanao Current/Undercurrent in an eddy-resolving GCM. J. Geophys. Res. Oceans 117, C06026. doi: 10.1029/2011JC007838
Ren Q., Li Y., Wang F., Song L., Liu C., Zhai F. (2018) Seasonality of the Mindanao current/undercurrent system. J. Geophys. Res.: Oceans 123, 1105–1122.
Sasaki H., Nonaka M., Masumoto Y., Sasai Y., Uehara H., Sakuma H. (2008). “An eddy-resolving hindcast simulation of the quasiglobal ocean from 1950 to 2003 on the earth simulator,” in High resolution numerical modeling of the atmosphere and ocean. Eds. Hamilton K., Ohfuchi W. (New York: Springer), 57–185.
Schonau M., Rudnick D. L. (2017). Mindanao Current and undercurrent: thermohaline structure and transport from repeat glider observations. J. Phys. Oceanogr. 47, 2055–2075. doi: 10.1175/JPO-D-16-0274.1
Song L. N., Li Y. L., Liu C. Y., Wang F. (2017). Subthermocline anticyclonic gyre east of Mindanao and its relationship with the Mindanao undercurrent. Chin. J. Oceanol. Limnol. 35 (6), 1303–1318. doi: 10.1007/s00343-017-6111-8
Wang F. J., Wang Q. Y., Hu D. X., Zhai F. G., Hu S. J. (2016). Seasonal variability of the Mindanao current determined using mooring observations from 2010 to 2014. J. Oceanogr. 72, 787–799. doi: 10.1007/s10872-016-0373-1
Wang F., Zang N., Li Y. L., Hu D. X. (2015). On the subsurface contercurrents in the Philippine Sea. J. Geophys. Res. Oceans 120, 131–144. doi: 10.1002/2013JC009690
Wang Q. Y., Zhai F. G., Wang F. J., Hu D. X. (2014). Intraseasonal variability of the subthermocline current east of Mindanao. J. Geophys. Res. 119, 8552–8566. doi: 10.1002/2014JC010343
Wang F. J., Zhang L. L., Hu D. X., Wang Q. Y., Zhai F. G., Hu S. J. (2017). The vertical structure and variability of the western boundary currents east of the Philippines: case study from in situ observation from December 2010 to august 2014. J. Oceanogr. 73, 743–758. doi: 10.1007/s10872-017-0429-x
Wijffels S., Firing E., Toole J. (1995). The mean structure and variability of the Mindanao current at 8°N. J. Geophys. Res. 100 (C9), 18421–18435. doi: 10.1029/95JC01347
Zhang L. L., Hu D. X., Hu S. J., Wang F., Wang F. J., Yuan D. L. (2014). Mindanao Current/Undercurrent measured by a subsurface mooring. J. Geophys. Res. Oceans 119, 3617–3628. doi: 10.1002/2013JC009693
Zhang L. L., Hui Y. C., Qu T. D., Hu D. X. (2021). Seasonal variability of subthermocline eddy kinetic energy east of the Philippines. J. Phys. Oceanogr. 51 (3), 685–699. doi: 10.1175/JPO-D-20-0101.1
Keywords: vertical structure, variability, western boundary, Philippine sea, 2015/2016 El Niño, mooring data
Citation: Liu Y, Ren Q, Yu F, Wei C, Diao X and Nan F (2023) The vertical structure and variability of currents east of Philippines from mooring measurements during the 2015/2016 El Niño. Front. Mar. Sci. 10:1113525. doi: 10.3389/fmars.2023.1113525
Received: 01 December 2022; Accepted: 03 March 2023;
Published: 17 March 2023.
Edited by:
DX Wang, Sun Yat-sen University, ChinaCopyright © 2023 Liu, Ren, Yu, Wei, Diao and Nan. This is an open-access article distributed under the terms of the Creative Commons Attribution License (CC BY). The use, distribution or reproduction in other forums is permitted, provided the original author(s) and the copyright owner(s) are credited and that the original publication in this journal is cited, in accordance with accepted academic practice. No use, distribution or reproduction is permitted which does not comply with these terms.
*Correspondence: Qiang Ren, cnExOTg5QHFkaW8uYWMuY24=; Fei Yu, eXVmQHFkaW8uYWMuY24=