 Yan Wu
 Shentang Dou
 Yaoshen Fan
 Shoubing Yu
 Weiqi Dai
- 1Key Laboratory of Yellow River Channel and Estuary Regulation of the Ministry of Water Resources, Yellow River Institute of Hydraulic Research, Zhengzhou, China
- 2State Key Laboratory of Estuarine and Coastal Research, Faculty of Earth Science, East China Normal University, Shanghai, China
The East China Sea is an ocean region with frequent typhoons, typhoons are also the main reason for inducing typhoon waves. The complexity of typhoon waves is closely related to the complexity of typhoon wind field. In previous studies, symmetrical wind field models or superimposed wind field models were usually used to simulate typhoon waves. However, the actual wind fields are asymmetric, and the asymmetry is affected by many factors. Therefore, three wind field models are used to simulate the wind field of Typhoon Muifa that moved through the East China Sea. Moreover, the abovementioned wind field models are used to drive the third-generation wave model SWAN to simulate the wave field and wave spectrum of Typhoon Muifa. Studies show that the values generated by the asymmetric wind field model are most consistent with the actual measurement data. This is especially the case if the typhoon center is closer to the station. The accuracy of the typhoon waves simulated using the asymmetric wind field model is better than that of the other two wind field models. The asymmetric wind field can reflect the asymmetric characteristics of the typhoon well. The substantial wave heights on the right side of typhoon’s path are substantially higher than those on the left side of path. Additionally, the maximum wave spectral density and total energy of waves as simulated by the asymmetric wind field are both larger than those of the other two wind field models. Thus, the asymmetric wind field model is more suitable for the numerical simulation of typhoon waves in the East China Sea.
1 Introduction
A typhoon is a severe tropical cyclone that is one of the most destructive weather systems in geophysical environments (Chen et al., 2019). The threat of typhoons to social interests, property, and public safety in coastal areas has become more and more prominent due to the intensification of global climate change and the increase in the coastal population (Ambinakudige and Khanal, 2010; Walsh et al., 2016; Cui and Caracoglia, 2016; Walsh et al., 2019; Pan et al., 2022). The oceanic response to typhoons is the strongest air-sea interaction, involving complex processes from weather to climate timescales, from local to global spatial scales, and from dynamics and thermodynamics to multiple environmental variables (Lee and Chen, 2012; Ge et al., 2017; Dai et al., 2018; Ma et al., 2019; Wu et al., 2019; Wu et al., 2020; Li et al., 2022).
Using the original equations to calculate the typhoon pressure field and wind field need to be improved due to a lack of accuracy in the initial conditions and the boundary conditions (Zhang et al., 2010). Therefore, efficient and straightforward parametric typhoon field models have been widely used. Previous studies often use the circularly symmetrical pressure field model to solve the gradient wind according to the cyclone constant wind principle (Myers, 1954; Jelesnianski, 1965; Holland, 1980; Miyamoto et al., 2014) or to superimpose the circularly symmetrical wind field model and the traveling wind field model to form a superimposed wind field model (Miyazaki, 1961; Jelesnianski, 1966; Ueno, 1981). However, the circular symmetrical wind field model does not consider the asymmetry of the typhoon, and the superimposed wind field model only considers the asymmetry of the typhoon caused by the ambient airflow. Yet, the actual asymmetric features of the typhoon are more complicated due to the influence of various factors such as the underlying surface, Coriolis force, and ambient temperature (Xie et al., 2006). At the same time, the data released by National Oceanic and Atmospheric Administration show that typhoons are asymmetric. Yoshizumi (1968) and Bell and Ray (2004) also propose that the actual structure of the typhoon is asymmetric, with the maximum wind possibly located in the rear-right quadrant or the front-right quadrant. Diagnosing an asymmetric system is helpful for accurately assessing coastal risk (Lin and Chavas, 2012). Typhoon data reported by the Joint Typhoon Warning Center also show that typhoons have different scales in each quadrant; especially, the wind radii in the northeast and southwest quadrants are very different.
The wind field, as a driving factor, plays an important role in the simulation of typhoon waves. With the improvement of the accuracy requirements for typhoon waves in forecasting and post-forecasting modes, constructing a more accurate typhoon wind field model has become an important research topic (Rogers et al., 2007; Wang et al., 2020). This study introduces the Holland circular symmetric wind field model, superimposes the Holland wind field model and the moving wind field model to form a superimposed wind field model, and introduces an improved four-quadrant asymmetric wind field model based on the Holland model. Moreover, the three wind field models are modified by introducing a correction factor to make them more suitable for the numerical simulation of typhoon in the East China Sea. Referring to the radial extent of the 34-, 50-, and 64-kt winds in the four quadrants (northeast, southeast, southwest, and northwest), this study use the above three wind field models to simulate the wind field distribution of Typhoon Muifa, and compare the simulated results of the three wind field. Meanwhile, some numerical wave models have been adopted to simulate typhoon waves (Tajima et al., 2016a; Tajima et al., 2016b; Akpinar et al., 2016; Mao et al., 2016; Nikishova et al., 2017; Kutupoğlu et al., 2018; Vieira et al., 2020). In this study, three wind fields were used to drive the third-generation wave model, SWAN. The numerical simulation of wave field and wave spectrum of Typhoon Muifa was carried out to evaluate the effect of typhoon asymmetry on the energy distribution inside the waves and finally select a wind field model that can more accurately simulate typhoon waves in the East China Sea.
2 Model description and numerical experiments
2.1 Wind field model
2.1.1 Key parameter-radius of maximum wind
The radius of maximum wind is an important parameter that characterizes the scale of the typhoon, and it is also a key parameter to describe the wind field (Jiang et al., 2008; Fang and Lin, 2013). The radius of the maximum wind refers to the distance between the typhoon center and the maximum wind speed zone of the typhoon, and it directly affects the overall wind speed distribution (Lin and Fang, 2013). Therefore, an accurate radius of maximum wind is important for improving the calculation accuracy of the typhoon wind field and the simulation effect of the wave field.
Previous research efforts have investigated the parameterized calculation scheme of the radius of maximum wind. Kato (2005) conducted a statistical analysis of typhoons along the coast of Japan and pointed out that the radius of maximum wind and the central pressure of the typhoon are linearly distributed. Willoughby and Rahn (2004) conducted a statistical analysis of typhoon data from 1977 to 2000 released by the National Oceanic and Atmospheric Administration and concluded that the radius of maximum wind is linearly distributed with the central latitude of the typhoon.
Studies have shown that the central pressure of the typhoon characterizes the intensity of the typhoon. The central latitude of a typhoon reflects the geographical location of typhoon and the local temperature. The moving velocity of typhoon’s center is affected to a large extent by the synoptic-scale and upper-tropospheric height field that are linked to the large-scale background wind field. These three factors have a certain influence on the radius of maximum wind. This study statistically analyzes typhoon data released by the Joint Typhoon Warning Center (http://www.metoc.navy.mil/jtwc/jtwc.html) in the Northwest Pacific from 2002 to 2020, and the relationship between the radii of the 34-, 50-, and 64-kt winds and its influencing factors are shown in Figure 1.
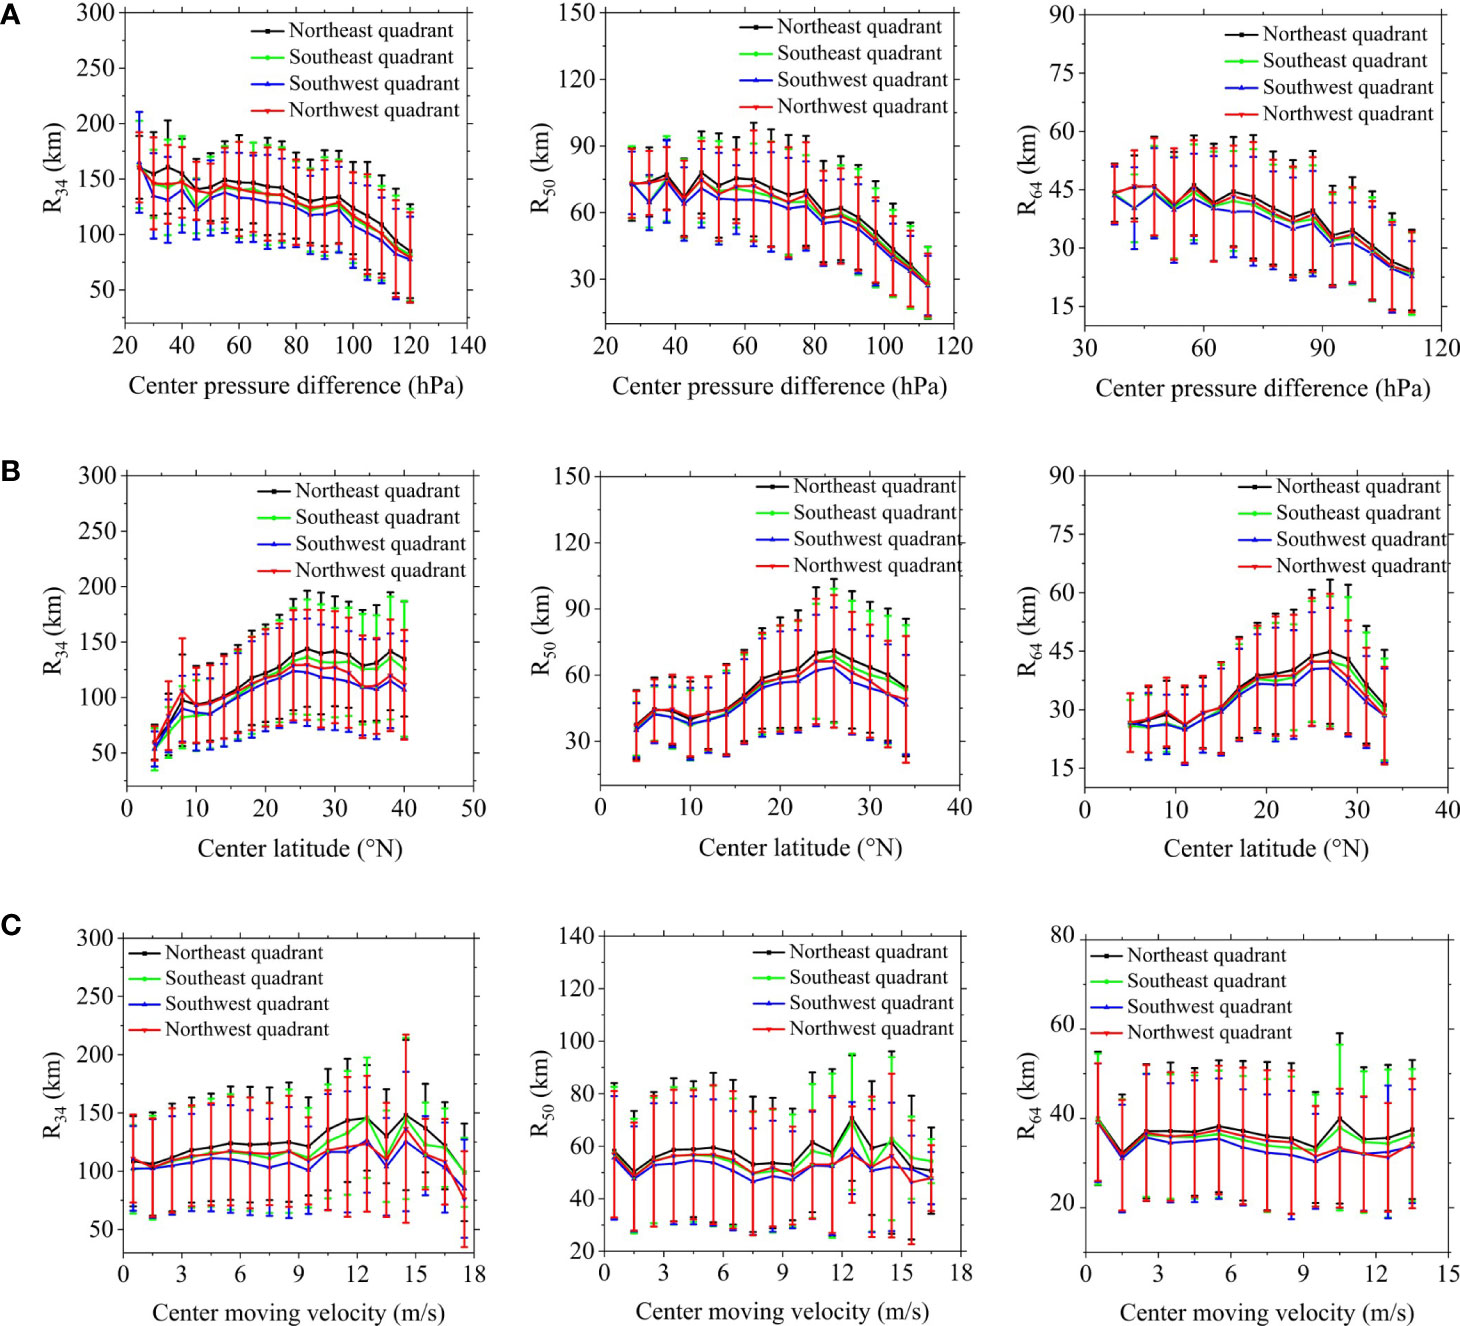
Figure 1 Distribution map of the radii of wind and: (A) the central pressure difference of the typhoon, (B) the central latitude of the typhoon, (C) the central moving velocity of the typhoon.
It can be seen from Figure 1A that the radial extent of the 34-, 50-, and 64-kt winds in four quadrants decrease with an increased central pressure difference of typhoon. This is because the central pressure difference of the typhoon reflects its strength. With the increase of the central pressure difference, the typhoon intensity increases, the suction effect and vortex motion increase, each wind circle is closer to the typhoon center, and the wind speed radii of each wind circle decreases. Figure 1B shows that the radial extent of the 34-, 50-, and 64-kt winds in the four quadrants increase along with the increasing latitude of the typhoon center, but when the latitude is greater than 25°, the radial extent of the 34-, 50-, and 64-kt winds in four quadrants decrease with the increase of the latitude of the typhoon center. This is because the geographical latitude mainly reflects the local environmental temperature; as the latitude increases, the ambient temperature changes, but when the latitude is poleward of 25°N, due to the influence of the subtropical high pressure, the ambient surface pressure rises and the typhoon central pressure difference increases, making the central pressure difference the dominant factor, resulting in a decrease in the radial extent of the 34-, 50-, and 64-kt winds in all four quadrants. At the same time, Figure 1C shows that the influence of the central moving velocity of the typhoon on the radial extent of the 34-, 50-, and 64-kt winds in four quadrants is not prominent and can be ignored.
2.1.2 Symmetric wind field model
From the perspective of the construction of the typhoon wind field, people often use a circular symmetrical pressure field model, that is, first use a theoretical model, empirical formulas, or semi-theoretical and semi-empirical model to construct the pressure distribution in the typhoon area, and then use the gradient wind equations or geostrophic wind equation to obtain the wind field distribution in the typhoon area (Fujita, 1952; Myers, 1954; Jelesnianski, 1965; Holland, 1980). The most commonly used model is the Holland circular symmetric pressure wind field model, which is expressed as
where P(r) is the surface pressure at a distance of r from the typhoon center; r the distance from the center of the typhoon; Pc the typhoon central surface pressure; Pn the ambient surface pressure; Rmax the radius of maximum wind; B a hurricane-shape parameter (Vickery and Wadhera, 2008). From Eq. (2), the initial value of B can be determined by using Vmax, Pn, and Pc:
where Vmax is the hurricane’s maximum wind speed; the air density; e = 2.7183.
The gradient wind is given by the pressure field via the cyclone wind principle:
where V(r) is the velocity at a distance r from the hurricane center; f is the Coriolis parameter.
The correction for the gradient wind speed of the model to obtain the gradient wind speed at 10 m on the sea surface is given by:
where V is the corrected wind speed; c1 is a correction factor, and its value depend on the location of typhoon, by conducting tests of many typhoon cases in the East China Sea, c1 in this region is set as 0.9; θ the angle between the calculated point and the x-axis; β the angle between the gradient wind and the sea-surface wind.
2.1.3 Superimposed wind field model
Since actual typhoons are often asymmetrical, various asymmetric wind field models have been proposed to better describe the actual wind field (Pan et al., 2016). The previous asymmetric wind field model considered the impact of a typhoon moving asymmetrically, that is, superimposing the symmetrical wind field model with the moving wind field model. This method can involve the asymmetrical typhoon wind field caused by ambient airflow. Miyazaki (1961) introduced a moving wind field mod
where Vt is the moving speed of typhoon; Vf is the moving speed of typhoon center; RG is the environmental scale, set to 500 km in this article.
Synthesize the gradient wind field with the moving wind field to obtain a superimposed wind field:
where VM is the wind speed of the superimposed wind field; c1 and c2 are the correction factors: c1 has the same value as Eq. (4) and is set as 0.9. c2 is set as 0.5.
2.1.4 Asymmetric wind field
Typhoons are affected by many factors, such as the underlying surface, Coriolis force, and ambient temperature, making the actual asymmetry of typhoons more complicated (Olfateh et al., 2017). Therefore, Xie et al. (2006) incorporated the National Hurricane Center forecast guidance into the Holland model. Rmax is modified to become a function of the azimuthal angle (θ):
where Rmax(θ) is calculated by Eq. (3), when the value of V(r) and r are given; P1~ P5 the coefficients of the fourth-order polynomial are obtained by a polynomial curve fitting of the Rmax value.
Upon substituting, the Rmax(θ) obtained by Eq. (7) into the following equation, can obtain the four-quadrant asymmetric wind field:
where V(r,θ) is the wind speed of the asymmetric wind field; c1 is the correction factors, and it has the same value as Eq. (4) and is set as 0.9; Rmax is the mean value of the radius of maximum wind. Because Rmax is different in each azimuth, the calculated wind field is asymmetric.
2.2 Wave model
SWAN is a third-generation wave model for obtaining realistic estimates of wave parameters in coastal areas, lakes, and estuaries from the given wind, bottom, and current conditions (Booij et al., 1999; Rogers et al., 2003). However, SWAN can be used on any scale relevant to wind-generated surface gravity waves. The model is based on the wave action balance equation with sources and sinks:
where N is the momentum spectral density; E the energy spectral density; t the time; λ the longitude; φ the latitude; σ the frequency; θ the direction of propagation; cλ, cσ and cθ are the propagation speeds of the dynamic spectral density in the λ, σ and θ direction.
2.3 Computational experiments
The simulation results of three different calculation schemes are used to compare and analyze the simulation effects of varying wind field models on wind field, wave field, and wave spectrum, which include:
(1) Run 1(T1): using the symmetrical wind field model to simulate the wind field and drive SWAN to simulate the wave field and wave spectrum.
(2) Run 2(T2): using a superimposed wind field model to simulate the wind field and drive SWAN to simulate the wave field and wave spectrum.
(3) Run 3(T3): using an asymmetric wind field model to simulate the wind field and drive SWAN to simulate the wave field and wave spectrum.
3 Study area and data sources
3.1 Study area
Typhoons frequently occur in the Northwest Pacific (Guo et al., 2016). Typhoons generated in the Northwest Pacific account for about 35% of the total number of typhoons worldwide each year. Most typhoons in the Northwest Pacific will eventually land after passing through the East China Sea or South China Sea. Many typhoons passing through the South China Sea will first pass through the Philippine Islands. Therefore, their strength will be weakened and their internal structure will change before they land due to the effect of the underlying surface. However, the East China Sea is relatively wide, and typhoons passing through this area are less affected by underlying surface. Therefore, typhoons passing through the East China Sea were selected for this study.
3.2 Typhoon path data
Because the asymmetry of the typhoon will increase due to the influence of the underlying surface and other factors when it makes landfall, this study chose to use Typhoon Muifa, which passed through the East China Sea before making landfall. Super Typhoon Muifa was generated in the Northwest Pacific Ocean on 24 July 2011. It assembled in the eastern Philippines on 29 July and moved slowly to the west and then turned to the north and continued to move through the East China Sea, making landfall on the Korean Peninsula before dying out in Jilin Province. The path data of Muifa was sourced from the Joint Typhoon Warning Center and contains the date, time, latitude, longitude, maximum sustained wind speed (Vmax), typhoon central pressure (Pc), wind circle speed (V), wind speed radius of the four quadrants under the wind circle speed (Rne, Rse, Rsw, Rnw), ambient surface pressure (Pn), and the radius of maximum wind (Rmax). The time resolution of the typhoon-path data from Joint Typhoon Warning Center is six hours.
3.3 Buoy data
To validate the model forecast of the wind and wave time change processes, the wind and wave fields computed with the asymmetric wind field model (T3) were compared with those produced using the superimposed wind field model (T2), symmetrical wind field model (T1), and buoy observations. The buoy data was from the QF207 buoy station (124.1°E, 29.05°N). The QF207 buoy station is located in the East China Sea, close to the path of Super Typhoon Muifa, and records the wind and wave data during the typhoon. The location of the QF207 buoy station and the typhoon’s path are shown in Figure 2.
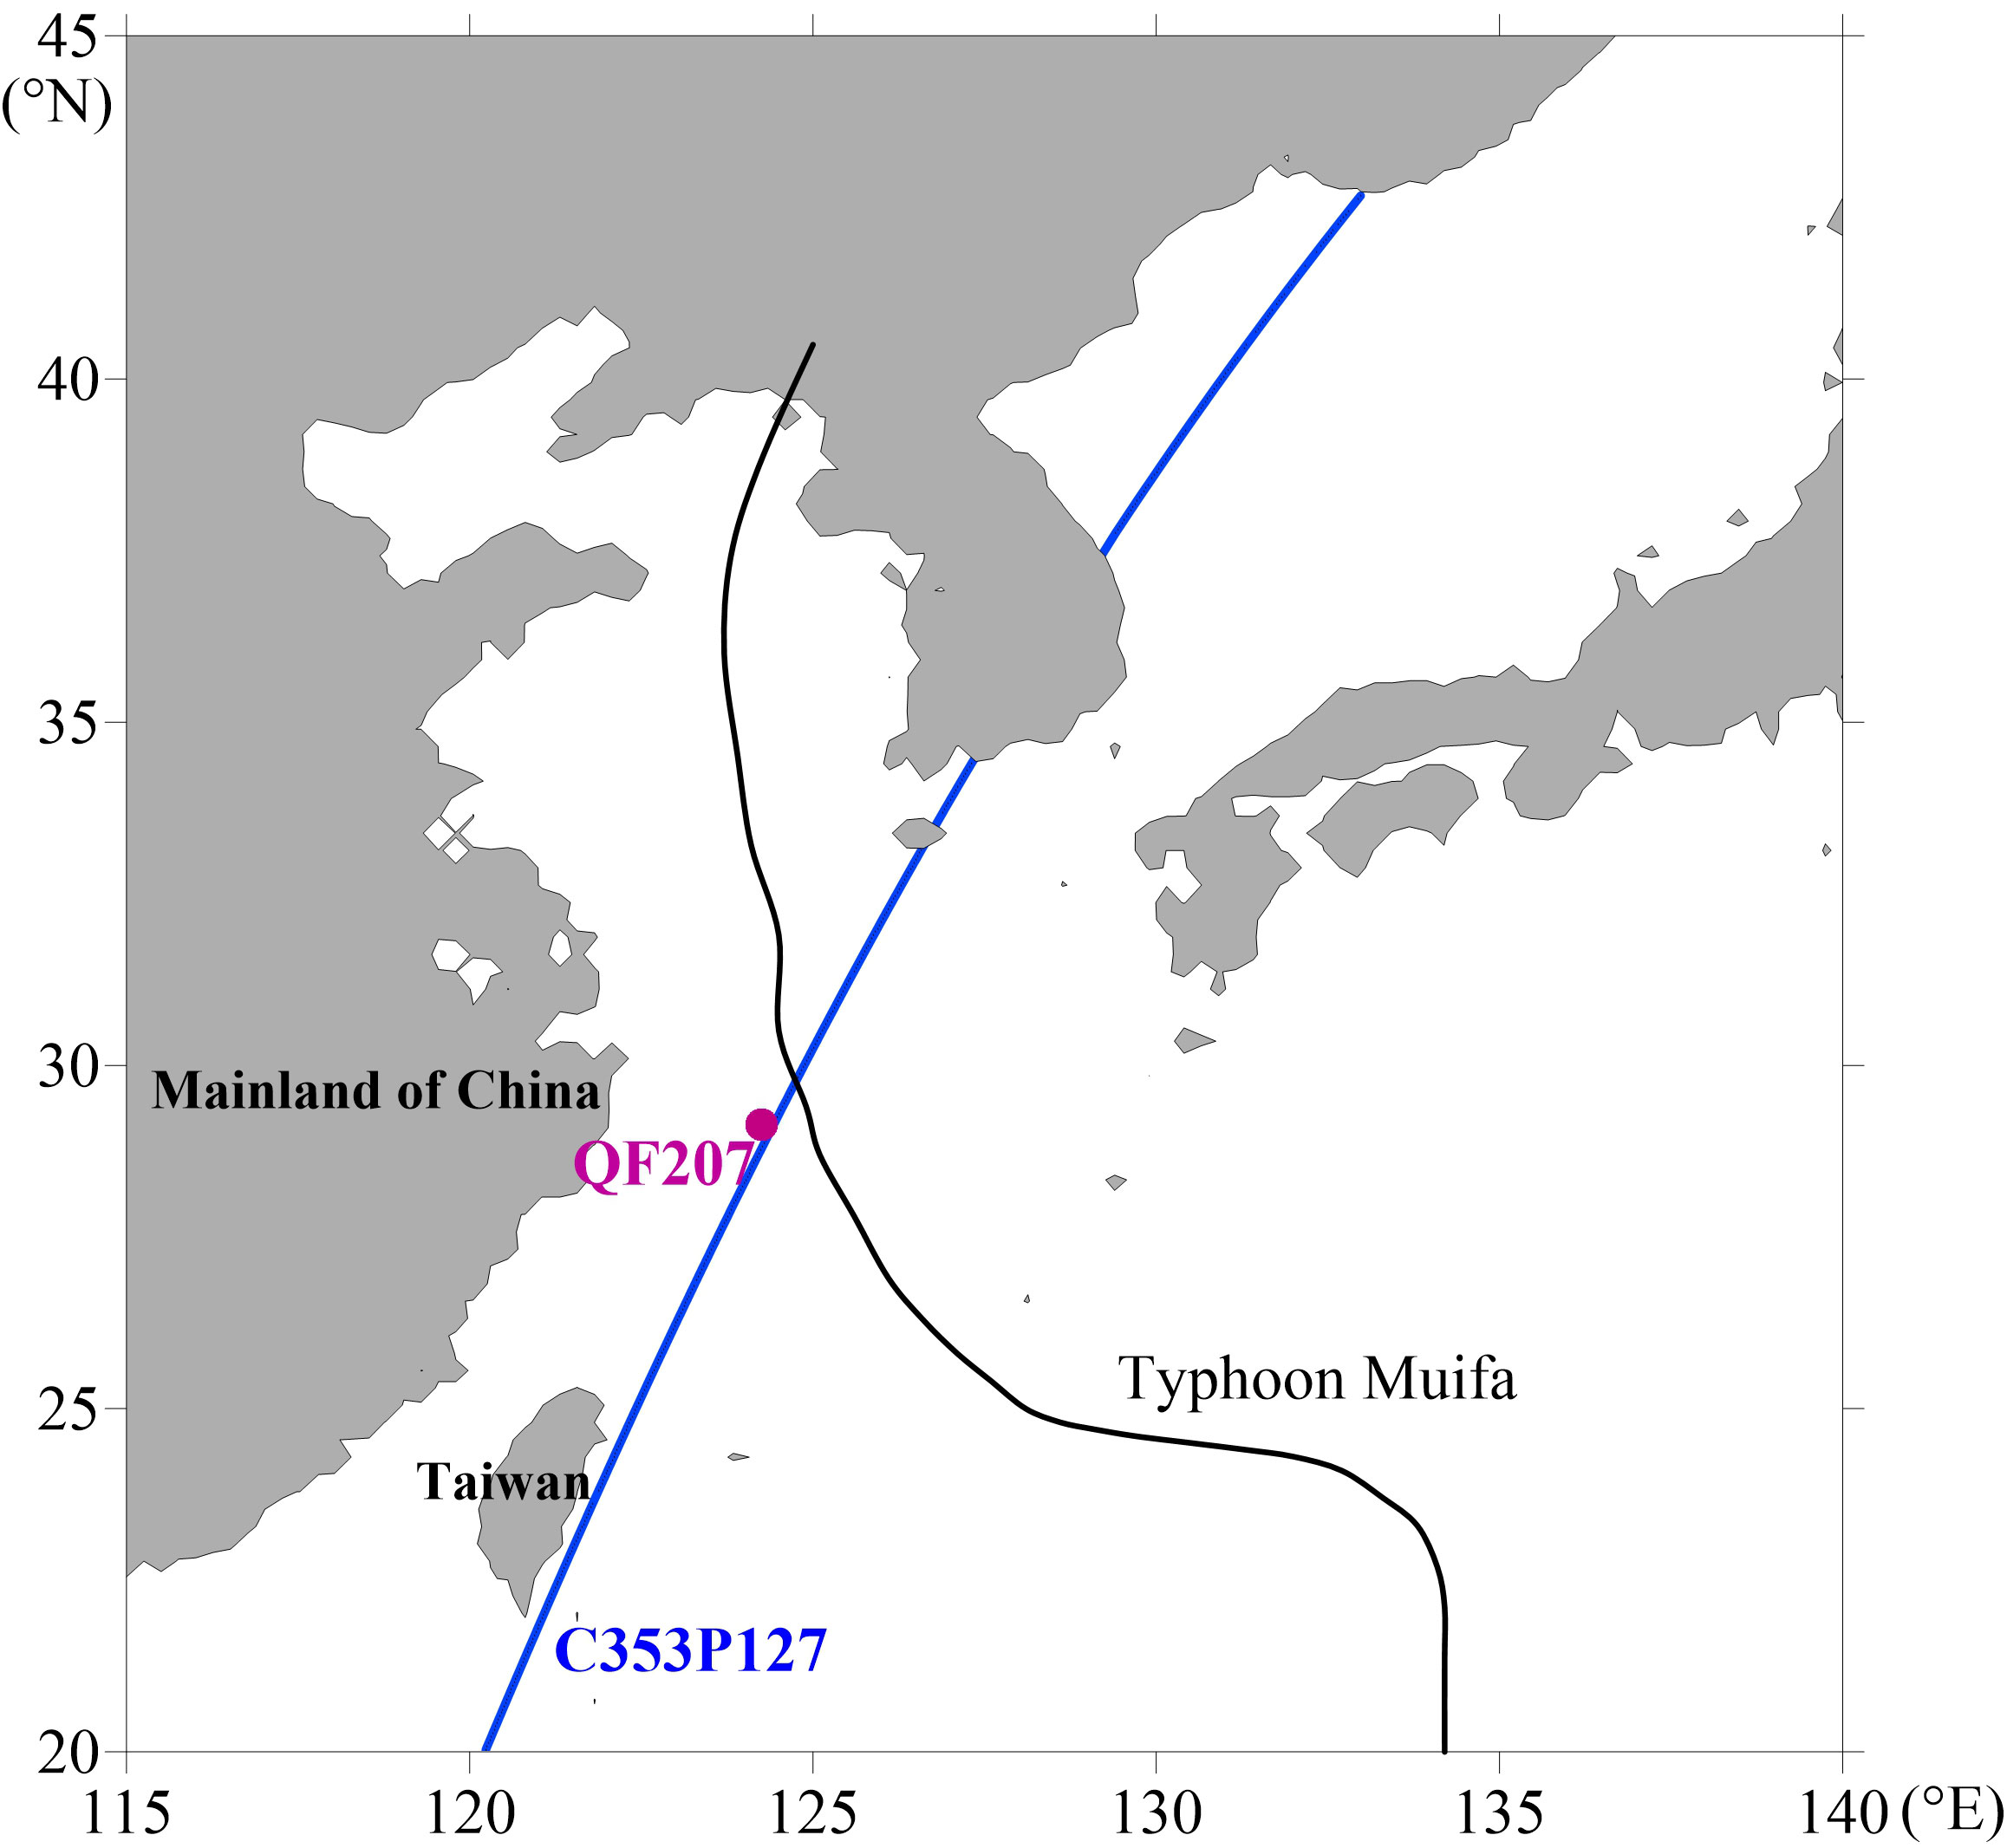
Figure 2 The location of the QF207 buoy station, satellite orbit and the typhoon path.
3.4 Satellite data
To validate the model forecast of the wind and wave space change process, the wind field and wave field computed with the asymmetric wind field model (T3) were compared with those produced using the superimposed wind field model (T2), symmetrical wind field model (T1) and satellite observations. The satellite data came from the C353P127 orbit of the Jason-1 satellite.
The Jason-1 satellite data is released by the AVISO website. The satellite is a marine terrain satellite developed by the French National Space Research Center (CNES) and the National Aeronautics and Space Administration (NASA). It is mainly used to measure the topography and sea level of the ocean surface. Each satellite is equipped with a radar altimeter and a microwave radiometer, which can observe the average sea level, sea-surface wind speed, sea-surface significant wave height, and other data. Its sea-level height observation accuracy is 4.2 cm, the spherical observation accuracy can reach 25 cm. The orbit of the Jason1 satellite is in a circular orbit with an operating altitude of 1336 km, which can effectively reduce the influence of the Earth’s gravitational field and atmospheric drag on the observation. The satellite’s orbital inclination is 66° and the orbital scanning spatial coverage is 66.03°S~66.03°N, which can cover 90% of the global ocean area. The time needed to complete one earth orbit in 9.9156 days, fully considering the impact of temporal and spatial resolution and tidal aliasing. The satellite orbit and typhoon path are shown in Figure 2.
4 Results and discussion
4.1 Wind field
To show the difference between the three wind field models in simulating wind speed, the T1~T3 scheme was applied to the East China Sea. The wind speed simulation results of Muifa and the measured results of the QF207 buoy station are shown in Figure 3, and the comparison results of the simulated wind field value of Typhoon Muifa and the actual measured value of the buoy station are shown in Table 1.
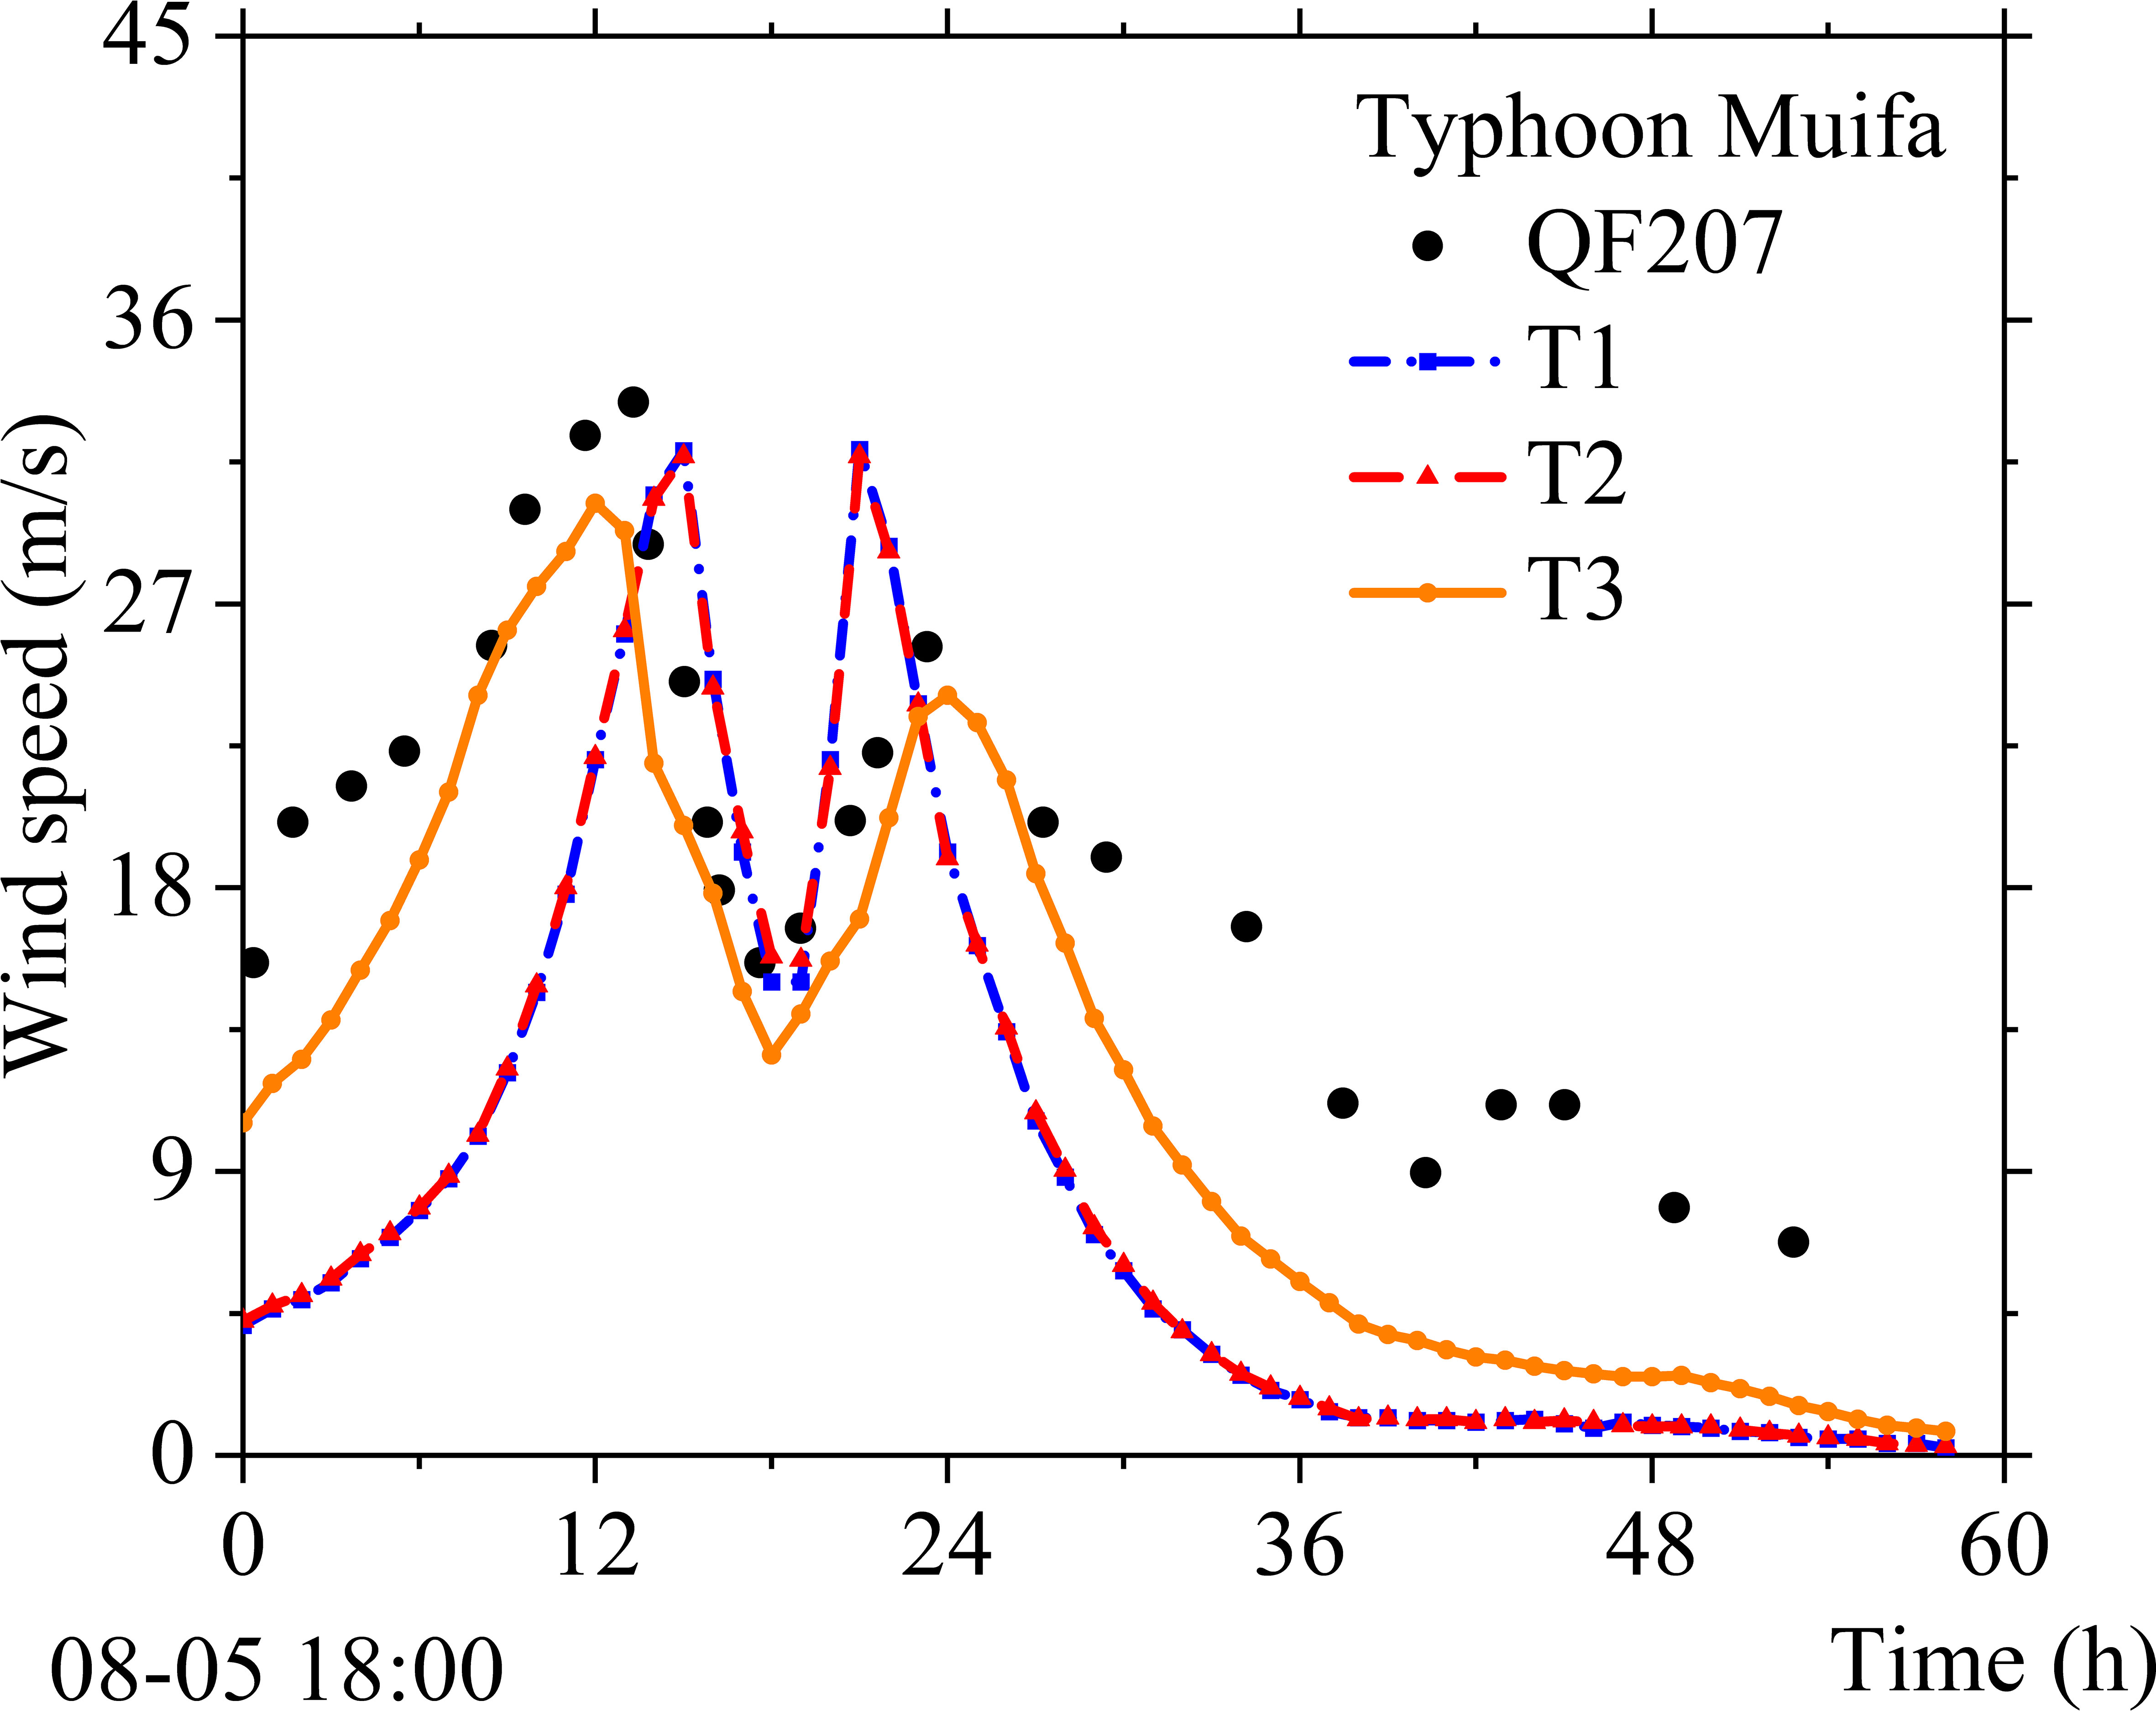
Figure 3 The modeled and buoy station observed wind speed.
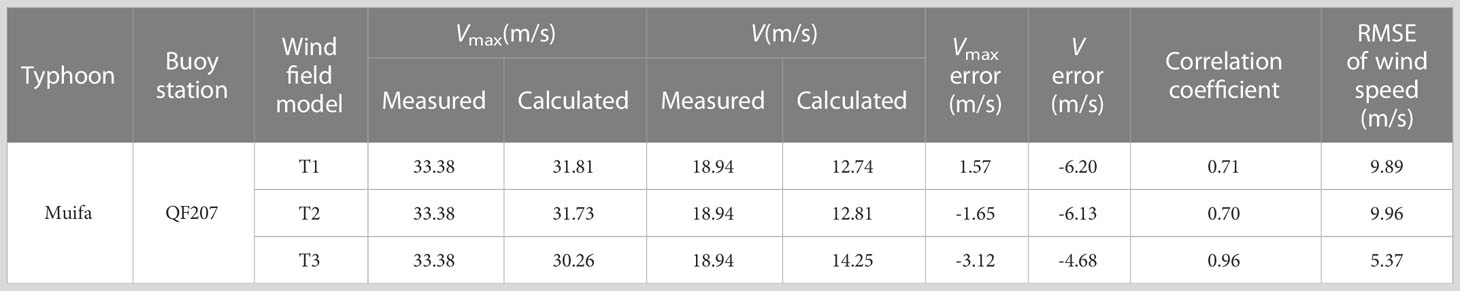
Table 1 Wind speed simulation and buoy station measured values.
It can be seen from Figure 3 that the variation trend of the simulated wind speed time change process of each scheme is in good agreement with that measured by the buoy station. However, the simulation effect of the asymmetric wind field T3 on the wind speed is closer to the actual measured wind speed than the superimposed wind field T2 and the circular symmetric wind field T1. This is because the typhoon has asymmetric characteristics, and the asymmetric wind field can better reflect the actual typhoon. The simulation results of the superimposed wind field T2 and the circular symmetrical wind field T1 are not much different. This is because the asymmetric characteristics of the typhoon are not only affected by the movement of the typhoon but also affected by various factors such as environment, topography, and underlying surfaces (Olfateh et al., 2017).
The resultant simulated wind speed of Typhoon Muifa, given in Table 1, shows that the average wind speed error and the root mean square error of wind speed in the T3 scheme are reduced compared with the T1 and T2 schemes. Among them, the root mean square error of wind speed is reduced by 45.70% and 46.08% compared with T1 and T2, corresponding to a root mean square error of only 5.37 m/s. At the same time, during the developmental stage of Typhoon Muifa, the correlation between the simulated wind speed value of the T3 scheme and the actual wind speed value at the buoy station was the best, and the correlation coefficient reached 0.96, which was significantly higher than the other two schemes.
To show the spatial distribution characteristics of the typhoon wind field constructed by the above three wind field models, the wind speed and wind direction simulation results of Muifa and the measured results of the C353P127 orbit of Jason-1 satellite are shown in Figure 4 and the comparison results of the simulated wind field value of Typhoon Muifa and the actual measured value of the satellite are shown in Table 2.
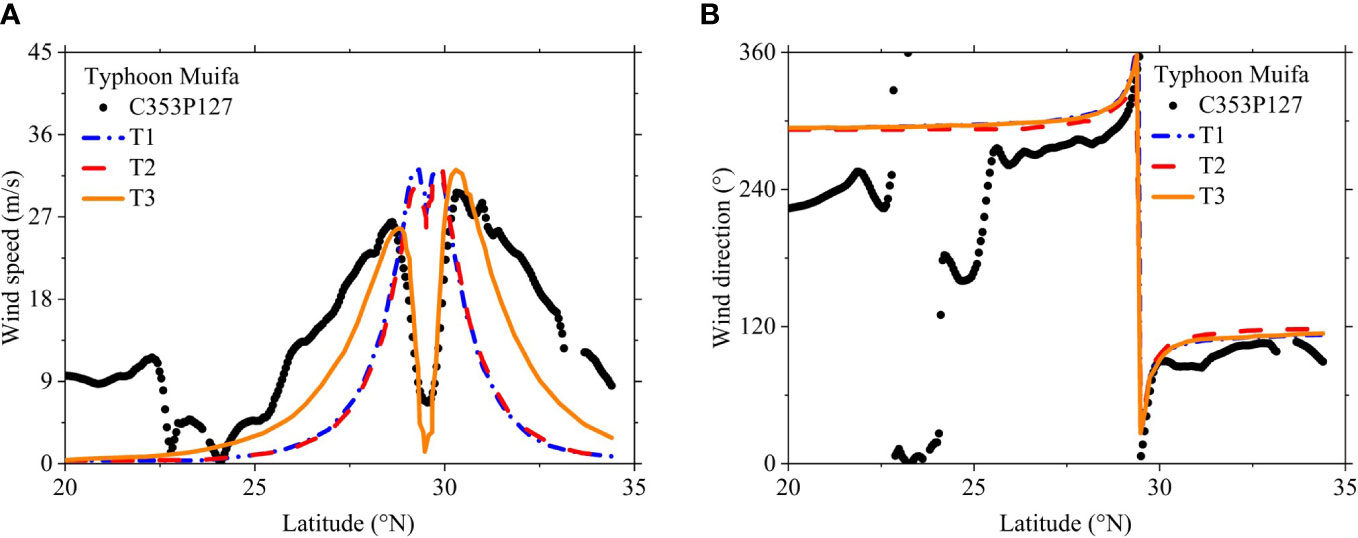
Figure 4 The modeled and satellite observed: (A) wind speed, (B) wind direction.
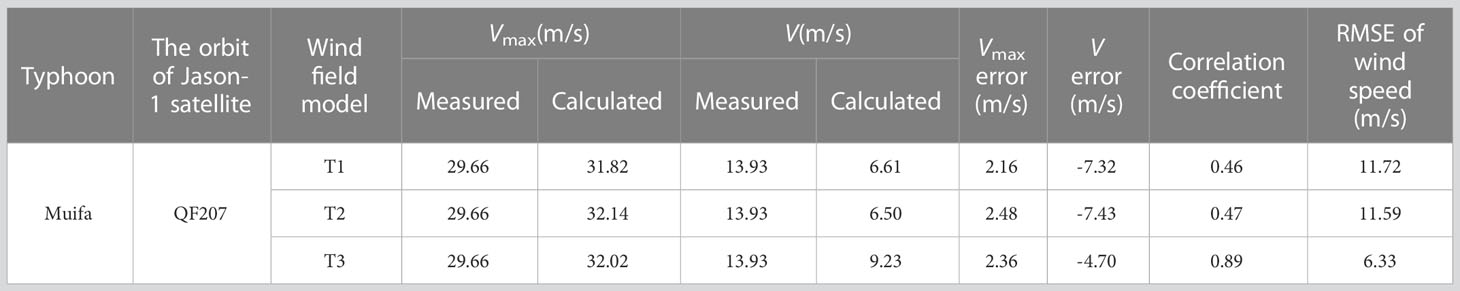
Table 2 Wind speed simulation and Jason-1 satellite measured value.
The results in Figure 4 show that because the satellite scanning zone crosses the typhoon center area, the satellite-measured wind field presents prominent asymmetrical characteristics, that is, the typhoon center wind speed is very low, and the wind speed on the right side of the typhoon wind field is significantly higher than that on the left side. At this time, the asymmetric wind field T3 can well reflect the asymmetric characteristics of the typhoon, in contrast, the superimposed wind field T2 does not show the asymmetric characteristics of the typhoon clearly, the circular symmetric wind field T1 does not show the asymmetric characteristics of the typhoon.
In the simulation of the wind direction process of Typhoon Muifa, the three wind field models that simulated the wind direction process line almost the same, which is in good agreement with the actual wind direction as measured by the satellite at the center of the typhoon, and gradually changes with the change of latitude. However, in the peripheral area of the typhoon, there are differences between the simulated wind direction values of the three wind field models and the actual measured value of the satellite. This is because the typhoon’s periphery is mainly affected by the environmental wind, so a single typhoon wind field model cannot simulate the wind process well (Shen et al., 2016).
It can be seen from Table 2 that when the satellite scanning zone C353P127 passes through the center of Typhoon Muifa, the asymmetric wind field in T3 is significantly correlated with the measured wind field compared to the circular symmetric wind field in T1 and the superimposed wind field in T2. The root mean square error of wind speed in T3 is reduced by 45.99% and 45.38% compared with T1 and T2. It can be seen that the asymmetric wind field can better depict the characteristics of wind speed distribution in the typhoon center area.
4.2 Wave field
4.2.1 Typhoon wave calculation effect
Using the above three wind field models to drive the third-generation wave model SWAN to simulate the spatiotemporal changes of the significant wave heights of the typhoon in the East China Sea, we used the measured data from the buoy stations and satellites to compare the effects of different wind field models on the calculation results of the space and time distributions of the waves. For the verification of the calculated typhoon waves within the time range, the results of the typhoon wave-time-change process, as simulated using the wind field model and the measured results of the QF207 buoy station are shown in Figure 5A. For the verification of the calculated effect of the typhoon waves within space, the results of the typhoon wave-space change process, as simulated using the wind field model, and the measured results of the C353P127 orbit of Jason-1 satellite are shown in Figure 5B.
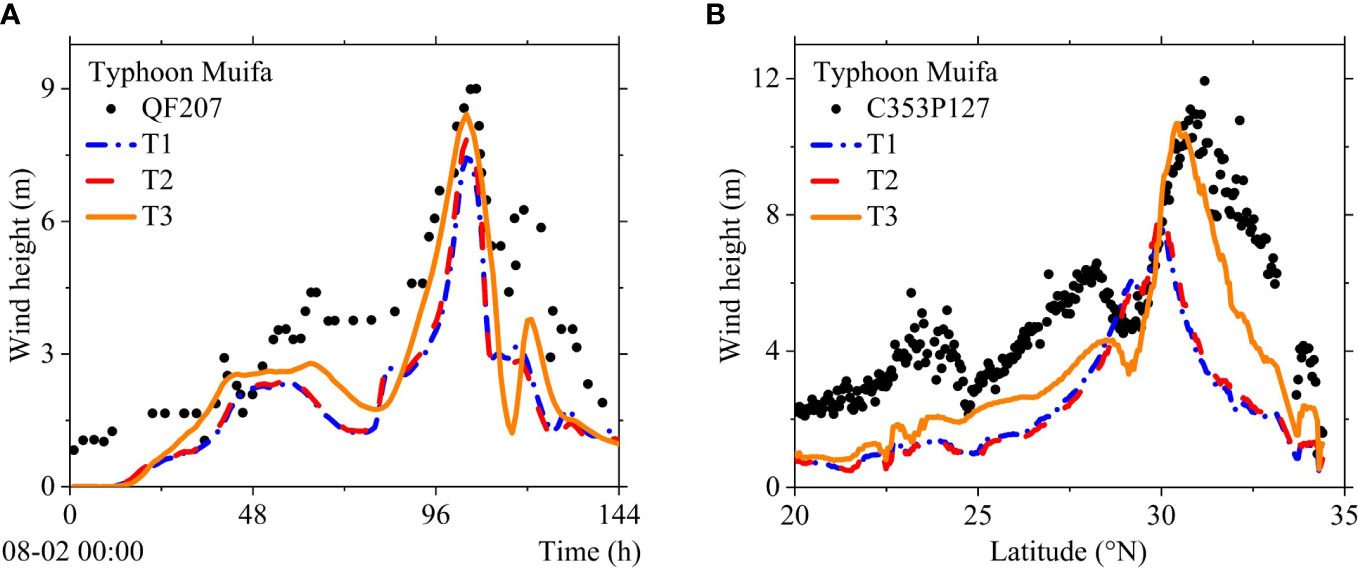
Figure 5 Typhoon waves: (A) the modeled and buoy station observed, (B) the modeled and satellite observed.
It can be seen from Figure 5A that the three wind field models can all reflect the wave change trend. In the simulation of the time change process of the wave heights of Typhoon Muifa, T1 and T2 both underestimated the significant wave heights. In the simulation of the maximum wave height near the buoy station, the simulated value of the asymmetric wind field T3 is more consistent with the measured value, and it can more accurately simulate the significant wave height in the central area of the typhoon.
Figure 5B shows that the change trend of the simulated value of the significant wave height of each wind field model is basically the same as the measured value on the satellite orbit. The deviation between the simulated value of the average wave height of each wind field model and the measured value on the satellite orbit is small, and the three wind field models can show the average level of the significant wave height distribution on the satellite scanning zone. However, the asymmetric wind field of T3 is more accurate in the simulation of the change trend of significant wave heights, especially the simulation of the maximum value of the significant wave height of the typhoon waves, which can more accurately describe the extreme value distribution of the typhoon waves within the satellite scanning zone.
4.2.2 Wave field simulation effect
To further demonstrate the influence of three different wind field models on the distribution characteristics of the wave fields, the wave fields simulated using the three wind field models at 1200 UTC 3 August 2011, 1800 UTC 4 August 2011, 0000 UTC 6 August 2011, as Typhoon Muifa passed through the East China Sea are shown in Figures 6–8.
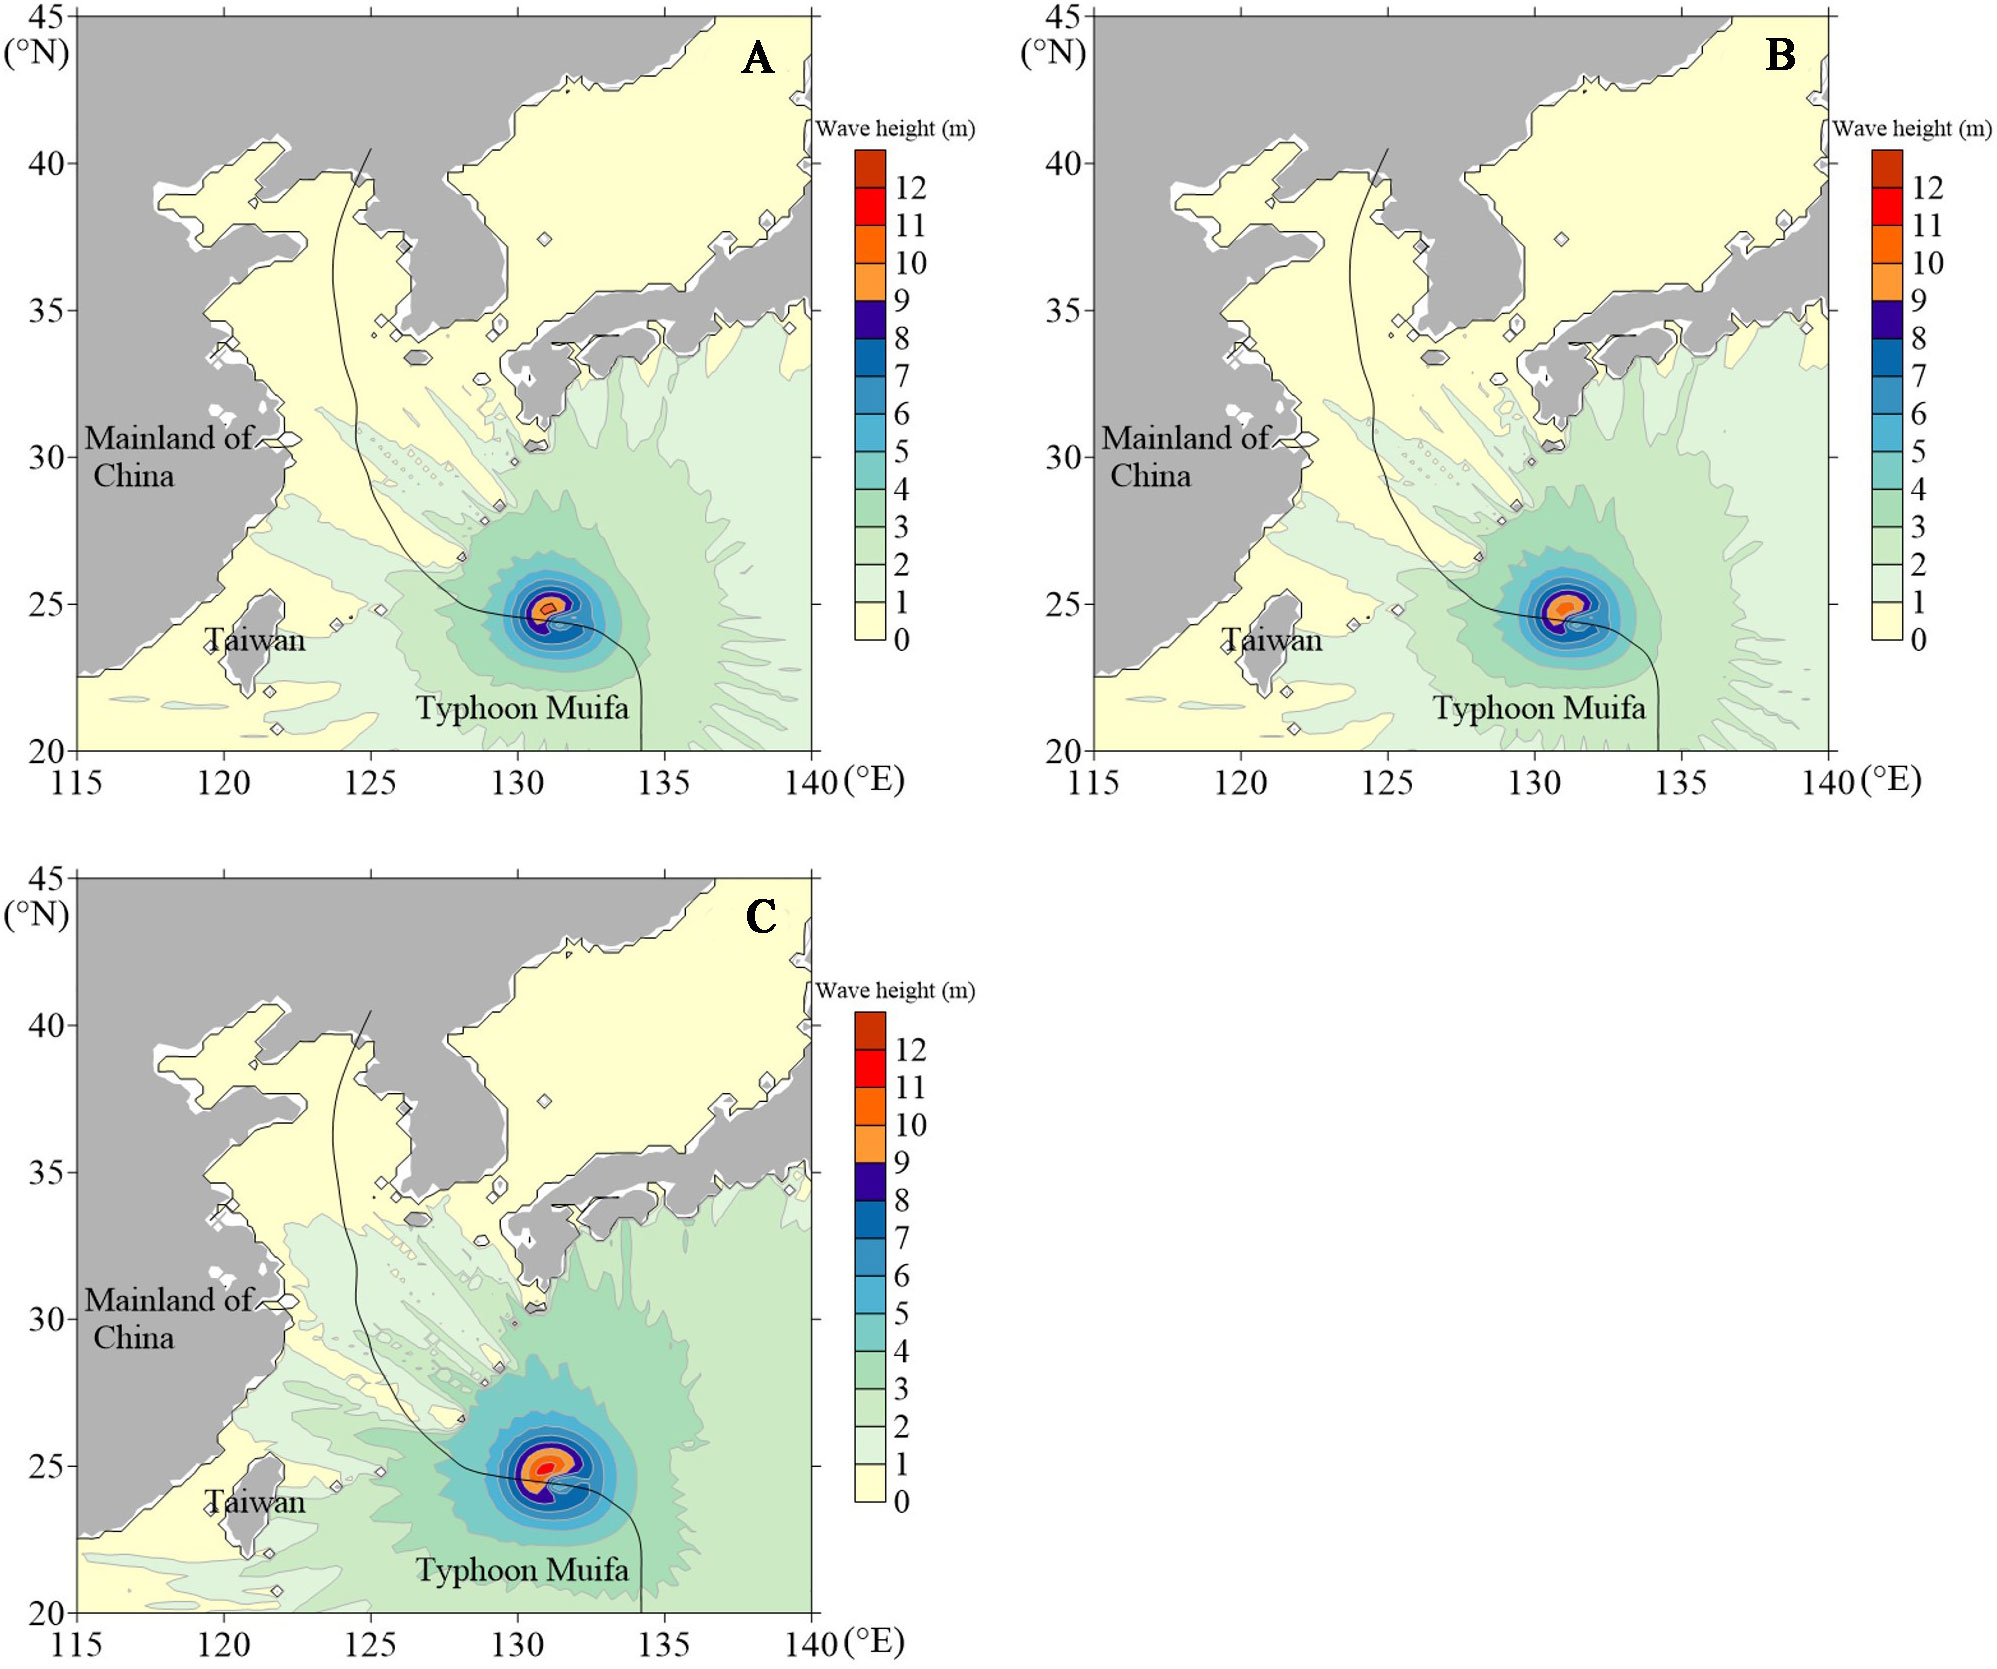
Figure 6 Distribution map of the wave field of Typhoon Muifa at 1200 UTC 3 August 2011: (A) symmetrical wind field, (B) superimposed wind field, (C) asymmetric wind field.
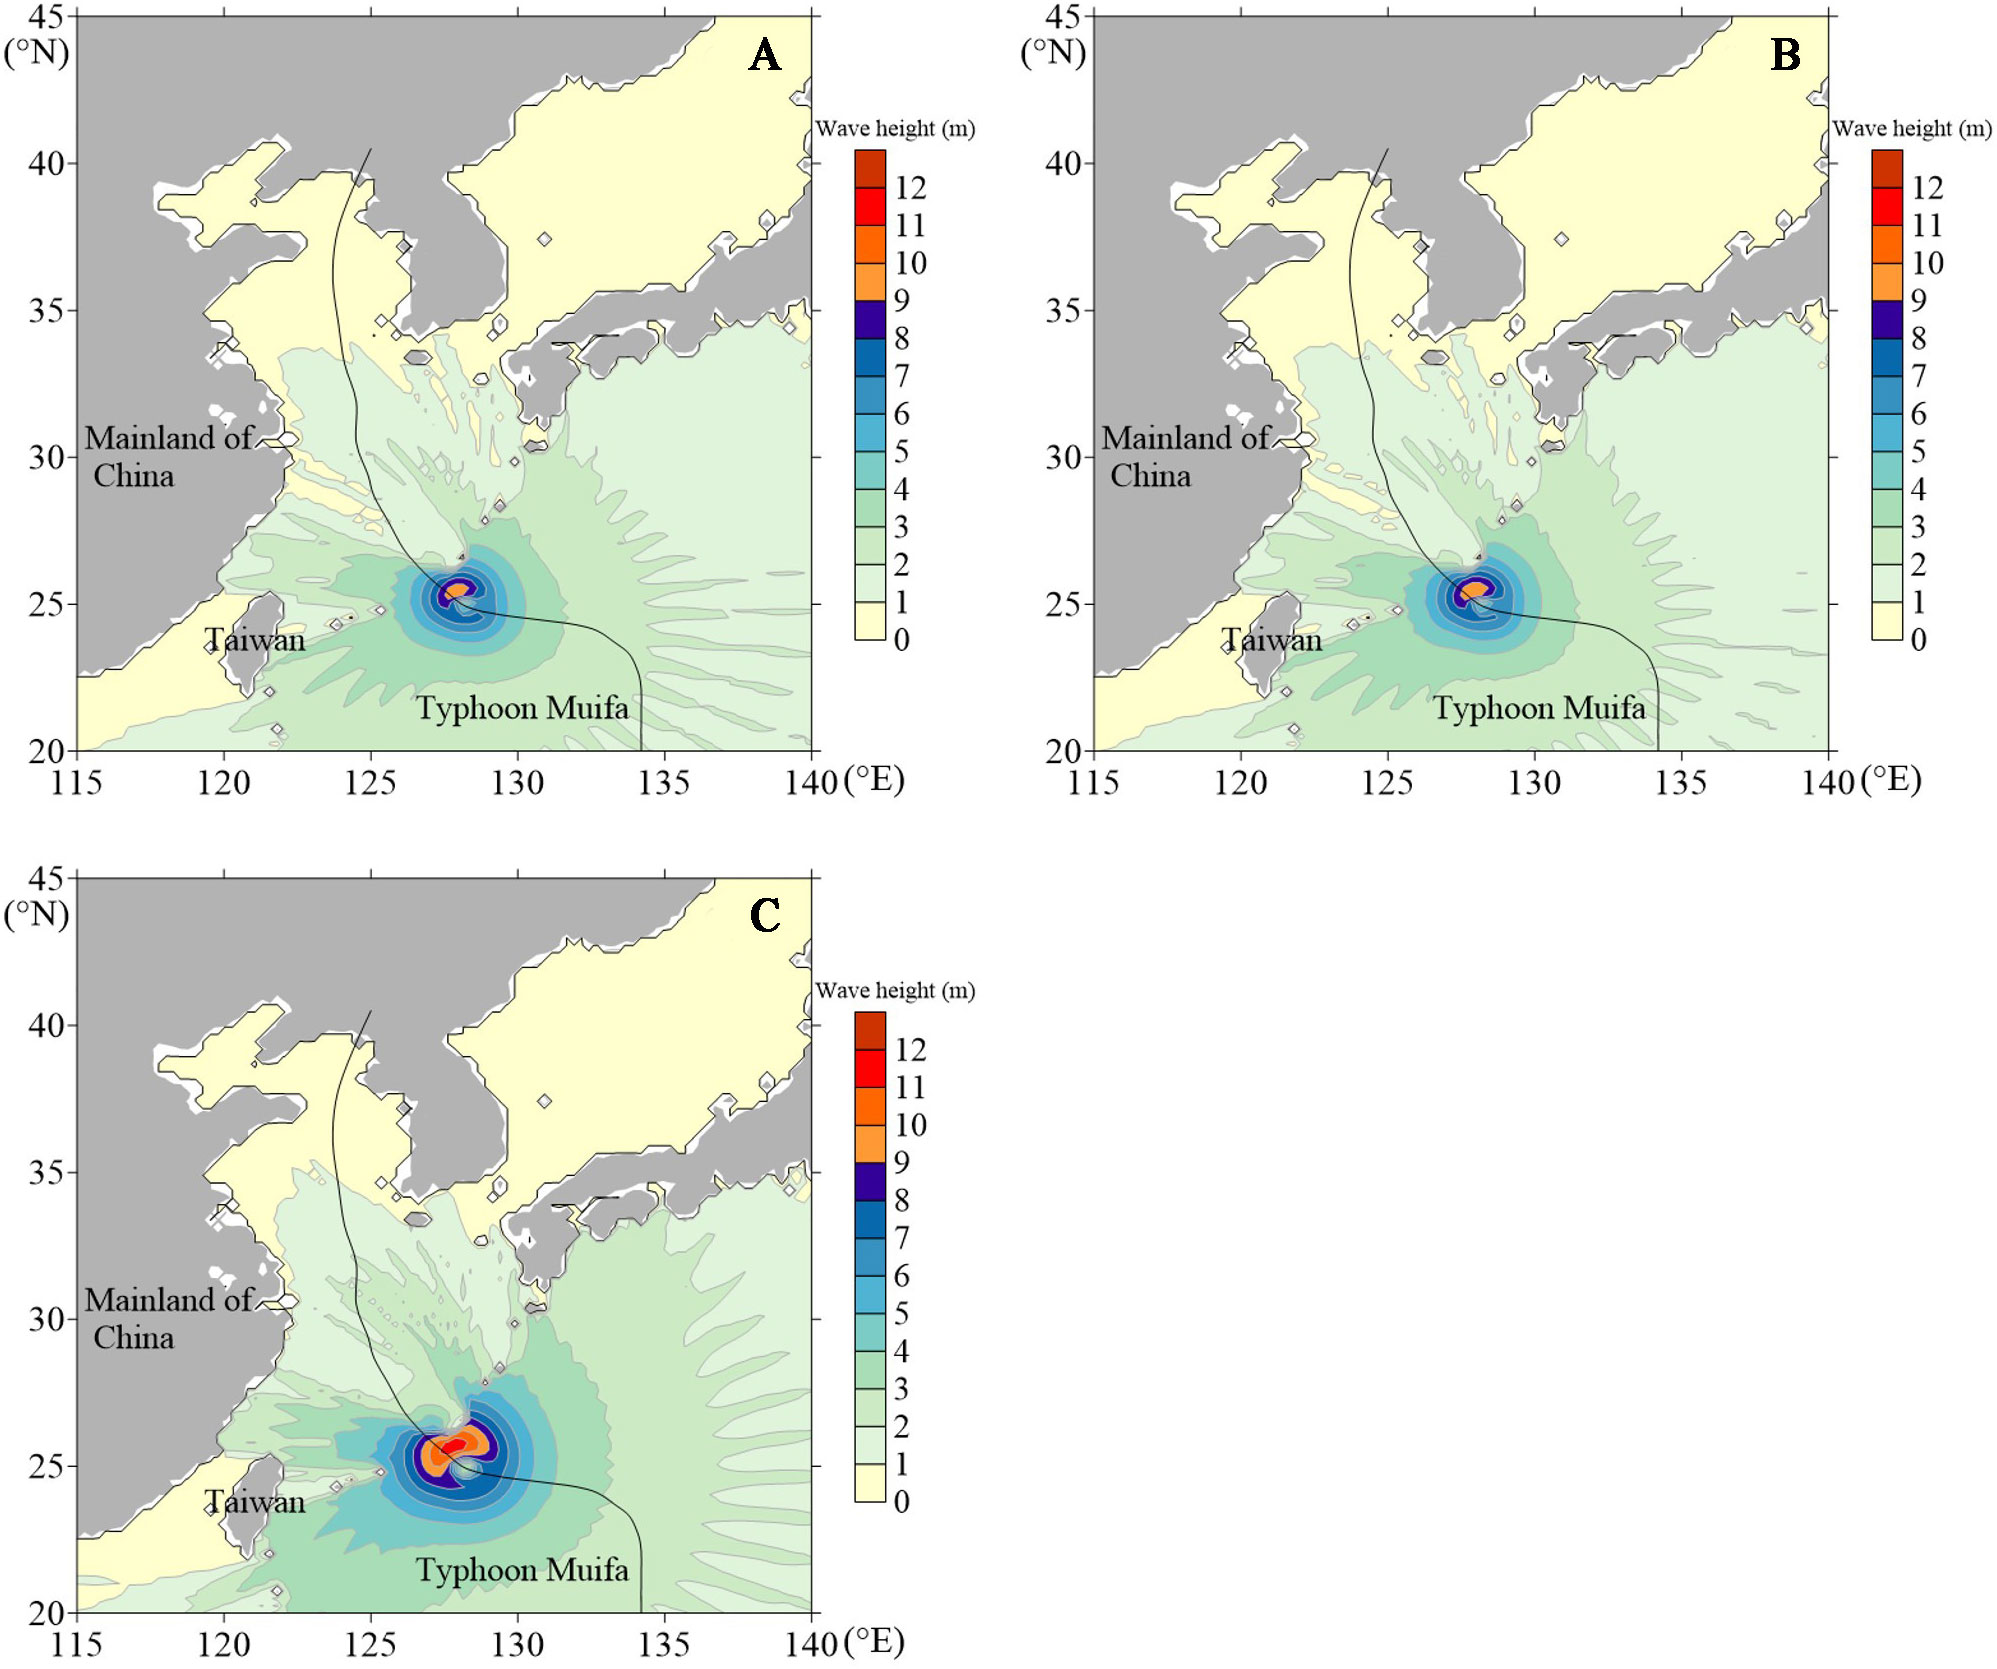
Figure 7 Distribution map of the wave field of Typhoon Muifa at 1800 UTC 4 August 2011: (A) symmetrical wind field, (B) superimposed wind field, (C) asymmetric wind field.
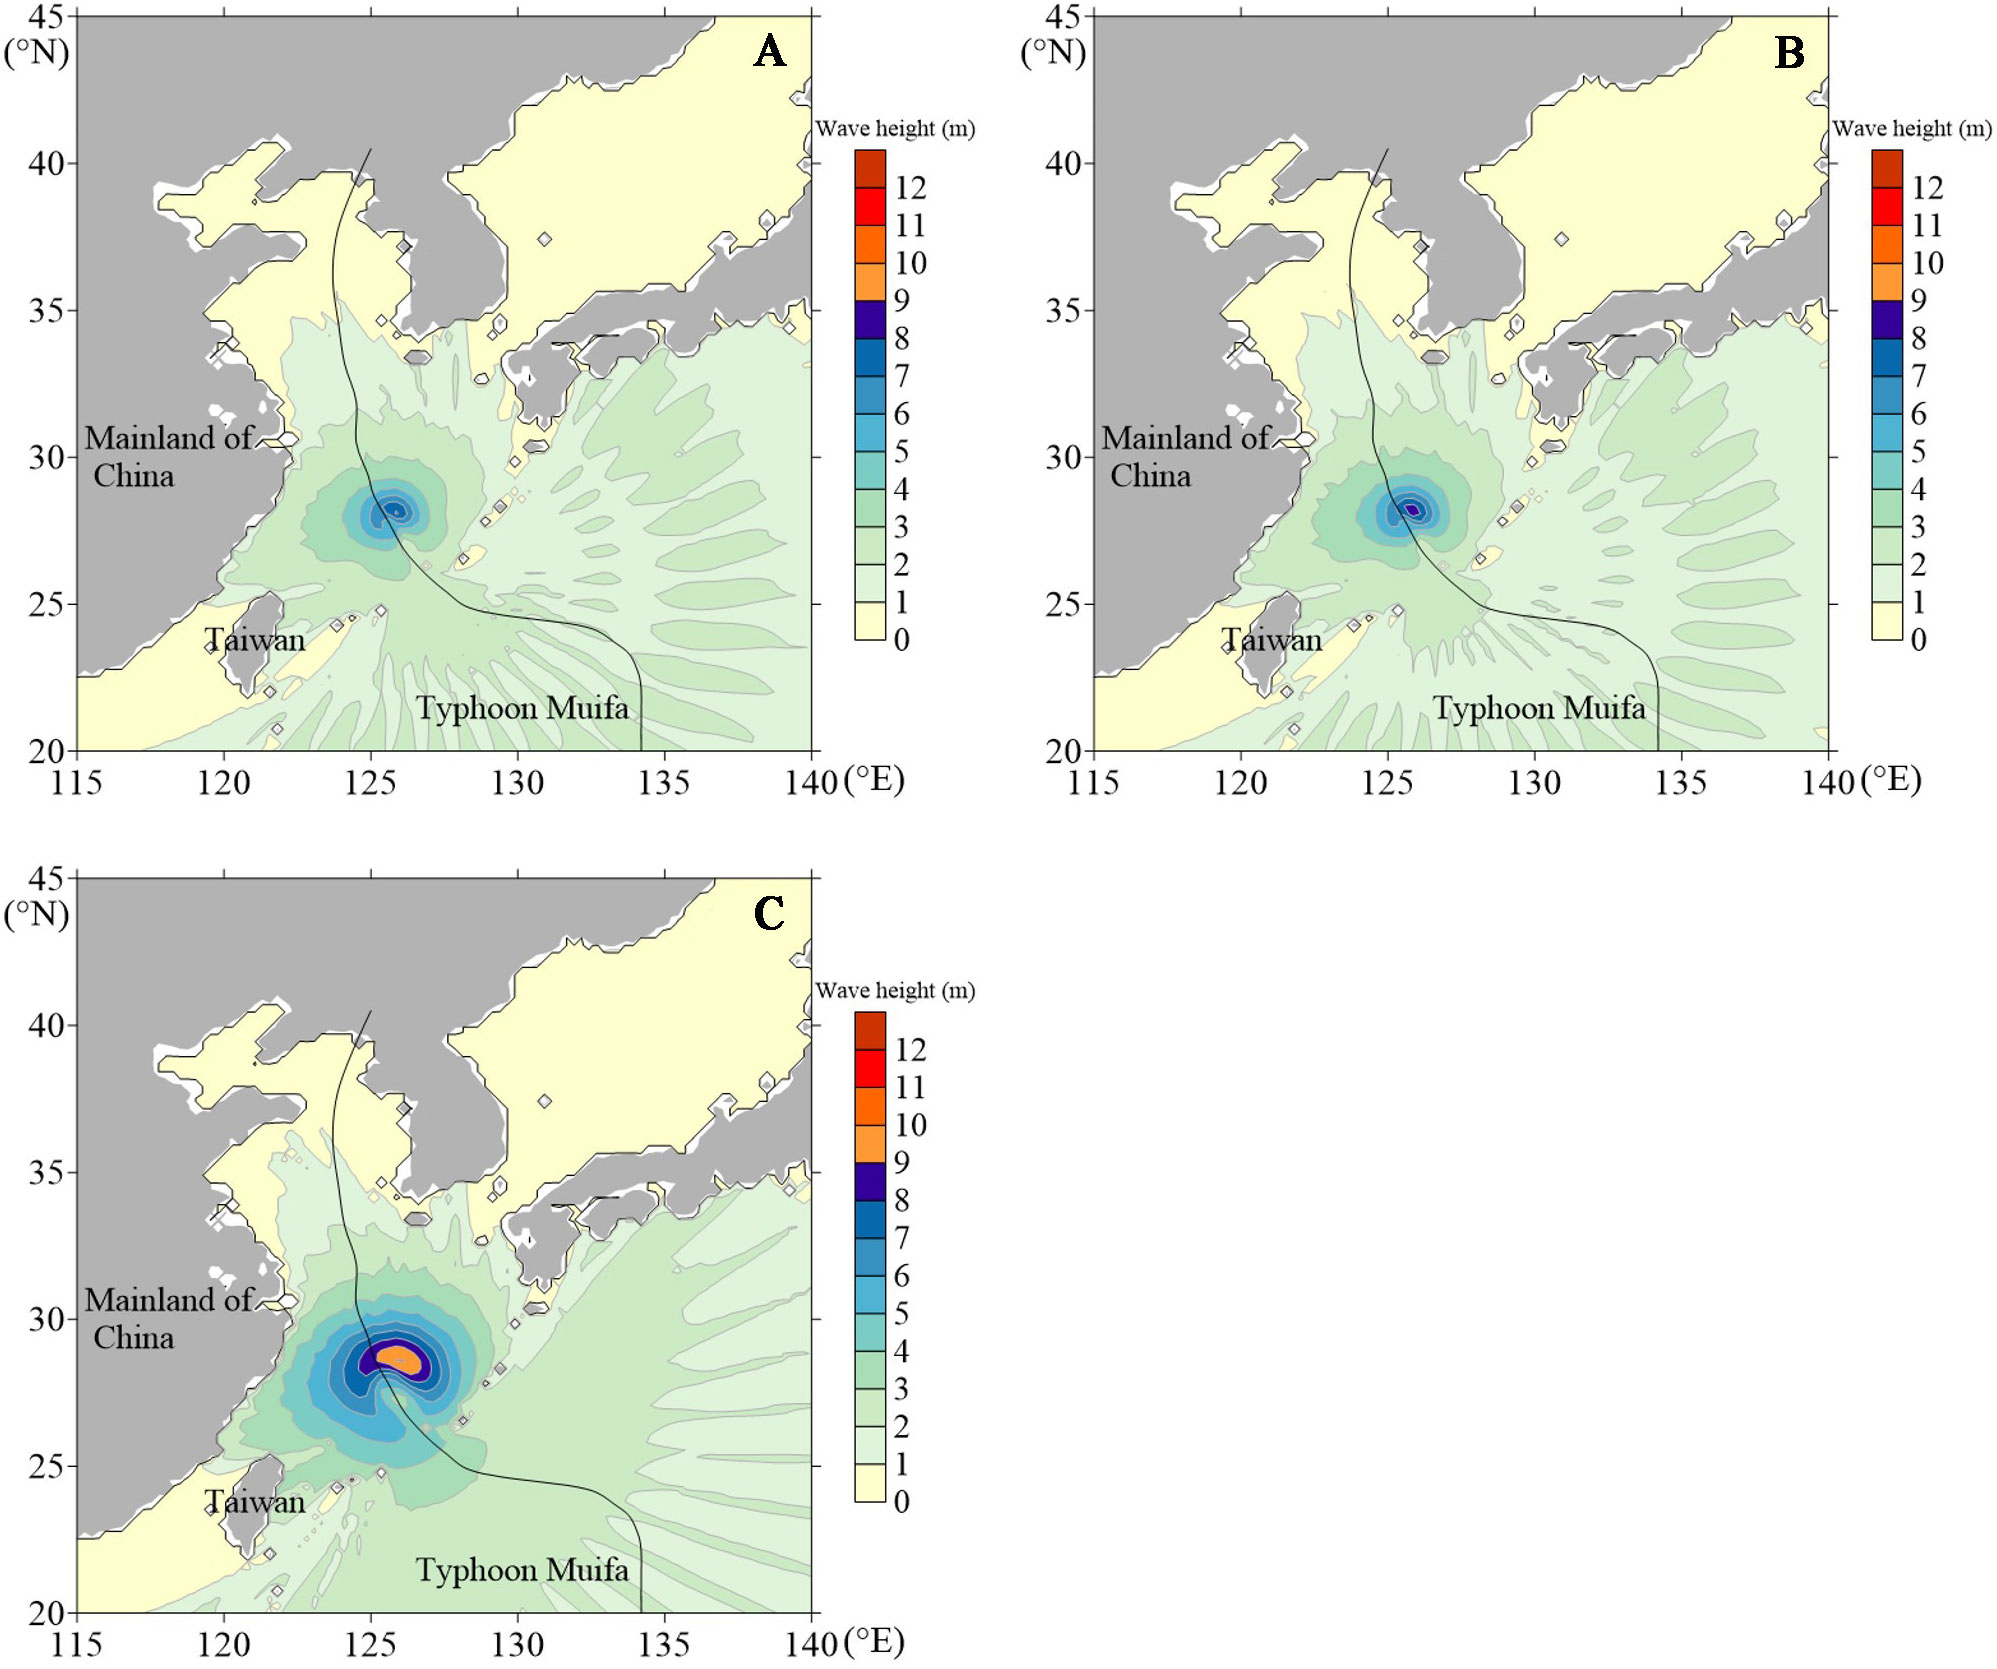
Figure 8 Distribution map of the wave field of Typhoon Muifa at 0000 UTC 6 August 2011: (A) symmetrical wind field, (B) superimposed wind field, (C) asymmetric wind field.
The simulation results in Figures 6–8 show that the wave field exhibits prominent asymmetric characteristics during the typhoon’s movement. At 1200 UTC 3 August and 1800 UTC 4 August, the wave fields simulated using the three wind fields show asymmetric characteristics of the maximum significant wave height in the northwest quadrant and the minimum significant wave height in the southeast quadrant. At 0000 UTC 6 August, the wave fields simulated using the three wind fields show the asymmetric characteristics of the maximum significant wave height in the northeast quadrant and the minimum significant wave height in the southeast quadrant. The three typical time points all show that the wave height on the right side of the typhoon’s path is significantly higher than the wave height on the left side, forming a crescent-shaped wave height contour distribution on the right side. Meanwhile, the significant wave height of the typhoon simulated using the asymmetric wind field at three typical time points is the largest, reaching above 11 m at 1200 UTC 3 August and 1800 UTC 4 August, above 10 m at 0000 UTC 6 August, which are about 2 m higher than the significant wave height simulated using the circular symmetrical wind field and the superimposed wind field. At the same time, the distribution range of the large wave area simulated using the asymmetric wind field is more extensive than that of the other two wind fields.
4.2.3 Influence range of typhoon waves
The typhoon wind field is the primary energy source of typhoon waves, so there is a clear correlation between the two (Ou et al., 2002). To explore the distribution characteristics and influence range of the extreme value of wind field and wave field simulated using each wind field model, the maximum wind speed field and maximum wave height field during the period of Typhoon Muifa passing through the East China Sea are shown in Figure 9.
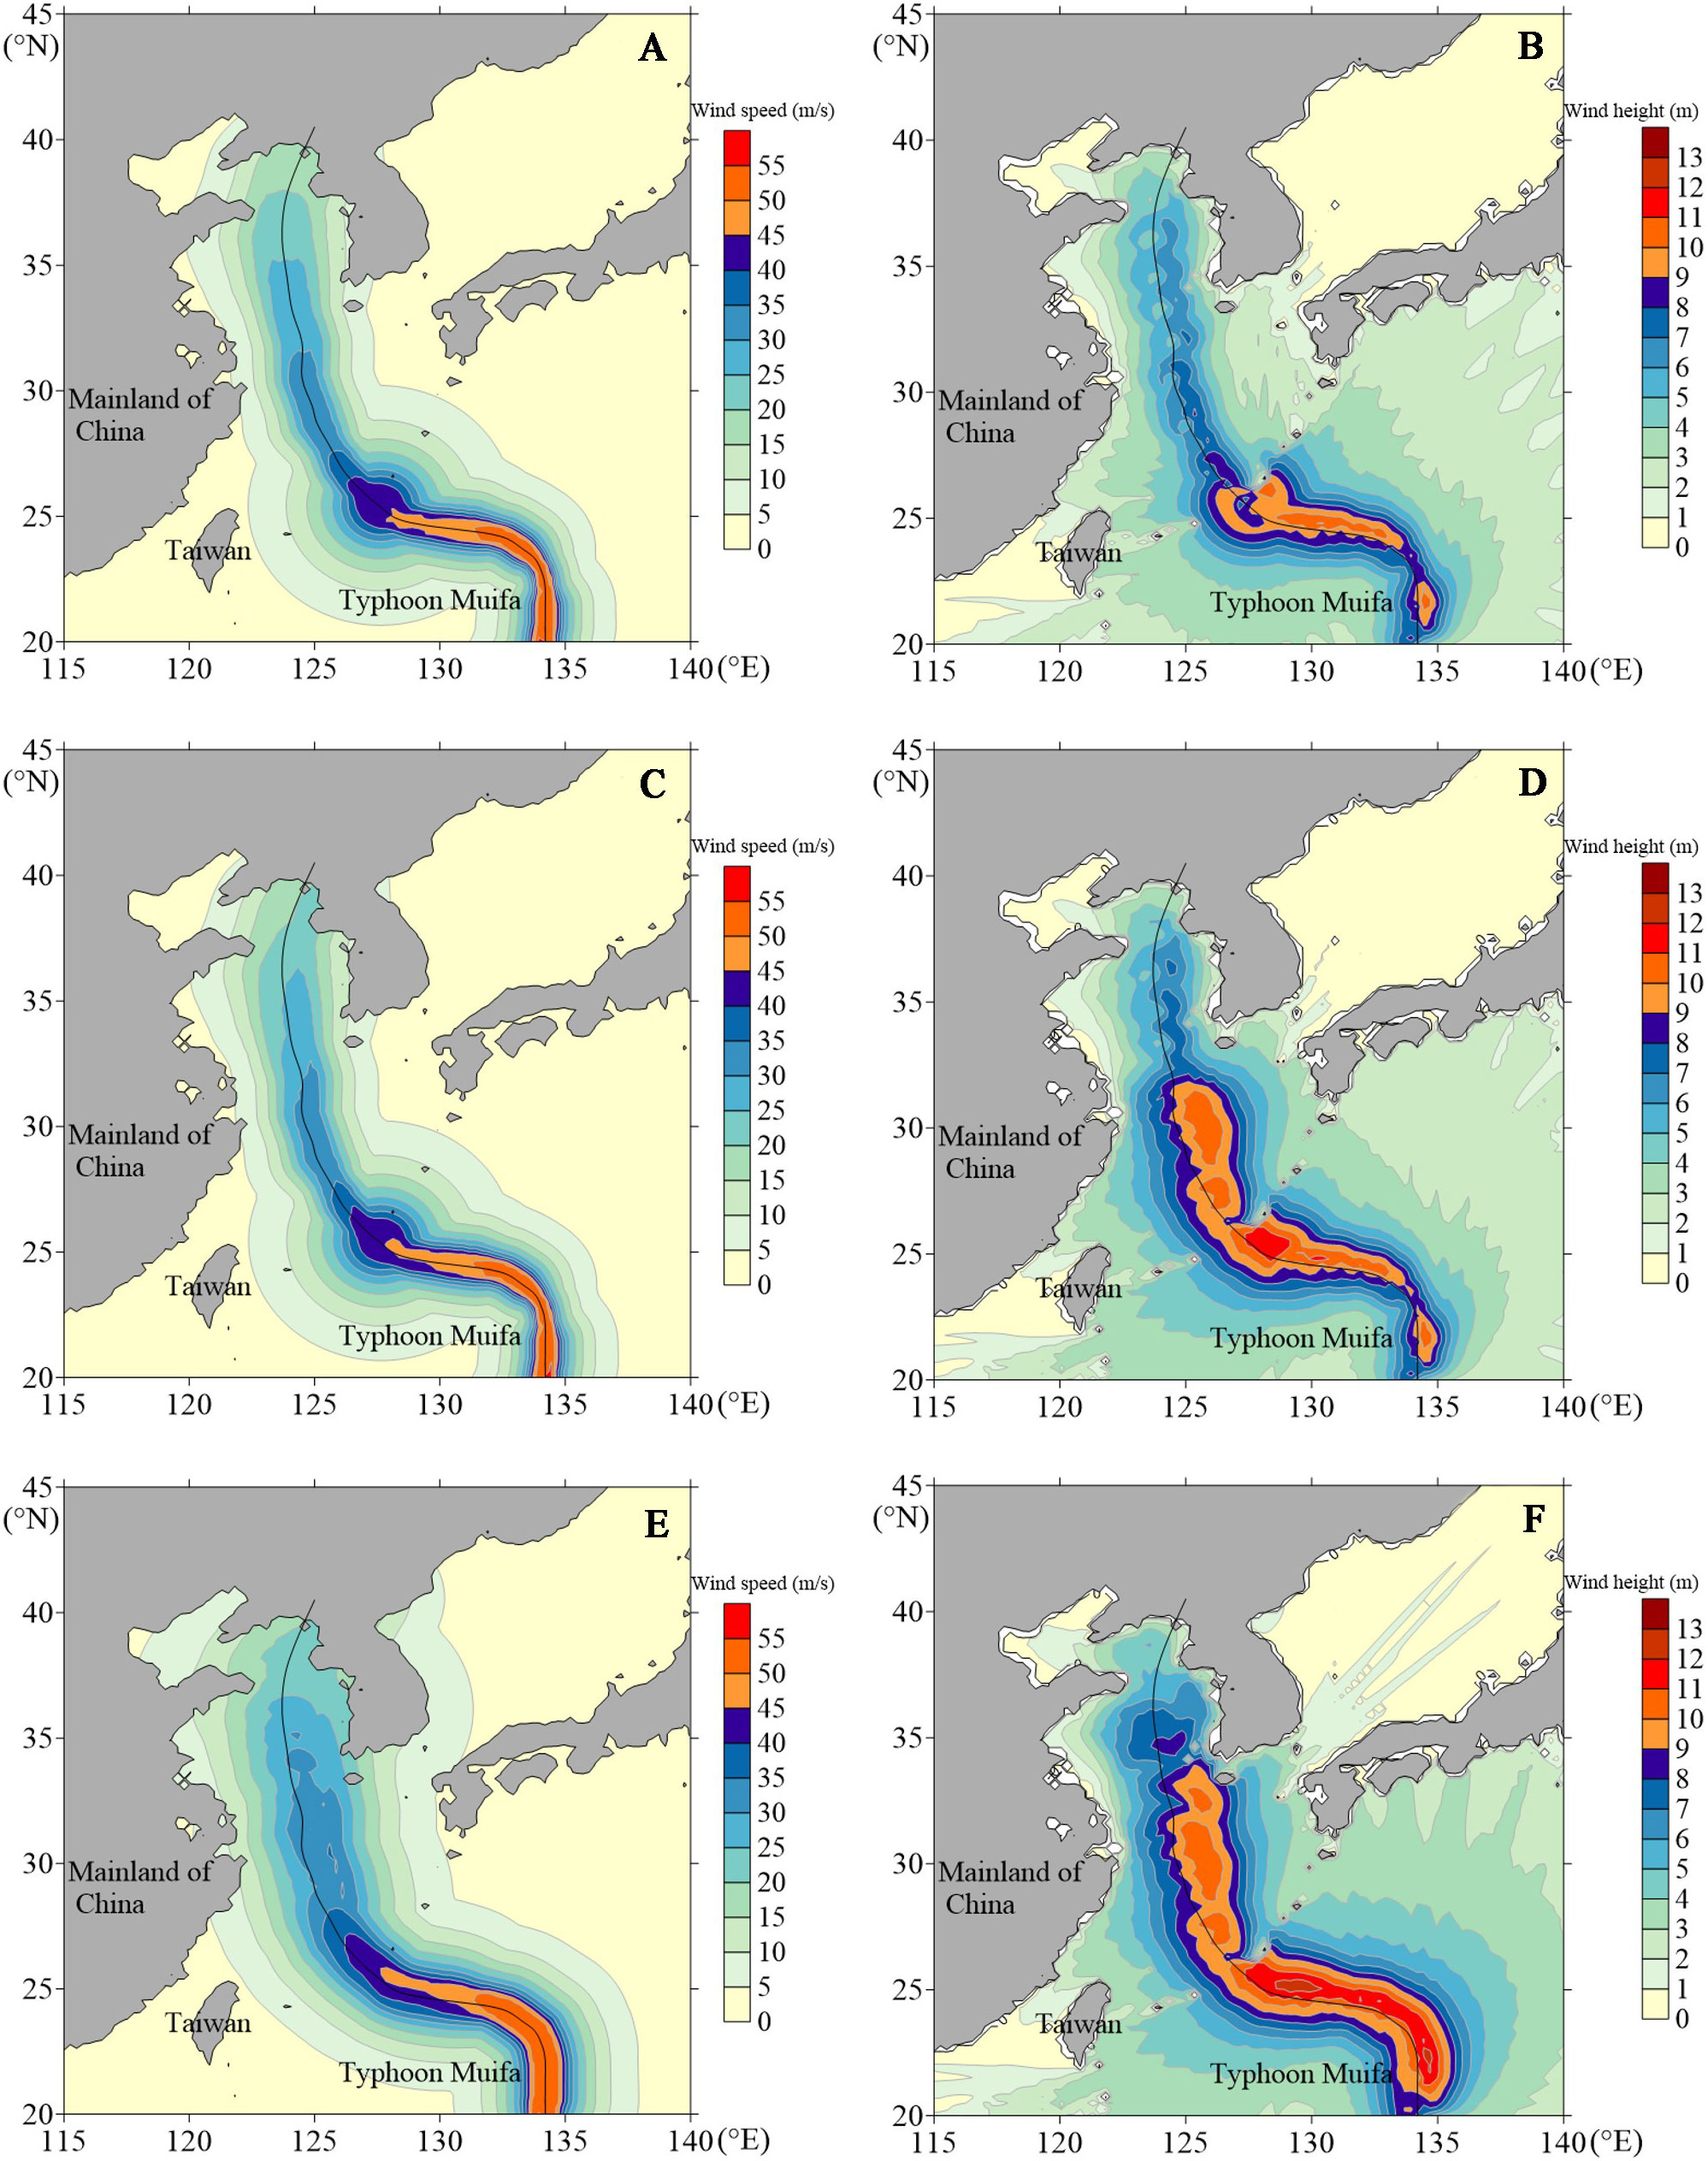
Figure 9 Distribution maps of the maximum wind speed field and maximum wave height field of Typhoon Muifa: (A) wind speed of symmetrical wind field, (B) wave height of symmetrical wind field, (C) wind speed of superimposed wind field, (D) wave height of superimposed wind field, (E) wind speed of asymmetric wind field, (F) wave height of asymmetric wind field.
Figures 9A, C, E show the simulation of the maximum wind speed field. During the typhoon transit, the maximum wind speed contour simulated using the circular symmetric wind field model shows a symmetrical belt-like distribution centered on the typhoon’s path and spreads from the symmetrical center area to both sides and gradually decreases (Figure 9A). The maximum wind speed contours simulated using the superimposed wind field model shows an asymmetrical belt-like distribution centered on the typhoon’s path, but the asymmetry is weak (Figure 9C). In contrast, the maximum wind speed contour simulated using the asymmetric wind field model shows an asymmetrical belt-like distribution centered on the typhoon’s path, and the asymmetric features are prominent. The maximum wind speed on the right side of path is higher than that on the left side. At the same time, the typhoon’s high wind area, as simulated using the asymmetric wind field model, has a wide distribution range (Figure 9E).
For the simulation of the maximum wave height field, Figures 9B, D, F show that the maximum wave height fields simulated using the three typhoon wind field models all show an asymmetrical belt-like distribution centered on the typhoon’s path. Among them, the wave field simulated using the asymmetric wind field model has the strongest asymmetry, that is, the maximum wave height on the right side of typhoon moving path is about 2 m higher than that on the left side of movement path (Figure 9F). However, the maximum wave height simulated using the circular symmetric wind field model (Figure 9B) and superimposed wind field model (Figure 9D) on the right side of typhoon moving path is only about 1 m higher than that on the left side of movement path. Therefore, the asymmetric characteristics of the maximum wave height field simulated using the asymmetric wind field model are substantially higher than the other two wind field models. The asymmetric wind field model can more accurately describe the actual wave field characteristics in typhoons.
The maximum wind speed and wave height fields also have a certain correlation. Since the maximum wind speed field simulated using the circular symmetric wind field model is symmetrically distributed, the maximum wave height field simulated using this model has the weakest asymmetry; the maximum wind speed field simulated using the asymmetric wind field model is asymmetrically distributed, so the maximum wave height field simulated using this model has the strongest asymmetry. At the same time, the 10 m/s wind speed affected area in the maximum wind speed contour map basically corresponds to the 5-m wave effect area in the maximum wave height contour map, and the distribution trends of wind speed and wave height are basically the same within the two affected areas.
4.3 Wave spectrum
Wave spectrum analysis is based on the composition waves analysis method, which determines the distribution of wave energy concerning the composition waves of each frequency (Wan et al., 2020). The wave spectrum reflects the distribution characteristics of each frequency component wave, which contains comprehensive information on the wave motions. Analysis of the wave spectrum of Typhoon Muifa, as simulated using the three wind field models, shows the influence of the asymmetric wind field on the energy distribution inside the waves. The simulated value of the wave spectrum of each wind field model during the period of Typhoon Muifa passing the QF207 buoy station is shown in Figure 10. The comparison results of the wave spectral density peak of each wind field model are shown in Table 3.
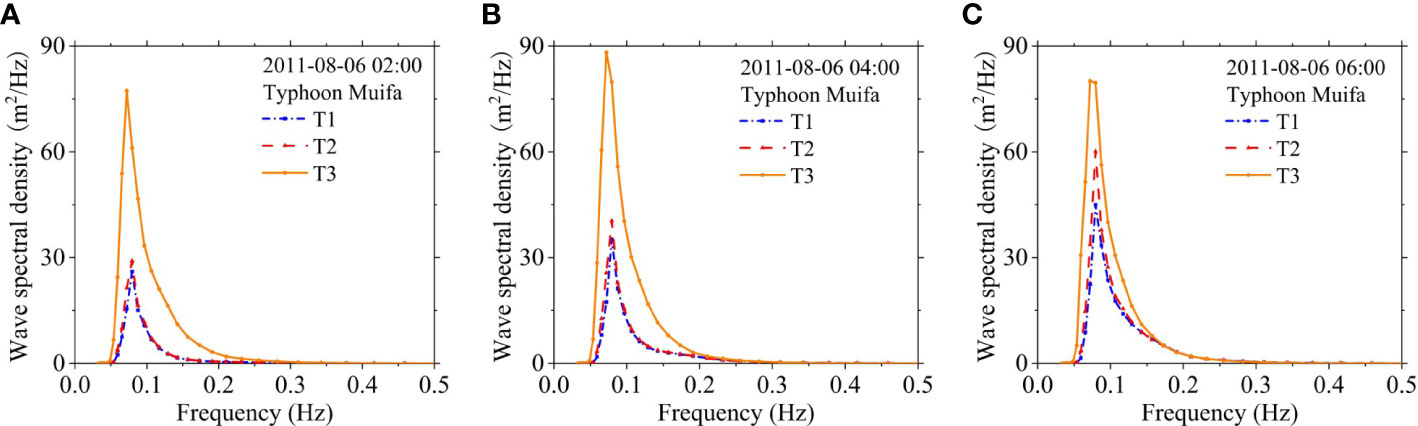
Figure 10 Wave spectrum during Typhoon Muifa passing QF207 buoy station: (A) 0200 UTC 6 August 2011, (B) 0400 UTC 6 August 2011, (C) 0600 UTC 6 August 2011.
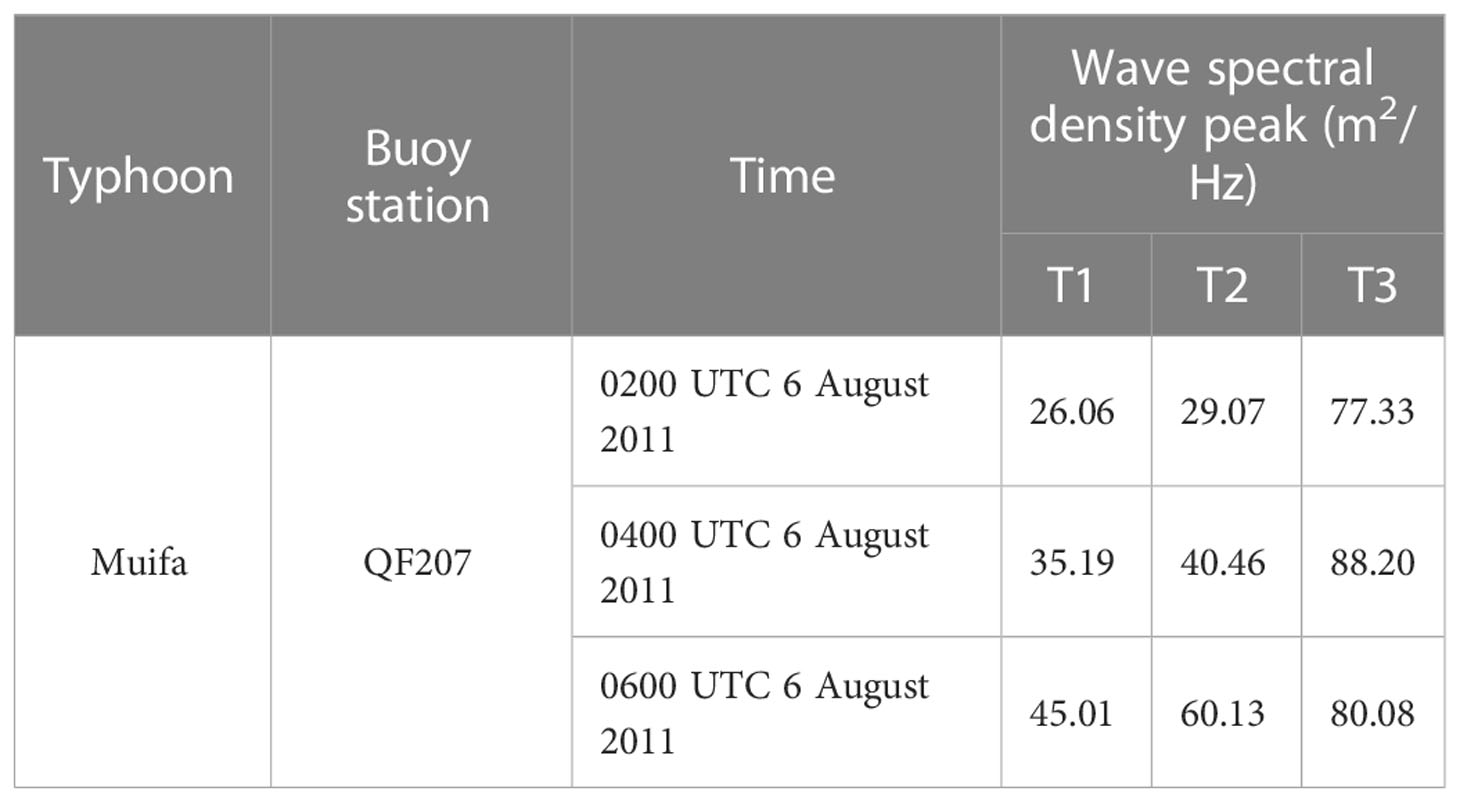
Table 3 Comparison of wave spectral density of various wind fields during Typhoon Muifa passing by the buoy station.
It can be seen from Figure 10 and Table 3 that during the typhoon passage through the buoy station, the wave spectral density simulated by each scheme shows a trend of first increasing and then decreasing with the increase of wave spectral frequency. The wave spectral density is close to zero when the frequency is less than 0.05 Hz and more than 0.25 Hz. At the same time, the simulation results of the three wind field models show that the wave spectral density simulation effect of the asymmetric wind field model at the QF207 buoy station is significantly different from the other two wind field models. The wave spectral density peak simulated using the asymmetric wind field model is the largest, and the area enclosed by the wave spectral density curve and the abscissa is also the largest. This shows that the total energy of the waves simulated using the asymmetric wind field model is larger than that of the other two wind field models, and the intensity of the generated typhoon waves is also greater.
4.4 Potential applications
The asymmetric wind field model can improve the accuracy of post-forecasting of typhoon that moved through the East China Sea and more accurately estimate the typhoon waves and wave fields caused by it. At the same time, simulation of accurate typhoon waves will help to obtain a wealth of ocean wave databases and provide a reference for the construction of ocean engineering and the development of coastal resources.
In addition, the actual typhoon wind field is also affected by the peripheral environmental factors. In the future, methods for integrating the background wind and asymmetric wind field model can be considered to discuss and analyze the typhoon wind field and the wave field caused by it.
5 Conclusions
Through the statistical analysis of the wind radii issued by the Joint Typhoon Warning Center, this study investigated the asymmetric characteristics of a typhoon. Based on the third-generation ocean wave model SWAN, this study constructs three numerical calculation models for typhoon waves in the East China Sea based on three wind field models, the circular symmetric wind field model, the superimposed wind field model, and the asymmetric wind field model. These three models are applied to Typhoon Muifa to explore the difference in the simulation effects of each model and the accuracy of wave simulation, as well as the influence of asymmetric wind fields on the distribution characteristics of typhoon waves.
The asymmetric wind field model predicts the wind speed and wave change processes in time and space more reasonably, as the simulation results are more consistent with the measured results. This is especially the case regarding the simulation of wind speed near the typhoon’s center, where the simulation results of the asymmetric wind field model are significantly better than the circular symmetrical wind field model and the superimposed wind field model. Furthermore, the asymmetric field model has a higher calculation accuracy for peak wave heights and presents a more accurate simulation of asymmetric features at the typhoon’s center. It is evident that the asymmetric wind field model most accurately reflects the actual wind speed and wave characteristics.
The influence of the asymmetric wind field model on the wave field is mainly reflected by the following findings. 1) The asymmetry of the wave field simulated using the asymmetric wind field model is obviously more potent than that of the other two wind field models; 2) its asymmetric characteristics are mainly reflected in wave heights on the right side of the typhoon’s path that are significantly higher than that on the left side of the movement path; 3) at the same time, the peak value of the wave spectrum density simulated using the asymmetric wind field model is the largest, and the total energy and intensity of the simulated waves are obviously larger than the other two wind field models. The asymmetric wind field can effectively simulate the asymmetric characteristics of the energy distribution within the waves.
This study makes the case that the actual wind fields have typical asymmetric characteristics, and the asymmetric wind field model can more accurately simulate the asymmetric characteristics of typhoons that moved through the East China Sea.
Data availability statement
The original contributions presented in the study are included in the article/supplementary material. Further inquiries can be directed to the corresponding authors.
Author contributions
YW wrote the original manuscript. SD contributed to conception and design of the study. YF revised the manuscript. SY provided project administration and funding acquisition. WD analyzed the results. All authors contributed to the manuscript and approved the submitted version.
Funding
This work was supported by the Open Research Fund of State Key Laboratory of Estuarine and Coastal Research (SKLEC-KF202111), State Key Program of National Natural Science Foundation of China (NO. U2243207), National Natural Science Foundation of China (No. 52079056), Science and Technology Development Fund of the Yellow River Institute of Hydraulic Research (No. 202210) and Basic Scientific Research of YRIHR (HKY-JBYW-2020-06, HKY-JBYW-2020-11, HKY-JBYW-2022-05).
Conflict of interest
The authors declare that the research was conducted in the absence of any commercial or financial relationships that could be construed as a potential conflict of interest.
Publisher’s note
All claims expressed in this article are solely those of the authors and do not necessarily represent those of their affiliated organizations, or those of the publisher, the editors and the reviewers. Any product that may be evaluated in this article, or claim that may be made by its manufacturer, is not guaranteed or endorsed by the publisher.
References
Akpinar A., Bingolbali B., van Vledder G. P. (2016). Wind and wave characteristics in the black Sea based on the SWAN wave model forced with the CFSR winds. Ocean Engineering. 126 (1), 276–298. doi: 10.1016/j.oceaneng.2016.09.026
Ambinakudige S., Khanal S. (2010). Assessment of impacts of hurricane Katrina on net primary productivity in Mississippi. Earth Interact. 14 (14), 1–12. doi: 10.1175/2010EI292.1
Bell K., Ray P. S. (2004). North Atlantic hurricanes 1977-99: surface hurricane-force wind radii. Monthly Weather Review. 132 (5), 1167–1189. doi: 10.1175/1520-0493(2004)1322.0.CO;2
Booij N., Ris R. C., Holthuijsen L. H. (1999). A third-generation wave model for coastal regions 1. model description and validation. J. Geophysical Res. 104 (C4), 7649–7666. doi: 10.1029/98JC02622
Chen Y. R., Chen L. H., Zhang H., Gong W. P. (2019). Effects of wave-current interaction on the pearl iver estuary during typhoon hato. Estuar. Coast. Shelf Science. 228 (15), 1–15. doi: 10.1016/j.ecss.2019.106364
Cui W., Caracoglia L. (2016). Exploring hurricane wind speed along US Atlantic coast in warming climate and effects on predictions of structural damage and intervention costs. Eng. Structures 122, 209–225. doi: 10.1016/j.engstruct.2016.05.003
Dai Z. J., Fagherazzi S., Gao S., Mei X. F., Ge Z. P., Wei W. (2018). Scaling properties of estuarine beaches. Mar. Geology. 404, 130–136. doi: 10.1016/j.margeo.2018.07.011
Fang W. H., Lin W. (2013). A review on typhoon wind field modeling for disaster risk assessment. Prog. Geography. 32 (6), 852–867. doi: 10.11820/dlkxjz.2013.06.002
Ge Z. P., Dai Z. J., Pang W. H., Li S. S., Wei W., Mei X. F., et al. (2017). LIDAR-based detection of the post-typhoon recovery of a meso-macro-tidal beach in the beibu gulf, China. Mar. Geology. 391, 127–143. doi: 10.1016/j.margeo.2017.08.008
Guo R., Cao X. G., Weng Y. Y. (2016). An analysis on tropical cyclones’ source region and interdecadal variation feature in Western north pacific (WNP). Climate Change Res. Letters. 05 (4), 209–216. doi: 10.12677/CCRL.2016.54026
Holland G. J. (1980). An analytic model of the wind and pressure profiles in hurricanes. Monthly Weather Review. 108 (8), 1212–1218. doi: 10.1175/1520-0493(1980)108<1212:AAMOTW>2.0.CO;2
Jelesnianski C. P. (1965). Numerical calculation of storm tides induced by a tropical storm impinging on a continental shelf. Monthly Weather Review. 93 (6), 83–88. doi: 10.1175/1520-0493(1993)0932.3.CO;2
Jelesnianski C. P. (1966). Numerical computations of storm surges without bottom stress. Monthly Weather Review. 94 (6), 740–752. doi: 10.1175/1520-0493(1966)094<0379:ncossw>2.3.co;2
Jiang Z. H., Hua F., Qu P. (2008). A new scheme for adjusting the tropical cyclone parameters. Adv. Mar. Science. 26 (1), 1–7. doi: 10.3969/j.issn.1671-6647.2008.01.001
Kato F. (2005). Study on risk assessment of storm surge flood (Tokyo: National Institute for Land and Infrastructure Management).
Kutupoğlu V., Çakmak R. E., Akpinar A., van Vledder G. P. (2018). Setup and evaluation of a SWAN wind wave model for the Sea of marmara. Ocean Engineering. 165, 450–464. doi: 10.1016/j.oceaneng.2018.07.053
Lee C. Y., Chen S. S. (2012). Symmetric and asymmetric structures of hurricane boundary layer in coupled atmosphere-wave-ocean models and observations. J. Atmospheric ences. 69 (12), 3576–3594. doi: 10.1175/jas-d-12-046.1
Lin N., Chavas D. (2012). On hurricane parametric wind and applications in storm surge modeling. J. Geophysical Res. Atmospheres 117, 1–19. doi: 10.1029/2011JD017126
Lin W., Fang W. H. (2013). Regional characteristics of Holland b parameter in typhoon wind field model for Northwest pacific. Trop. Geogr. 33 (2), 124–132. doi: 10.13284/j.cnki.rddl.002331
Li Y., Zhang C., Song J. C., Chi S. H., Zhao S. H., Qi H. S., et al. (2022). Tide-modulated wave characteristics and breaking regimes in the intertidal zone of a dissipative beach. Ocean Engineering. 266, 113055. doi: 10.1016/j.oceaneng.2022.113055
Ma B. B., Dai Z. J., Pang W. H., Ge Z. P., Li S. S., Mei X. F., et al. (2019). Dramatic typhoon-induced variability in the grain size characteristics of sediments at a meso-macrotidal beach. Cont Shelf Res. 191, 1–9. doi: 10.1016/j.csr.2019.104006
Mao M. H., van der Westhuysen A. J., Xia M., Schwab D. J., Chawla A. (2016). Modeling wind waves from deep to shallow waters in lake Michigan using unstructured SWAN. J. Geophysical Research: Oceans. 121 (6), 1–30. doi: 10.1002/2015JC011340
Miyamoto Y., Satoh M., Tomita H., Oouchi K., Yamada Y., Kodama C., et al. (2014). Gradient wind balance in tropical cyclones in high-resolution global experiments. Monthly Weather Review. 142 (5), 1908–1926. doi: 10.1175/MWR-D-13-00115.1
Miyazaki M. (1961). Theoretical investigations of typhoon surges along the Japanese coast. Oceanographical Magazine. 13 (2), 103–118. doi: 10.1016/0022-3115(71)90106-1
Myers V. A. (1954). Characteristics of united states hurricanes pertinent to levee design for lake Okeechobee, Florida. Hydrometeorol.rep.u.s.weather Bur. 32, 38–50.
Nikishova A., Kalyuzhnaya A., Boukhanovsky A., Hoekstra A. (2017). Uncertainty quantification and sensitivity analysis applied to the wind wave model SWAN. Environ. Model. Software 95, 344–357. doi: 10.1016/j.envsoft.2017.06.030
Olfateh M., Callaghan D. P., Nielsen P., Baldock T. E. (2017). Tropical cyclone wind field asymmetry-development and evaluation of a new parametric model. J. Geophysical Res. 122 (1), 458–469. doi: 10.1002/2016jc012237
Ou S. H., Liau J. M., Hsu T. W., Tzang S. Y. (2002). Simulating typhoon waves by SWAN wave model in coastal waters of Taiwan. Ocean Engineering. 29 (8), 947–971. doi: 10.1016/S0029-8018(01)00049-X
Pan Y., Chen Y. P., Xia J., Ding X. L. (2016). Improvement of wind field hind casts for tropical cyclones. Water Sci. Engineering. 9 (1), 58–66. doi: 10.1016/j.wse.2016.02.002
Pan Y., Yin S., Chen Y. P., Yang Y. B., Xu C. Y., Xu Z. S. (2022). An experimental study on the evolution of a submerged berm under the effects of regular waves in low-energy conditions. Coast. Engineering. 176, 104169. doi: 10.1016/j.coastaleng.2022.104169
Rogers W. E., Kaihatu J. M., Hsu L., Jensen R. E., Dykes J. D., Holland K. T. (2007). Forecasting and hindcasting waves with the SWAN model in the southern California bight. Coast. Engineering. 54 (1), 1–15. doi: 10.1016/j.coastaleng.2006.06.011
Rogers W. E., Wang P. A., Wang D. W. (2003). Investigation of wave growth and decay in the SWAN model: three regional-scale applications. J. Phys. Oceanogr. 33 (2), 366–389. doi: 10.1175/1520-0485(2003)0332.0.CO;2
Shen X. W., Chen G. P., Yan S. C., Xu Y. F., Zhou Y. (2016). Offshore wave parameter analysis of different return periods under the effect of combined wind field. Mar. Forecasts. 33 (5), 41–47. doi: 10.11737/j.issn.1003-0239.2016.05.005
Tajima Y., Gunasekara K. H., Shimozono T., Cruz E. C. (2016). Study on locally varying inundation characteristics induced by super typhoon haiyan. part 1: dynamic behavior of storm surge and waves around San Pedro bay. Coast. Eng. J. 58 (1), 26–54. doi: 10.1142/S0578563416400027
Tajima Y., Shimozono T., Gunasekara K. H., Cruz E. C. (2016). Study on locally varying inundation characteristics induced by super typhoon haiyan. part 2: deformation of storm waves on the beach with fringing reef along the east coast of Eastern samar. Coast. Eng. J. 58 (1), 55–78. doi: 10.1142/S0578563416400039
Ueno T. (1981). Numerical computations of the storm surges in tosa bay. J. Oceanogr. 37 (2), 61–73. doi: 10.1007/bf02072559
Vickery P. J., Wadhera D. (2008). Statistical models of Holland pressure profile parameter and radius to maximum winds of hurricanes from flight-level pressure and h*wind data. J. Appl. Meteorol. Climatol. 47 (10), 2497–2517. doi: 10.1175/2008JAMC1837.1
Vieira F., Cavalcante G., Campos E. (2020). Analysis of wave climate and trends in a semienclosed basin (Persian gulf) using a validated SWAN model. Ocean Engineering. 196 (15), 1–12. doi: 10.1016/j.oceaneng.2019.106821
Walsh K. J. E., Camargo S. J., Knutson T. R., Kossin J., Patricola C. (2019). Tropical cyclones and climate change. Trop. Cyclone Res. Review. 8 (4), 240–250. doi: 10.1016/j.tcrr.2020.01.004
Walsh K. J. E., Mcbride J. L., Klotzbach P. J., Balachandran S., Sugi M. (2016). Tropical cyclones and climate change. Wiley Interdiscip. Reviews: Climate Change 7 (1), 65–89. doi: 10.1002/wcc.371
Wang L. Q., Zhang Z. Z., Liang B. C., Lee D. Y., Luo S. Y. (2020). An efficient method for simulating typhoon waves based on a modified Holland vortex model. J. Mar. Sci. Engineering. 8 (3), 177–197. doi: 10.3390/jmse8030177
Wan Y., Wan L., Dai Y. S. (2020). Ocean wave spectrum inversion method and its sea trial experimental verification based on RADARSAT-2 SAR data. Res. Explor. Laboratory 39 (07), 16–19+27.
Willoughby H. E., Rahn M. E. (2004). Parametric representation of the primary hurricane vortex. part I: observations and evaluation of the holland (1980) model. Monthly Weather Review. 132 (12), 3033–3048. doi: 10.1175/MWR2831.1
Wu Z. Y., Chen J., Jiang C. B., Liu X. J., Deng B., Qu K., et al. (2020). Numerical investigation of typhoon kai-tak 1213) using a mesoscale coupled WRF-ROMS model. part II: wave effects. Ocean Engineering. 196 (15), 1–14. doi: 10.1016/j.oceaneng.2019.106805
Wu Z. Y., Jiang C. B., Deng B., Long Y. N., Qu K., Liu X. J. (2019). Numerical investigation of typhoon kai-tak 1213) using a mesoscale coupled WRF-ROMS model. Ocean Engineering. 175 (1), 1–15. doi: 10.1016/j.oceaneng.2019.01.053
Xie L., Bao S. W., Pietrafesa L. J., Foley K., Fuentes M. (2006). A real-time hurricane surface wind forecasting model: Formulation and verification. Monthly Weather Review. 134 (5), 1355–1370. doi: 10.1175/MWR3126.1
Yoshizumi S. (1968). On the asymmetry of wind distribution in the lower layer in typhoon. J. Meteorological Soc. Japan 46 (3), 153–159. doi: 10.2151/jmsj1965.46.3_153
Keywords: Typhoon Muifa, wind model, typhoon waves, asymmetry, SWAN model, East China Sea
Citation: Wu Y, Dou S, Fan Y, Yu S and Dai W (2023) Research on the influential characteristics of asymmetric wind fields on typhoon waves. Front. Mar. Sci. 10:1113494. doi: 10.3389/fmars.2023.1113494
Received: 01 December 2022; Accepted: 09 January 2023;
Published: 24 January 2023.
Edited by:
Yi Pan, Hohai University, ChinaCopyright © 2023 Wu, Dou, Fan, Yu and Dai. This is an open-access article distributed under the terms of the Creative Commons Attribution License (CC BY). The use, distribution or reproduction in other forums is permitted, provided the original author(s) and the copyright owner(s) are credited and that the original publication in this journal is cited, in accordance with accepted academic practice. No use, distribution or reproduction is permitted which does not comply with these terms.
*Correspondence: Shentang Dou, ZG91c2hlbnRhbmdAMTI2LmNvbQ==; Weiqi Dai, dmlja2V5X2hodUAxNjMuY29t