- Faculty of Coastal and Offshore Engineering, Hanoi University of Civil Engineering, Hanoi, Vietnam
This paper presents a laboratory study to investigate the effects of bottom roughness on wave transmission across a submerged coral reef that has a steep fore-reef slope. Experimented models were carried out in wave flumes for four different bed roughness levels: including a smooth bed and three roughness heights. Our investigations showed that there is a significant dissipation of energy in short-period waves (SS-waves), owing to bottom friction, compared with that of infra-gravity waves (IG-waves). In addition, the study found that the IG-wave heights are increased slightly as waves propagate shoreward from the reef-edge surfzone, indicating that a significant portion of energy was transferred from SS-waves to IG-waves. Empirical formulae of wave energy dissipation due to bottom friction and non-linear transfer of energy among the SS- and IG-waves have been derived; these allow for the straightforward determination of wave heights and wave periods on the submerged reef. These local wave parameters can be used to design offshore structures on submerged coral reefs.
Introduction
The specific difference between the wave hydrodynamic regime on a flat reef in comparison with that on a beach is that the breaking waves are caused by the sudden change of the bathymetry of the submerged reef from deep water to shallow water. When propagating across the shallow waters of a steep submerged coral reef, the waves will transform because of the influence of effects such as triad interaction, breaking waves, and bottom friction. After breaking on the fore-shore of a submerged reef, the wave can become an asymmetrical discontinuous waveform. In particular, there is the formation of long waves or infra-gravity waves (hereinafter denoted IG), which is generated by the interaction of wave groups (Battjes et al., 2004) and is mainly due to fluctuations in the breaking point on the reef (Baldock, 2012). IG-waves, after forming and propagating on the submerged reefs, can continue to develop owing to non-linear wave interactions (Nwogu and Demirbilek, 2010; Pomeroy et al., 2012).
On a shallow reef shelf with a rough bottom (coral), the energy dissipated by bottom friction is one of the main components of the total wave energy consumption, reducing the wave height when propagating across the submerged coral reef. The interaction between the coral rough bottom and the current causes entanglement stress and wave energy dissipation in the turbulent boundary layer (Nielsen, 1992); thus, the calculation and determination of wave energy dissipation due to friction of the bottom can be considered in relation to the turbulent boundary layer.
It is difficult to measure the shear stress at the boundary of the turbulent layer, but the energy dissipation due to bottom friction can be estimated through the analysis of the propagation energy balance: loss of flux wave per unit length in the direction of wave propagation is equal to the total wave energy dissipation over that segment (Lowe et al., 2005a; Buckley et al., 2016).
Studies on spectral wave energy dissipation due to bottom friction on atolls (Madsen et al., 1998; Lowe et al., 2005a; Lowe et al., 2005b) show that the wave energy dissipation due to bottom friction is different for different wave frequencies. In general, the wave energy dissipated by bottom friction is greater in the lower frequency range than in the higher frequency range. The coefficient of friction of short-period waves (SS-waves) is greater than that of IG-waves. The coefficient of friction of SS-waves is greater than that of IG-waves. The same happens when we separate the energy dissipated by the bottom friction of SS-waves and that of IG-waves.
Tuan and Cuong (2019a; 2019b) carried out wave flume experiments to describe the change of wave statistical characteristics and the process of wave propagation across the submerged reef for the smooth bottom cases, ignoring the effects of bottom friction.
It is clear that studies on the effect of bottom roughness on wave propagation through submerged reefs are quite limited. Lowe et al (2005a; 2005b) studied the effects of wave propagation on submerged reefs with canopies with a cylindrical texture, but their simulations were not close to the actual research prototype of this paper. Madsen et al. (1998) studied wave attenuation due to bottom friction, but this study was not representative of submerged coral reefs. Buckley et al. (2016) studied waves on fringing reefs with one roughness, and the combination of very low water levels (less than 2 m) with the size of the cubes (simulating a rough bottom), which were quite large compared with the water depth, resulted in the coming wave having a small wave height and large period, whereas the wave energy dissipation was greatly influenced by the wave frequency. Yu Yao et al. (2021) studied the waves propagating to the fringing reefs with roughness on the top of the reef only (the breaking wave area).
This study aimed to overcome the limitations of previous studies, and focused on determining the influence of bottom roughness on wave energy dissipation and wave height attenuation when a wave is propagating through a submerged coral reef. This study performed many simulation scenarios of coral bottoms similar to the ones in the sea of Viet Nam (four simulation cases): a rough coral bottom was simulated on the entire surface of a submerged coral reef. The study was conducted in different water depths, from 4 m to 8 m, appropriate to the specific conditions in Viet Nam. The results of this study will contribute to filling in the gaps in studies of wave propagation through submerged coral reefs.
Methodology
Physical model setup
The physical model experiments were carried out in the Dutch wave flume of the hydraulic laboratory at Thuyloi University in Hanoi, Viet Nam. The wave flume is 45 m long with a working section 1.0 m wide and 1.2 m high. The piston-type wave maker is equipped with an Active Reflection Compensation (ARC, Deltares) that enables the suppression of the reflected wave from the riprap wave absorber. The wave maker is capable of generating both regular and random waves with a maximum wave height of 0.30 m and a peak period of 3.0 s. The capacitive wave probes are used to measure water surface fluctuations at a sampling frequency up to 100 Hz with high accuracy (error of ±0.1 mm).
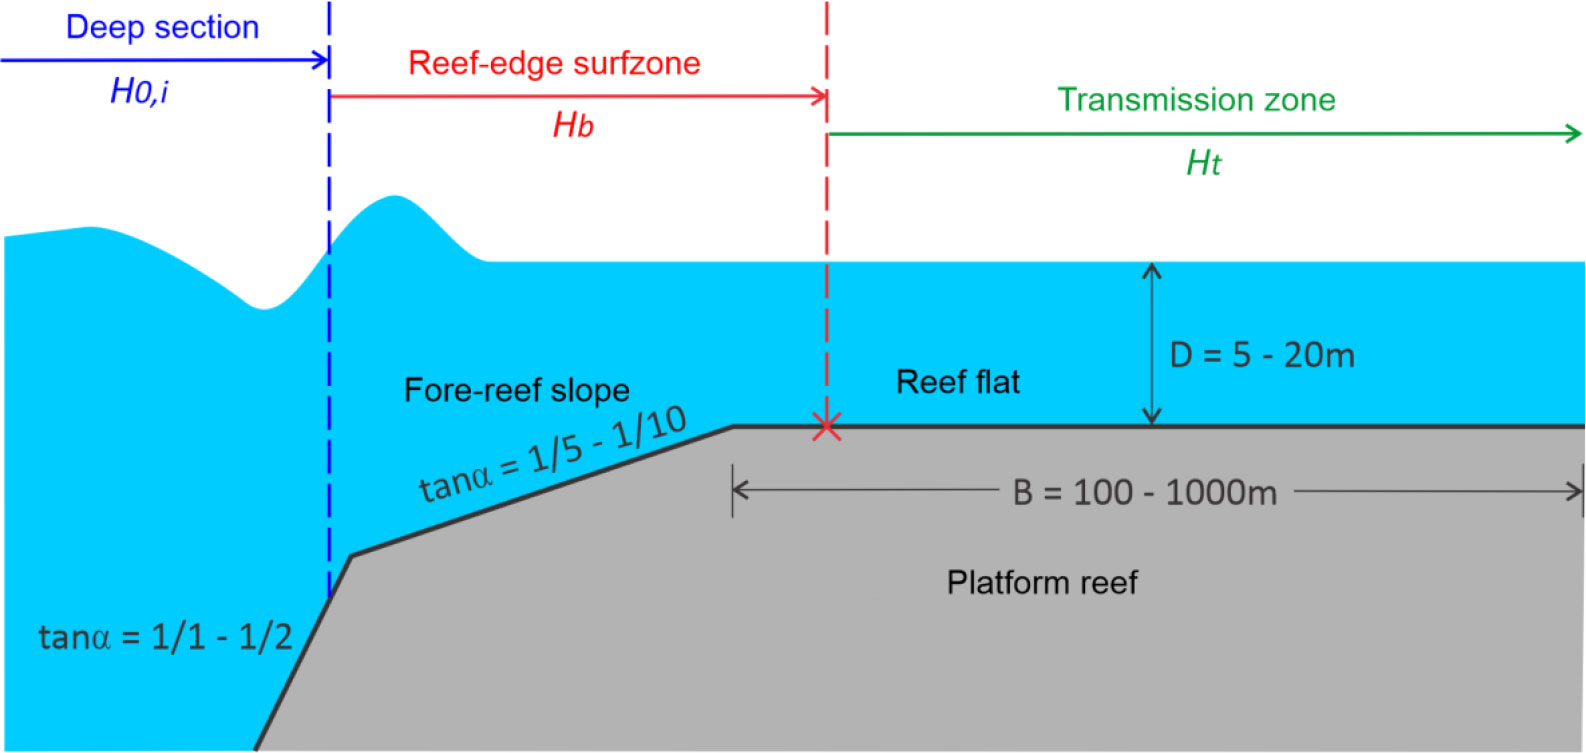
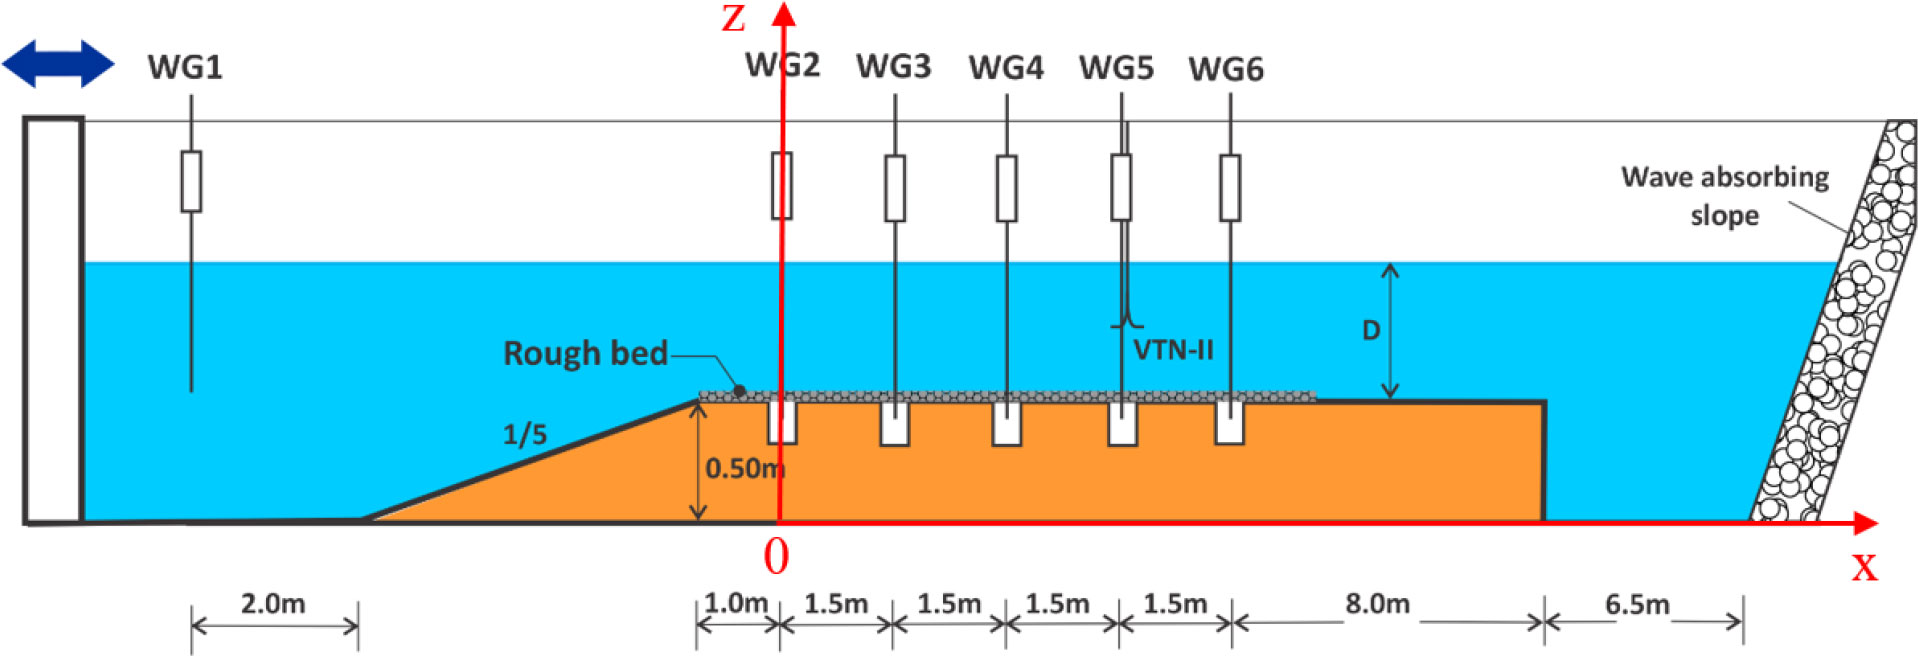
The geometrical parameters of the submerged reef, according to bathymetry surveys, in the original condition are summarized in Figure 1. The cross-section of the submerged reef in the direction of wave propagation had a complex fore-reef slope. The lower fore-reef slope, which ranged from the seabed to the –40 m contour line, had a steep slope of about 1/1 to 1/2. The fore-reef slope between the –40 m and –15 m contour lines had a gentler slope, ranging from 1/5 to 1/15, where the interactions between waves and submerged reef occurred. The surface of the submerged coral reef was relatively flat. The width of the reef varied from hundreds of meters to several kilometers. The water depth on the reef ranged from 5 m to 20 m (Dinh et al., 2014). Therefore, the breaking wave area was on the fore-reef slope during storms (see Figure 1). The corals were distributed on the reef flat with an average absolute roughness (average height) of r < 0.50 m (Dinh et al., 2014). Based on the characteristics of the submerged reef in its original condition, the capability of the wave flume, and the experimental requirements, the physical model length scale of NL = 40 was determined following Froude’s scale law. The time scale of the model was therefore NT = √NL = 6.32. The general layout for the experiments is shown in Figure 2, in which the model of a submerged reef had a height of 0.50 m to ensure that the incoming waves were deep water waves (unbroken waves). According to previous studies (Tuan and Cuong, 2019a), the slope of a fore-reef slope, within the consideration range i = tanα = 1/5–1/10, has a negligible influence on the regime wave hydrodynamics on the submerged reef. Therefore, this study considered only a representative seaward slope i = 1/5. The width of the reef flat was B = 15.0 m (corresponding to 600 m in prototype) and was covered by a smooth concrete mortar. The rough bed was made separately in the form of plates and fixed onto the reef flat within 8 m of the outer edge of the reef. The wave propagation experiment across the submerged reef was performed with 04 bottom models with different roughness levels (see Table 1). At the end of the flume, there was a passive absorbing boundary of reflected waves, which was composed of a tangled rock roof with a gentle slope of 1/6. A high-definition (HD) video camera was arranged perpendicular to the flume wall at the top of the outer shelf to record the entire image of waves in the reef-edge surfzone for all experimental cases.
Note that it was not desirable in this study to replicate roughness conditions of the coral bed. At present, it is technically impossible to reliably describe the effect of the actual coral bed in scale models owing to viscous effects. With the aim of studying the effect of bottom roughness on across-reef wave propagation, the rough reef bed was introduced through schematizing different conditions roughness elements, as shown in Table 1. The rough bottom parameters in Table 1 include rk (roughness height), N (the density of roughness elements per unit area), lh and lv (the plane and vertical dimensions of rough element, respectively), and λf and λp (respectively the total front area and total plan area of rough elements per unit plan area), which were estimated as follows:
In order to achieve the research objectives, wave measurements on the submerged reef were divided into three areas: the deep water section, reef-edge surfzone (wave breaking area), and the wave propagation area (see Figure 1). Six capacitive wave gauges with an accuracy of ±1 mm were used to measure incident waves in deep water, breaking waves in the reef-edge surfzone, and propagation waves in the transmission zone. In this study, with the main objective of evaluating the effects of bottom roughness on wave propagation, the wave probes were arranged mainly behind the surfzone area (i.e., the transmission zone) on the rough bottom model section. For a further analysis of the effect of bottom friction, the bottom flow velocity was synchronously measured with the wave probe at position WG5 by a Vectrino-II 3-D flowmeter (Figure 2). Synchronous measurements of wave and velocity at WG5 were also used for the evaluation of wave reflection in accordance with the wave energy flux method by Sheremet et al. (2002). Figure 3 shows some snapshots taken during the physical model tests.

Figure 3 Snapshots of the physical models. (A) Wave propagating along the reef. (B) Wave breaking at the edge of the reef. (C) Crushed stone bottom model. (D) Simulated coral bottom model.
Test program
Tested waves
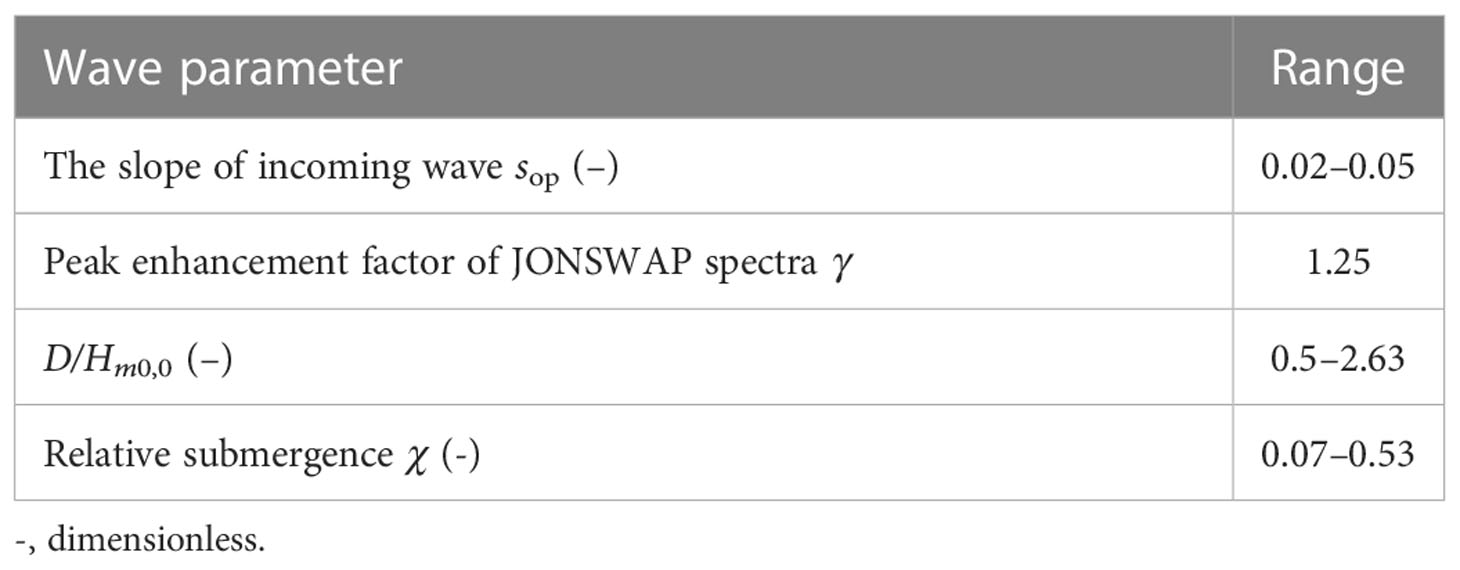
According to the statistical analysis of extreme waves by Vietsopetro and Hugro, the storm waves in the deepwater boundary of the study area had a significant wave height, Hm0, from 5.0 m to 8.0 m, and a peak wave period, Tp, from 8 s to 12 s, corresponding to a return period of 1 year to 100 years, respectively (Phung Dinh, 2010). Therefore, the tested significant wave height Hm0 of 0.08 m to 0.18 m and the peak wave period Tp of 1.1 s to 2.0 s have been used in this experimental study to cover almost all conditions that actually occur in this study area. The tested waves were the random waves with underlying JONSWAP spectrum (γ = 1.25). For each of the wave heights, the peak period was deduced with typical wave steepness values from 0.03 to 0.04. Table 2 presents the prototype and model wave parameters (Hm0 and Tp) used in this experimental study.
Water depth on the smooth reef D0
In principle, water depth, D0 (or submerged depth), of a smooth reef is considered as a vertical distance between the smooth reef bottom and the mean sea level, which includes both the tidal level and the storm surge height. The objective of this study was to investigate the effects of the reef bottom friction on the wave propagation; therefore, the shallow and/or intermediate water depth conditions were applied. Water depths on the smooth reef D0 of 0.10 m, 0.15 m, and 0.20 m were applied in this study (see Table 2).
There were 12 wave scenarios and 03 submerged depth scenarios in this study. Therefore, each model of the smooth or rough bottom needed 36 test cases applying three repeats. The total number of tests for all four tested models (one smooth bottom model and three rough bottom models) was therefore 144. In order to ensure completeness of the wave spectrum characteristics, the test running time in each case needed to be long enough to obtain at least 500 single waves. The combination of scenarios for the tested models is shown in Table 2.
Results and discussions
Across-shore wave propagation characteristics
In this section, we consider the behavior of waves as they propagate across the submerged reef with different bottom roughness.
First, it follows from wave reflection analyses that the bulk reflection coefficient at WG5 was less than 10% in all test cases, and thus wave reflection can be neglected in the determination of the incident wave height at locations WG2–WG6 on the reef flat.
Experimental results show that the further inside the reef, the more the energy of the IG-waves prevails over that of the SS-waves. The comparison of the results obtained in the cases of smooth bottom and rough bottom surfaces also shows that the bottom roughness has almost a negligible influence on the change of wave spectrum shape, but has a significant effect on the wave energy attenuation (wave height) when wave propagating across the reef, especially for SS-waves.
To analyze wave propagation across the submerged reef with different bottom roughness, this paper introduces the concept of the relative submergence of the reef χ (χ is a factor that represents relative submergence of the reef flat or relative reef shallowness), as follows (see Hofland et al., 2017; Tuan and Cuong, 2019a; Tuan and Cuong, 2019b):
where D is the submerged water depth of the reef, and Hm0,0 and sm0,0 are the wave height and wave slope in the deeper section in front of the submerged reef, respectively. The wave slope, sm0,0, was calculated based on the characteristic spectrum period Tm-1.0.
Note that, in the rough bottom case, the water depth on the reef needs to be adjusted depending on the characteristic geometrical dimensions of the coral bottom (Lowe et al., 2005b; Buckley et al., 2016):
The wave transmission coefficient at a wave gauge location (WGs2–6) on the reef can be estimated as:
where Hm0,i and Hm0,t are the incident and transmitted wave heights, respectively.
The relationship between the wave transmission coefficients (Kt, Kt-SS, and Kt-IG) and the relative submergence of the reef χ is shown in Figures 4–6 for the total waves, SS-waves, and IG-waves, respectively. The results show that the wave transmission coefficients (Kt, Kt-SS, and Kt-IG) increased with the increase in the relative submergence. Note that the coefficients Kt, Kt-SS, and Kt-IG are all equal to 1 at boundary location WG2 (at x = 1.0 m). Along the reef (from x = 2.5 m to x = 7 m), the transmission coefficient Kt for the total wave is markedly decreased, especially in the cases of the rough bottom with R1, R2, and R3 (Figures 4A–D). The effect of bottom friction on the wave transmission coefficient Kt-SS is most pronounced for the SS-waves (see Kt-SS in Figure 5). However, for the IG-wave, the transmission coefficient Kt-IG tends to increase (Kt-IG > 1.0) in areas inside the reef shelf (Figure 6). This is because of the development of the IG-wave on the transmission zone (behind the reef-edge surfzone) as a result of wave–wave non-linear interaction, which has converted a significant part of the energy of the SS-wave into the IG-wave. In addition, in the process of spreading through the reef, both the SS- and IG-waves’ energy are reduced owing to the influence of the bottom friction. If wave energy dissipation prevails over the wave energy conversion to the IG-wave, then the IG-wave height will be attenuated, as can be observed in Figure 6 at the submergence of about 0.25. In addition, in the process of propagation, part of the IG-wave energy can also be transferred to the SS-wave, depending on the relative submergence of the reef.
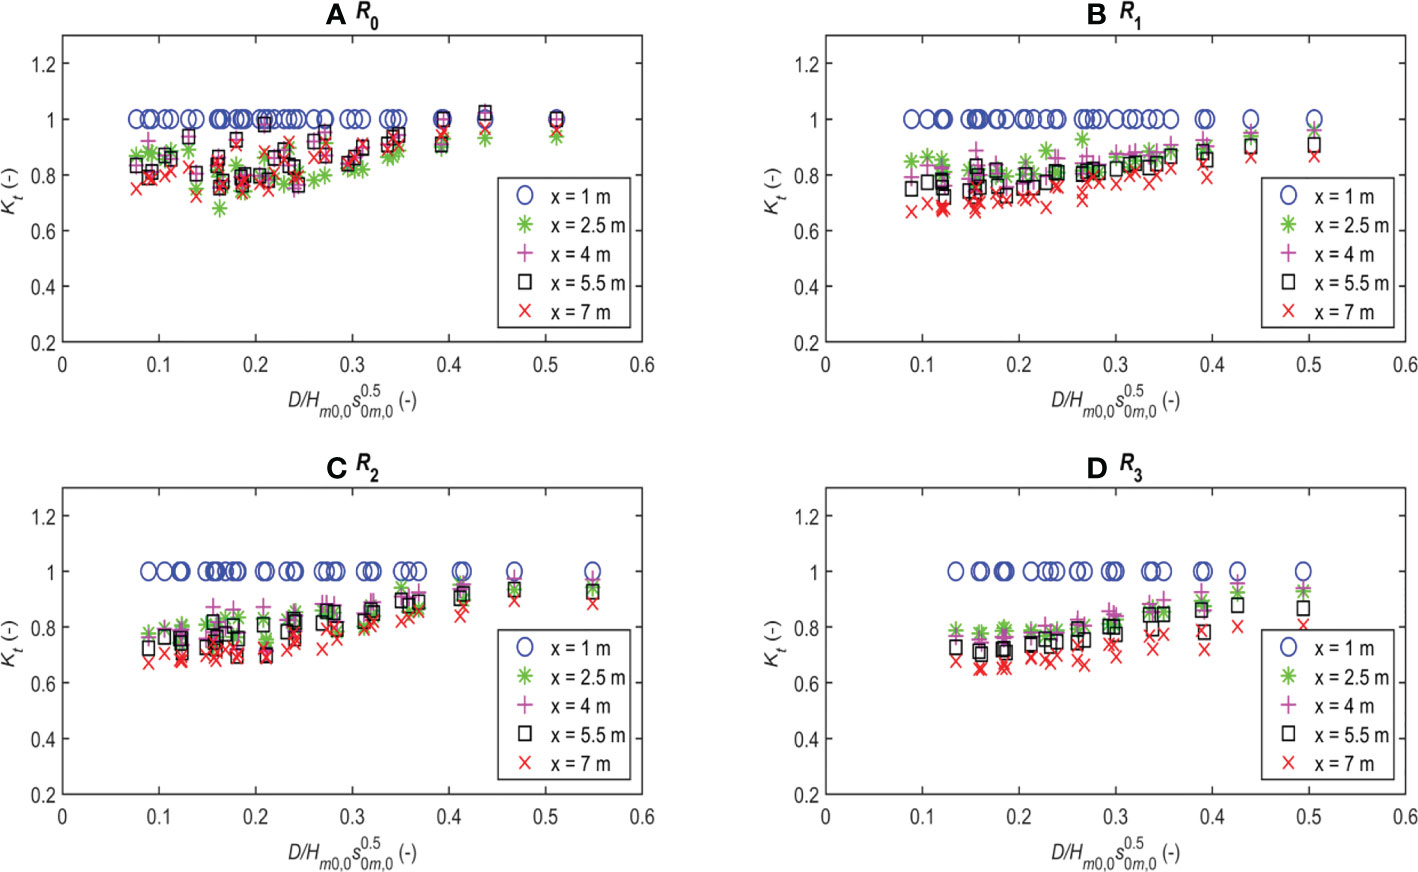
Figure 4 Transmission coefficient Kt versus relative submergence for total waves: (A) Smooth reef; (B) Crushed stone reef 1; (C) Crushed stone reef 2; (D) Simulated coral reef.
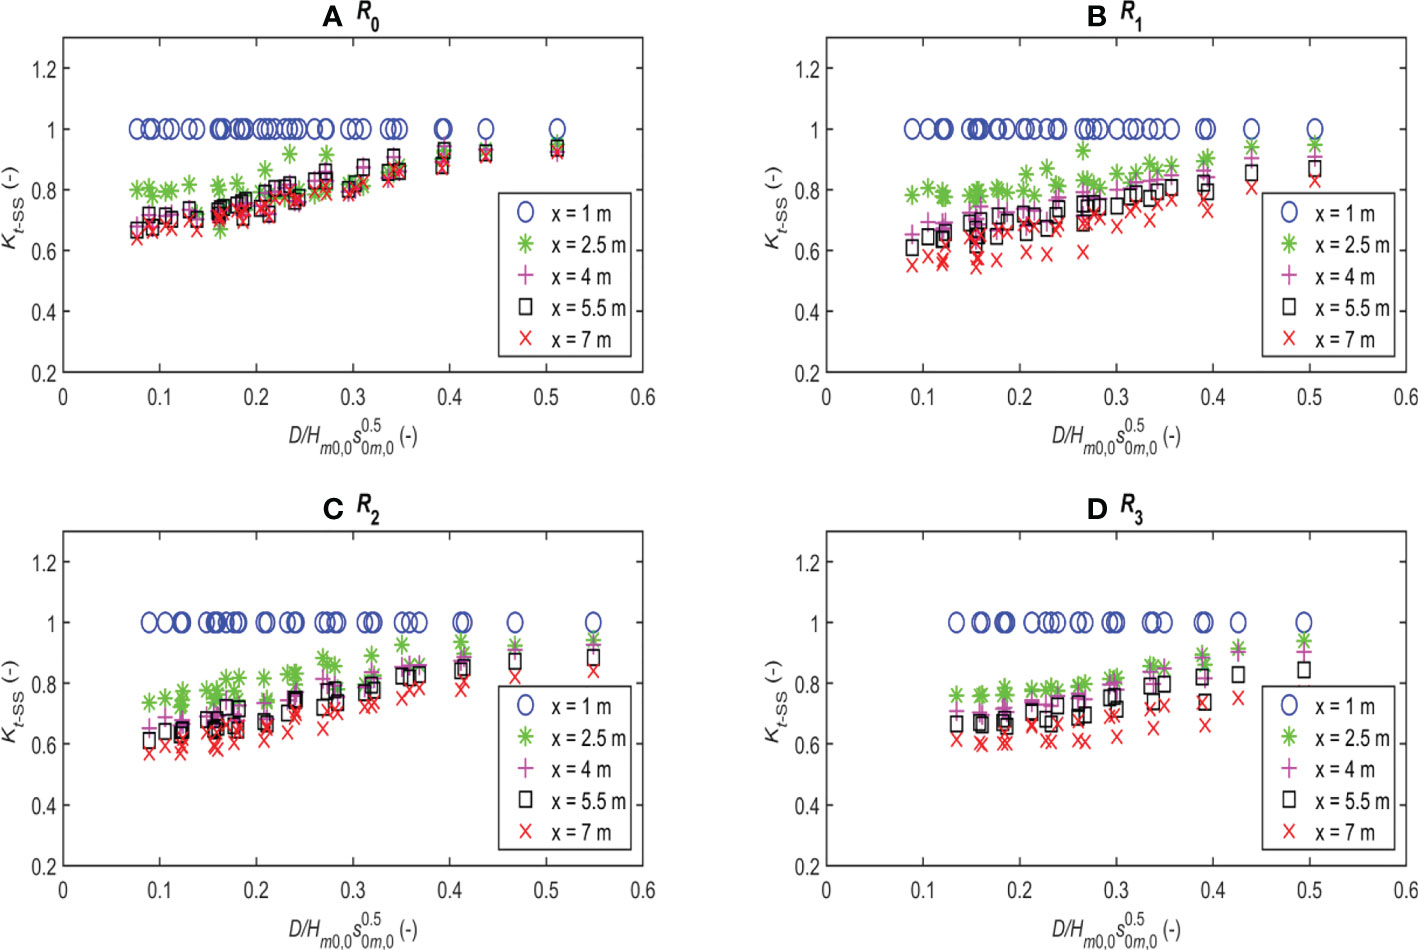
Figure 5 Transmission coefficient Kt-SS versus relative submergence for SS-waves: (A) Smooth reef; (B) Crushed stone reef 1; (C) Crushed stone reef 2; (D) Simulated coral reef.

Figure 6 Transmission coefficient Kt-IG versus relative submergence for IG-waves: (A) Smooth reef; (B) Crushed stone reef 1; (C) Crushed stone reef 2; (D) Simulated coral reef.
Figures 7, 8 show the variations in the wave transmission coefficients Kt-SS and Kt-IG with respect to the relative distance x/Lm-1,0-SS and x/Lm-1,0-IG for all bottom roughness cases. In these figures, Lm-1,0-SS and Lm-1,0-IG are the length of the SS- and IG-waves, respectively; note that x = 0 at WG2. It is shown that, along the wave propagation direction, the SS-wave transmission coefficient Kt-SS always decreases quickly, especially in the case of rough bottom R1, R2, and R3 (Figure 7). On the other hand, the transmission coefficient Kt-IG of the IG-wave increases slightly along the reef, depending on the non-linear wave–wave interaction and the energy exchange between the SS- and IG-waves, as well as the energy dissipation due to the bottom friction (Figure 8).
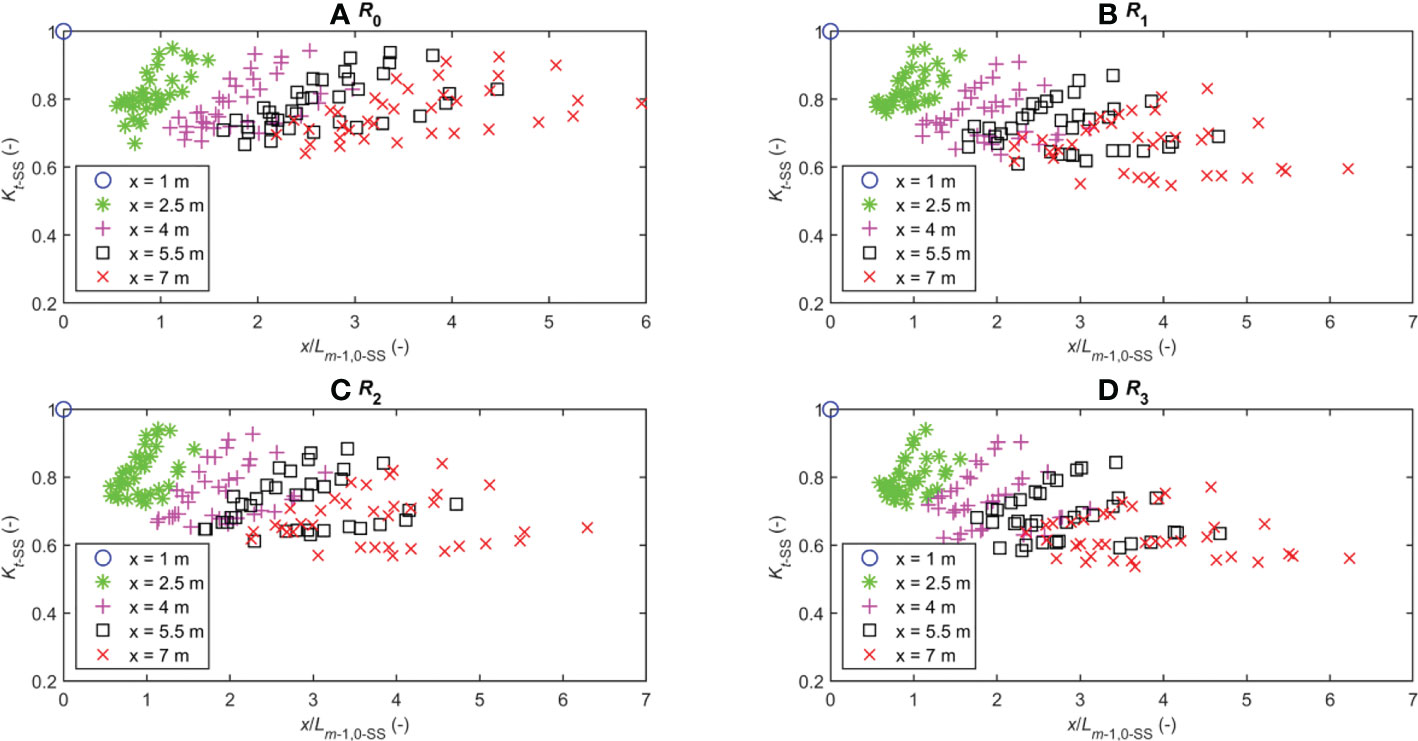
Figure 7 Variation in the wave transmission coefficient Kt-SS along the reef: (A) Smooth reef; (B) Crushed stone reef 1; (C) Crushed stone reef 2; (D) Simulated coral reef.

Figure 8 Variation in the wave transmission coefficient Kt-IG along the reef: (A) Smooth reef; (B) Crushed stone reef 1; (C) Crushed stone reef 2; (D) Simulated coral reef.
To analyze the energy exchange processes between the IG- and SS-waves, the equation of transformation of wave propagation energy at a location on the submerged reef is as follows:
in which F+ and F are the incoming and total across-shore wave energy fluxes, respectively; Db is the energy dissipation due to wave breaking (negative); Din is the possible non-linear transfer of energy between the SS- and IG-waves due to the wave–wave interaction (positive or negative); Df is the energy dissipated by the bottom friction (always negative); Fi and Fi+1 are the energy fluxes at two adjacent cross-shore locations i and i+1, respectively; and Δx = 1.5 m (see Figure 2).
In Equation (5), it is considered that ΔF+/Δx ≈ ΔF/Δx with an assumption that the reflected wave (seaward) varies insignificantly over short intervals of one to several Δx (Tuan and Cuong, 2019a). By applying Equation (5) separately to the SS- and IG-waves, the incoming wave energy fluxes are determined as follows:
where and are the incoming SS- and IG-wave energy fluxes, respectively; and are the total SS- and IG-wave energies (J/m2), respectively; Hrms-SS and Hrms-IG are the root-mean-square SS- and IG-wave heights, respectively (m); cg-SS and cg-IG are the SS- and IG-wave group velocities, respectively (m/s); and g is the gravity acceleration (m/s2).
The wave group velocity cg-SS of the SS-wave is defined as follows:
where cSS is the SS-wave celerity (m/s); Tm-1.0–0 is the characteristic wave spectral period at the deep water boundary in front of the reef (assuming that the variation of Tm-1,0 of the SS-waves is negligibly small across the reef), Lm-1,0 is the shallow water wave length based on Tm-1.0–0; and km is the wavenumber calculated based on the wave length Lm-1,0.
The wave group velocity cg-IG of the IG-waves can be estimated as follows:
in which cIG is the IG-wave celerity (m/s).
Using Equation (5) for the smooth bottom case (Df ≈ 0), and if Db = 0 (no more breaking waves), then the energy transference between the SS- and IG-waves can be determined as follows:
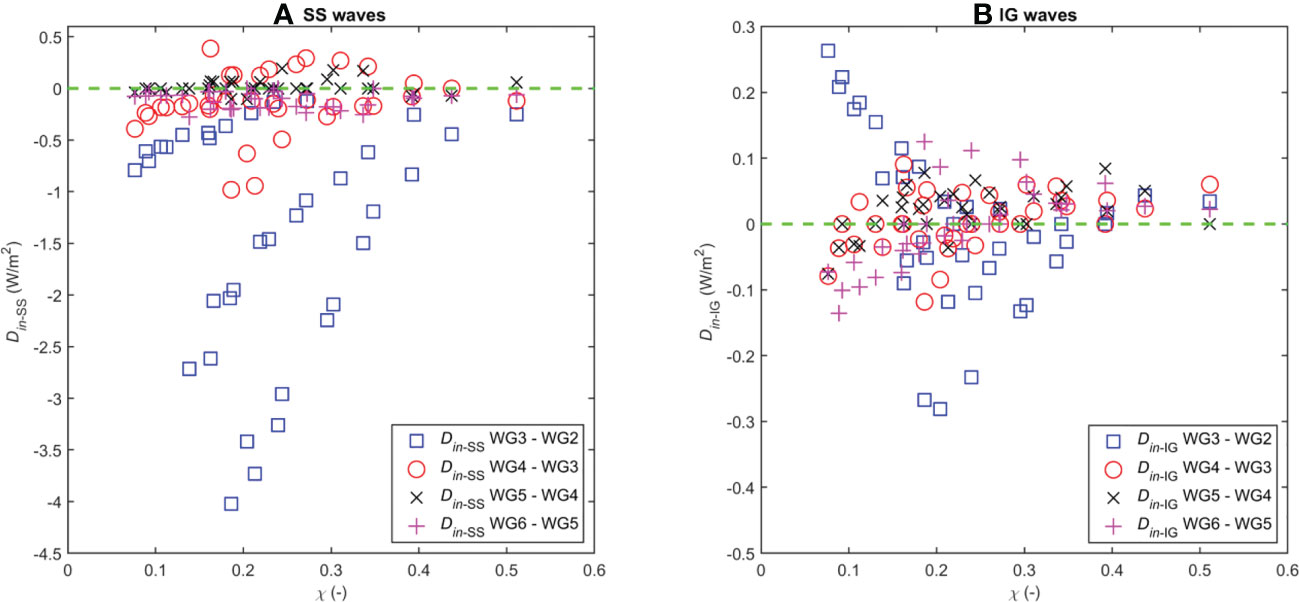
Figure 9 shows the experimental results of the relationship between the energy transferences (Din-SS and Din-IG in Equation (10)) and the relative reef submergence for the SS- and IG-waves in four sections: WG2–WG3, WG4–WG3, WG5–WG4, and WG6–WG5. For each type of wave considered here, if Din-SS > 0 and/or Din-IG > 0, then the wave receives the energy converted from the other wave type and vice versa. The SS-wave energy has a general tendency to be lost (Din-SS < 0), and this lost energy of the SS-wave has been converted to the IG-wave (Figure 9A). In contrast, the IG-wave mainly tends to receive the energy from the SS-wave during propagation (Din-IG > 0). However, the development of the IG-wave depends on the relative submergence of the reef χ. It can be seen that the energy of the IG-wave tends to shift strongly to the SS-wave in the range χ = 0.15–0.35, especially at χ ≈ 0.25 (see Figure 9). This result is similar to the one shown in Figure 6. In general, the SS-wave energy is mostly consumed in the section WG3–WG2 and, correspondingly, the IG-wave has primarily received the energy in this section. In addition, the significant difference in value between Din-SS and Din-IG in the WG3–WG2 section shows that the SS-wave continues to lose its energy owing to the wave breaking (i.e. Db > 0). In the next sections (WG4–WG3, WG5–WG4, and WG6–WG5), the changes in both the SS- and IG-waves are clearly reduced (Figure 9).
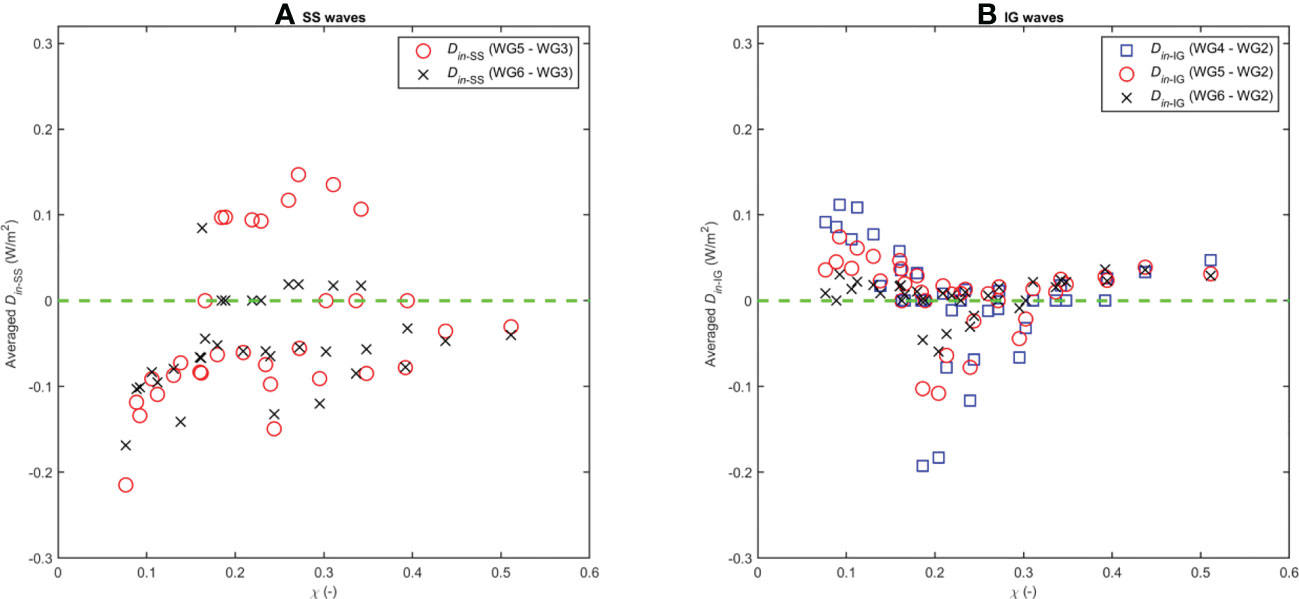
Figure 10 shows the relationship between the average energy dissipation determined by Equation (5) and the relative reef submergence χ for the SS-waves in sections WG5–WG3 (2Δx) and WG6–WG3 (3Δx), with WG3 as a base point (Figure 10A), and for the IG-waves on sections WG4–WG2 (2Δx), WG5–WG2 (3Δx), and WG6–WG2 (4Δx, with a base point at WG2 (Figure 10B). It can be seen that the magnitude of the average dissipated energies Din of the SS- and IG-wave is quite similar, and they tend to be symmetrical about the averaged Din-SS, which equals the averaged Din-IG = 0 axis (i.e. the averaged Din-SS ≈ the averaged (-Din-IG)). Assuming that the wave-to-wave energy conversion interaction between the SS- and IG-waves is not significantly influenced by the bottom friction (Herbers et al., 2000; Henderson and Bowen, 2002), these average dissipated energies Din-SS and Din-IG can be used for the smooth bottom case and Equation (5) can be applied for the rough bottom cases (R1, R2, and R3) to determine the wave energy dissipation rate of the SS- and IG-waves due to the bottom friction, as follows:
where and are the wave energy dissipation (or receipt) owing to the energy conversion interaction between the SS- and the IG-waves.
The wave energy dissipation rate of the SS- and IG-waves will be used to estimate the coefficient of energy dissipation due to friction in the next sections.
Wave energy dissipation due to bottom friction of the reef
In order to be able to build a method to calculate wave propagation across a submerged reef with bottom friction, the theoretical basis has been considered for the calculation of wave energy dissipation across the reef with large bottom roughness. The measurement results of wave energy dissipation due to friction will be evaluated and compared with results calculated using theoretical formulas. The calculated wave energy dissipation in the previous section was applied to estimate the wave energy dissipation coefficient based on the theoretical formulae. In the general case, the influence of the rough bottom on wave energy dissipation is mainly due to frictional and drag forces (ignoring the effect of inertia). However, for the submerged reef considered here, the height of the rough particles (coral) is very small in comparison with the water depth, so the effect of drag can be ignored (Lowe et al., 2005a). As analyzed in the previous section of this paper, there is a difference energy dissipation owing to the friction of the reef bottom between the SS- and IG-waves. The SS-wave has a large orbital velocity, which is affected by bottom friction more than that of the IG-wave. Due to the IG-wave has a long period the effect of bottom friction on this type of wave is similar to that of a current. The SS-wave energy dissipation due to bottom friction Df-SS can be fundamentally calculated as a function of the orbital velocity near the reef bottom and the coefficient of energy dissipation due to friction or the coefficient of bottom friction (Jonsson, 1966):
where fw-SS is the coefficient of energy dissipation due to friction under the SS-wave; ub and ub-SS are the amplitudes of horizontal velocity near the reef bottom due to the total wave and the SS-wave, respectively. These velocities can be determined according to the linear wave theory, as follows:
where Lm-,0 is the length of shallow water wave corresponding to the wave period Tm-1.0 at the water depth on the reef, D.
Nielsen (1992) proposed a formula to determine the coefficient of energy dissipation due to the bottom friction for a single wave:
where kw = (1 – 2)*rk is the bottom roughness.
Madsen (1994) and Mathisen and Madsen (1999) extend the application of Equation (14) to irregular waves with c1 = 7.02, c2 = −0.078, and c3 = −8.82.
Pomeroy et al. (2012) proposed a method of determining the coefficient of energy dissipation due to friction under the IG-wave, which is similar to the method developed by Burchard et al. (2011) for currents. In this method, the coefficient of energy dissipation due to bottom friction under the IG-wave depends only on the water depth and the bottom roughness, and is not affected by the near-bottom orbital velocity of the IG-wave (Equation (15)):
in which κ = 0.40 is the Karman number; fw-IG is the coefficient of energy dissipation due to friction under the IG-wave; and kw (or rk) is the bottom roughness sensed by the IG-wave.
There have been many previous studies providing methods to determine the Nikuradse roughness (kw) on a beach with different morphological characteristics of the seabed. The Nikuradse roughness kw = (1 to 2)*d50 is commonly used for a flat seabed, where d50 is the average diameter of the sand/gravel particles at the seabed. When the seabed is a coral bottom with a high degree of roughness, the relationship between roughness (kw) and the absolute roughness height (σr) of the coral bottom is considered as kw = 4*σr (Lowe et al., 2005a,b). In this study, the bottom roughness kw = 0.75*rk was applied for the IG-wave.
The energy dissipation due to bottom friction under the IG-wave can be determined by the method for long waves (Henderson and Bowen, 2002; van Dongeren et al., 2007):
where Hrms and Hrms-IG are the root-mean-square wave heights of the total and IG-waves, respectively.
By applying Equations (11), (12), and (16) the energy dissipation coefficients fw-SS and fw-IG can be determined based on the measured data, and from now on are called the “measured” energy dissipation coefficients fw-SS and fw-IG. The measured energy dissipation coefficients are presented in Figure 11. The figure shows that the measured energy dissipation coefficients under the SS-waves (with an average measured value of fw-SS = 0.15; dashed lines in Figures 11A–C) are much higher than those under the IG-waves (with an average value of fw-IG = 0.05; dashed lines in Figures 11D–F). These results are consistent with the findings of previous studies (see Lowe et al., 2005a; Hench et al., 2008; Péquignet et al., 2011; Lowe et al., 2008; Lowe et al., 2009). This significant difference between the measured coefficients fw-SS and fw-IG is due to the bottom friction and is dependent on the ratio of the horizontal velocity amplitude to the bottom roughness (the ratio is large under SS-waves but small under IG-waves).
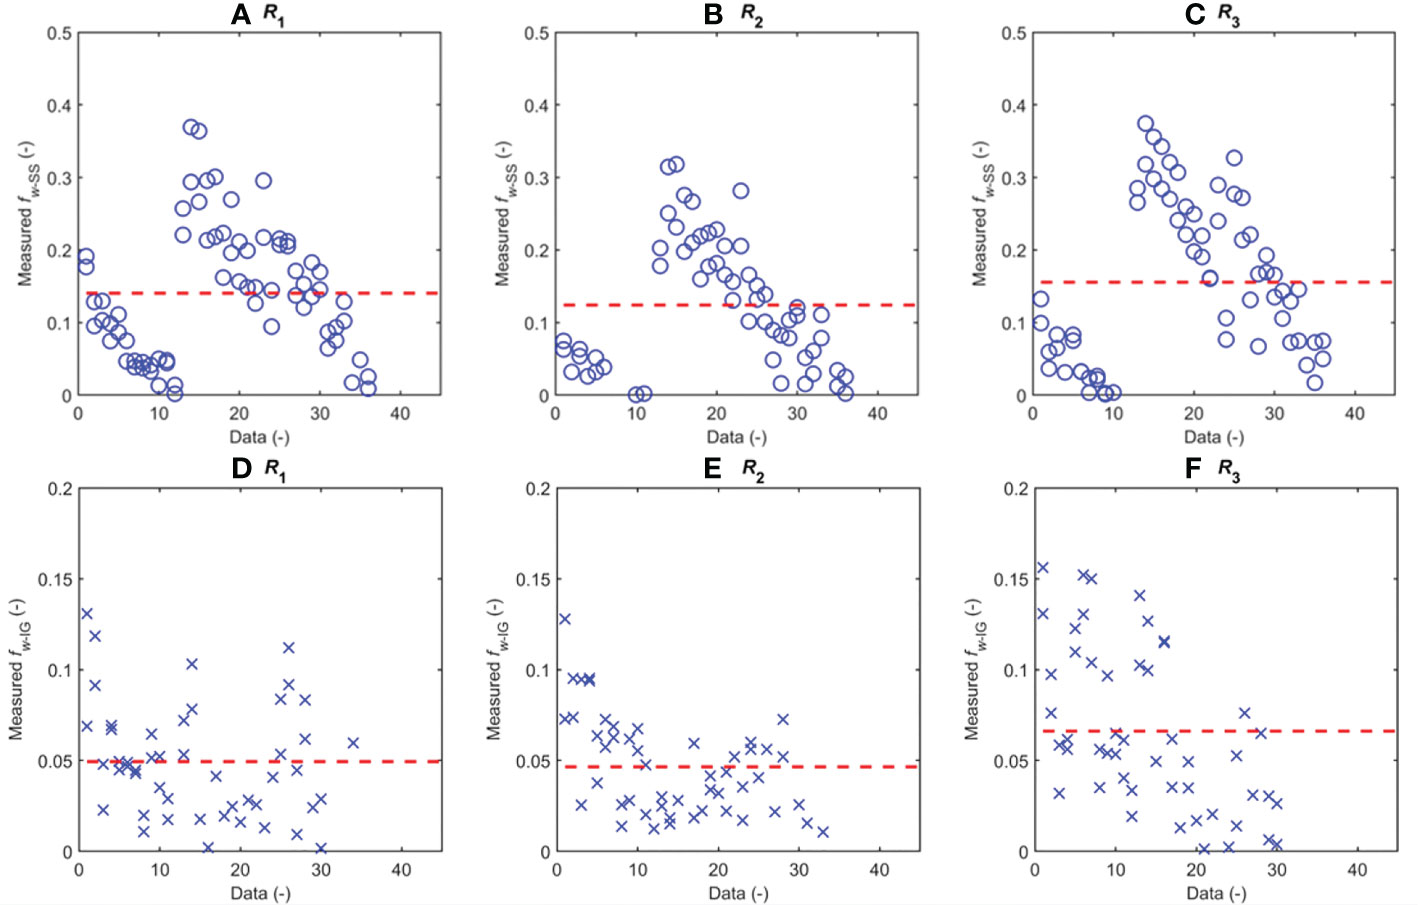
Figure 11 Measured energy dissipation coefficient due to bottom friction for SS-waves (A-C) and IG-waves (D-F).
The “calculated” energy dissipation coefficients from Equations (14) and (15) are presented in Figure 12, in which the bottom roughness kw = 2rk is applied for the SS-waves and kw = 0.75rk is applied for the IG-waves. The tested values of the roughness height rk are presented in Table 2. Similar to the measured energy dissipation coefficients, the calculated coefficients under the SS-waves are much higher than those under the IG-waves. It is shown in Figure 11 and Figure 12 that the average values of the measured and calculated energy dissipation coefficients are similar.
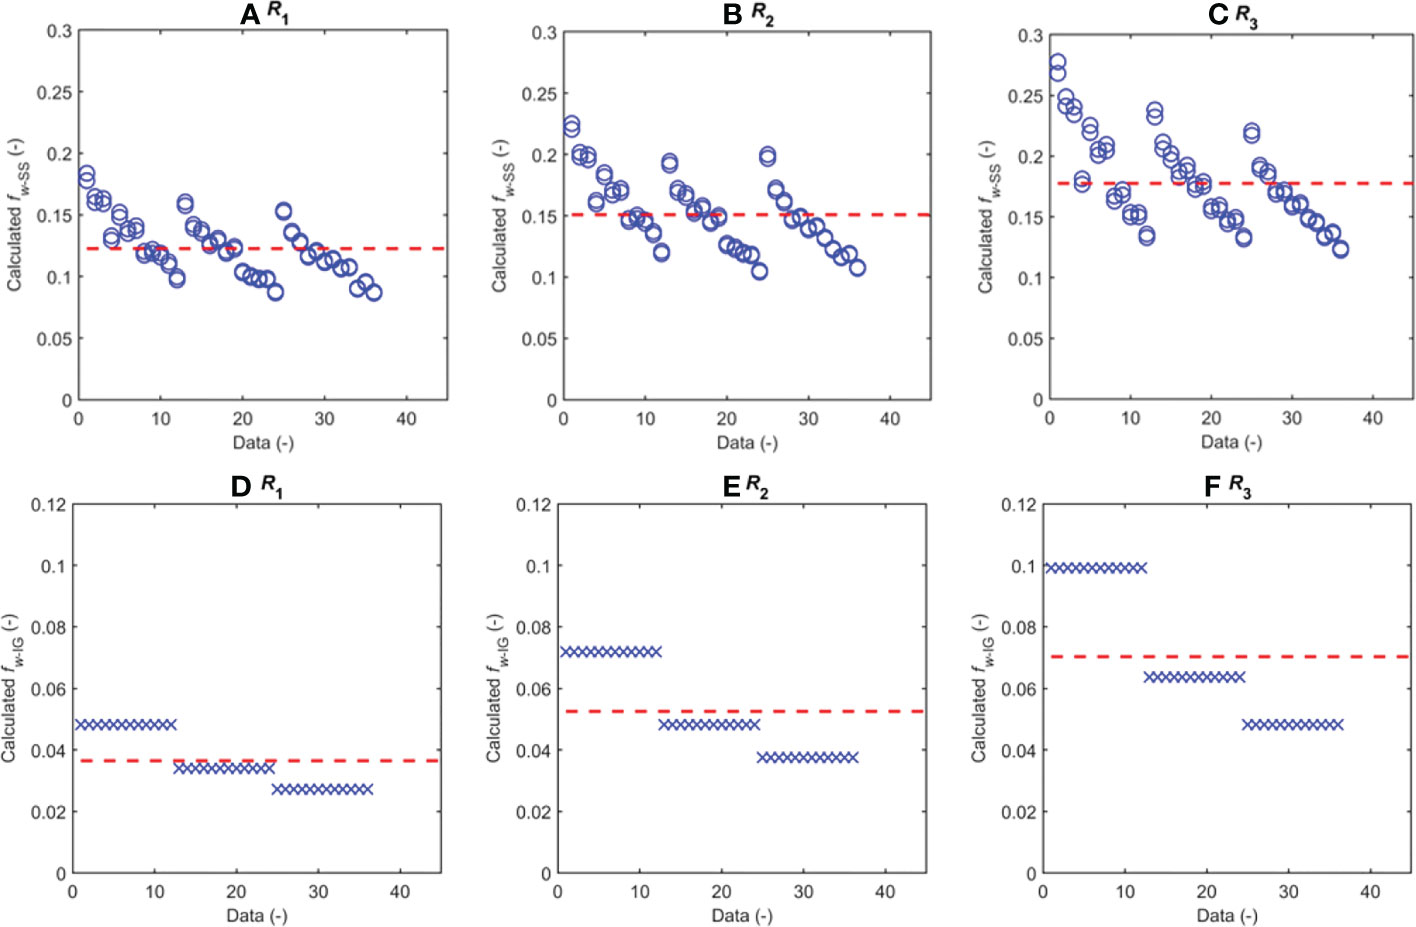
Figure 12 Calculated energy dissipation coefficient due to bottom friction for SS-waves (A–C) and IG-waves (D–F).
Non-linear energy transfer due to wave–wave interaction
Theoretically, the energy conversion in Equation (5) between the SS- and IG-waves due to the non-linear wave–wave interaction can be approximated by an analysis of the correlated spectral pair (bispectral) method presented in Herbers and Burton (1997); Henderson et al. (2006), and Pomeroy et al. (2012). However, this method is difficult to use because of the complexity in constructing the correlated spectral pair of wave energy. In this study, an experimental method is proposed to determine the energy conversion from the experimental data. Here, the energy conversion D*in-IG is directly related to the IG-wave as follows:
where fin-IG is the energy conversion coefficient between the SS- and IG-waves (fin-IG > 0 if the IG-wave receives energy from the SS-wave, and vice versa).
The energy conversion coefficient fin-IG can be determined from Equation (18), in which can be determined from Equation (10) for the smooth bottom case (Df-IG = 0), and from Equation (11) for the rough bottom cases (after deducting the energy dissipation due to friction Df-IG calculated by Equation (16)). Figure 13 shows the energy conversion coefficient fin-IG plotted against the relative submergence of the reef χ. It shows that the energy conversion from the SS-wave to the IG-wave on the reef depends on the relative submergence χ, and that it can be divided into three modes as follows (see more results in Figure 10B): (i) fin-IG > 0 and almost constant if 0 < χ < 0.20; (ii) fin-IG < 0 (the SS-wave gets energy from the IG-wave) if 0.20 ≤ χ ≤ 0.30; (iii) fin-IG > 0 and increases with increasing the relative submergence χ if χ > 0.30. The solid line in Figure 13 represents the fitted curve with functions as shown in Equation (19). The fitted curve has a correlation coefficient R2 of 0.70:
where a0, a1, b0, b1, b2, and c0 are the empirical coefficients found by a least-squares fit of the experimental data: a0 = −0.25; a1 = 10.0; b0 = −0.25; b1 = 1.96; b2 = 3.75; and c0 = 0.25.
Wave parameters at the seaward reef-edge boundary
To determine the wave height attenuation when a wave is propagating across the submerged reef, taking into account the effect of bottom friction, the input wave height characteristics at the seaward reef-edge boundary must be determined. There are important hydrodynamic processes that occur at this boundary of the submerged reef, such as a wave breaking and dissipating most of the incident wave energy, a wave forming infinity gravity waves (IG-waves), and non-linear wave–wave interactions between the SS- and IG-waves (Figure 1).
Spectral wave heights
In the specific wave dynamics mode on the submerged reef, the total wave and the IG-wave are important features, and their determination should be prioritized. In this study, empirical formulae were established to determine the wave height characteristics at the edge of the reef, such as maximum height of the total wave in the reef-edge surfzone, Hm0b, wave height at the boundary (at the reef-edge after wave breaking area), Hm0t, and the height of the IG-wave, Hm0-IG.
From the analysis of the correlation of experimental data as well as the wave properties on a submerged reef, it can be seen that the wave height at the edge of the reef is closely related to the relative reef shallowness χ, which is determined by Equation (2) (see also Tuan and Cuong, 2019b). According to the method presented by Miche (1944) for the maximum wave height due to the depth limitation, the general form of the formula for determining the wave heights at the boundary is proposed as follows:
where a and b are the empirical coefficients determined by the regression analysis of the experimental wave data.
Fitted curves with function as Equation (20) have been found by a least-squares fit of all experimental data (at locations WG2 and WG3) for the wave heights Hm0b, Hm0t, and Hm0-IG, which are represented by the solid red lines in Figures 14A-C. Table 3 presents the mean values of the regression coefficients a and b in Equation (20) and their corresponding 95% confidence intervals, and the correlation factor R2 for the wave heights Hm0b, Hm0t, and Hm0-IG. The wave heights Hm0b, Hm0t, and Hm0-IG can be calculated from Equations (21), (22), and (23), respectively.

Figure 14 Dimensionless wave heights versus relative reef submergence. (A) Maximum total wave height, Hm0b; (B) total wave height, Hm0t; (C) IG-wave height, Hm0-IG.
• The maximum total wave height in the reef-edge breaking area, Hm0b:
• The total wave height in the transmission zone,
• The IG-wave height formed in the reef-edge breaking zone, Hm0-IG:
Spectral period Tm-1,0
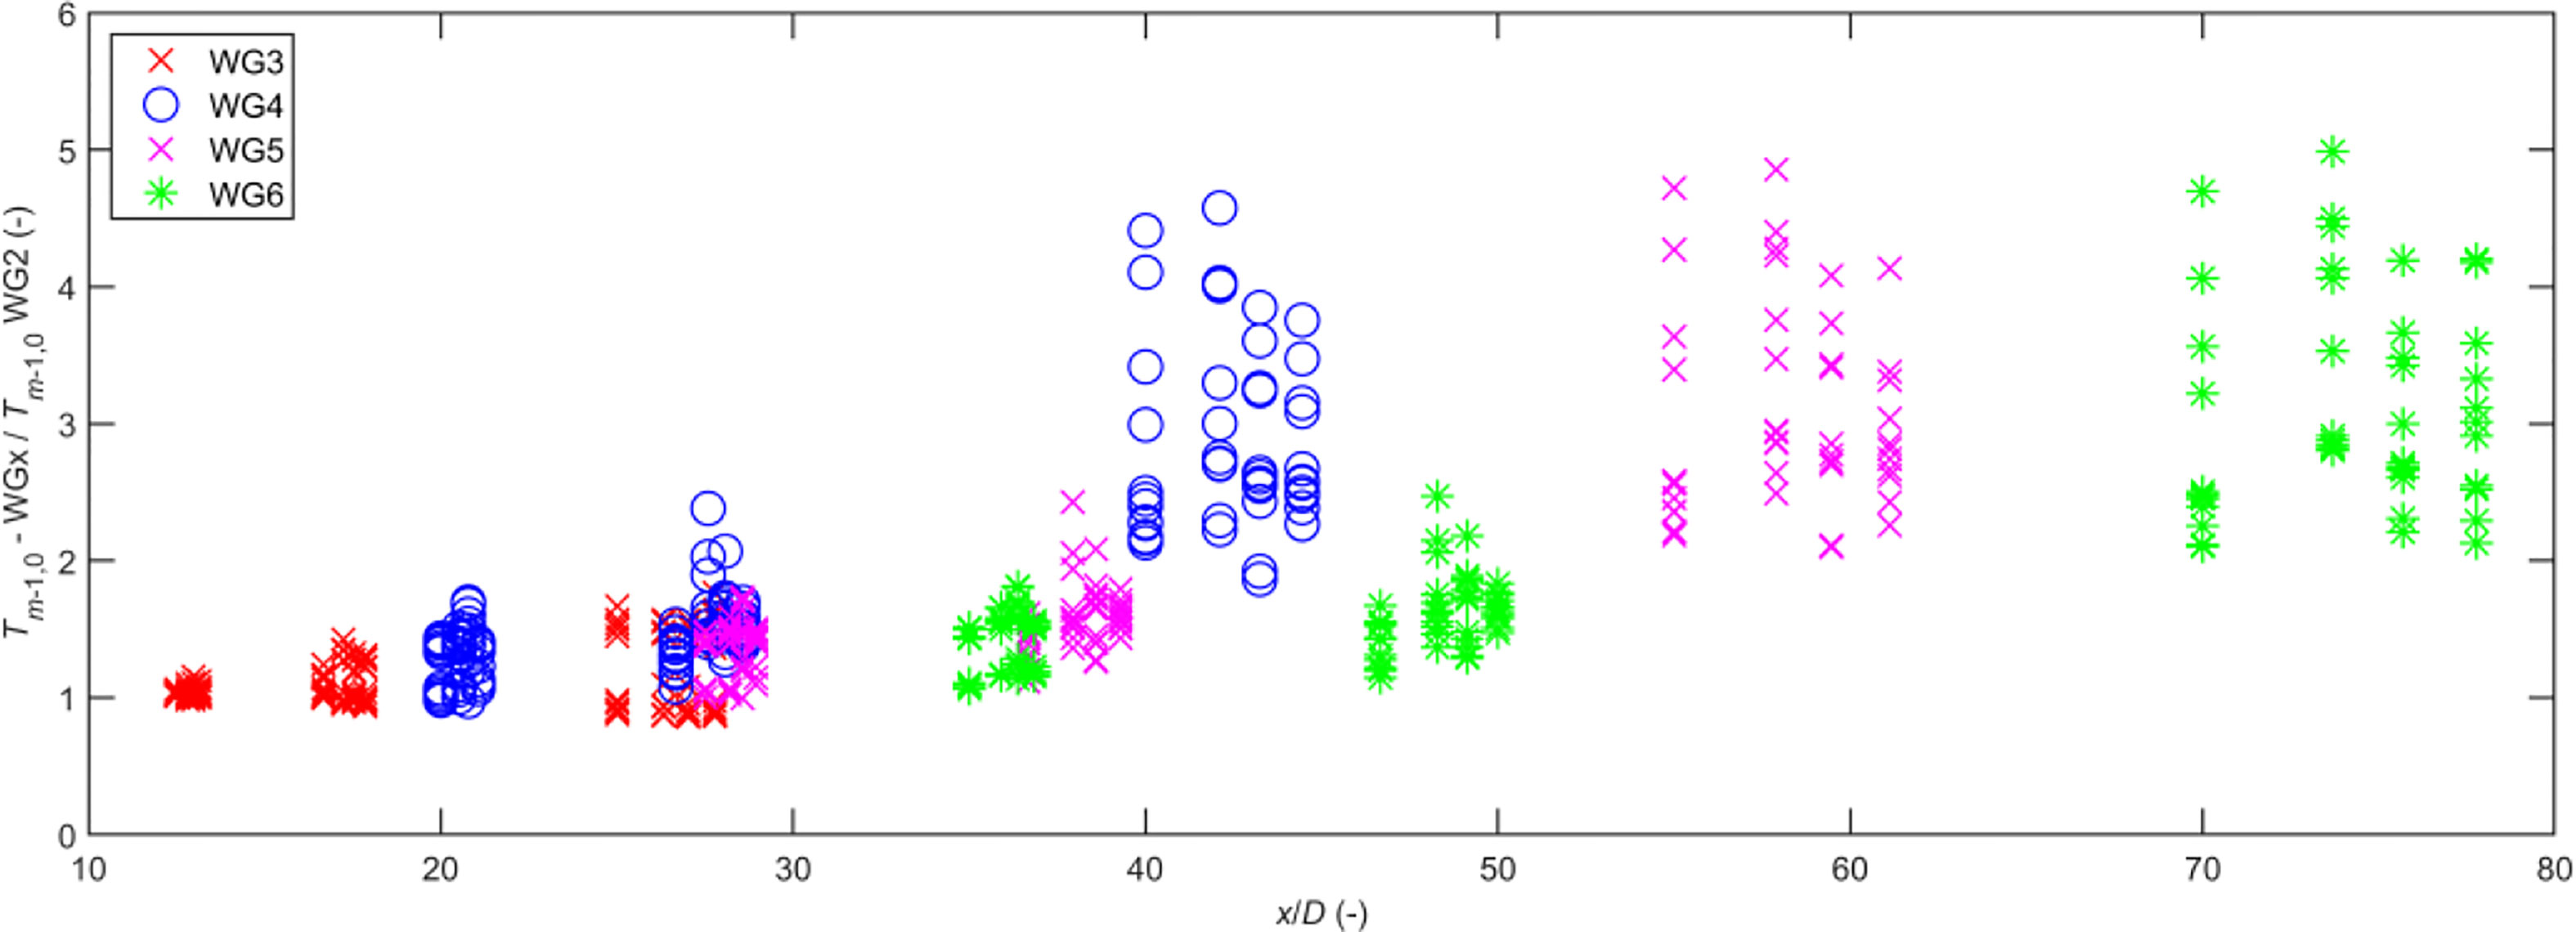
It is known that, owing to the drastic variation in the wave spectrum when waves pass through the shallow water on the top of the reef, the use of the spectrum peak period (Tp) is no longer appropriate, but instead a spectral period (Tm-1,0) is used. The spectral period Tm-1,0 can be determined from the numerical model of wave propagation across the submerged reef and the empirical formulae of Hofland et al. (2017) and Tuan and Cuong (2019b). Similar to the wave height on the submerged reef, the spectral period Tm-1,0 generally depends on the incident wave properties (the wave height and period) and the breaking wave, as well as the relative water depth at the considered location. The variation in the spectral periods in and behind the wave breaking area has been investigated based on the relationship between the ratio of the spectral period in the wave-propagating region (at locations WG3–WG6) to the spectral period in the breaking area at location WG2, Tm-1,0,t/Tm-1,0 WG2, and the relative distance x/D. The relationship between the ratio Tm-1,0,t/Tm-1,0 WG2 and the relative distance x/D is presented in Figure 15. It can be seen that the ratio Tm-1,0,t/Tm-1,0 WG2 increases from 1 to 5 in the breaking zone (from location WG3 at x/D = 5 to location WG4 at x/D = 40). This means that the spectral period Tm-1,0,t on the submerged reef increases dramatically in the breaking zone at the seaward edge of the reef. This is due to the formation and development of the IG-wave, as well as the SS-wave height decreasing in the breaking area on the reef-edge. However, the spectral period Tm-1,0,t is little changed behind the breaking area, as the ratio Tm-1,0,t/Tm-1,0 WG2 is nearly unchanged from WG4 (x/D = 40) to WG6 (x/D = 70) (Figure 15).
The spectral wave period Tm-1,0 in the area behind the breaking zone in this study is interesting. The highest spectral period is again found in the area behind the breaking zone. Similar to the previous study (Tuan and Cuong, 2019a, b), the general formula for determining the spectral period Tm-1,0 in the area behind the breaking zone is proposed as Equation (24-26):
where χp is the characteristic parameter for the shallowness of the submerged reef (similar to the relative submergence χ in Equation (2)); Hm0,0, T0p, and L0p are the height, period, and length of deep water waves, respectively; s0p is the deep water wave slope; and a, b, and c are the empirical coefficients determined by the regression method.
Figure 16 presents a regression curve (solid line) by a least-squares fit of the experimental data (plus markers) based on Equation (24) with high correlation factor R2 = 0.84. The regression coefficients in Equation (24) and their corresponding 95% confidence intervals are a = 1.24 (1.07, 1.41), b = 0.62 (0.49, 0.75), and c = 1.74 (1.54, 1.94).
Empirical formulas for determination of the across-reef wave heights
In this section, several empirical formulae used to determine the across-reef wave heights are presented. The application range of the empirical formulae in this study is the variation range of the dominant parameters in the physical model test, as presented in Table 4.
The procedure used to determine across-reef wave heights affected by the bottom roughness can be summarized into the following steps:
Step 1: Prepare input data setup.
● Parameters of waves in the deep water zone in the front of the submerged reef: Hm0,0, Tp,0
● Geometrical features of the submerged reef: the submerged depth D and the reef width B
Step 2: Determination of wave characteristics at the seaward edge of the reef.
• The width of the breaking zone at the seaward edge xb,90%: this can be estimated from the formula found in Tuan and Cuong (2019b), as follows:
where tanα is the slope of fore-reef slope.
1. • Determine the relative submergence χ by applying Equation (2).
2. • Determine the total wave height in the transmission zone Hm0t by applying Equation (22).
3. • Determine the IG-wave height Hm0-IG by using Equation (23).
4. • Determine the SS-wave height Hm0-SS by using Equation (29).
● Determine the spectral period Tm-1,0 by applying Equation (24) and the regression coefficients and their corresponding 95% confidence intervals: a = 1.24 (1.07, 1.41), b = 0.62 (0.49, 0.75), and c = 1.74 (1.54, 1.94).
● Step 3: Determine the energy dissipation coefficient and the energy dissipated due to the bottom friction under the SS- and IG-waves.
● • Determine the energy dissipation coefficient and the energy dissipated due to the bottom friction under the SS-wave by applying Equations (12), (13), and (14).
● • Determine the energy dissipation coefficient and the energy dissipated due to the bottom friction under the IG-wave by applying Equations (15) and (16).
● • Determine the wave height at a location in transmission zone on the submerged reef. By applying Equations (5), (8), (10), and (11), using the finite difference method, it is easy to determine the wave height at transmission zone on the submerged reef.
● The height of the total wave Hm0t:
The height of the IG wave Hm0-IG:
Note that in Equations (30) and (31), the point x coordinate is taken from the breaking boundary (xb,90%).
Conclusions and recommendations
The effects of the bottom roughness on wave transmission on a submerged coral reef with a very steep fore-reef slope have been experimentally investigated in this study. The physical model was carried out in a wave flume to test different bottom roughness levels, including a smooth bottom and three different bottom roughness levels. The tested waves were the JONSWAP spectrum waves, and there were a total of 144 test cases, representing a combination of four roughness levels and 12 wave scenarios and three attempts for each test scenario. Water elevations along the test model were measured by six capacitive wave gauges, which were used to analyze wave properties.
This study analyzed and elucidated the properties of the wave change process on submerged coral reefs with the influence of rough friction on the entire coral bottom surface, especially for each type of wave, SS-waves and IG-waves.
The results show that, in the case of shallow water on the reef, IG-waves form and develop, and come to dominate SS-waves, at positions behind the surfzone. The SS-waves are significantly affected by the bottom friction, and therefore the energy of the SS-waves is greatly dissipated. In contrast, bottom friction has a minor effect on the IG-waves on the reef.
Based on the wave energy balance equations, this study has established empirical formulae to separately determine the rates of dissipation, due to bottom friction, of the energy of SS- and IG-waves. In addition to the dissipation of wave energy due to bottom friction, the wave change behavior on the submerged reef is also influenced by the energy exchange process due to the non-linear wave–wave interaction of the SS- and IG-waves.
This study also established an empirical formula describing the relationship between the energy exchange process due to this non-linear wave–wave interaction and the relative submergence of the reef.
The new formulae proposed in this paper are a contribution to the paper on theoretical development.
It is possible to apply the empirical formulae developed in this study to determine the wave parameters at locations behind the surfzone on a submerged coral reef based on the relationship between wave parameters at the seaward reef-edge and the wave energy dissipation rates due to bottom friction.
This study has achieved the interesting results presented above for a submerged coral reef, but the results of the study still need to be verified with field-measured wave data at locations where structures will be built on the submerged coral reef. In addition, it is recommended that the data set obtained from this experimental study be used to build, calibrate, and verify numerical models of wave propagation across a submerged coral reef, to complete a scientific basis for calculating and predicting the wave conditions on a submerged reef for designing structures on submerged coral reefs, which have been not seen in the actual standard design practices.
Data availability statement
The raw data supporting the conclusions of this article will be made available by the authors, without undue reservation.
Author contributions
QD: conceptualisation, methodology, supervision, formal analysis, writing–original draft, funding acquisition; QN and DH: visualization, writing–review and editing; CM: conceptualisation, investigation, writing–review and editing. All authors contributed to the article and approved the submitted version.
Conflict of interest
The authors declare that the research was conducted in the absence of any commercial or financial relationships that could be construed as a potential conflict of interest.
Publisher’s note
All claims expressed in this article are solely those of the authors and do not necessarily represent those of their affiliated organizations, or those of the publisher, the editors and the reviewers. Any product that may be evaluated in this article, or claim that may be made by its manufacturer, is not guaranteed or endorsed by the publisher.
References
Baldock T. E. (2012). Dissipation of incident forced long waves in the surf zone-implications for the concept of “bound” wave release at short wave breaking. Coast. Eng. 60, 276–285. doi: 10.1016/j.coastaleng.2011.11.002
Battjes J. A., Bakkenes H. J., Janssen T. T., van Dongeren A. R. (2004). Shoaling of subharmonic gravity waves. J. Geophysical Res.-Oceans 109 (C2). doi: 10.1029/2003JC001863
Buckley M. L., Lowe R. J., Hansen J. E., van Dongeren A. R. (2016). Wave setup over a fringing reef with large bottom roughness. J. Phys. Oceanogr. 46, 2317–2333. doi: 10.1175/JPO-D-15-0148.1
Burchard H., Hetland R. D., Schulz E., Schuttelaars H. M. (2011). Drivers of residual estuarine circulation in tidally energetic estuaries: Straight and irrotational channels with parabolic cross section. J. Phys. Oceanogr. 41 (3), 548–570. doi: 10.1175/2010JPO4453.1
Dinh Q. C., Thieu Q. T., Nguyen Q. T., Bui T. A., Vu D. C., Pham H. H., et al. (2014). Research and apply technological solutions to develop and construct a jacket platform suitable to the environmental conditions of the truong sa islands of Viet nam. report on research results of the science and technology project state level, Code DTB11.4-GD1-2011-2014.
Hench J. L., Leichter J. J., Monismith S. G. (2008). Episodic circulation and exchange in a wave-driven coral reef and lagoon system. Limnol. Oceanography 53 (6), 2681–2694. doi: 10.4319/lo.2008.53.6.2681
Henderson S. M., Bowen A. J. (2002). Observations of surf beat forcing and dissipation. J. Geophysical Res. 107 (C11), 3193. doi: 10.1029/2000JC000498
Henderson S. M., Guza R. T., Elgar S., Herbers T. H. C., Bowen A. J. (2006). Nonlinear generation and loss of infragravity wave energy. J. Geophys. Res. 111, C12007. doi: 10.1029/2006JC003539
Herbers T. H. C., Burton M. C. (1997). Nonlinear shoaling of directionally spread waves on a beach. J. Geophys. Res. 102 (C9), 21,101–21,114. doi: 10.1029/97JC01581
Herbers T. H. C., Russnogle N. R., Elgar S. (2000). Spectral energy balance of breaking waves within the surf zone. J. Phys. Oceanography, 30(11):2723–2737. doi: 10.1175/1520-0485(2000)030%3C2723:SEBOBW%3E2.0.CO;2
Hofland B., Chen X., Altomare C., Oosterlo P. (2017). Prediction formula for the spectral wave period Tm-1,0 on mildly sloping shallow foreshores. Coast. Eng. 123, 21–28. doi: 10.1016/j.coastaleng.2017.02.005
Jonsson I. (1966). Wave boundary layers and friction factors. Coastal Engineering Proceedings, 1(10), 9. doi: 10.9753/icce.v10.9
Lowe R. J., Falter J. L., Bandet M. D., Pawlak G., Atkinson M. J., Monismith S. G., et al. (2005a). Spectral wave dissipation over a barrier reef. J. Geophys. Res. 110, C04001. doi: 10.1029/2004JC002711
Lowe R. J., Falter J. L., Monismith S. G., Atkinson M. J. (2009). Wave-driven circulation of a coastal reef-lagoon system. J. Phys. Oceanography 39 (4), 873–893. doi: 10.1175/2008JPO3958.1
Lowe R. J., Koseff J. R., Monismith S. G. (2005b). Oscillatory flow through submerged canopies: 1. velocity structure. J. Geophys. Res. 110, C10016. doi: 10.1029/2004JC002788
Lowe R. J., Shavit U., Falter J. L., Koseff J. R., Monismith S. G. (2008). Modeling flow in coral communities with and without waves: a synthesis of porous media and canopy flow approaches. Limnol. Oceanography 53 (6), 2668–2680. doi: 10.4319/lo.2008.53.6.2668
Madsen O. S. (1994). Spectral wave-current bottom boundary layer flows. Coastal Engineering Proceedings, 1(24). doi: 10.1061/9780784400890.030
Madsen O., Poon Y.-K., Graber H. (1998). 1988. spectral wave attenuation by bottom friction: Theory. Coast. Eng. 1, 492–504. doi: 10.9753/icce.v21.34. Am. Soc. of Civ. Eng., Reston.
Mathisen P. P., Madsen O. S. (1999). Waves and currents over a fixed rippled bed: 3. bottom and apparent roughness for spectral waves and currents. J. Geophys. Res. 104, 18447–18461. doi: 10.1029/1999JC900114
Miche R. (1944). Mouvements ondulatoires de la mer en profondeur constante ou decroissante forme limite de la houle lors de son deferlement. Annales Des. Ponts Chaussees, pp(1) 26-78, (2)270-292, (3) 369-406. Available at: http://resolver.tudelft.nl/uuid:6fceef55-d71b-4e3e-a94f-98ff17cb8f91.
Nielsen P. (1992). Coastal bottom boundary layers and sediment transport. Adv. Ser. Ocean Eng. 4, 324. World Scientific. doi: 10.1142/1269
Nwogu O., Demirbilek Z. (2010). Infragravity wave motions and runup over shallow fringing reefs. J. Waterway Port Coastal Ocean Eng. 136, 295–305. doi: 10.1061/(ASCE)WW.1943-5460.0000050
Péquignet A. C. N., Becker J. M., Merrifield M. A., Boc S. J. (2011). The dissipation of wind wave energy across a fringing reef at ipan, Guam. Coral Reefs 30, suppl. 1, 71–82. doi: 10.1007/s00338-011-0719-5
Phung Dinh T. (2010). Development strategy of the PetroVietnam until 2015 and orientation to 2025, celebrating the 35th anniversary of the PetroVietnam. J. Petrotimes (Internal use only).
Pomeroy A., Lowe R., Symonds G., Dongeren A. V., Moore C. (2012). The dynamics of infragravity wave transformation over a fringing reef. J. Geophysical Res. 117, C11022. doi: 10.1029/2012JC008310
Sheremet A., Guza R. T., Elgar S., Herbers T. H. C. (2002). Observations of nearshore infragravity waves: Seaward and shoreward propagating components. J. Geophysical Res. 107 (C8), 3095. doi: 10.21236/ADA409757
Tuan T. Q., Cuong D. Q. (2019a). Distribution of wave heights on steep submerged reefs. Ocean Eng. 189. doi: 10.1016/j.oceaneng.2019.106409
Tuan T. Q., Cuong D. Q. (2019b). Wave transmission across steep submerged reefs. in. Proc. Int. Conf. Asian Pacific Coasts (APAC), 687–694. doi: 10.1007/978-981-15-0291-0_94
van Dongeren A., Battjes J., Janssen T., van Noorloos J., Steenhauer K., Steenbergen G., et al. (2007). Shoaling and shoreline dissipation of low-frequency waves. J. Geophys. Res. 112, C02011. doi: 10.1029/2006JC003701
Keywords: wave transmission, short-period wave, infra-gravity wave, submerged reef, steep fore-reef slope, bottom roughness
Citation: Dinh QC, Nguyen QT, Ho DD and Mai CT (2023) Effects of bottom roughness on wave transmission across a submerged reef. Front. Mar. Sci. 10:1113195. doi: 10.3389/fmars.2023.1113195
Received: 01 December 2022; Accepted: 30 January 2023;
Published: 23 February 2023.
Edited by:
Riccardo Briganti, University of Nottingham, United KingdomReviewed by:
Md Salauddin, University College Dublin, IrelandNguyễn Trung, University of Transport and Communications, Vietnam
Copyright © 2023 Dinh, Nguyen, Ho and Mai. This is an open-access article distributed under the terms of the Creative Commons Attribution License (CC BY). The use, distribution or reproduction in other forums is permitted, provided the original author(s) and the copyright owner(s) are credited and that the original publication in this journal is cited, in accordance with accepted academic practice. No use, distribution or reproduction is permitted which does not comply with these terms.
*Correspondence: Quang Cuong Dinh, Y3VvbmdkcUBodWNlLmVkdS52bg==
 Quang Cuong Dinh*
 Quang Tao Nguyen
 Cao Tri Mai