 Xu Tian1
 Xilin Zhang2*Jinli Wang3
 Zhilei Sun2Ming Liu1Jinhuan Zhao2Lin Zhang4Dejiang Fan1
 Fangjian Xu3*
- 1College of Marine Geosciences, Ocean University of China, Qingdao, China
- 2Qingdao Institute of Marine Geology, Ministry of Natural Resources, Qingdao, China
- 3College of Marine Science, Hainan University, Haikou, China
- 4Haikou Center of Marine Geological Survey, China Geological Survey, Haikou, China
The sedimentary processes of seamount regions are closely related to climate change and ocean evolution. The clay minerals, grain size and 14C ages of core SCS18-1, which was collected from the Beipo seamount in the northern South China Sea (SCS) were analyzed to discuss the provenance and paleoenvironmental conditions during the last deglaciation. The sediments of core SCS18-1 are dominated by clayey silt, which is mainly composed of illite (55.2~62.1%) and chlorite (17.1~22.5%), with subordinate kaolinite (9.5~12.6%) and smectite (7.3~15.1%). The illite chemical index and illite crystallinity indicate strong physical weathering conditions. The results of the end-member modeling algorithm (EMMA) suggest that the sediments of core SCS18-1 consist of three end-members containing EM1 (0.98 μm), EM2 (9.29 μm) and EM3 (44.19 μm), with average contents of 3%, 66% and 31%, respectively. The finest endmember represents fluvial mud, the middle and coarsest endmembers are considered fluvial fine silt and eolian dust, respectively. The mean grain size is mainly controlled by the coarser fraction EM3. Based on the clay minerals, grain size and SEM analysis, we can conclude that since the onset of the last deglaciation (16.1 ka BP), the sediments of core SCS18-1 mainly originate from fluvial input, and eolian material also contributed to the sediments. The clay mineral assemblages of core SCS18-1 are stable and originate mainly from Taiwan. Additionally, the Pearl River appears to be a secondary contributor of clay minerals. Further, the Luzon Islands only account for a small proportion. Major kaolinite and moderate illite and chlorite are thought to originate from the Pearl River, predominant illite and chlorite from Taiwan, and principal smectite from the Luzon Islands. Both the relative content of EM1+ EM2 and the illite chemical index effectively represent the variation of East Asia summer monsoon (EASM) strength. Meanwhile, the relative content of EM3 effectively represents the East Asian winter monsoon (EAWM) change. The material supply of core SCS18-1 is mainly controlled by solar radiation in the Northern Hemisphere.
1 Introduction
As part of the South China Sea (SCS), the largest marginal sea in the western Pacific, the northern SCS receives sediment derived from the Pearl River in South China, small mountainous rivers in southwestern Taiwan, and some rivers in Luzon (Boulay et al., 2005; Clift et al., 2014; Liu et al., 2016; Wan et al., 2017; Kissel et al., 2020), and its deposition processes are highly impacted by land-sea interactions, sea-level changes, East Asian monsoon (EAM), El Niño Southern Oscillation (ENSO), and other processes (Hu et al., 2012; Clift et al., 2014; Liu et al., 2016; Wan et al., 2017; Kissel et al., 2020). Currently, there are disagreements regarding the provenance of the sediments in the northern SCS. Most previous studies in the northern SCS have considered the Pearl River to be the main sediment (Clift et al., 2002; Boulay et al., 2003; Li et al., 2003). Growing evidence indicates that, due to the tectonic activity and monsoon/typhoon rainfall of Taiwan Island, the small mountainous rivers draining Taiwan Island supply 230–400 Mt/yr (Liu et al., 2008; Xu et al., 2021). Thus Taiwan is thought to be one of the highest sediment suppliers in the world. As a result, the Taiwan sediment provenance has become more important to the northern SCS, with only minor amounts transported from the Pearl River and Luzon rivers (Clift et al., 2014; Huang et al., 2016). However, our understanding of the sediment provenance of the continental slope in the northern SCS remains limited.
Seamounts are the most ubiquitous landforms on Earth but are unevenly distributed among ocean basins, and there are approximately 2500 seamounts with a height of more than 100 m in the world (Wessel et al., 2010). Seamount sediments are ideal recorders of ocean circulation, sediment deposition, sediment transportation and weathering of adjacent lands, so they are important for many disciplines, including such as geology, oceanography, biology, ecology, and possibly economics (considering future exploitation of mineral resources) (Staudigel and Clague, 2010; Staudigel and Koppers, 2015). Because the ocean is vast, research vessels have visited only a few thousand of these seamounts, with less than 0.1% of them being previously investigated (Zhou et al., 2020). In addition, due to the limitations of the marine survey equipment resolution, we know very little about seamounts; thus, the identification of seamounts may be arguably the last major frontier in geographic, geological, and ecological exploration on Earth (Staudigel and Koppers, 2015; Zhao et al., 2022). Growing evidence shown that seamounts not only affect the distribution of sediment and the path of sediment transport, but also influence the intensity and propagation path of deep-water dynamics, especially deep-water gravity and bottom currents (Zhang and Boyer, 1991; Chen et al., 2019). Thus, the source-to-sink mechanisms should be different between seamounts and other oceanic geomorphic units. However, most past studies have focused on the mineral resources (polymetallic nodules or Co-rich crusts) found in the seamounts in the northern SCS (Zhong et al., 2017). Work has seldom been done in relation to the provenance and paleoenvironment of seamounts; moreover, no research on the provenance and paleoenvironmental history of the sediments in the Beipo seamount of the northern SCS has been conducted.
Based on the accelerator mass spectrometry (AMS) 14C ages, grain size compositions, and clay minerals of the core SCS18-1 sediments taken from the Beipo seamount on the continental slope of the northern SCS, the sediment provenances and paleoenvironmental of these marine sediments over the last deglaciation are discussed in this study.
2 Geological and oceanographic setting
The Beipo seamount is located on the continental slope of the northern SCS, southwest of Taiwan Island. According to the near-bottom observations of Jiaolong Dive 141 on the Dayang 38th voyage and Qianlong III on the 2018 Dayang Yihao comprehensive ocean expedition, large, irregular-shaped nodules with a hard substrate, low water content, and strong adhesion develop on the Beipo seamount and nearby areas (Dayang 38th voyage field report; 2018 Dayang Yihao comprehensive ocean expedition field report). A complex current system has developed in the northern SCS, including deep-water currents, Kuroshio and surface currents influenced by the EAM and the South China Offshore Current (Shaw and Chao, 1994; Huang et al., 2016; Liu et al., 2016; Liu et al., 2017). The summer and winter surface currents do not completely reverse with the shift of the monsoon direction; the surface currents only shift between the southwestward SCS Warm Current and the northeastward Guangdong Coastal Current on the northern shelf and upper land slope regions; the SCS branch of the Kuroshio current intruding from the Luzon Strait transforms northward into the SCS Warm Current and transforms southward into the northwest Luzon Cyclonic Eddy; the South China Offshore Current, Luzon Coastal Current and deepwater current do not show seasonal variations (Liu et al., 2010a).
The island of Taiwan is located at the tectonic collision boundary between the Philippine Sea Plate and the Eurasian. Given its steep topographic gradients, less weather-resistant rocks (mainly composed of Tertiary metamorphic and sedimentary rocks), high tectonic activity, periodic typhoons and heavy rainfall, Taiwan is generally known to have one of the highest sediment yields in the world (Li et al., 2012). It is assumed that rivers in southwestern Taiwan contribute 187 × 106 t of suspended matter to the SCS annually (Liu et al., 2009). As the second largest river in our country, the Pearl River was formed by the uplift of the Tibetan Plateau in approximately 34 Ma. The basin covers an area of 453690 km2 with a total annual runoff of 326 billion m3. The Pearl River is an oligotrophic river that delivers 69 × 106 t of suspended sediment to the sea annually (Milliman and Syvitski, 1992). Luzon is dominated by basalt and andesite, with very developed volcanic activity. The tectonic movement and monsoon rainfall have a significant impact on the transport of terrigenous clastic sediments. The sediment transport of the Luzon rivers reached 16×106 t (Liu et al., 2009).
3 Materials and methods
Core SCS18-1 (118.06.22°E, 21.10.66°N, water depth 1750 m, total length 141 cm; Figure 1) was collected from the Beipo seamount in the northern SCS by gravity sampler in 2018. The core was described and subsampled at 1-cm intervals. The sediment of core SCS18-1 is mainly gray clay silt and contains numerous foraminifers.
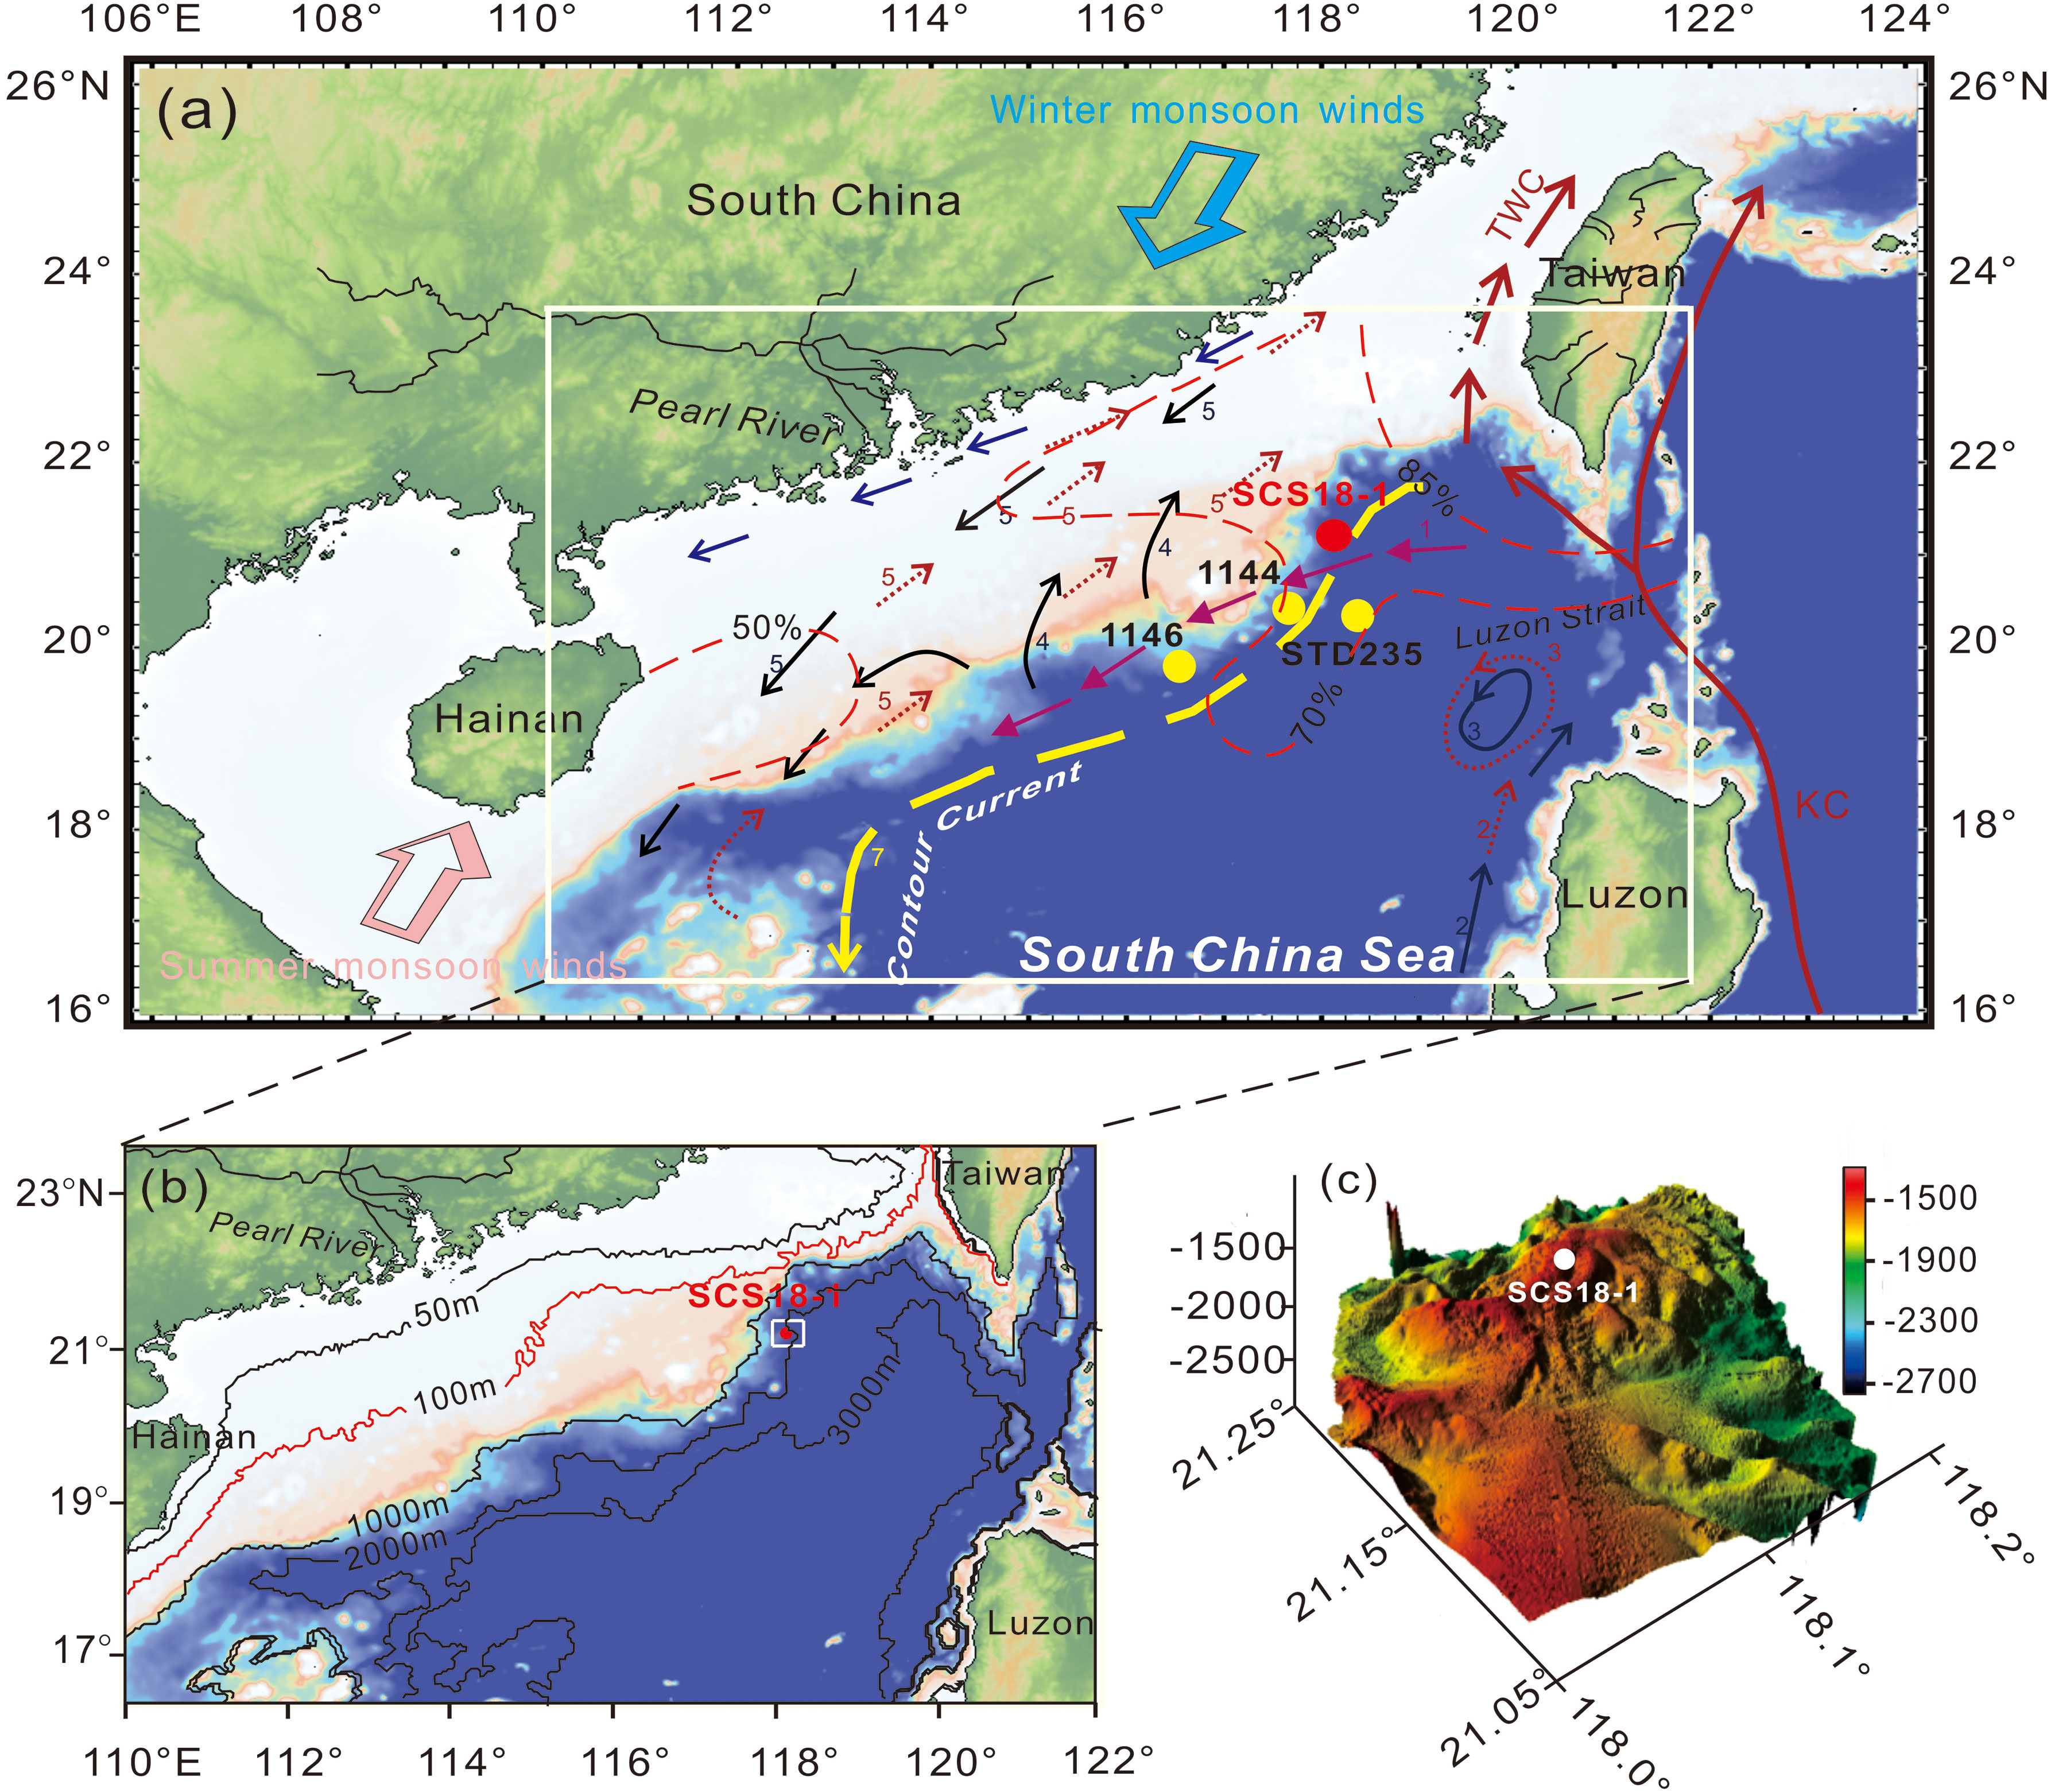
Figure 1 Map showing (A) the location of core SCS18-1 and the monsoon winds and current systems (modified from Liu et al., 2010b), (B) the submarine contour in the northern SCS, (C) the topography of the Beipo seamount. The location of cores ODP1144 (Liu et al., 2010b; Liu et al., 2013), ODP1146 (Wan et al., 2007b) and STD235 (Liu et al., 2018) are also shown. Southwesterly winds prevailing in summer (pink three-dimensional arrow) and northeasterly winds prevailing in winter (blue three-dimensional arrow); summer and winter surface currents (red dotted line arrow and black solid arrow, respectively); deep current (yellow dashed arrow); longshore current (blue solid arrow); Kuroshio current (KC); Taiwan current (TWC). Numbers for winter and summer surface currents: 1. SCS Branch of Kuroshio; 2. NW Luzon Coastal Current; 3. NW Luzon Cyclonic Eddy; 4. SCS Warm Current; 5. Guangdong Coastal Current.
The samples used for grain-size analysis were collected at 1-cm intervals. As to the pretreatment for grain size analysis, calcium carbonate and organic matter were carefully removed with excess 1 mol/L HCl and 10% H2O2 for 24 h, respectively. After rinsing and centrifuging 3 times using deionized water, the residues were dispersed and homogenized using ultrasound and then analyzed using a Malvern Mastersizer 2000 instrument in Qingdao Sparta Analysis & Testing Co., Ltd. The analyses of each sample, which were repeated three times, show that the relative error is less than 2%, and the measurement range of this laser particle size analyzer is 0.02 to 2000 μm. According to the sediment sample characteristics and the instrument user manual, the grain size distributions (GSDs) were calculated using the Mie Theory, where the absorption coefficient and refractive index are 0.1 and 1.52, respectively. The grain size of the samples was divided into clay (< 4 μm), silt (4-63 μm) and sand (63-2000 μm) (Wentworth, 1922). The grain size data were simulated by the end-member model algorithm (EMMA), and the process of the simulation was generated by the software AnalySize embedded in MATLAB (Paterson and Heslop, 2015).
71 samples were used for clay mineral analyses. Samples were treated with 15% H2O2 and 1 mol/L HCl to remove organic matter and calcium carbonate and then centrifuged with deionized water three times. Clay mineral analyses were performed on the < 2 µm fraction, which was separated based on conventional Stokes’ settling velocity principles. Each sample was transferred to two slides by wet smearing. Samples were then air-dried before X-ray diffraction (XRD) analysis (Liu et al., 2003; Wan et al., 2007a). The instrument is an X’Pert MPD Pro XRD diffractometer with CuKα radiation (40 kV and 100 mA) produced by Panako Company in the Netherlands. Natural and ethylene-glycol solvation samples were measured, and the scanning was completed done from 3° to 30° with a step size of 0.02°. Identification of clay minerals was made mainly according to the position of the (001) series of basal reflections on the two XRD spectra. Semi-quantitative estimation of clay mineral abundances is based on the peak areas of smectite (17Å), illite (10Å), and kaolinite/chlorite (7Å) on the glycolate curve using the Topas2p software. Relative proportions of kaolinite and chlorite were determined based on the ratio of the 3.57/3.54 Å peak areas. Relative clay mineral abundances are given in percentages. Biscaye weighting factors are used when calculating relative percentages of each clay mineral (Biscaye, 1965). In addition, the illite chemistry index (the ratio of illite 5Å and 10Å peak areas) and illite crystallinity (the full width at half maximum height (FWHM) of the illite 10 Å peak) were determined on the glycolate curve.
Five AMS14C dating samples of the planktonic foraminifer Globigerinoides ruber (G. ruber) were analyzed by Beta Analytic Inc., USA for this core. The raw 14C dates were converted into calendar years (yr BP) using CALIB 8.2.0 software and applying the Marine 20 program (http://calib.org/calib/calib.html), and the reservoir age correction values were -58 ± 43 a (Yoneda et al., 2007). Then, the downcore age uncertainty was modeled using the R-based statistical program Bacon 2.2, which is based on the calibrated 14C dates and a Bayesian approach (Blaauw and Christen, 2011).
Micro-morphological examinations of two sediment samples (40 cm and 80 cm) from core SCS18-1 were performed using a Hitachi JSM-7610F scanning electronmicroscope (SEM) equipped with an energy dispersive X-ray spectrometer (EDS) at Qingdao marine equipment inspection & testing group Co., LTD. Organic matter and calcium carbonate were removed using 10% H2O2 and 15% HCl, respectively. The pretreated terrigenous grains were dispersed in ethanol by an ultrasonic cleaner and then carefully dropped on a cover glass slide. These grains were placed on a stub and coated in gold before examination under SEM. The chemical composition of selected grains was determined by EDS.
4 Results
4.1 Age model
The age model of core SCS18-1 is based on a total of 5 AMS 14C dates. The sedimentation of core SCS18-1 is relatively continuous without age inversion, and the age at the bottom (141 cm) is approximately 16.1 ka BP (Table 1 and Figure 2).
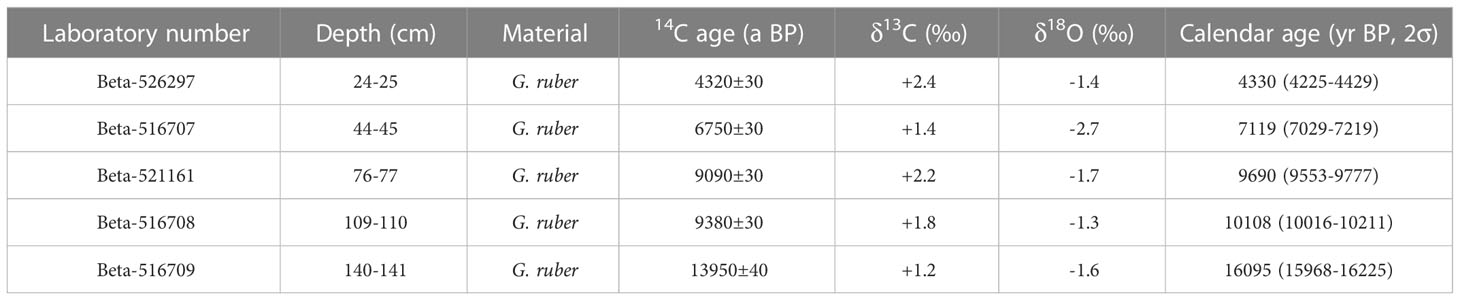
Table 1 AMS14C dates for core SCS18-1.
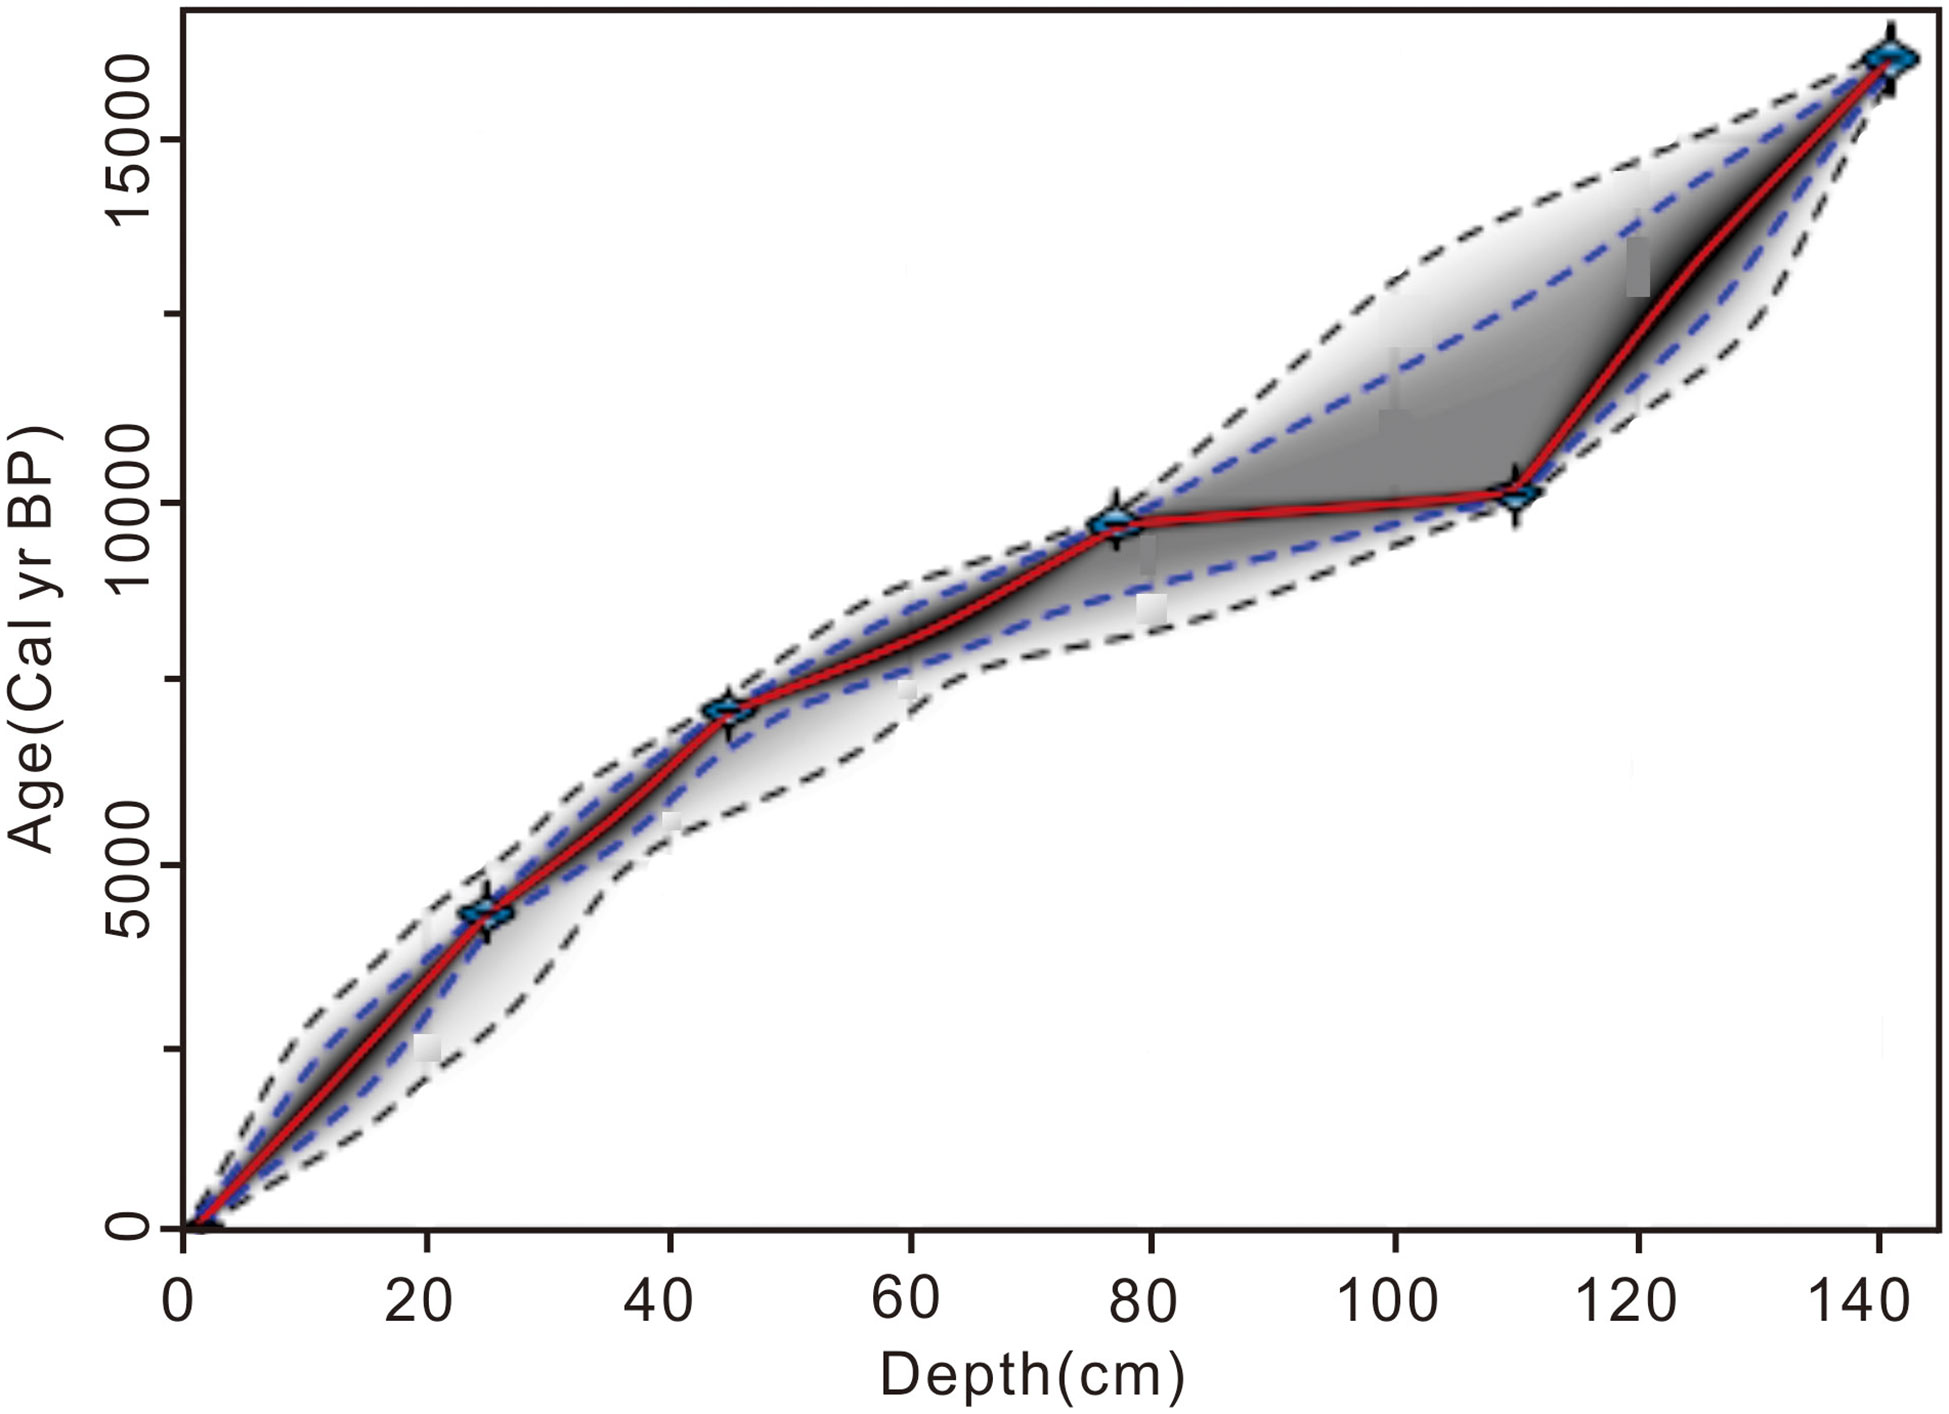
Figure 2 Age-depth model for core SCS18-1.
4.2 Grain size characteristics and endmember analysis
The presence of trends in grain size composition changes significantly at 42 cm and 103 cm. The core can be divided into stages I, II, and III (Figure 3). For stage I (142-103 cm, 16.1-10.6 ka BP), the average contents of clay, silt, and sand are 19.0%, 72.4%, and 9.6%, respectively; for stage II (103-42 cm, 10.6-6.8 ka BP), the average contents of clay, silt, and sand are 19.8%, 74.7%, and 5.5%, respectively, and the average grain size gradually increases from bottom to top; for stage III (42-0 cm, 6.8-0 ka BP), the average contents of clay, silt, and sand are 17.1%, 74.1%, and 8.8%, respectively, and the average grain size changes slightly.
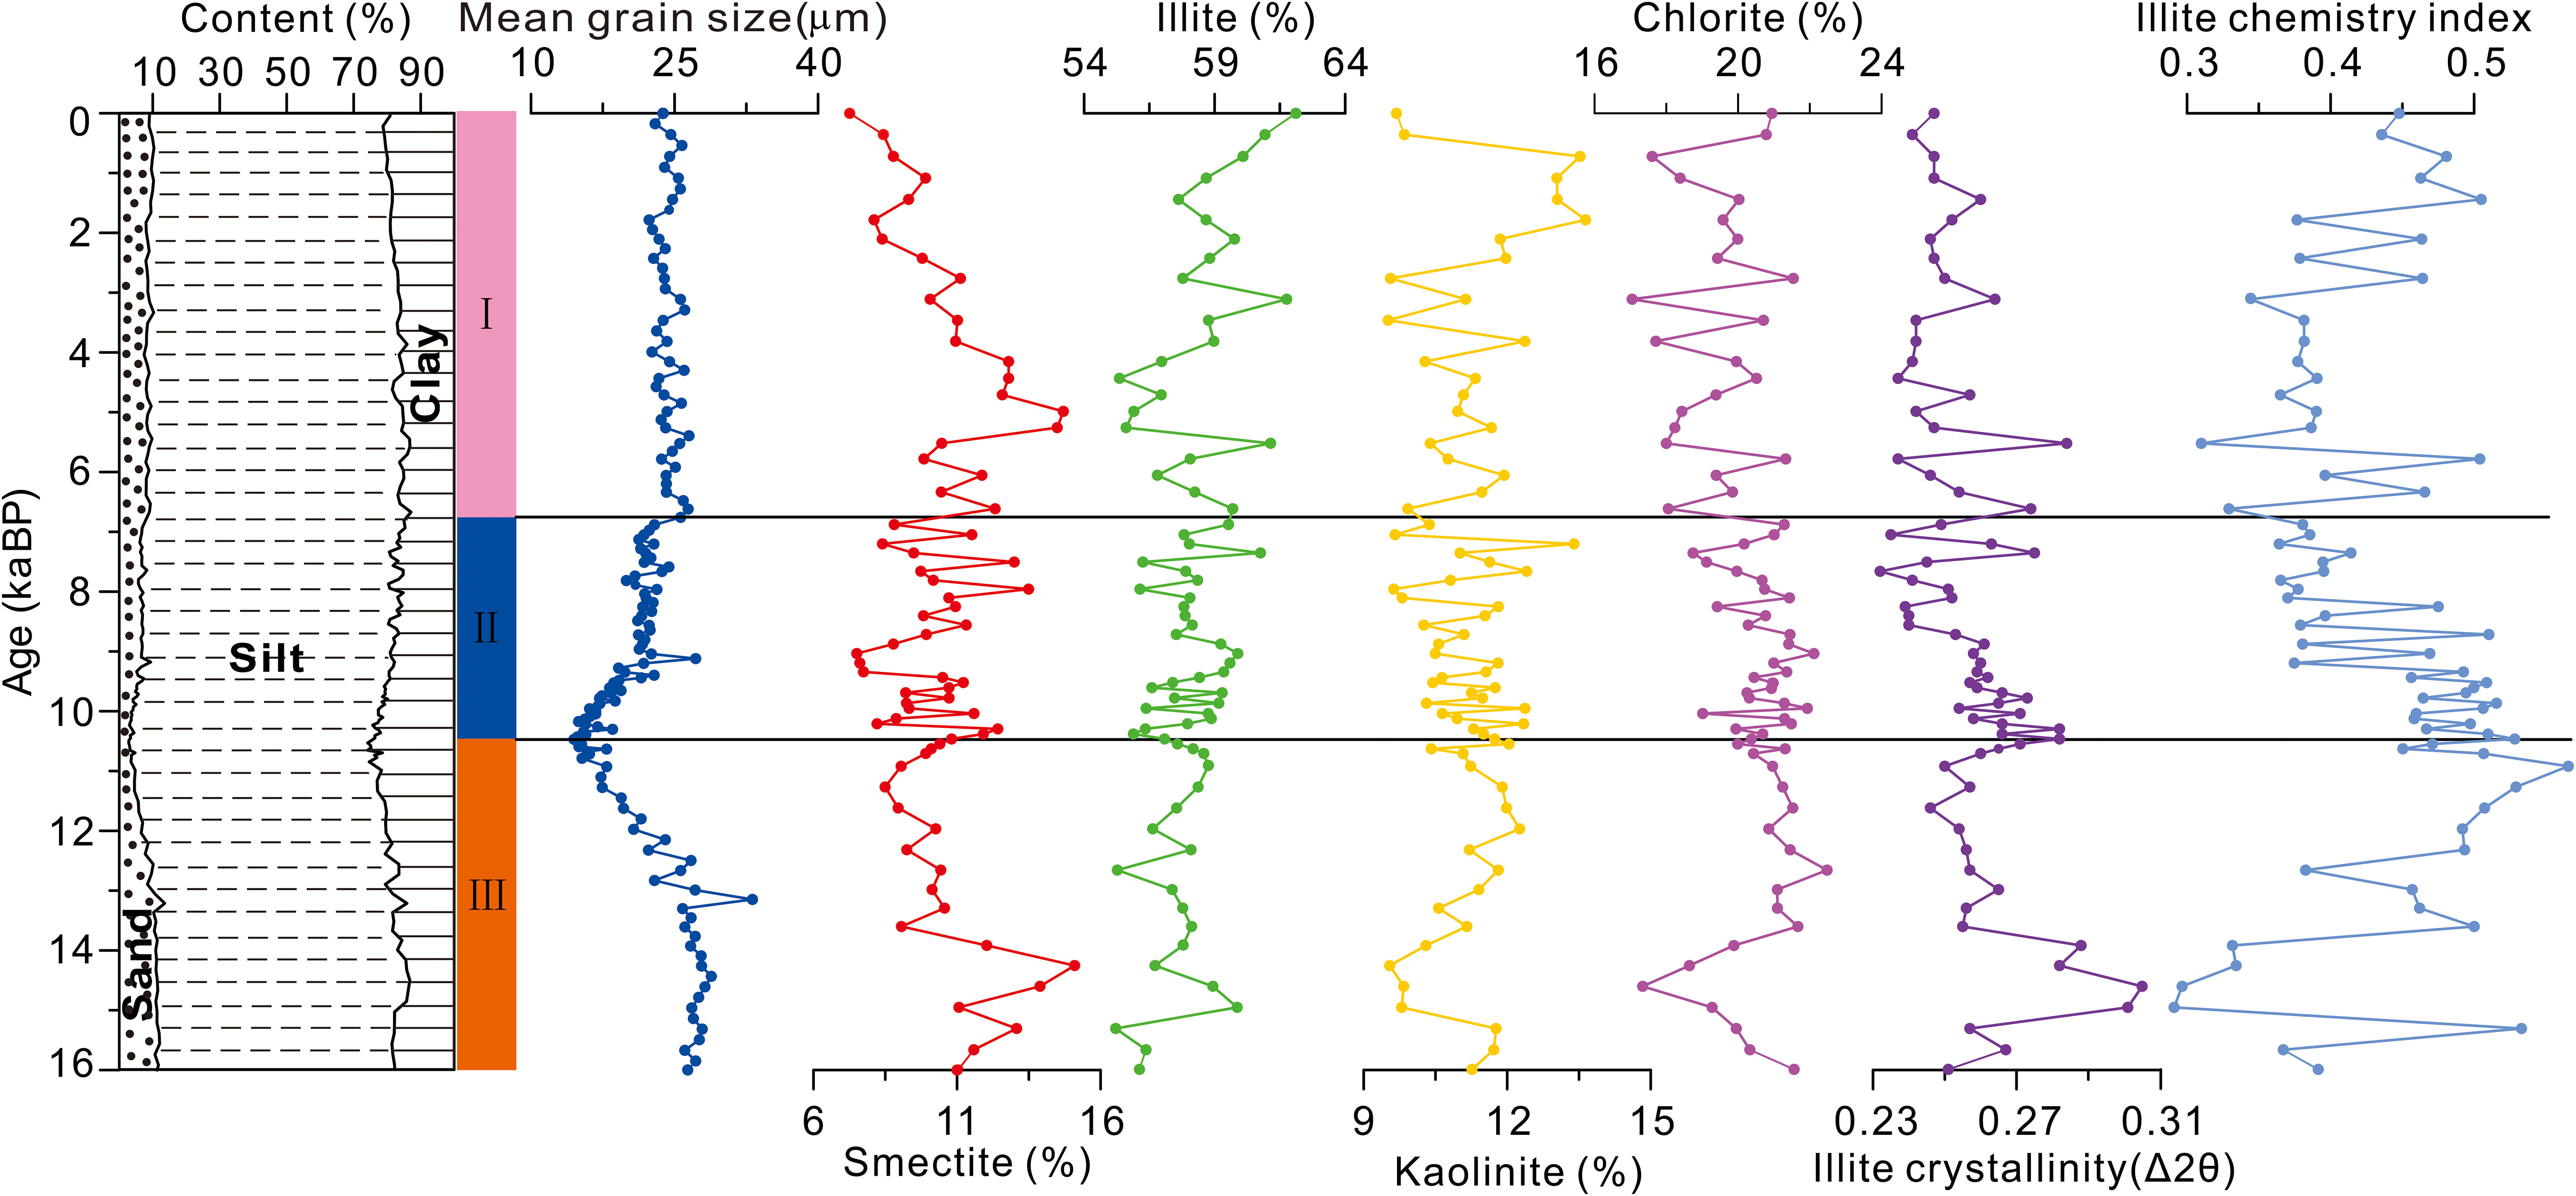
Figure 3 Lithology, mean grain size, clay mineral assemblages, crystallinity index, and chemical index of core SCS18-1.
The coefficient of determination (R²) and mean angular deviation (θ) were calculated to identify the minimal numbers of EMs necessary for a good statistical explanation of the grain size data. A relatively high R2 and low θ indicate a better statistical fit (Paterson and Heslop, 2015).
The results show that EM number = 2 seems to be a turning point, where the value of R2 becomes greater than 0.95 (Figure 4A), indicating that the fitting results reach the 95% confidence level; at higher numbers of EMs, R2 is not significantly changed, indicating that the final EM number should be at least 2. To avoid overfitting, the correlation between the EMs should be as low as possible, and the EM correlation increases significantly when the EM number is ≥ 3 (Figure 4A); thus, the final EM number should be 2-3. The angle deviation (θ) is an index for evaluating the reliability of the EM model, where low θ value indicates a better statistical fit. To make the angle deviation (θ) as small as possible, the average angle deviation should be below 5°. When the EM number is 2, θ > 5° (Figure 4B); when the EM number is 3, θ < 5°. Therefore, when the final EM number is 3, a good fitting effect can be achieved, and the requirements of minimum EM number and maximum reproducibility are satisfied (Paterson and Heslop, 2015; Tanghe, 2016).
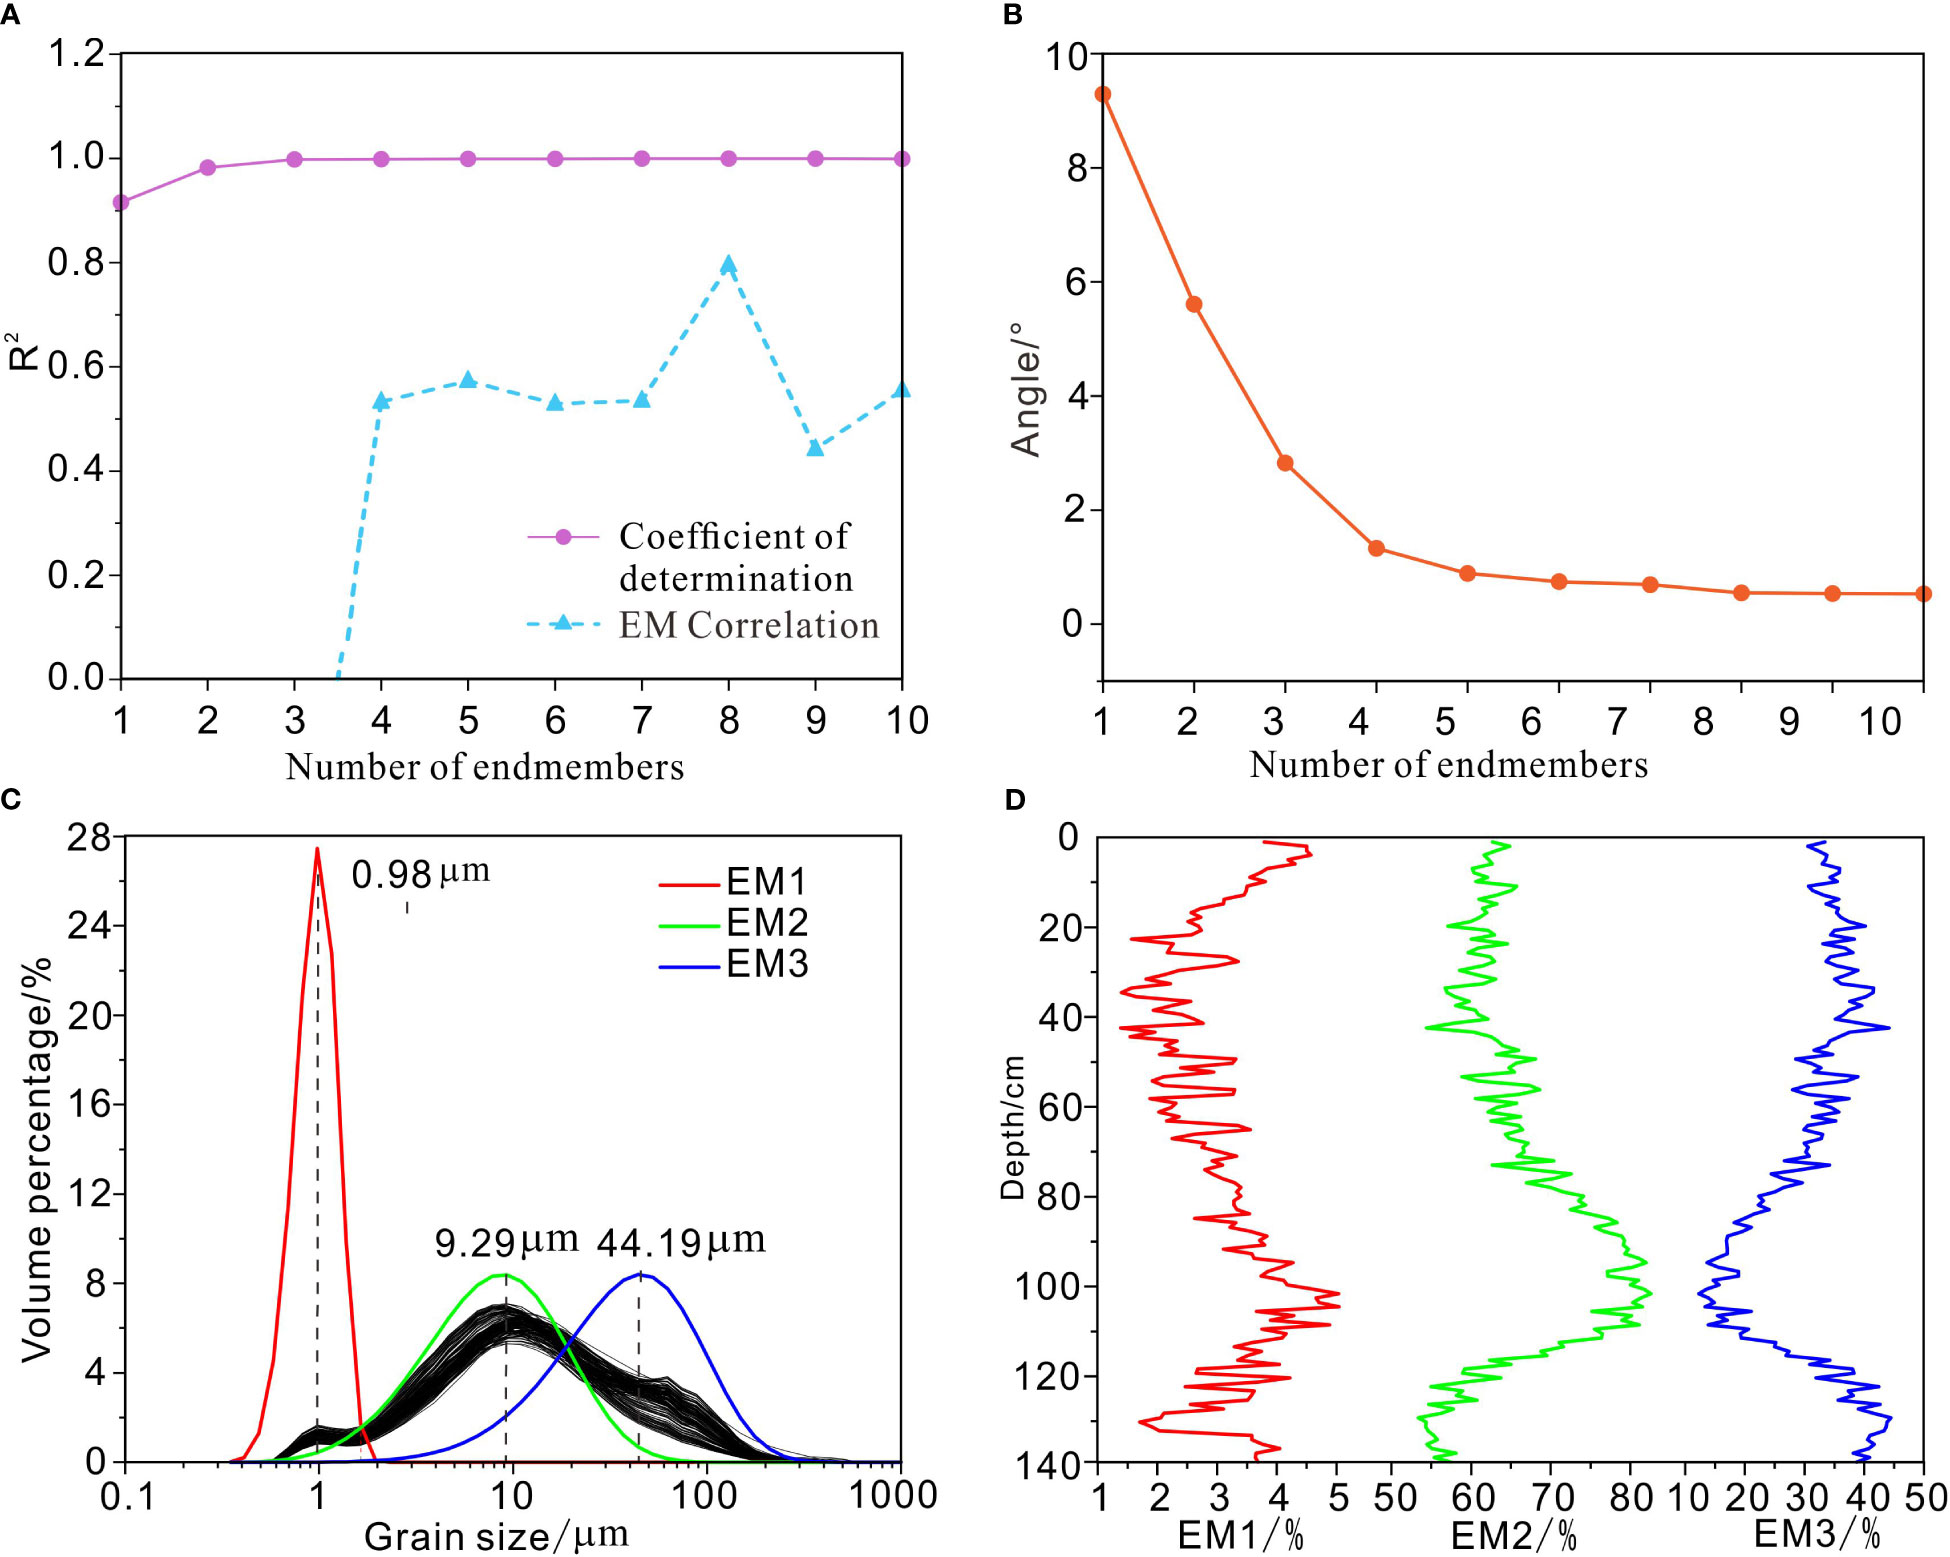
Figure 4 (A) Endmember analysis results of the sediment grain size data from core SCS18-1. Coefficients of determination (R2) plotted against grain size for different endmember solutions, (B) mean angular deviation (θ) in the function of the number of endmembers for a lognormal endmember model, (C) grain size frequency distributions for the endmembers of the three-endmember solution, (D) variation in endmember contributions.
The grain size distribution curves of the simulated EMs (EM1, EM2, and EM3) exhibit an obvious single peak, which has a good corresponding relationship with the grain size distribution of the samples; the mode of the grain size is 0.98 μm, 9.29 μm, and 44.19 μm, respectively (Figure 4C). Figure 4D shows the relative contents of EM3 in core SCS18-1, and the contents of EM1, EM2, and EM3 vary from 1% to 5%, 53% to 83%, and 12% to 45%, with mean values of 3%, 66%, and 31%, respectively. The contents of EM1 and EM2 in the fine EMs follow the same trend, which is opposite to that of EM3. In the range of 103-141 cm, the contents of EM1 and EM2 increase significantly from bottom to top; in the range of 42-103 cm, they decrease; and above 42 cm, they increase. The trends of EM3 in these three stages are opposite.
The SEM results show that the coarse-grained components (30-100 μm) are quartz and feldspar, and the fine-grained components (less than 10 μm) are clay minerals (CMs) (Figure 5), which suggests that EM3 (mode of grain size: 44.19 μm) of core SCS18-1 corresponds to the coarse-grained quartz and feldspar, while EM1 (mode of grain size: 0.98 μm) and EM2 (mode of grain size: 9.29 μm) correspond to the CMs. These results agree well with the grain size analysis results at the adjacent ODP1146 site (Wan et al., 2007b).
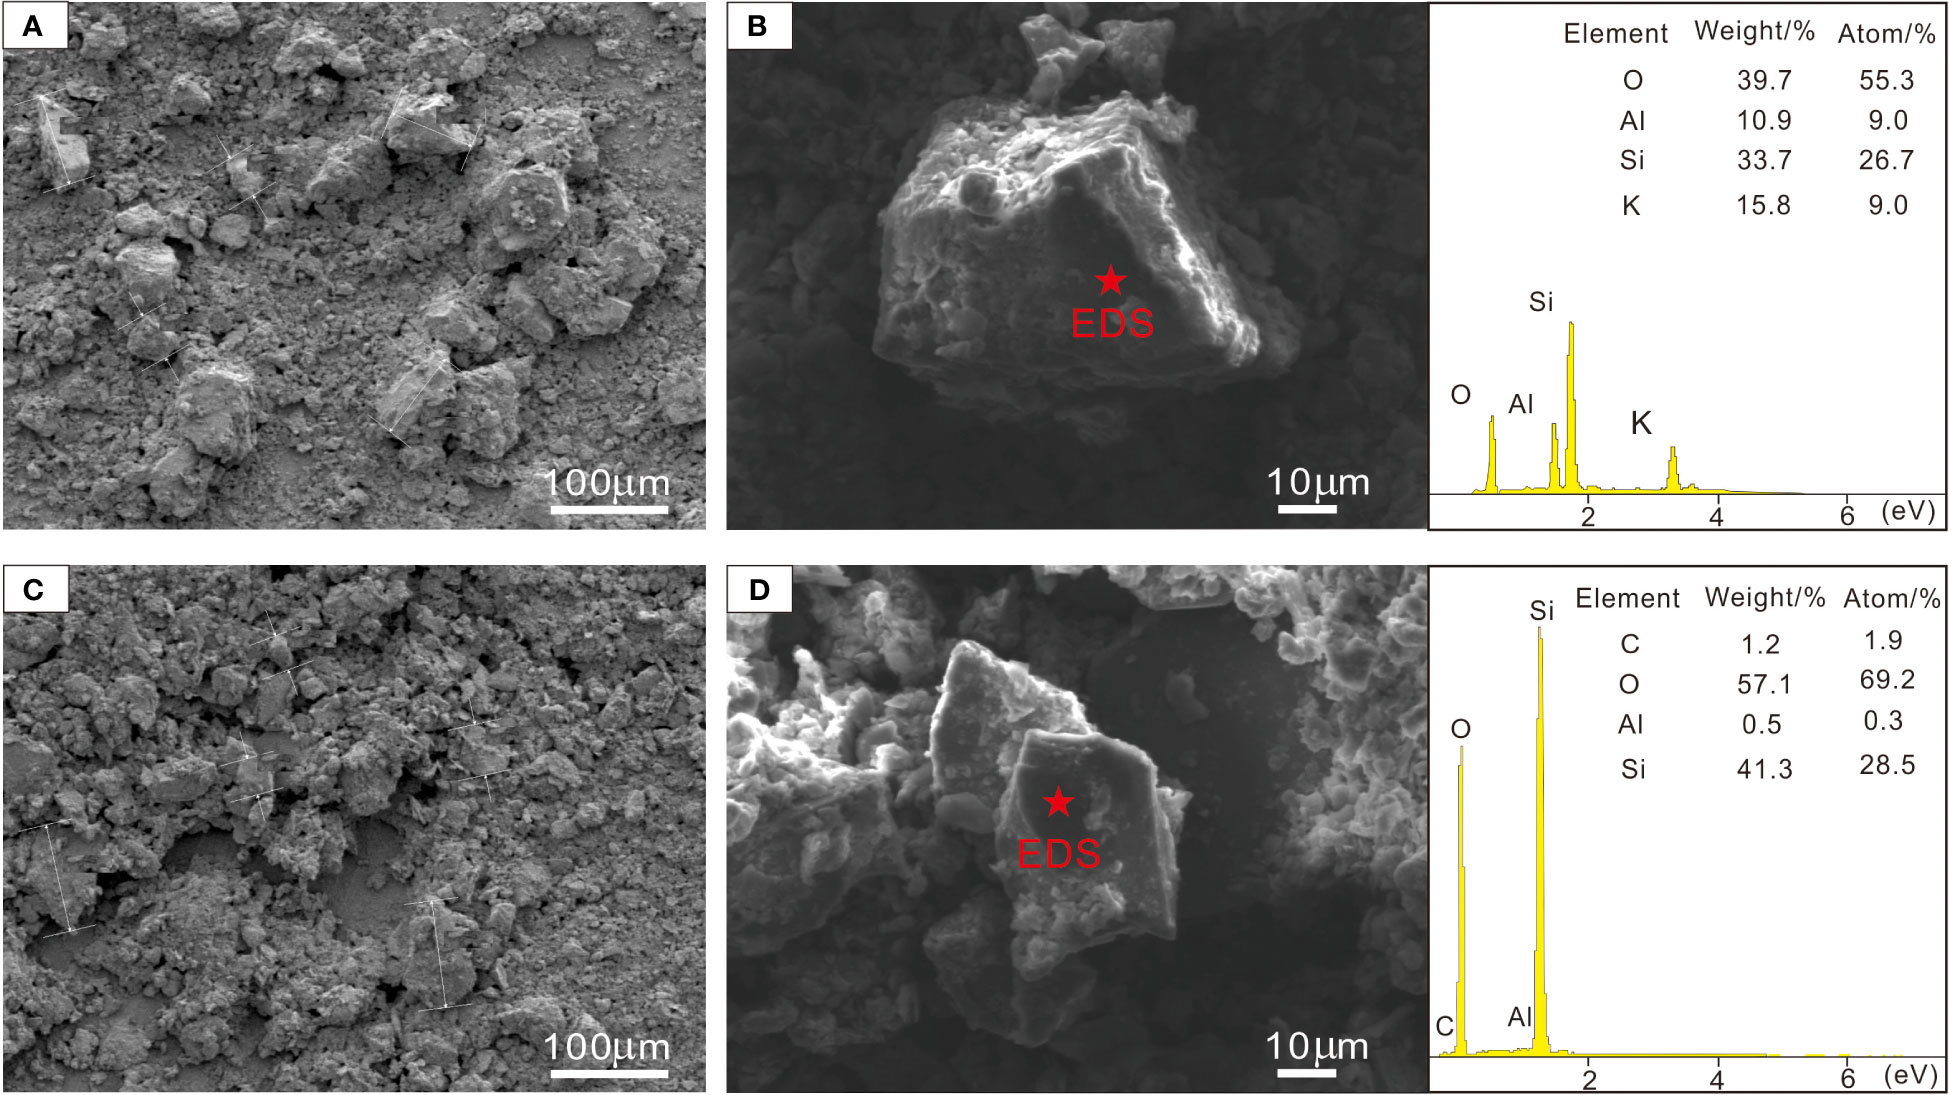
Figure 5 SEM and EDS images of sediments from core SCS18-1. (A, B) The SEM and EDS images sediments from core SCS18-1 at 40 cm depth. (C, D) SEM and EDS images of sediments from core SCS18-1 at 80 cm depth.
4.3 Clay minerals
The X-ray diffraction (XRD) analysis results show that the clay minerals of core SCS18-1 (< 2 μm) mainly comprise illite, chlorite, kaolinite, and smectite. The illite content is 55.2-62.1%, averaging 58.1%; the chlorite content is 17.1-22.5%, averaging 20.3%; the kaolinite content is 9.5-12.6%, averaging 11.2%; and the smectite content is 7.3-15.1%, averaging 10.5%. The illite chemistry index ranges from 0.29 to 0.57 (mean value: 0.43) and is usually less than 0.50, indicating that illite is rich in Fe–Mg (such as biotite and mica) and that it predominantly originated from physical erosion. The illite crystallinity ranges from 0.23 to 0.31°Δ2θ, averaging 0.26°Δ2θ, and the crystallinity is excellent, indicating strong physical weathering in the source area. As shown in Figure 3, smectite and illite exhibit opposite trends, however the trends of kaolinite and chlorite are not significantly correlated with the trends of other clay minerals.
5 Discussion
5.1 Material source and transport mechanism
Among the terrigenous clastic particles in oceans, clay minerals are the most important because they are widely distributed in almost all oceanic environments and record climate and environmental evolution information; therefore, they have been applied successfully to study sediment sources, oceanic current transport and paleoclimate evolution (Liu et al., 2010; Wan et al., 2012a). The clay minerals in core SCS18-1 are all terrigenous clastic sediments, and the influence of diagenesis can be ignored. Numerous studies have shown that the Pearl River, Taiwan, and Luzon are the main sources of terrigenous clastic sediments in the northern SCS (Liu et al., 2010b). The Mekong River materials and central Vietnamese river materials have difficulty reaching the northern continental shelf and continental slope area of the SCS (Liu et al., 2010c), and due to blocking by the island of Hainan, the detrital materials imported by the Red River are mainly deposited in the Beibu Gulf Basin, Yinggehai Basin, and Qiongdongnan Basin in the northwestern part of the SCS (Shao et al., 2013). In summary, the provenance regions of CMs in core SCS18-1 mainly include Taiwan, the Pearl River, and the Luzon rivers.
In the Taiwan sediments, the clay mineral assemblage consists mainly of illite (71%) and chlorite (26%) with very little kaolinite (3%) and almost no smectite. In the Pearl River sediment, the clay mineral assemblages have a high kaolinite content (35.7% on average) with illite, chlorite, and smectite contents of 41.6%, 21.0%, and 1.7%, respectively (Liu et al., 2007), while in the Luzon sediments, the clay mineral assemblage are mainly composed of smectite (75%) with a small amount of kaolinite (15%) and chlorite (7%) and almost no illite (3%) (Liu et al., 2010c).
The smectite–(illite+chlorite)–kaolinite triangle diagram (Figure 6) shows that the composition and contents of CMs in core SCS18-1 are essentially the same. Every sample from core SCS18-1 is distributed in the area between three potential sources (Taiwan, the Pearl River, and Luzon), suggesting a possible mix of the above three sources (Figure 6).
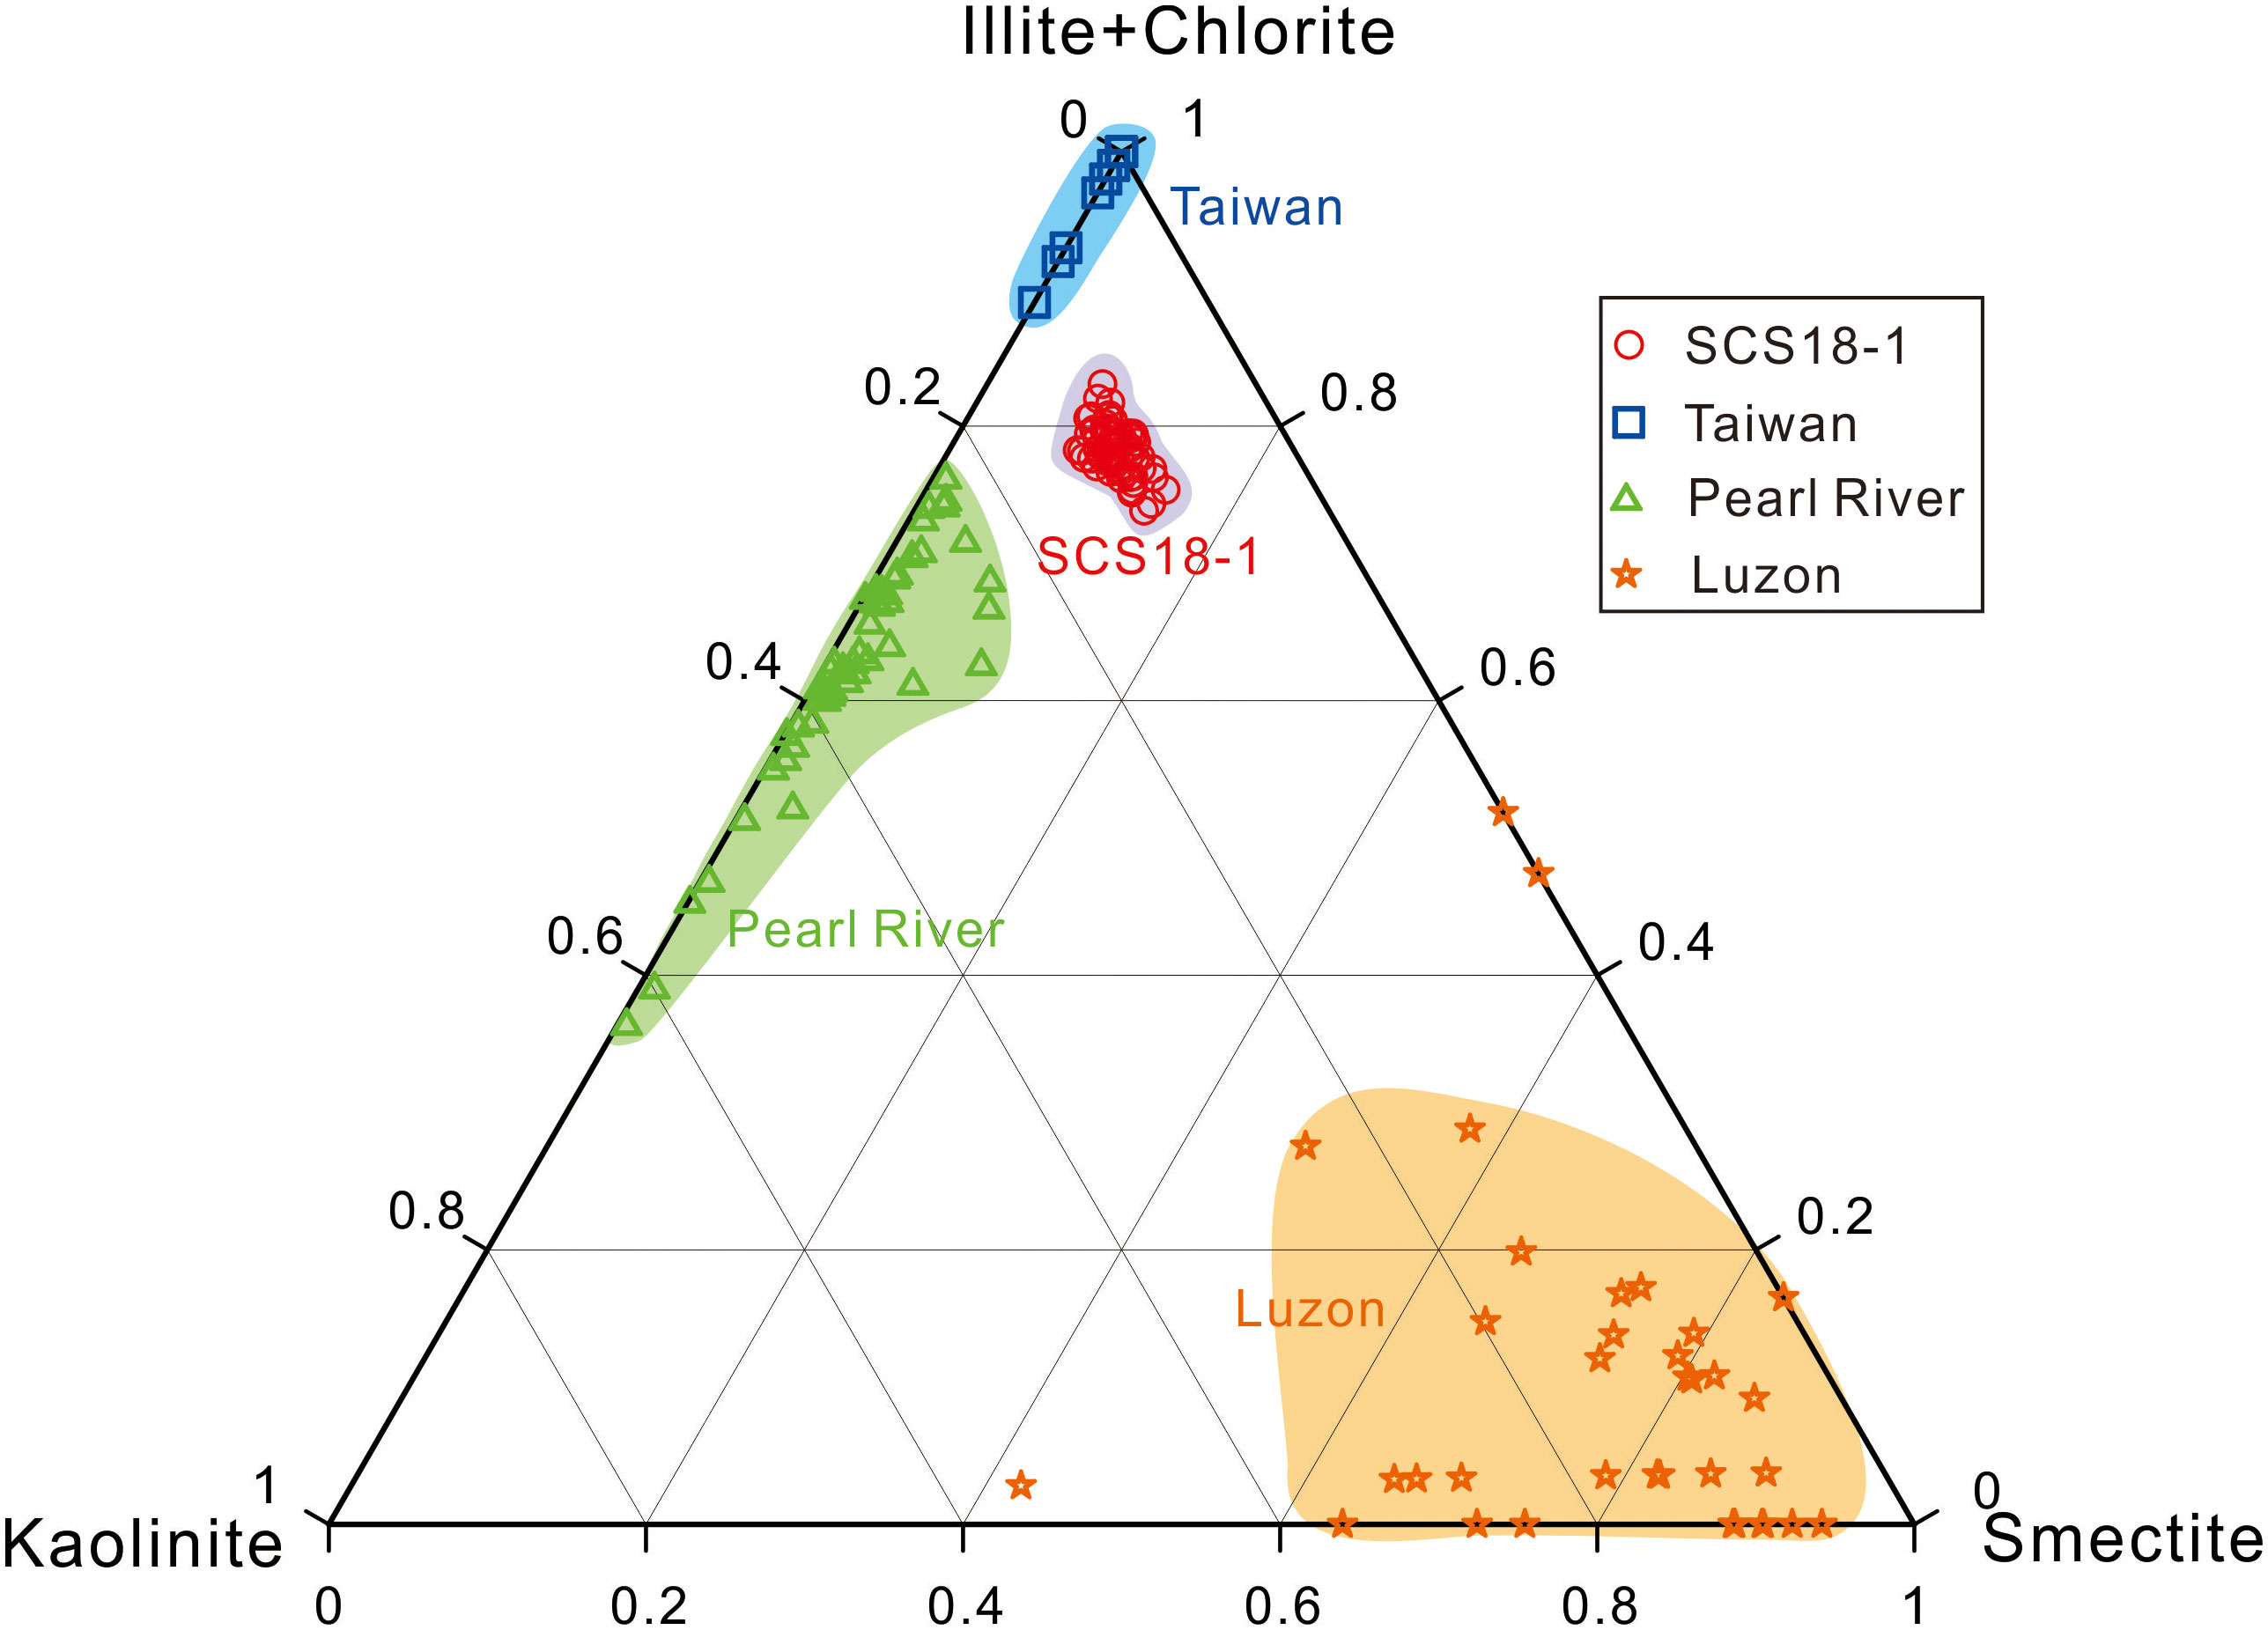
Figure 6 Ternary diagram of the major clay mineral groups illite+ chlorite, kaolinite, and smectite. Data of the Pearl River are from Liu et al. (2007); data of the Luzon rivers are from Liu et al. (2009); data of the Taiwan River are from Li et al. (2012); the referenced data have been converted according to Biscaye (1965).
5.1.1 Smectite
The smectite content in core SCS18-1 is 7.3-15.1%, averaging 10.4% (Figure 3). For the provenance areas, the Pearl River and Taiwan contain almost no or very low smectite (Liu et al., 2007; Li et al., 2012; Hu et al., 2014), while the smectite content in the Luzon river sediments is as high as 75% (Liu et al., 2009). The smectite of Luzon can be transported from south to north by the surface ocean current of the Kuroshio branch current in the SCS after the Kuroshio intrusion (Liu et al., 2010b), and concentrated subsidence occurs on the land slope and outer shelf in the northern part of the SCS due to topographic blockage (Liu and Li, 2011), thus providing smectite for core SCS18-1.
5.1.2 Kaolinite
The kaolinite content in core SCS18-1 is 9.5-12.6%, averaging 11.2%. Considering that the kaolinite content gradually decreases because of flocculation and sedimentation during the process of kaolinite entering the sea and transportation (Liu et al., 2007), the kaolinite content must be much higher in the provenance areas than in core SCS18-1. Among the three potential provenance areas, only the Pearl River has high kaolinite content. Therefore, the Pearl River may be the main provenance area of kaolinite in core SCS18-1, since the average kaolinite content in the Pearl River Basin is 35.7%, but additions from the Luzon river source cannot be excluded. Assuming that all kaolinite of the study area is from the Pearl River, then only the contribution of Pearl River contributes more than 31.4% to this area. The kaolinite of core SCS18-1 is 11.2%. The calculation is as follows: 31.4% (contribution percentage of Pearl River)×35.7% (the content of kaolinite in Pearl River) =11.2% (the content of kaolinite in SCS18-1).
The Pearl River material, after entering the sea, is mainly transported westward by the influence of the Guangdong coastal current and the SCS nearshore current and deposited within the coastal shelf between the mouth of the Pearl River and the northeast side of Hainan (water depth of less than 50 m) (Ge et al., 2014).
5.1.3 Illite+chlorite
The illite+chlorite in the northern part of the SCS is affected by the coastal current of Guangdong, the Kuroshio branch current in the SCS, and the deep current in winter and is transported southwestward at water depths of 100 m and 2000-2500 m. The spatial distribution of illite+chlorite content in the northern SCS displays a double tongue-shaped pattern extending from offshore Taiwan to the southwest (Liu et al., 2010c), indicating that Taiwan might be the main provenance area of illite and chlorite in the northern SCS. The illite+chlorite content in core SCS18-1 is as high as 78.3%, and only Taiwan (with an average illite+chlorite content of 96%) could provide such a high content of illite and chlorite, indicating that the illite and chlorite in core SCS18-1 sediments are mainly from Taiwan, which is consistent with the results of Cao et al. (2018) and Liu et al. (2010b). In addition, after conversion using the method in Biscaye (1965), the content of illite and chlorite in the Pearl River is approximately 62.6%, so the possibility that the Pearl River could provide illite and chlorite to the study area cannot be excluded.
The illite crystallinity and illite chemistry index have also been widely used to indicate weathering intensity and trace sources (Wan et al., 2012b; Wang and Yang, 2013). An illite chemistry index of less than 0.5 represents Fe–Mg-rich illite, which results from physical erosion, and an illite chemistry index greater than 0.5 represents Al-rich illite, which represents strong hydrolysis. Low illite crystallinity indicates high crystallinity, indicating weak hydrolysis of the terrestrial provenance area in a dry and cold climate, and vice versa (Hu et al., 2014). The Pearl River illite has a high illite chemistry index from 0.43 to 0.8, averaging 0.59, due to long exposure to warm, humid climatic conditions and strong chemical weathering (Liu et al., 2007). The physical weathering or mechanical denudation of Taiwan is very strong because of tectonic activity and monsoon/typhoon rainfall; thus, the illite of Taiwan has a low chemistry index that ranges from 0.4 to 0.63 (the average is 0.5) (Li et al., 2012). To further clarify the material source of illite in core SCS18-1, the illite crystallinity and chemical index of core SCS18-1 are compared with those of two potential provenance areas in Taiwan and the Pearl River, and the results show that the most likely source is Taiwan (Figure 7A), followed by the Pearl River. Since illite and chlorite in the northern SCS have the same material source (Chen, 1978; Liu et al., 2003; Liu et al., 2016), it can be inferred that the illite and chlorite in the CMs of core SCS18-1 are mainly from Taiwan, followed by the Pearl River.
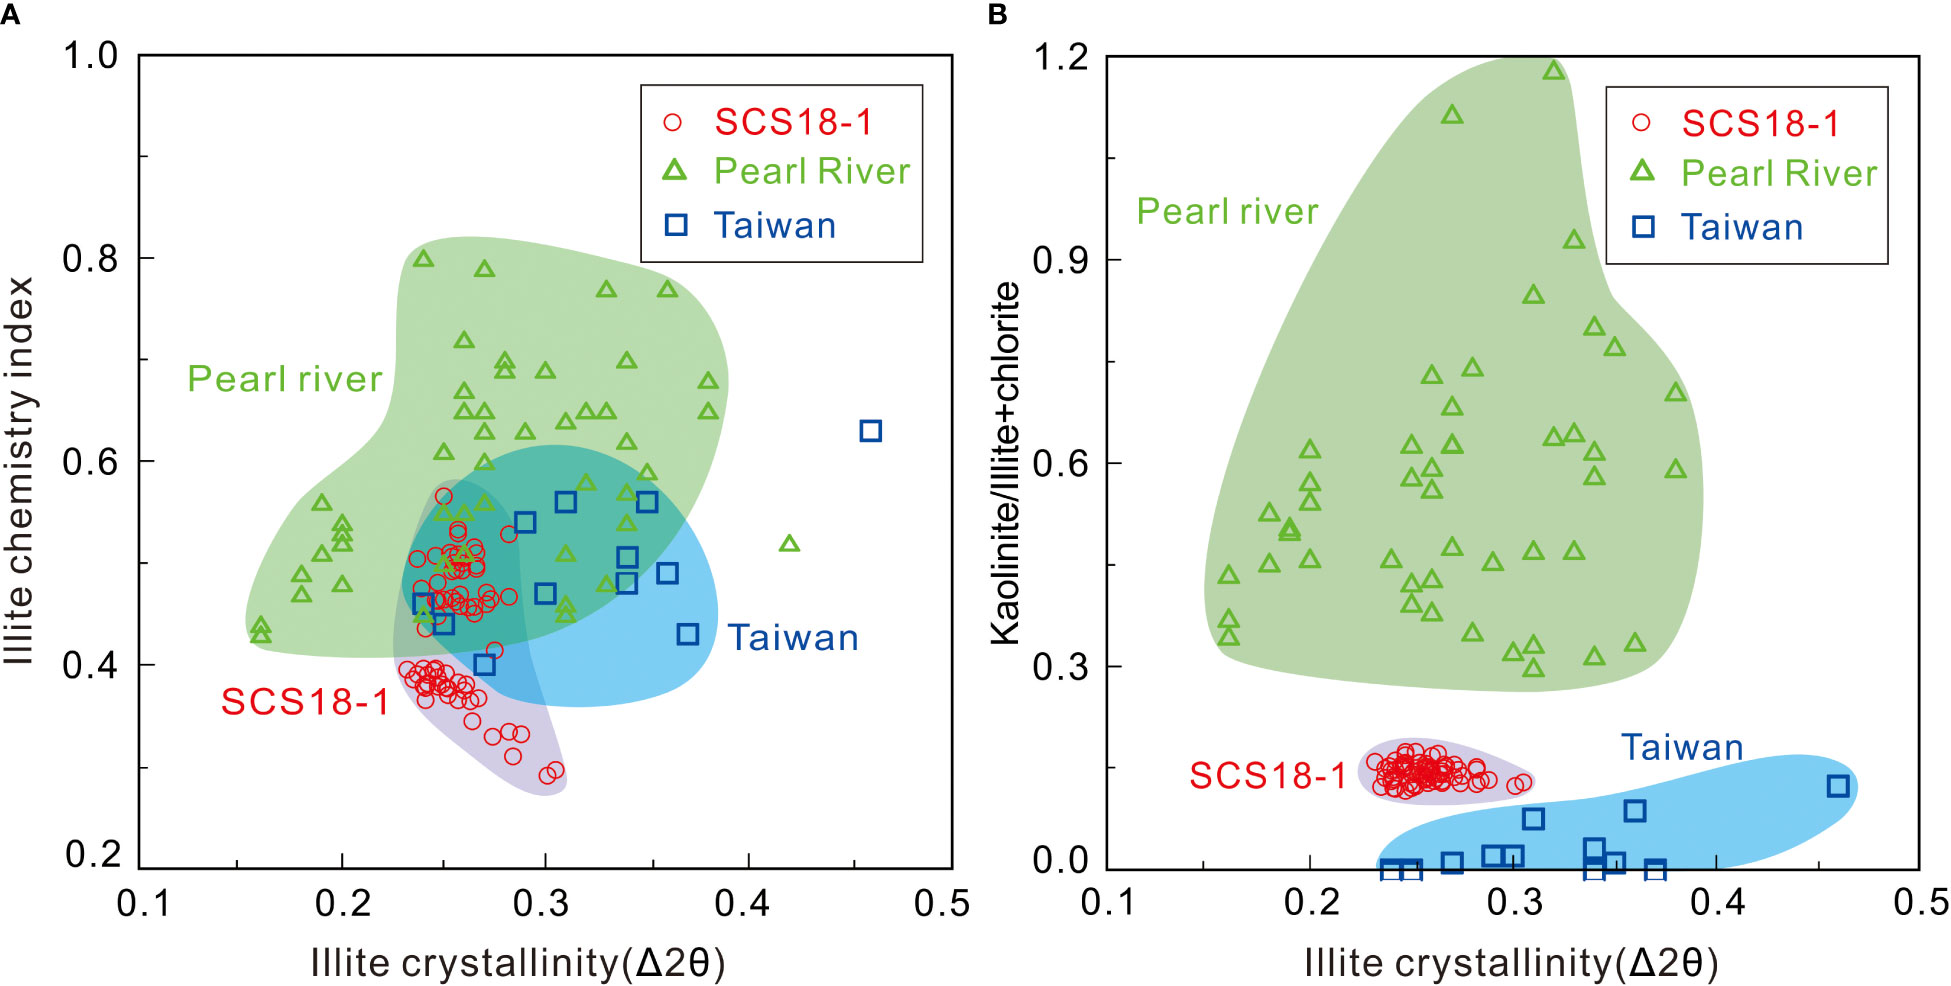
Figure 7 Correlation of illite crystallinity with the (A) illite chemical index and (B) kaolinite/illite+chlorite ratio in argillaceous sediments from core SCS18-1. River sediments from Taiwan rivers (Li et al., 2012), the Pearl River (Liu et al., 2007), and Luzon (Liu et al., 2009); the referenced data have been converted according to Biscaye (1965).
Kaolinite is generally formed through chemical weathering, while illite and chlorite are mainly formed by the physical weathering of the parent rock. Therefore, the ratio of kaolinite/(illite+chlorite) can be used to indicate the type of weathering, the higher the ratio is, the stronger the chemical weathering and the weaker the physical weathering, and vice versa (Huang et al., 2011; Alizai et al., 2012; Hu et al., 2014). Illite+chlorite and kaolinite are characteristic minerals of the rivers in southwestern Taiwan and the Pearl River, respectively (Liu et al., 2008). Therefore, the ratio of kaolinite/(illite+chlorite) can be used to determine the main contributions of these two source EMs to the CMs at the research station (Wan et al., 2010). Comparing illite crystallinity and kaolinite/(illite+chlorite) (Figure 7B) shows that core SCS18-1 is located between the Taiwanese rivers and the Pearl River and is closer to Taiwan, indicating that the CMs of the sediments in core SCS18-1 are mainly from Taiwan: however, a Pearl River contribution cannot be dismissed. The results of studies on the material sources of the adjacent ODP1144 (Liu et al., 2010b; Liu et al., 2013) and STD235 stations (Liu et al., 2018) also suggest that the Pearl River material has a relatively small impact in the northeastern region of the SCS.
According to the data and figure illustrations, the vertical variations(Figure 3) of illite crystallinity and chemical index values (and the clay mineral assemblages) might indicate temporal changes in contributions from different source terranes. Which may be caused by sea-level changes, climate changes, and other factors. While the vertical variations of clay mineral assemblages are inapparent, the distribution of core SCS18-1 in the ternary diagram is relatively concentrated (Figure 6), indicating that the provenance regions of the core sediments were relatively stable and experienced no major changes since the last deglaciation.
In summary, since the last deglaciation, the sources of sediments in core SCS18-1 have remained relatively stable; the sediments are mainly from Taiwan, followed by the Pearl River, and the contribution of Luzon is low. Among them, kaolinite mainly comes from the Pearl River, illite and chlorite mainly come from Taiwan, and smectite mainly originated from Luzon, with a possible certain contribution from the Pearl River.
5.2 Relevance of grain size EM components
Many studies on clay minerals, Nd isotopes, and grain size have shown that the river sediments near the SCS are the primary material source (Boulay et al., 2005; Wan et al., 2007a; Boulay et al., 2007; Shao et al., 2009; Liu et al., 2010b). The contribution of aeolian dust is small but often mentioned by some researchers (Wehausen and Brumsack, 2002; Boulay et al., 2003; Wan et al., 2007b). Numerical simulations have shown that the average contribution of aeolian dust in the northern SCS to the total terrigenous matter can reach 20% (Wan et al., 2007a). Notably, the content of quartz and feldspar in aeolian dust can reach 60-80%, which is far higher than the value of 30% in a river suspension (Li, 1997). Based on the grain size EM and SEM analysis, we conclude that aeolian dust and river sediments contribute to the quartz and feldspar in this study area, and the CMs are mainly related to fluvial input.
Previous studies have found that the “coarse eolian dust” can be transported over long distances from the land to the ocean; the coarsest component is interpreted as aeolian dust, and the finest component is interpreted as mud input by the rivers (Betzer et al., 1988; Stuut et al., 2002; Weltje and Prins, 2003; Stuut et al., 2005). Moreover, for the adjacent station ODP1146, Wan et al. (2007b) interpreted the coarse-grained EMs (mainly quartz and feldspar) as aeolian dust and the fine- and medium-grained EMs (mainly CMs) as fluvial mud and fluvial fines. The modes of the finest and medium-grained EMs are 7.5 μm and 2 μm, respectively, which agree well with the modes for EM2 (mode: 9.29 μm) and EM1 (mode: 0.98 μm) in this paper. Therefore, for core SCS18-1, the coarse-grained EM, i.e., EM3 with quartz and feldspar as the main components, is from the aeolian dust, while the fine-grained and medium-grained EMs, i.e., EM1 and EM2 with CMs as the main component, are from muddy and fine silt sediments of fluvial input, respectively.
5.3 Relevance of environmental indicators
It is generally believed that the CMs in the sediments of the northern SCS mainly come from the river input, and the river input intensity can to some extent indicate the EASM intensity (Liu et al., 2003; Wan et al., 2007b). The illite chemistry index in the CMs indicates chemical weathering in the provenance areas; therefore, the EASM also has a certain influence. On the other hand, a stronger EASM can bring more coarse-grained aeolian dust from the Asian inland or the bare, shallow sea shelf area during a low sea-level period, which could increase the contribution of coarse-grained EMs. Therefore, in this paper, the simulated coarse-grained EM3, characterizes the intensity change in the winter monsoon, and EM1+EM2, which represents the terrigenous river material, indicates the intensity change in the summer monsoon.
In core SCS18-1, the changes in the relative content of EM1+EM2 and the illite chemistry index are identical. The relative content of EM1+EM2 and the illite chemistry index increased rapidly after 16.1 ka BP, reached a maximum value at 10.6 ka BP, and then rapidly decreased. From 6.8 ka BP to the present, the two slightly increase, and the relative content of EM3 has the opposite trend.
In stage I (16.1-10.6 ka BP), the sea level gradually increased by nearly 100 m (Figure 8F), and the estuary of the Pearl River left the study area, precluding the transport of Pearl River material to the study site. However, during stage I, EM1+EM2, which represents fluvial material, increases (Figure 8A), and the sedimentation rate of core SCS18-1 significantly increase, indicating an increase in fluvial material input, which in turn indicates that the Pearl River is not the main provenance area at this study location. Because of the narrow Taiwan shelf, a 100 m sea-level rise cannot significantly affect the location of the estuary (Figure 1B); therefore, the sea-level change since 16.1 ka BP has a slight effect on the distance between the river estuary in Taiwan and core SCS18-1, which indicates that the material from core SCS18-1 is mainly from Taiwan, not from the Pearl River. Since the last deglaciation, the EASM (Figures 8C, D) and the solar radiation in the Northern Hemisphere have gradually become stronger (Figure 8H). By the early Holocene, the East Asian monsoon reached its peak (Dykoski et al., 2005), and the strong summer monsoon inevitably brought heavy rainfall and enhanced river supply capacity, which, together with the increased typhoon events during this period, led to increased soil erosion in Taiwan (Huang et al., 2015). As a result, for core SCS18-1, the total amount of terrigenous detrital material from Taiwan increased, i.e., the relative content of EM1+EM2, representing fluvial material, increased (Figure 8A), and the sedimentation rate reached a maximum near 10.6 ka BP (Figure 8I). At the same time, because of the sea-level rise, many shallow marine areas from the west of Taiwan to the Zhongsha Islands were submerged, resulting in the transport of land-derived clastic sediments over longer distances. Thus, although the terrestrial material increased, the sediment particles became finer (Figure 8G). In addition, the global warming at the beginning of the Holocene and the strengthening of the EASM (Figures 8C, D) correspond well to the enhanced illite chemistry index of core SCS18-1 (Figure 8B). Notably, the winter monsoon index was augmented (Figure 8E), and in general, the EM3 content, which represents the contribution of aeolian dust, should also increase, but the relative EM3 content tended to decrease at this stage (Figure 4D). By combining this result with the increase in sedimentation rate at this stage (Figure 8I), we speculate that the decrease in EM3 content is caused far more by the increase in the amount of river input than by the increase in the amount of aeolian dust input.
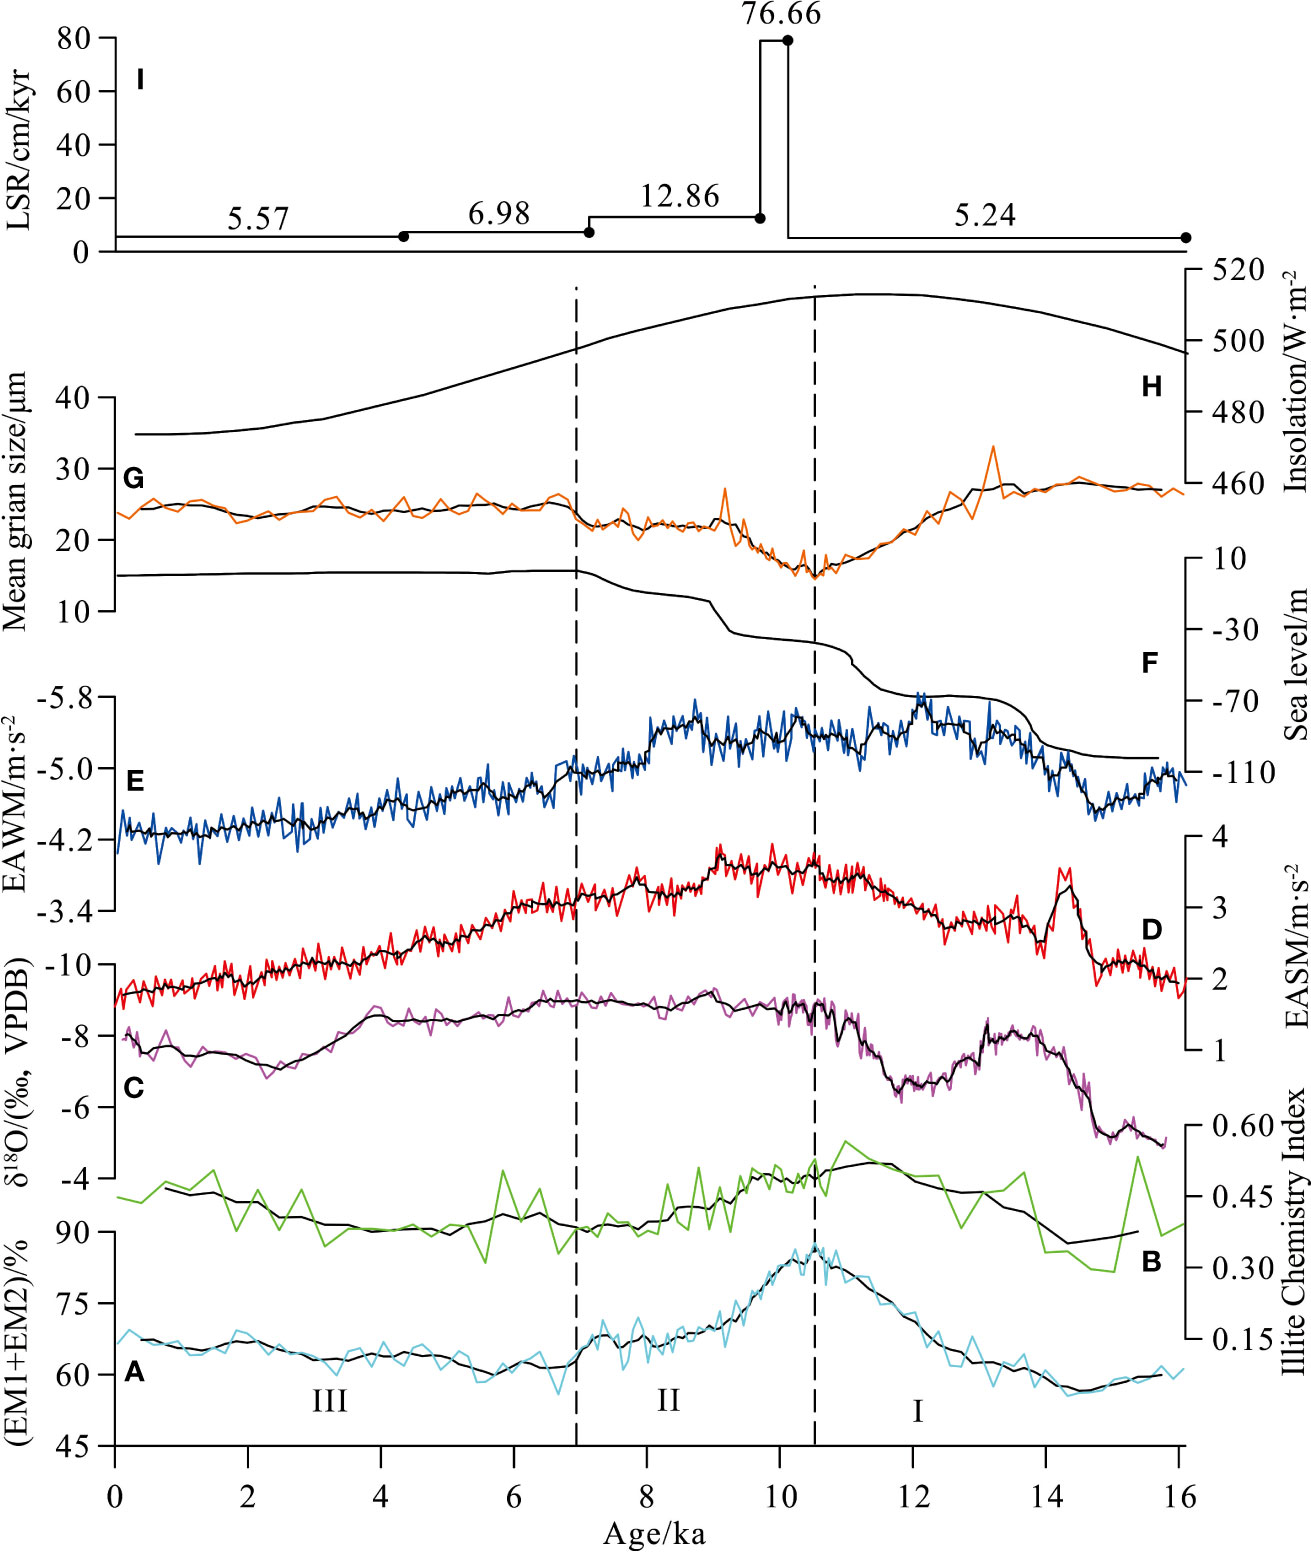
Figure 8 Temporal variations in (A) EM1+EM2 in core SCS18-1, (B) illite chemistry index in core SCS18-1, (C) δ18O values of Dongge Cave stalagmites (Yuan et al., 2004), (D) EASM wind indices in TRACE21 (Wen et al., 2016), (E) EAWM wind indices in TRACE21 (Wen et al., 2016), (F) sea level (Liu et al., 2004; Zong, 2004), (G) mean grain size in core SCS18-1, (H) 30°N insolation (Berger and Loutre, 1991), and (I) linear sedimentation rate (LSR) of core SCS18-1. The thick solid lines are several points of the moving average curve.
In stage II (10.6-6.8 ka BP), during the Holocene, the global climate changed to warm, hot, and humid; vegetation was extensively developed; the range of weathering and denudation decreased, and the amount of terrigenous material suddenly decreased; the sea level rose (Figure 8F); the shoreline was pushed landward; and the sediment supply was drastically reduced (Huang et al., 2013). As a result, the sedimentation rate of core SCS18-1 decreased (Figure 8I), and the contribution of EM1+EM2, representing the river material, decreased (Figure 8A). Overall, the illite chemistry index of core SCS18-1 also decreased during this stage, which corresponds well to the gradual weakening of the EASM (Figures 8C, D).
In stage III (6.8-0 ka BP), since the Holocene (6.8 ka BP), the sea level has been stable at its highest level, and the outcropping area of the continental shelf is small; meanwhile, because of the weakening of the summer and winter monsoons (Figures 8D, E), the transport capacity of rivers and winds is reduced; therefore, the sedimentation rate of core SCS18-1 is low and has slightly decreased since 6.8 ka BP. Notably, the relative contribution of EM1+EM2 at core SCS18-1, representing riverine material, has weakly increased since 6.8 ka BP, but this trend may be caused by a relatively large reduction in the contribution of the aeolian dust (EM3).
In summary, the sedimentation process of core SCS18-1 is relatively continuous, and information on the material source and environmental evolution in the north slope of the SCS since the last deglaciation is well recorded. The relative content of EM1+EM2 and the illite chemistry index, representing riverine material, can effectively reflect the change of the EASM, and the relative content of EM3, representing aeolian dust, can effectively reflect the change of the EAWM. Thus, this study reconstructed the intensity changes of EASM and EAWM since the last deglaciation. During stage I (16.1-10.6 ka BP), the EASM and EAWM grew stronger, while since 10.6 ka BP, the EASM and EAWM have exhibited a weakening trend. Furthermore, these proxies could also reflect the variations in ocean currents. On the orbital scale, the change in East Asian summer and winter monsoon intensities is closely related to the solar radiation in the Northern Hemisphere (Figure 8H) (Wang et al., 2008; Wen et al., 2016). Therefore, the amount of supplied material in core SCS18-1 may be closely related to changing solar radiation in the Northern Hemisphere.
6 Conclusions
The grain size information of core SCS18-1 was analyzed by endmember modeling analysis, and combined with clay mineralogical methods, the provenances of the sediment in the Beipo seamount of the SCS since the last deglaciation and its paleoenvironmental conditions were explored. The following conclusions were drawn:
1. The grain size of core SCS18-1 can be divided into three endmembers, EM1, EM2, and EM3, among which fine-grained EM1 and medium-coarse-grained EM2 are mainly fluvial mud and fluvial fine silt, and the coarse-grained EM3 is mainly aeolian dust. The average grain size of core SCS18-1 is predominantly controlled by the coarse-grained EM3 with quartz and feldspar as the major components.
2. Since the last deglaciation, the sediments of core SCS18-1 have been mainly derived from fluvial input, with some contributions from aeolian input. Its clay minerals mainly originate from Taiwan, followed by the Pearl River, and Luzon Island contributes less. Among these minerals, kaolinite is mainly from the Pearl River; illite and chlorite are mainly from Taiwan, with some contribution from the Pearl River; and smectite is mainly from Luzon Island.
3. The sediments of core SCS18-1 provide a complete record of the provenance and paleoenvironmental evolution of the Beipo seamount since the last glaciation. The fluvial materials, represented by the relative content of EM1+EM2, and the illite chemical index can effectively reflect the changes in the East Asian summer monsoon. The aeolian materials, represented by the relative content of EM3, can effectively reflect the changes in the EAWM. The material supply of core SCS18-1 is mainly controlled by the amount of solar radiation in the Northern Hemisphere.
Data availability statement
The original contributions presented in the study are included in the article/supplementary material. Further inquiries can be directed to the corresponding authors.
Author contributions
XT: Conceptualization, Methodology, Validation, Formal analysis, Investigation, Resources, Writing–original draft, Writing–review and editing. XZ: Conceptualization, Methodology, Validation, Writing–review and editing, Supervision, Funding acquisition. JW: Conceptualization, Data curation, Writing–review and editing. ZS: Data curation, Writing–review and editing. ML: Conceptualization, Methodology, Data curation. JZ: Conceptualization, Methodology, Writing–review and editing, Supervision. LZ: Conceptualization, Writing–review & editing. DF: Conceptualization, Methodology, Data curation, Supervision. FX: Conceptualization, Methodology, Validation, Writing – review and editing, Supervision, Funding acquisition. All authors contributed to the article and approved the submitted version.
Funding
This study was jointly supported by the Shandong Provincial Natural Science Foundation of China (ZR2020MD062), the National Key Research and Development Program of China (2016YFA0600904), the Project of the China. Geological Survey (DD20221701), the National Natural Science Foundation of China (42176057), and a Central Government-Led Local Science andTechnology Development Foundation (ZY2021HN04).
Acknowledgments
We would like to thank Editor ML, XJ and GÚ for their constructive comments and reviews of the earlier versions of this paper.
Conflict of interest
The authors declare that the research was conducted in the absence of any commercial or financial relationships that could be construed as a potential conflict of interest.
Publisher’s note
All claims expressed in this article are solely those of the authors and do not necessarily represent those of their affiliated organizations, or those of the publisher, the editors and the reviewers. Any product that may be evaluated in this article, or claim that may be made by its manufacturer, is not guaranteed or endorsed by the publisher.
References
Alizai A., Hillier S., Clift P. D., Giosan L., Hurst A., VanLaningham S., et al. (2012). Clay mineral variations in Holocene terrestrial sediments from the indus basin. Quaternary Res. 77 (3), 368–381. doi: 10.1016/j.yqres.2012.01.008
Berger A., Loutre M. F. (1991). Insolation values for the climate of the last 10 million years. Quaternary Sci. Rev. 10 (4), 297–317. doi: 10.1016/0277-3791(91)90033-Q
Betzer P. R., Carder K. L., Duce R. A., Merrill J. T., Tindale N. W., Uematsu M., et al. (1988). Long-range transport of giant mineral aerosol particles. Nature. 336 (6199), 568–571. doi: 10.1038/336568a0
Biscaye P. E. (1965). Mineralogy and sedimentation of recent deep-sea clay in the Atlantic ocean and adjacent seas and oceans. Geological Soc. America Bulletin. 76 (7), 803–832. doi: 10.1130/0016-7606(1965)76[803:MASORD]2.0.CO;2
Blaauw M., Christen J. A. (2011). Flexible paleoclimate age-depth models using an autoregressive gamma process. Bayesian Anal. 6 (3), 457–474. doi: 10.1214/ba/1339616472
Boulay S., Blum P., Christophe C., Alain T., Wang P. X., Pluquet F., et al. (2003). Mineralogy and sedimentology of pleistocene sediment in the south China Sea (ODP site 1144). Proc. Ocean Drilling Program: Sci. Results. 184 (211), 1–21. doi: 10.2973/odp.proc.sr.184.211.2003
Boulay S., Colin C., Trentesaux A., Frank N., Liu Z. F. (2005). Sediment sources and East Asian monsoon intensity over the last 450 ky. mineralogical and geochemical investigations on south China Sea sediments. Paleogeogr Palaeoclimatol Palaeoecol. 228 (3-4), 260–277. doi: 10.1016/j.palaeo.2005.06.005
Boulay S., Colin C., Trentesaux A., Stéphane C., Liu Z. F., Christine L. L. (2007). Sedimentary responses to the pleistocene climatic variations recorded in the south China Sea. Quaternary Res. 68 (1), 162–172. doi: 10.1016/j.yqres.2007.03.004
Cao L., Liu J. G., He W., MD H. R. K. (2018). Clay mineral assemblage features of major rivers along the south China coast and their contributions to the northern south China Sea. Earth Sci. 43 (Suppl. 2), 192–202. doi: 10.3799/dqkx.2018.189
Chen P. Y. (1978). Minerals in bottom sediments of the south China Sea, geological. Soc. America Bulletin. 89 (2), 211–222. doi: 10.1130/0016-7606(1978)89<211:MIBSOT>2.0.CO;2
Chen H., Zhang W., Xie X., Ren J. Y. (2019). Sediment dynamics driven by contour currents and mesoscale eddies along continental slope: A case study of the northern south China Sea. Mar. Geol 409, 48–66. doi: 10.1016/j.margeo.2018.12.012
Clift P. D., Lee J. I., Clark M. K., Blusztajn J. (2002). Erosional response of south China to arc rifting and monsoonal strengthening; a record from the south China Sea. Mar. Geol. 184 (3-4), 207–226. doi: 10.1016/S0025-3227(01)00301-2
Clift P. D., Wan S. M., Blusztajn J. (2014). Reconstructing chemical weathering, physical erosion and monsoon intensity since 25 ma in the northern south China Sea: a review of competing proxies. Earth-Science Rev. 130, 86–102. doi: 10.1016/j.earscirev.2014.01.002
Dykoski C. A., Edwards R. L., Cheng H., Yuan D. X., Cai Y. J., Zhang M. L., et al. (2005). A high-resolution, absolute-dated Holocene and deglacial Asian monsoon record from dongge cave, China. Earth Planetary Sci. Letters. 233 (1-2), 71–86. doi: 10.1016/j.epsl.2005.01.036
Ge Q., Liu J. P., Xue Z., Chu F. Y. (2014). Dispersal of the zhujiang river (Pearl river) derived sediment in the Holocene. Acta Oceanologica Sinica. 33 (8), 1–9. doi: 10.1007/s13131-014-0407-8
Huang J., Li A. C., Wan S. M. (2011). Sensitive grain-size records of Holocene East Asian summer monsoon in sediments of northern south China Sea slope. Quaternary Res. 75 (3), 734–744. doi: 10.1016/j.yqres.2011.03.002
Huang E. Q., Tian J., Qiao P. J., Wan S., Xie X., Yang W. G. (2015). Early interglacial carbonate-dilution events in the south China Sea: Implications for strengthened typhoon activities over subtropical East Asia. Quaternary Sci. Rev. 125, 61–77. doi: 10.1016/j.quascirev.2015.08.007
Huang J., Li A. C., Wan S. M., Xu F. J., Meng Q. Y. (2013). Terrigenous input to the northern slope of the south China Sea and its controlling factor since the last phase of the last glacial maximum. Oceanologia et Limnologia Sinica 44 (4), 882–889. doi: 10.11693/hyhz201304009009
Huang J., Wan S. M., Xiong Z. F., Zhao D. B., Liu X. T., Li A. C., et al. (2016). Geochemical records of Taiwan-sourced sediments in the south China Sea linked to Holocene climate changes. Paleogeogr Palaeoclimatol Palaeoecol. 441 (4), 871–881. doi: 10.1016/j.palaeo.2015.10.036
Hu D. K., Böning P., Köhler C. M., Hillier S., Pressling N., Wan S. M., et al. (2012). Deep sea records of the continental weathering and erosion response to East Asian monsoon intensification since 14 ka in the south China Sea. Chem. Geol. 326-327, 1–18. doi: 10.1016/j.chemgeo.2012.07.024
Hu B. Q., Li J., Cui R. Y., Wei H. L., Zhao J. T., Li G. G., et al. (2014). Clay mineralogy of the riverine sediments of hainan island, south China Sea: Implications for weathering and provenance. J. Asian Earth Sci. 96, 84–92. doi: 10.1016/j.jseaes.2014.08.036
Kissel C., Laj C., Jian Z., Wang P., Wandres C., Rebolledo-Vieyra M. (2020). Past environmental and circulation changes in the south China Sea: Input from the magnetic properties of deep-sea sediments. Quaternary Sci. Rev. 236, 106263. doi: 10.1016/j.quascirev.2020.106263
Li A. C. (1997). The flux and composition of mineral aerosols over the East China sea. PhD dissertation (Qingdao: Institute of Oceanology of the Chinese Academy of Sciences), 46–70.
Li C. S., Shi X. F., Kao S. J., Chen M. T., Liu Y. G., Fang X. S., et al. (2012). Clay mineral composition and their sources for the fluvial sediments of Taiwanese rivers. Chin. Sci. Bull. 57 (6), 673–681. doi: 10.1007/s11434-011-4824-1
Liu Z. F. (2010). Clay mineral assemblages in sediments of the south China Sea: East Asian monsoon evolution proxies? Acta Sedimentological Sin. 28 (5), 1012–1019.
Liu J. G., Chen Z., Chen M. H., Yan W., Xiang R., Tang X. Z. (2010a). Magnetic susceptibility variations and provenance of surface sediments in the south China Sea. Sedimentary geol 230 (1/2), 77–85. doi: 10.1016/j.sedgeo.2010.07.001
Liu Z. F., Colin C., Huang W., Chen Z., Alain T., Chen J. (2007). Clay minerals in surface sediments of the pearl river drainage basin and their contribution to the south China Sea. Chin. Sci. Bulletin. 52 (8), 1101–1111. doi: 10.1007/s11434-007-0161-9
Liu Z. F., Colin C., Li X. J., Zhao Y. L., Tuo S. T., Chen Z., et al. (2010c). Clay mineral distribution in surface sediments of the northeastern south China Sea and surrounding fluvial drainage basins: Source and transport. Mar. Geol. 277 (1-4), 48–60. doi: 10.1016/j.margeo.2010.08.010
Liu Z. F., Colin C., Trentesaux A., Blamart D., Bassinot F., Siani G., et al. (2004). Erosional history of the eastern Tibetan plateau over the past 190 kyr: Clay mineralogical and geochemical investigations from the southwestern south China Sea. Mar. Geol. 209 (1), 1–18. doi: 10.1016/j.margeo.2004.06.004
Liu Z. F., Li X. J. (2011). Discussion on smectite formation in south China Sea sediments. Quaternary Sci. 31 (2), 199–206. doi: 10.3969/j.issn.1001-7410.2011.02.01
Liu Z. F., Li X. J., Colin C., Ge H. M. (2010b). A high-resolution clay mineralogical record in the northern south China Sea since the last glacial maximum, and its time series provenance analysis. Chin. Sci. Bull. 55 (29), 2852–2862. doi: 10.1007/s11434-010-4149-5
Liu J. G., Steinke S., Vogt C., Mohtadi M., Pol-Holz R. D., Hebbeln D. (2017). Temporal and spatial patterns of sediment deposition in the northern south China Sea over the last 50,000 years. Paleogeogr Palaeoclimatol Palaeoecol. 465 (Part A), 212–224. doi: 10.1016/j.palaeo.2016.10.033
Liu Z. F., Trentesaux A., Clemens S. C., Colin C., Wang P. X., Huang B. Q., et al. (2003). Clay mineral assemblages in the northern south China Sea: Implications for East Asian monsoon evolution over the past 2 million years. Mar. Geol. 201 (1), 133–146. doi: 10.1016/S0025-3227(03)00213-5
Liu Z. F., Tuo S. T., Colin C., Liu J. T., Huang C. Y., Chen C. T. A., et al. (2008). Detrital fine-grained sediment contribution from Taiwan to the northern south China Sea and its relation to regional ocean circulation. Mar. Geol. 255 (3-4), 149–155. doi: 10.1016/j.margeo.2008.08.003
Liu J. G., Xiang R., Chen Z., Chen M. H., Yan W., Zhang L. L., et al. (2013). Sources, transport and deposition of surface sediments from the south China Sea. Deep Sea Res. Part I: Oceanographic Res. Papers. 71, 92–102. doi: 10.3969/j.issn.1001-7410.2011.02.01
Liu F., Yang C. P., Chang X. H., Liao Z. W. (2018). Sedimentary geochemistry properties of rare earth elements from the continental lower slope of the northeastern south China Sea over the last 20 ka and its implication for provenance. Acta Oceanologica Sinica. 40 (9), 148–158. doi: 10.3969/j.issn.0253-4193.2018.09.013
Liu Z. F., Zhao Y. L., Colin C., Siringan F. P., Wu Q. (2009). Chemical weathering in Luzon, Philippines from clay mineralogy and major-element geochemistry of river sediments. Appl. Geochem. 24 (11), 2195–2205. doi: 10.1016/j.apgeochem.2009.09.025
Liu Z. F., Zhao L. Y., Colin C., Stattegger K., Wiesner M. G., Huh C. A., et al. (2016). Source-to-sink transport processes of fluvial sediments in the south China Sea. Earth-Science Rev. 153, 238–273. doi: 10.1016/j.earscirev.2015.08.005
Li X. H., Wei G. J., Shao L., Liu Y., Liang X. R., Jian Z. M., et al. (2003). Geochemical and Nd isotopic variations in sediments of the south China Sea: A response to Cenozoic tectonism in SE Asia. Earth Planetary Sci. Letters. 211 (3), 207–220. doi: 10.1016/S0012-821X(03)00229-2
Milliman J. D., Syvitski J. P. M. (1992). Geomorphic/tectonic control of sediment discharge to the ocean: The importance of small mountainous rivers. J. Geol. 100 (5), 525–544. doi: 10.1086/629606
Paterson G. A., Heslop D. (2015). New methods for unmixing sediment grain size data. Geochem Geophysics Geosystems. 16 (12), 4494–4506. doi: 10.1002/2015GC006070
Shao L., Qiao P. J., Pang X., Wei G. J., Li Q. Y., Miao W. L., et al. (2009). Nd Isotopic variations and its implications in the recent sediments from the northern south China Sea. Chin. Sci. Bulletin. 54 (2), 311–317. doi: 10.1007/s11434-008-0453-8
Shao L., Zhao M., Qiao P. J., Pang X., Wu M. S. (2013). Sediment characteristics in the northern south China Sea and their response to the evolution of the pearl river. Quaternary Res. 33 (4), 760–770. doi: 10.3969/j.issn.1001-7410.2013.04.13
Shaw P. T., Chao S. Y. (1994). Surface circulation in the south China Sea. Oceanographic Res. Papers. 41 (11-12), 1663–1683. doi: 10.1016/0967-0637(94)90067-1
Staudigel H., Clague D. A. (2010). The geological history of deep-sea volcanoes: Biosphere, hydrosphere, and lithosphere interactions. Oceanography. 23 (1), 58–71. doi: 10.5670/oceanog.2010.62
Staudigel H., Koppers A. A. P. (2015). “Seamounts and island building,” in The encyclopedia of volcanoes (Amsterdam: Elsevier), 405–421.
Stuut J. B. W., Prins M. A., Schneider R. R., Weltje G. J., Jansen J. H. F., Postma G. (2002). A 300-kyr record of aridity and wind strength in southwestern Africa: inferences from grain-size distributions of sediments on Walvis ridge, SE Atlantic. Mar. Geol. 180 (1-4), 221–233. doi: 10.1016/S0025-3227(01)00215-8
Stuut J. B., Zabel M., Ratmeyer V., Helmke P., Schefuß E., Lavik G., et al. (2005). Provenance of present-day eolian dust collected off NW Africa. J. Geophysical Research: Atmospheres 110 (D04202). doi: 10.1029/2004JD005161
Tanghe N. (2016). The palaeo-environmental history of equatorial East Africa: Implications from mineralogy and particle-size distributions (Master’s thesis) (Belgium: Universiteit Gent).
Wan S. M., Clift P. D., Li A. C., Yu Z. J., Li T. G., Hu D. K. (2012a). Tectonic and climatic controls on long-term silicate weathering in Asia since 5 ma. Geophysical Res. Lett. 39 (15), L15611. doi: 10.1029/2012GL052377
Wan S. M., Clift P. D., Zhao D. B., Hovius N., Munhoven G., France-Lanord C., et al. (2017). Enhanced silicate weathering of tropical shelf sediments exposed during glacial lowstands: a sink for atmospheric CO2. Geochimical Cosmochimica Acta 200, 123–144. doi: 10.1016/j.gca.2016.12.010
Wang Y. J., Cheng H., Edwards R. L., Kong X. G., Shao X. H., Chen S., et al. (2008). Millennial-and orbital-scale changes in the East Asian monsoon over the past 224,000 years. Nature. 451 (7182), 1090–1093. doi: 10.1038/nature06692
Wang Q., Yang S. Y. (2013). Clay mineralogy indicates the Holocene monsoon climate in the changjiang (Yangtze river) catchment, China. Appl. Clay Science. 74, 28–36. doi: 10.1016/j.clay.2012.08.011
Wan S. M., Li A. C., Clift P. D., Stuut J. B. W. (2007a). Development of the East Asian monsoon: mineralogical and sedimentologic records in the northern south China Sea since 20 ma. Palaeogeogr Palaeoclimatol Palaeoecol. 254 (3-4), 561–582. doi: 10.1016/j.palaeo.2007.07.009
Wan S. M., Li A. C., Clift P. D., Wu S. G., Xu K. H., Li T. G. (2010). Increased contribution of terrigenous supply from Taiwan to the northern south China Sea since 3 ma. Mar. Geol. 278 (1-4), 115–121. doi: 10.1016/j.margeo.2010.09.008
Wan S. M., Li A. C., Jan-Berend W. S., Xu F. J. (2007b). Grain-size records at ODP site 1146 from the northern south China Sea: Implications on the East Asian monsoon evolution since 20 ma. Sci. China Ser. D: Earth Sci. 50 (10), 1536–1547. doi: 10.1007/s11430-007-0082-0
Wan S. M., Yu Z. J., Clift P. D., Sun H. J., Li A. C., Li T. G. (2012b). History of Asian eolian input to the West Philippine Sea over the last one million years. Paleogeogr Palaeoclimatol Palaeoecol. 326-328, 152–159. doi: 10.1016/j.palaeo.2012.02.015
Wehausen R., Brumsack H. J. (2002). Astronomical forcing of the East Asian monsoon mirrored by the composition of pliocene south China Sea sediments. Earth Planetary Sci. Letters. 201 (3-4), 621–636. doi: 10.1016/S0012-821X(02)00746-X
Weltje G. J., Prins M. A. (2003). Muddled or mixed? Inferring palaeoclimate size distributions deep-sea classtics. Sedimentary Geol. 162 (1-2), 39–62. doi: 10.1016/S0037-0738(03)00235-5
Wen X. Y., Liu Z. Y., Wang S. W., Chen J. (2016). Correlation and anti-correlation of the East Asian summer and winter monsoons during the last 21,000 years. Nat. Commun. 7 (1), 1–7. doi: 10.1038/ncomms11999
Wentworth C. K. (1922). A scale of grade and class terms for clastic sediments. J. Geol. 30 (5), 377–392. doi: 10.1086/622910
Wessel P., Sandwell D. T., Kim S. S. (2010). The global seamount census. Oceanography. 23 (1), 24–33. doi: 10.5670/oceanog.2010.60
Xu F. J., Hu B. Q., Zhao J. T., Liu X. T., Xu K. H., Xiong Z. F., et al. (2021). Provenance and weathering of sediments in the deep basin of the northern south China Sea during the last 38 kyr. Mar. Geol. 440, 106602. doi: 10.1016/j.margeo.2021.106602
Yoneda M., Uno H., Shibata Y., Suzuki R., Kumamoto Y., Yoshida K., et al. (2007). Radiocarbon marine reservoir ages in the western pacific estimated by pre-bomb molluscan shells. Nucl. Instruments Methods Phys. Res. Section B: Beam Interact. Materials Atoms. 259 (1), 432–437. doi: 10.1016/j.nimb.2007.01.184
Yuan D. X., Cheng H., Edwards R. L., Dykoski C. A., Kelly M. J., Zhang M. L., et al. (2004). Timing, duration, and transitions of the last interglacial Asian monsoon. Science. 304 (5670), 575–578.
Zhang X., Boyer D. L. (1991). Current deflections in the vicinity of multiple seamounts. J. Phys. Oceanogr 21 (8), 1122–1138. doi: 10.1175/1520-0485(1991)021<1122:CDITVO>2.0.CO;2
Zhao B., Lü W. H., He G. W., Zhang J. B., Wei Z. Q., Ning Z. J., et al. (2022). Sedimentary processes of weijia guyot and implications for western pacific seamount evolution. Earth Sci. 47 (1), 357–367. doi: 10.3799/dqkx.2020.291
Zhong Y., Chen Z., González F. J., Hein J. R., Zheng X. F., Li G., et al. (2017). Composition and genesis of ferromanganese deposits from the northern south China Sea. J. Asian Earth Sci. 138, 110–128. doi: 10.1016/j.jseaes.2017.02.015
Zhou H. Y., Zhu Q. K., Ji F. W., Yang Q. H. (2020). Discoveries about seamounts in deep basin of south China Sea. Sci. Technol. Rev. 38 (18), 83–88. doi: 10.3981/j.issn.1000-7857.2020.18.013
Keywords: grain size, clay minerals, provenance, the last deglaciation, South China Sea
Citation: Tian X, Zhang X, Wang J, Sun Z, Liu M, Zhao J, Zhang L, Fan D and Xu F (2023) Provenance and paleoenvironmental significance of sediments in the Beipo seamount of the northern South China Sea during the last deglaciation. Front. Mar. Sci. 10:1110188. doi: 10.3389/fmars.2023.1110188
Received: 28 November 2022; Accepted: 12 January 2023;
Published: 07 February 2023.
Edited by:
Min Luo, Shanghai Ocean University, ChinaReviewed by:
Xing Jian, Xiamen University, ChinaGábor Újvári, Hungarian Academy of Sciences (MTA), Hungary
Copyright © 2023 Tian, Zhang, Wang, Sun, Liu, Zhao, Zhang, Fan and Xu. This is an open-access article distributed under the terms of the Creative Commons Attribution License (CC BY). The use, distribution or reproduction in other forums is permitted, provided the original author(s) and the copyright owner(s) are credited and that the original publication in this journal is cited, in accordance with accepted academic practice. No use, distribution or reproduction is permitted which does not comply with these terms.
*Correspondence: Xilin Zhang, b3V4emh4bEAxNjMuY29t; Fangjian Xu, eHVmYW5namlhbmdnQDE2My5jb20=