- 1Key Laboratory of Ocean Circulation and Waves, Institute of Oceanology, Chinese Academy of Sciences, Qingdao, China
- 2Center for Ocean Mega-Science, Chinese Academy of Sciences, Qingdao, China
- 3Pilot National Laboratory for Marine Science and Technology (Qingdao), Qingdao, China
- 4State Key Laboratory of Satellite Ocean Environment Dynamics, Second Institute of Oceanography, Ministry of Natural Resources, Hangzhou, China
- 5School of Oceanography, Shanghai Jiao Tong University, Shanghai, China
- 6Southern Marine Science and Engineering Guangdong Laboratory (Zhuhai), Zhuhai, China
Mesoscale eddies are widespread in the oceans; however, tracking and observing them remains a challenge. Additionally, there are few studies of eddy–Kuroshio interactions based on large-scale in situ data. Data from a large array of 39 CPIESs deployed around the Luzon Strait in 2018–2019 (12 deployed east of Taiwan within a 3 × grid) were used to reveal the three-dimensional structure of mesoscale eddies and their interaction with Kuroshio. The results show a strengthening (weakening) of the tilt of the pycnocline, which has also caused a deeper (shallower) pycnocline in eastern Taiwan following an anticyclonic (cyclonic) interaction with Kuroshio, which resulted in a strengthening (weakening) of the Kuroshio. During the anticyclonic eddy impinging Kuroshio, the downward (upward) movement at the center of the anticyclonic eddy (Kuroshio) results in a positive (negative) anomaly structure for temperature, with corresponding positive (negative) anomalies for salinity above 600 m in the intermediate layer and negative (positive) anomalies below 600 m. In contrast, when the cyclonic eddies interact with the Kuroshio, the temperature and salinity anomalies change simultaneously, with the temperature showing an overall negative anomaly and the salinity showing a negative and positive anomaly above and below 600 m, respectively. The research in this study provides the basis for further research on energy exchange during eddy–Kuroshio interactions.
1 Introduction
The Kuroshio is a strong western boundary current that originates from the northward branch of the North Equatorial Current bifurcation off the east coast of the Philippines (Zhang et al., 2001; Qiu and Chen, 2010b). Kuroshio flows northward mainly along Luzon and flows into the East China Sea and the south coast of Japan via waterways east of Taiwan, while bringing heat and salinity from low equatorial latitudes to mid-latitudes, thus affecting climate and ocean–atmosphere interactions along the flow path (Nitani, 1972; Kwon et al., 2010).
Mesoscale eddies are spatially scaled eddies of 50–500 km and temporally scaled eddies of days to months in the ocean, which are mainly characterized as circulations that remain closed for longer periods of time (Chelton and Schlax, 1996; Chelton et al., 2007; Chelton et al., 2011). Depending on the direction of rotation, mesoscale eddies are divided into anticyclonic eddies and cyclonic eddies, in the ideal case, while the central water mass of an anticyclonic (cyclonic) eddy exhibits a downward (upward) vertical motion, while the situation in the ocean is very complex and is related to the life cycle of the eddy (Koszalka et al., 2009; Buongiorno Nardelli, 2013; McGillicuddy, 2016; Viúdez, 2018). The instability of currents, atmospheric forcing, and topography all play an important role in the formation of mesoscale eddies. As a carrier of oceanic material and energy transport, mesoscale eddies are commonly found in the oceans, and their kinetic energies are one order of magnitude larger than the average kinetic energies in most of the ocean, and they make important contributions to oceanic circulation, ocean energy balance, water mass distribution, thermal salinity, and nutrient transport (Chelton et al., 2011; Yang et al., 2013; Dong et al., 2014; Xu et al., 2014; Zhang et al., 2014; Zhang et al, 2016). In the subtropical countercurrent (STCC) region of the mid-latitude western Pacific, a large number of eddies are generated due to strong shear and oblique pressure instability (Qiu, 1999). These eddies propagate westward since their generation to near the western boundary of the Pacific Ocean and some eddies can intrude the South China Sea (Guo et al., 2017). The complex oceanic background circulation east of Taiwan is not only the main current area of the Kuroshio, but also one of the areas where the mesoscale eddies in the northwest Pacific are highly active (Figure 1). It has been shown that the mesoscale eddies are one of the main factors causing the intraseasonal variability of the Kuroshio east of Taiwan, with a period of ~100 days (Zhang et al., 2001; Liu et al., 2004; Qiu and Chen, 2010a; Chang et al., 2015; Jan et al., 2015; Ren et al., 2020). The existing studies on the influence of mesoscale eddies on Kuroshio mainly rely on numerical models, and the evolution of the eddy–Kuroshio interaction combined with the measured data remains less studied due to the insufficient data of in situ long-time observation arrays, and the dynamic mechanism of mesoscale eddies affecting Kuroshio still needs to be further clarified.
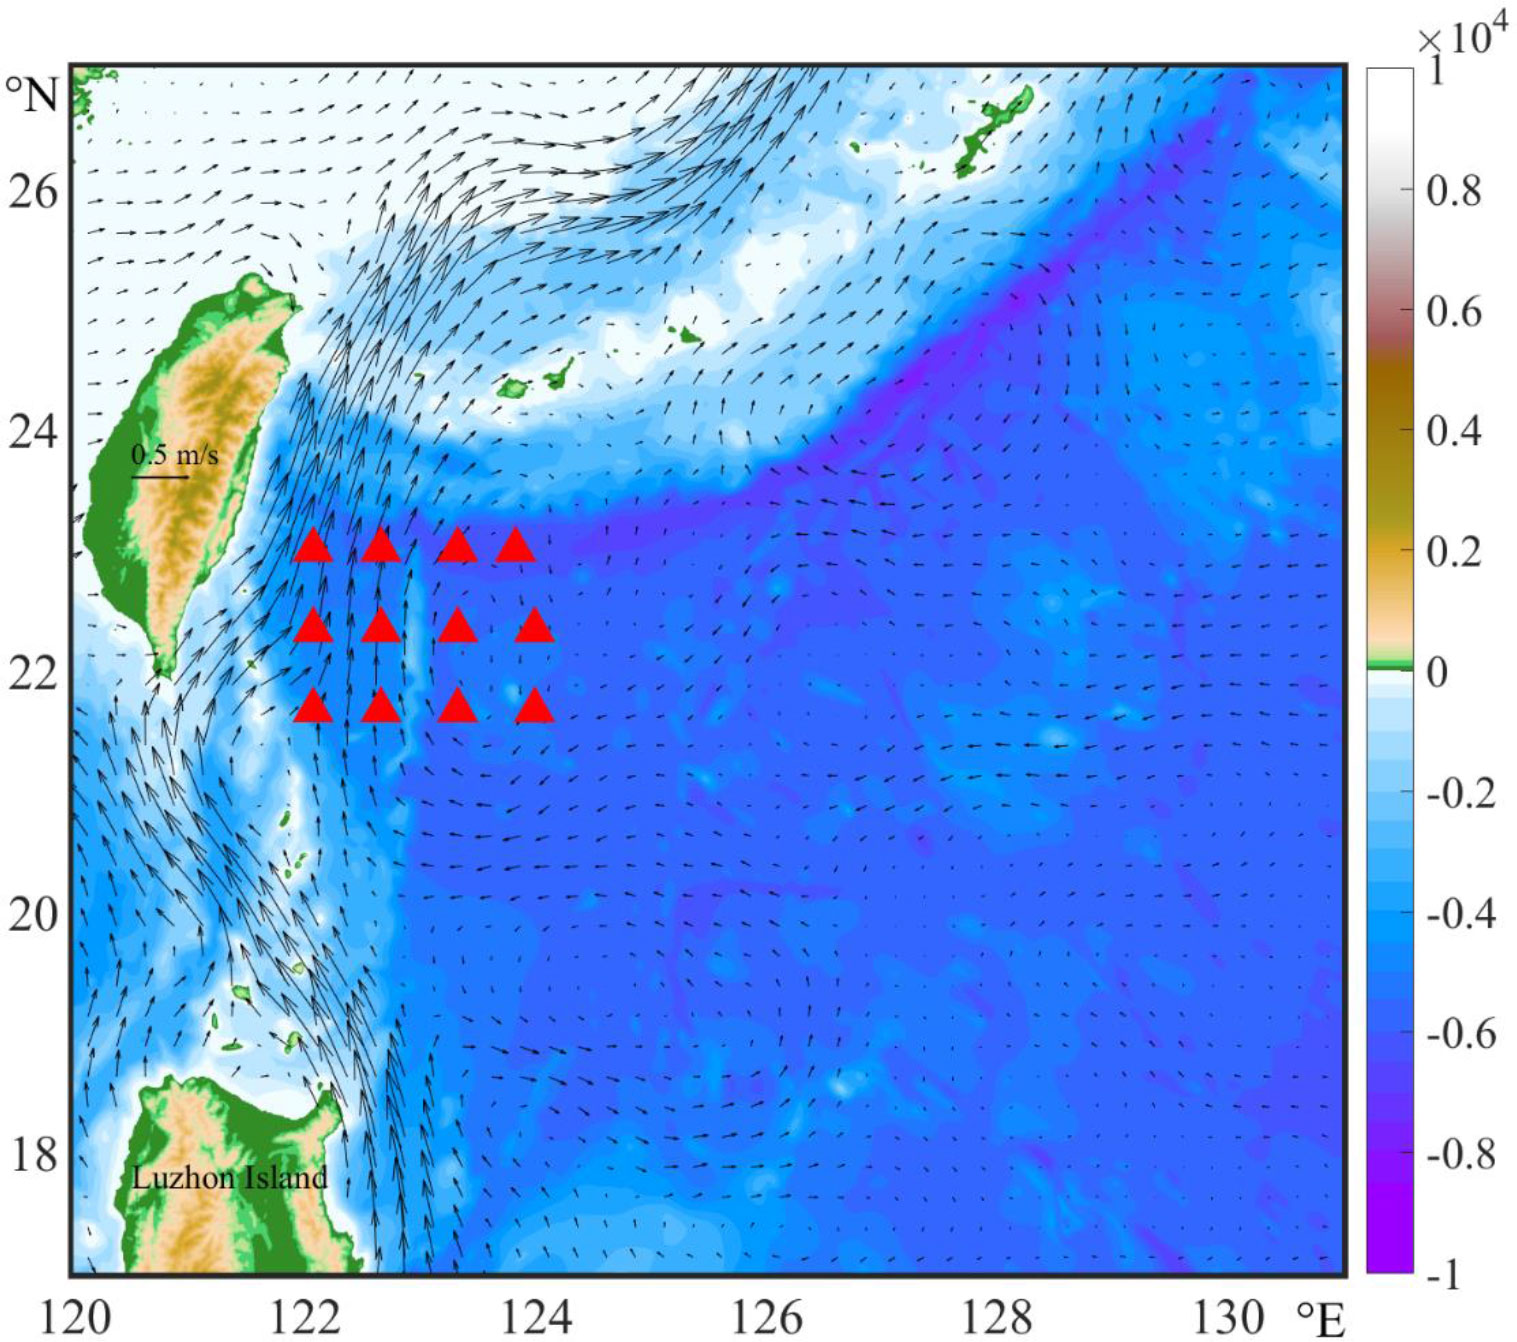
Figure 1 The surface geostrophic currents and CPIES array distribution around east of Taiwan. Red triangles denote CPIES stations; color shading is the bottom topography from the ETOPO1 Global Relief Model, and average surface geotropic currents (black arrows) between January 2018 and July 2019 are from AVISO data, covering the observation time of CPIES. The CPIES array was deployed from January 2018 and July 2019. The topographic data were from the following website: https://www.ngdc.noaa.gov/mgg/global/etopo1sources.html.
The study of mesoscale eddies mainly relies on satellite altimeter data, combined with eddy tracking algorithms to obtain long-term surface eddy dynamics information (Chelton et al., 2007; Chelton et al, 2011). With the large number of Argo profiling buoys deployed in the global oceans, a large amount of upper ocean temperature and salt data have been accumulated, and the combination of satellite altimeter data, in situ survey data, and reconstruct eddy methods has greatly facilitated the study of mesoscale eddies. In the northwest Pacific Ocean, we have studied the three-dimensional structure of mesoscale eddies and their heat transport and have found that the eddies can affect the depth of 1,000 m (Qiu et al., 2005; Hu et al., 2011; Nan et al., 2011; Liu et al., 2012; Yang et al., 2013; Zhang et al., 2013; Chu et al., 2014; Zhang et al., 2014a; Zhang et al., 2015; Shu et al., 2016; Dong et al., 2017; Chen et al., 2018; He et al., 2018). Zhang et al (2016) used the S-MEE project to deploy a mooring system submersible array in the northeastern part of the South China Sea and combined it with synthetic analysis to describe the three-dimensional structure of the mesoscale eddies and yield the process of eddy energy dissipation. In the latest study, Li et al. (2022) combined satellite observations and global Argo data to find a general vertically tilted structural feature of the global eddy, further contributing to our understanding of the three-dimensional structure of the mesoscale eddy (Li et al., 2022a; Li et al, 2022b). Despite the large number of studies on mesoscale eddies, tracking eddies and their dynamical processes from in situ observations is a challenge because eddies vary in both time and space, and most studies can only focus on the state of the eddy at a single moment in time.
The Current–Pressure Inverted Echo Sounder (CPIES), which integrates current and pressure sensors, has been widely used in oceanographic surveys because of its small size and easy deployment. Combined with the gravest empirical mode (GEM) method, we can obtain four-dimensional temperature, salinity, density, and current data of the whole water layer in the observation area. Based on the data of a large-scale CPIES array, this paper will construct mesoscale three-dimensional structure characteristics, reveal the isopycnic variation process of one of the eddy current interaction process mechanisms, and provide a basis for the study of mass transport and energy dissipation of mesoscale eddies.
2 Materials and methods
2.1 CPIES data
An inverted echo sounder (IES) equipment with a current sensor (C) and a pressure sensor (P) is called CPIES, which consists of a fishing float, a glass float, an Aanderaa current meter, a 50-m communication cable, a PIES body, and a heavy anchor. The working mode is mainly to measure the sound propagation time from the sea surface to the sea bottom. Since its inception in the 1970s, IES has been widely used in marine research with the help of technological developments and the progress of data processing methods (Meinen et al., 2003; Donohue et al., 2008; Watts et al., 2001).
This has relied heavily on the ground-transfer empirical modal GEM method proposed by Watts et al (2001) for data inversion methods. This method establishes an empirical relationship between sound propagation time (τ) and temperature, salinity, and streamflow functions by integrating all historical measured temperature and salinity profiler for the study area, creating a Lagrangian matrix of scatter points and projecting the existing temperature and salinity data onto this two-dimensional space. Also, an observation array consisting of multiple CPIES can be based on the GEM method to obtain an absolute current profile. A reference layer needs to be chosen to create GEM, and this reference layer requires a depth that can basically cover the depth of baroclinic influence. Considering the weak baroclinic below 1,000 m east of Taiwan, this study takes 1,000 m as the reference layer. As a comparison, the 1,000 m selected by Anders et al. (2017) in this region is used as the reference layer.
From December 2017 to July 2018, a total of 40 CPIES were deployed around the Luzon Strait, and 39 sites were successfully recovered in July 2019. Among them, 12 of the CPIES were deployed in the area east of Taiwan with a 3 × 4 size array. All CPIES observations were then preprocessed, which included being despiked, tidally corrected, and dedrifted, following Kennelly et al. (2007). All the final raw data were low-pass filtered with a 72-h window and a fourth-order Butterworth filter. For further information on the data processing and inversion process, see Zhao et al. (2022) and Zheng et al. (2022).
2.2 Satellite altimeter data
An Archiving, Validation, and Interpretation of Satellite Data in Oceanography (AVISO) altimetry data (http://marine.copernicus.eu/services-portfolio/access-to-products/) set was used in this study to track the mesoscale eddies. Sea surface height anomaly data are used in the manuscript, the data spatial resolution is 1/4° × 1/4°, and the data set extended from June 2018 to July 2019, which provided satisfactory overlap with the CPIES array data.
2.3 Historical data
In order to establish the relationship between the GEM array inversion temperature, salinity, and current, as well as the acoustic wave propagation time (τ) and the pycnocline, it is necessary to draw on as many existing historical data profiles as possible. Historical hydrographic data from the World Ocean Database (WOD) and Argo were selected from the locations shown in Figure 2, with longitudes of 121.3–127°E and latitudes of 20–23.8°N. The locations selected were larger than the CPIES deployment sites. The total number of profiles is 3,155, of which 1,367 profiles are less than 1,500 m, 1,660 profiles are between 1,500 and 2,000 m, and 128 profiles are greater than 2,000 m.
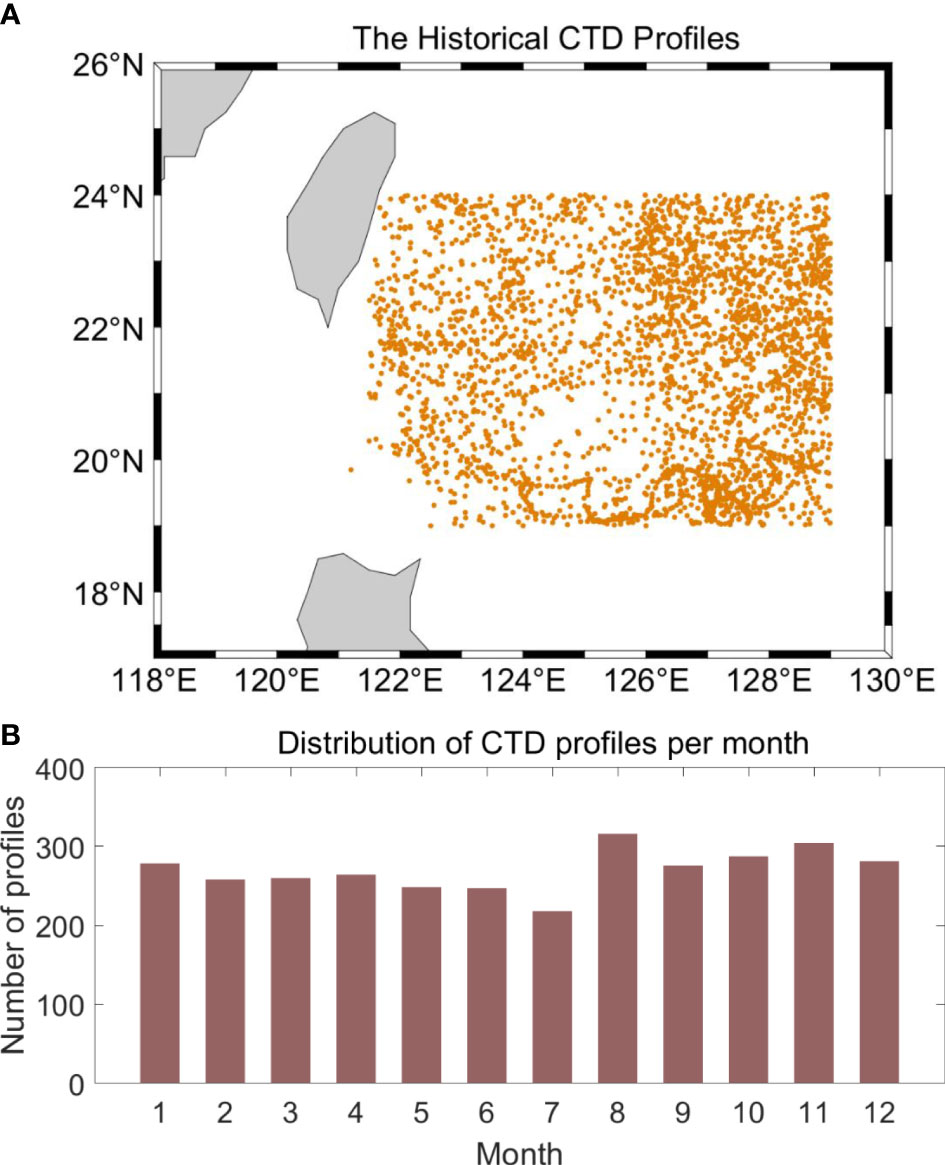
Figure 2 Distribution of historical CTD profile. (A) The range of selected CTD profiles. (B) The distribution of CTD profiles per month.
3 Results
3.1 Relationship between sea level anomaly, τ, nd pycnocline depth
Changes in the pycnocline depth have been shown in many studies to be one of the mechanisms of interaction between mesoscale eddies and Kuroshio (Ren et al., 2020). The time series of τ measurement from CPIES station C04 and sea level anomaly (SLA) are shown in Figure 3, and the result reveals a highly negative correlation between SLA with a coefficient of –0.9. This means that the increase in sea surface height caused by the anticyclonic eddies (cyclonic eddies) can reduce (increase) the sound speed round trip propagation time.
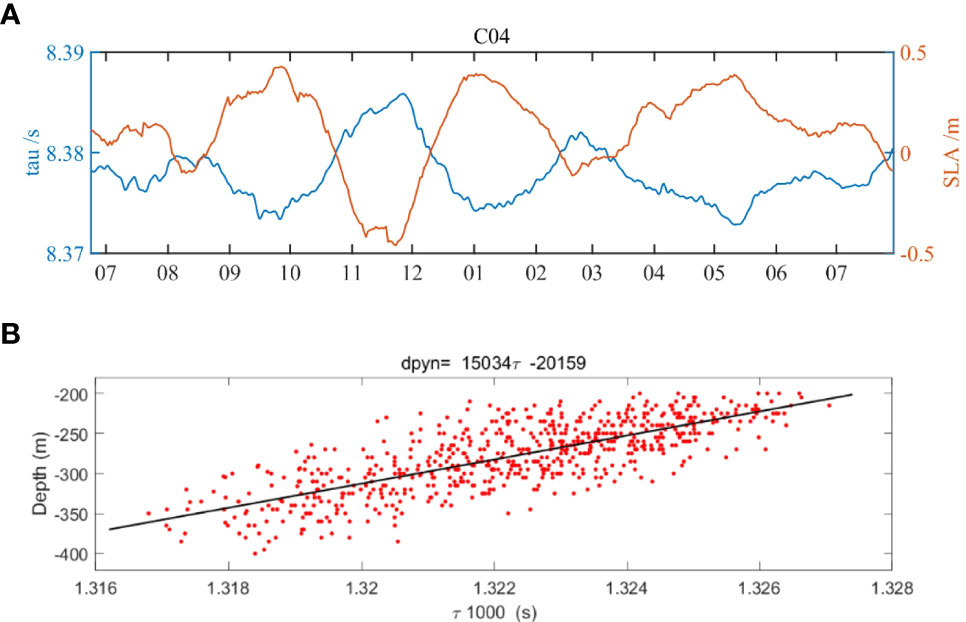
Figure 3 The relationship between τ SLA, and pycnocline; the SLA is the sea level anomaly from the AVISO product; dpyn is the pycnocline depth. (A) The measurement of τ nd SLA at the CPIES site C02; the blue line and the orange line are the τ and SLA, respectively. (B) The corresponding relationship between τ1000 and the pycnocline depth (dpyn) calculated from historical CTD profiles in eastern Taiwan (red dots); the black solid line is the fitted curve.
To quantify the variation of the pycnocline at the interaction between eddies and Kuroshio, the measured propagation (τ) time series needs to be converted to the pycnocline variation, and here, we use the depth of the maximum density gradient to represent the pycnocline variation. Pycnocline depth is defined in this paper by the maximum density gradient (dρ/dz) below the seasonal thermocline (Tsai et al., 2015; Jan et al., 2017), calculated for each density profile located in the regions in the red point area from the historical Argo data (Figure 2). Thus, it is necessary to establish the relationship between the propagation time τ and the pycnocline depth. As mentioned before, in order to invert the temperature, salinity, and other data, the measurement time τ by PIES needs to be converted into the reference (τ) which is chosen to be 1,000 m. According to this, a function of the pycnocline depth (dpyn) and τ1,000 are established based on historical CTD profile data. The result is plotted against the corresponding τ1,000 in each profile shown in Figure 4, the mean pycnocline is σ=25.9 kg m−3 and the depth is approximately 300 m at eastern Taiwan. The τ1,000 and pycnocline depth exhibit a linear relationship with a correlation coefficient of 0.8, which means that pycnocline depth increases (decreases) with the increase (decrease) in τ1,000. Therefore, we can obtain a simple corresponding function of the pycnocline depth and τ1,000 by linear fitting, shown by the black line in Figure 3B. Thus, we can invert the time series pycnocline depth at each time through τ1,000 inverted from τ measured by CPIES. Combining the relationship between τ1,000 and SLA and pycnocline depth obtained from Figure 3, we can conclude that the positive (negative) SLA caused by the anticyclonic eddies (cyclonic eddies), which corresponds to a smaller (larger) τ1,000 is able to cause a deeper (shallower) pycnocline depth at the same time.
3.2 Interaction between mesoscale eddy and Kuroshio
During the observation period, multiple eddies propagating east of Taiwan are successfully captured by our CPIES array shown in Figure 5, and based on the relationship between the eddies and the pycnocline depth obtained in the previous section, we have the opportunity to directly study the interaction between mesoscale eddies and Kuroshio. At the anticyclonic eddy moment, τ1,000 forms a closed region of low values corresponding to the eddy. The minimum value of τ1,000 ithe center of the eddy is 1.316 s, and τ1,000 ll be larger the closer to the edge of the anticyclonic eddy. Additionally, it can be found that the distribution of τ1,000 shows obvious east–west differences, and τ1,000 in the region near the western Kuroshio is larger than that in the region controlled by the anticyclonic eddy, and the maximum value of τ1000 at the Kuroshio location is close to 1.320 s. The depth of the pycnocline at the center of the anticyclonic eddy is calculated from the linear relationship between τ1,000 and dpyn and is determined to be approximately 450 m, while the pycnocline depth at the Kuroshio side is approximately 410 m, while at the cyclonic eddy impinging with Kuroshio, τ1,000 forms a closed region of high values corresponding to the eddy shown in Figure 4A, with a maximum τ1,000 value of 1.322 s at the center of the eddy and decreasing toward the edge of the eddy. The distribution of τ1,000 shows a small east–west difference, with a τ1,000 value of 1.321 s near the Kuroshio side, but is still smaller than the interior of the eddy. According to the relationship, the depth of the pycnocline in the center of the cyclonic eddy and Kuroshio side is approximately 365 m and 370 m, respectively.
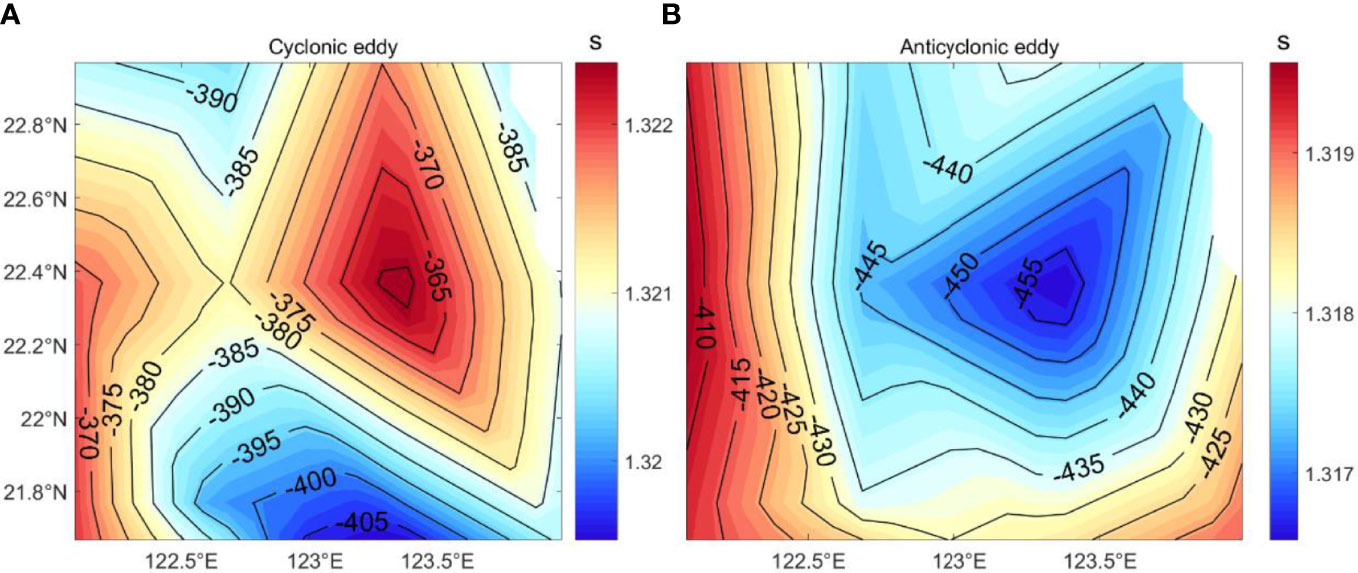
Figure 4 Composite maps of τ (color shading) and pycnocline depth (black line, in meters) measurement from the CPIES array. (A) Cyclonic eddy and (B) anticyclonic eddy impinging on Kuroshio.
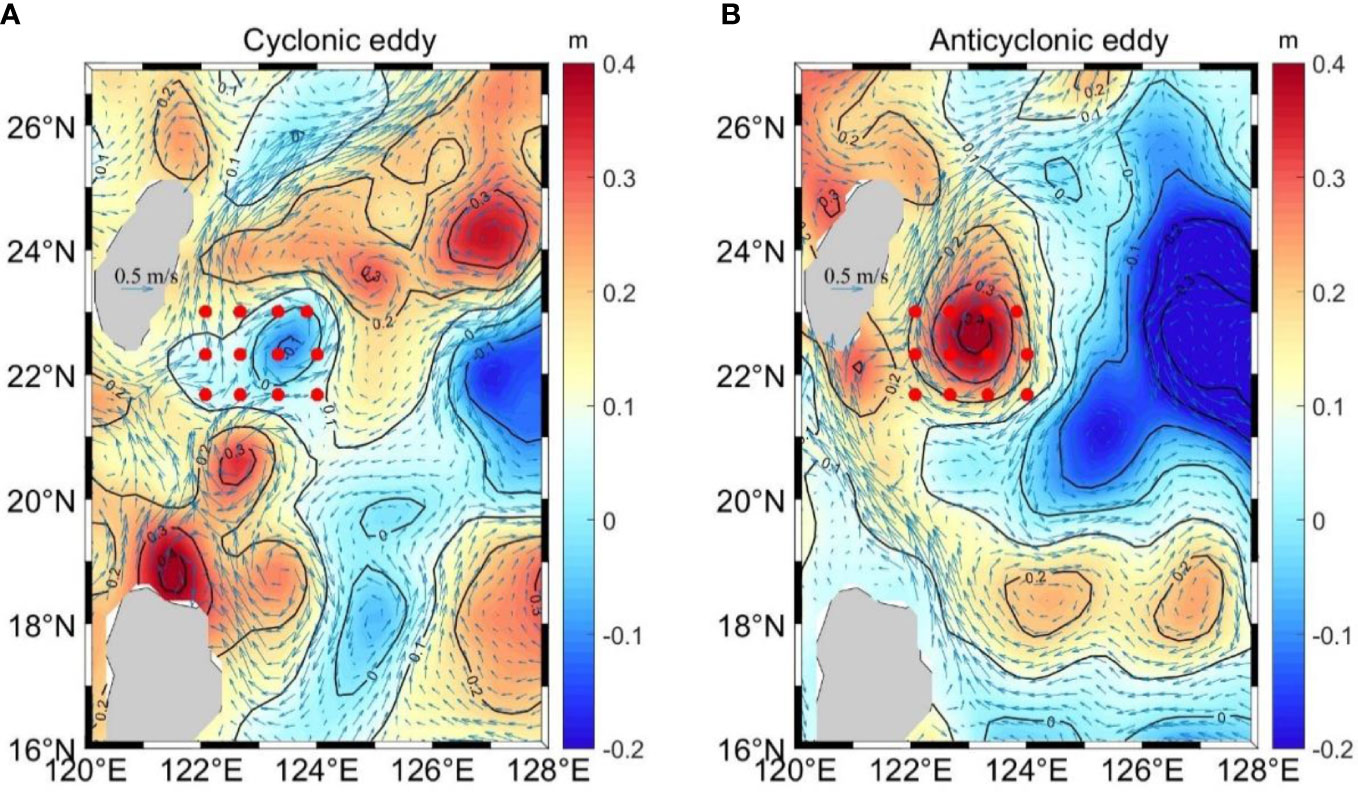
Figure 5 Composite maps of sea level anomaly (color shading) and surface current (blue arrows) on (A) the cyclonic eddy and (B) the anticyclonic eddy captured by the CPIES array. The red dots denote CPIES stations.
Thus, the pycnocline depth at the anticyclonic eddy is significantly greater than at the cyclonic eddy, and the pycnocline is nearly parallel at the cyclonic eddy moment. Based on the possible variation mechanism proposed by Jan et al. (2015) and our calculations, the interaction between the eddy and the Kuroshio can be revealed by the schematic shown in Figure 6. Under normal conditions, the pycnocline of the Kuroshio is tilted to the lower right (white line in Figure 6) and the Kuroshio flows northward. While in the influence of the anticyclonic eddy (Figure 6A), the overall pycnocline becomes significantly deeper and the tilt of the pycnocline increases significantly, exhibiting a “see-saw” effect, thus resulting in an increase in the Kuroshio velocity, a wider Kuroshio width, and a greater Kuroshio thickness, even up to 800–1,000 m, while at the cyclonic eddy influence (Figure 6B), the pycnocline rises upward and reduces the tilt of the pycnocline, similar to a see-saw reverting to an intermediate state, corresponding to a decrease in the velocity and width of Kuroshio, as well as reducing the thickness of Kuroshio.
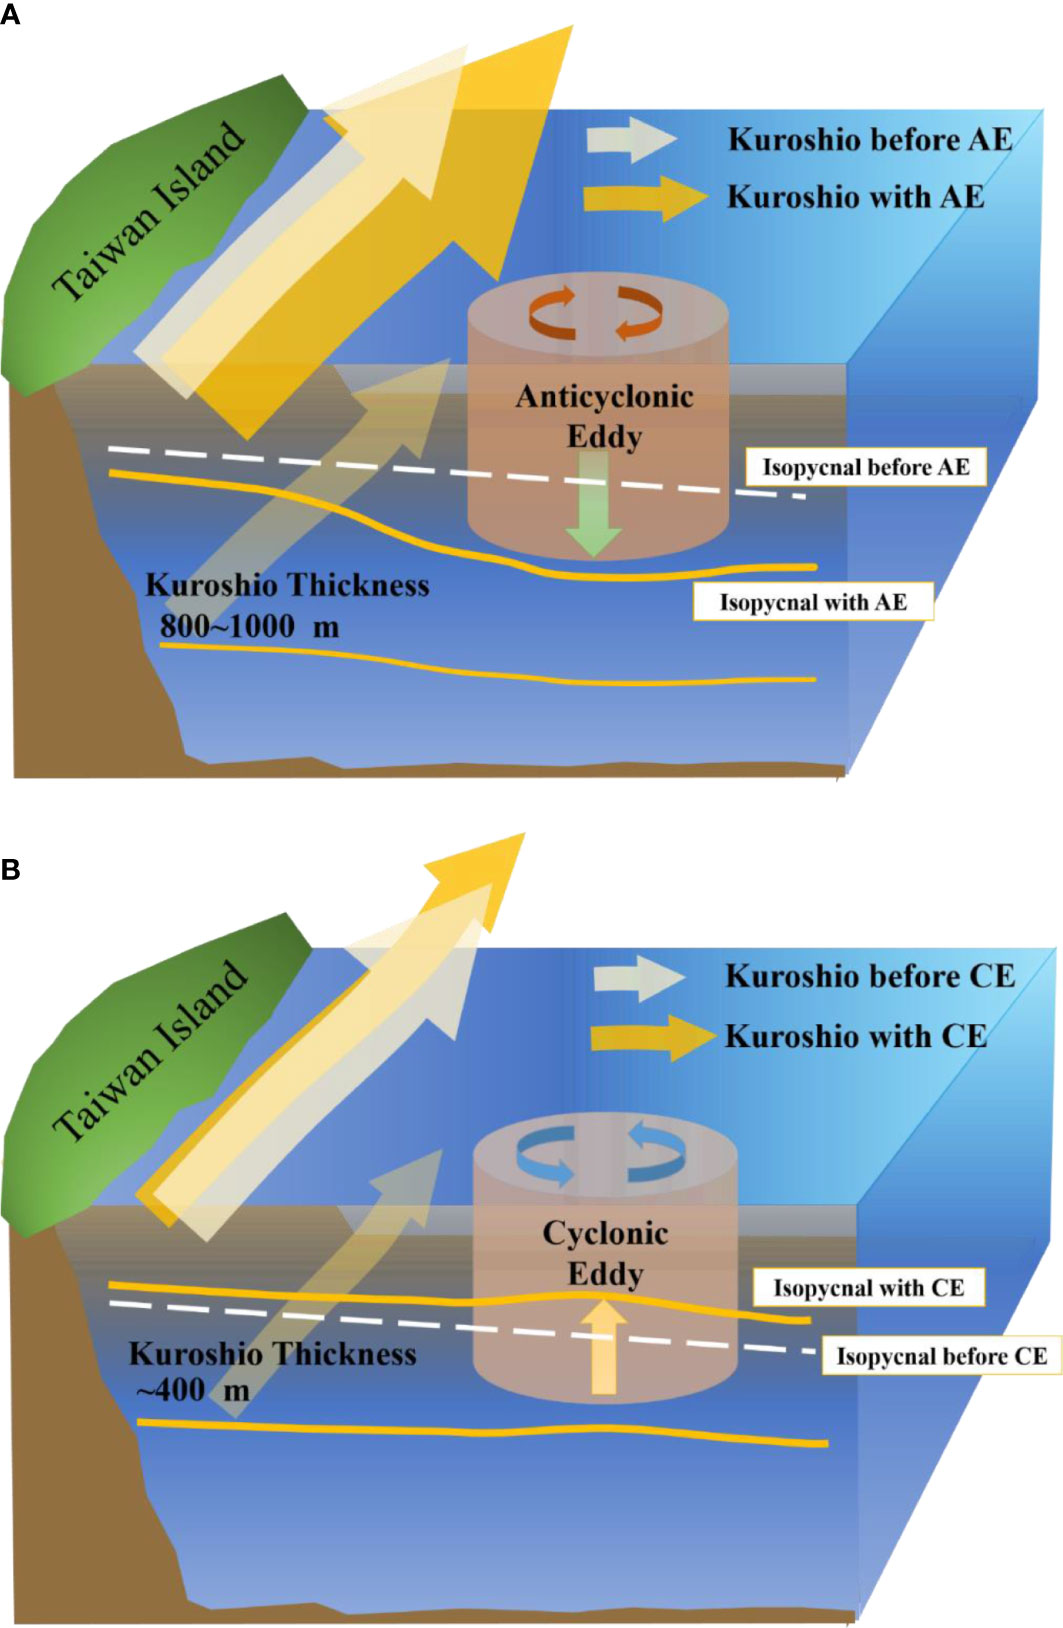
Figure 6 Schematic diagram of the variation of (A) the anticyclonic eddy and (B) the cyclonic eddy interaction with Kuroshio.
4 Discussion
To study the changes of the hydrological background east of Taiwan under the interaction of eddies and Kuroshio, the average temperature and salinity characteristics at the study site are shown in Figure 7. It can be clearly seen that the temperature vertical gradient (red curve) shows the existence of two thermoclines, the seasonal thermoclines above 200 m and the permanent thermoclines within 500 m. The salinity characteristics clearly show the subsurface high-salt water and lower salt of intermediate water, with the maximum salinity value of the subsurface water exceeding 34.8 psu, while the intermediate water shows obvious characteristics of the North Pacific intermediate water (NPIW), with the minimum salinity value less than 34.2 psu, and their core depths are approximately 100 m and 500 m, respectively.
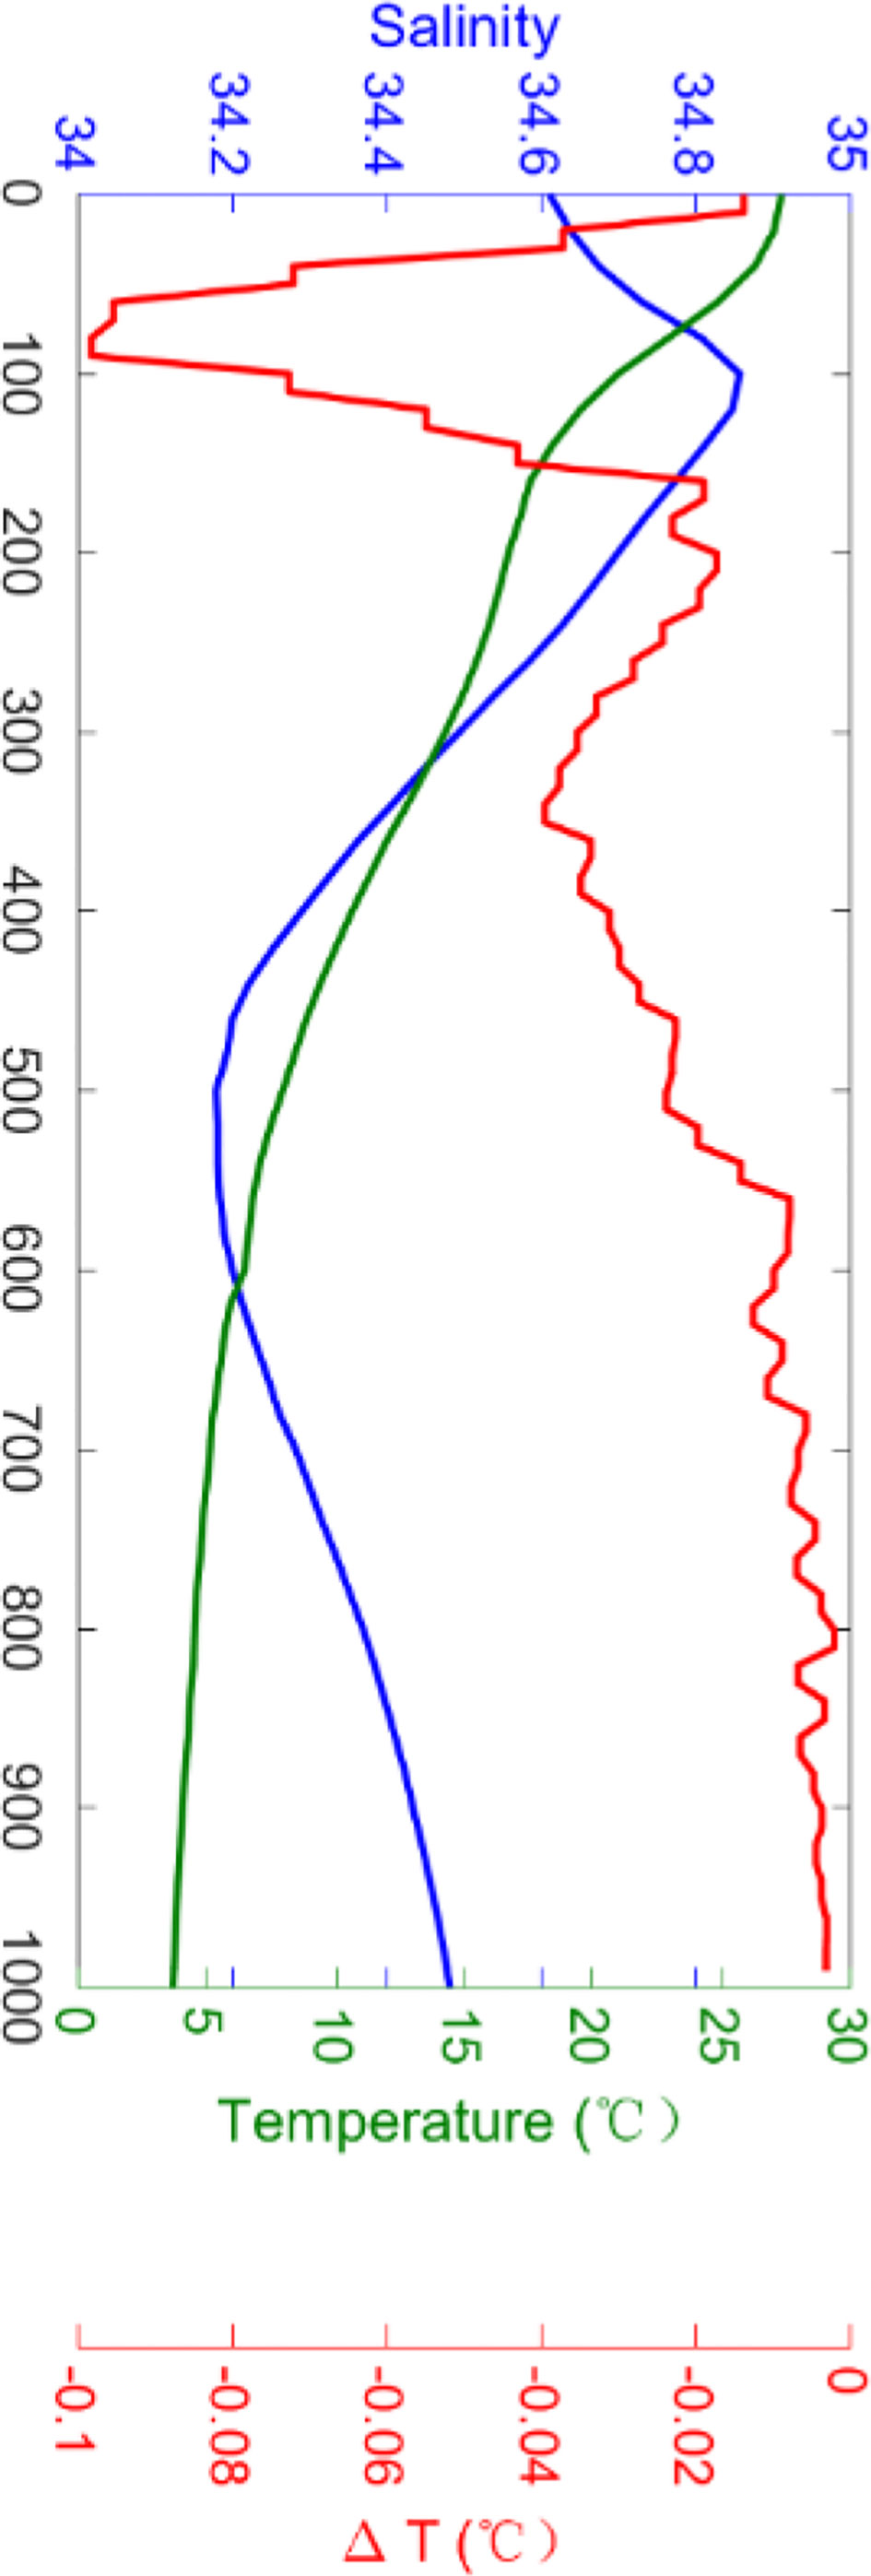
Figure 7 The average temperature and salinity characteristics in the study area; ΔT is the temperature vertical gradient.
4.1 The variation of anticyclonic eddies’ interaction with Kuroshio
An anticyclonic eddy is captured by the CPIES array shown in Figure 8, where the temperature and salinity anomalies of the eddies are defined as the measured values at each point minus the average of each layer, and the center of each layer of the eddy is identified by the minimum velocity point, which is located at 123.5°E, 22.35°N. The left front of the anticyclonic eddy is adjacent to the Kuroshio, and the radius of this eddy is estimated to be approximately 70 km. The maximum velocity of the eddy at the surface layer is approximately 0.7 m/s, and the eddy extends to a depth of 1,000 m. Combined with Figure 4A, it can be seen that the Kuroshio velocity west of 122.5°E is 0.7 m/s. Ren et al. (2020) measured the Kuroshio velocities by subsurface mooring and noted that the velocities can reach 1 m/s when interacting with anticyclonic eddies, probably due to the fact that the CPIES array is located on the eastern side of the Kuroshio main axis and thus the velocities are relatively small. Taking a latitudinal section along the center of the eddy at 22.35°N shown in Figure 9, the temperature and salinity anomalies and velocity clearly show that the variation is completely different between the left and right sides of 122.5°E. The isotherm, isohaline, and pycnocline of the anticyclonic eddy are concave, while those in the Kuroshio side are convex.
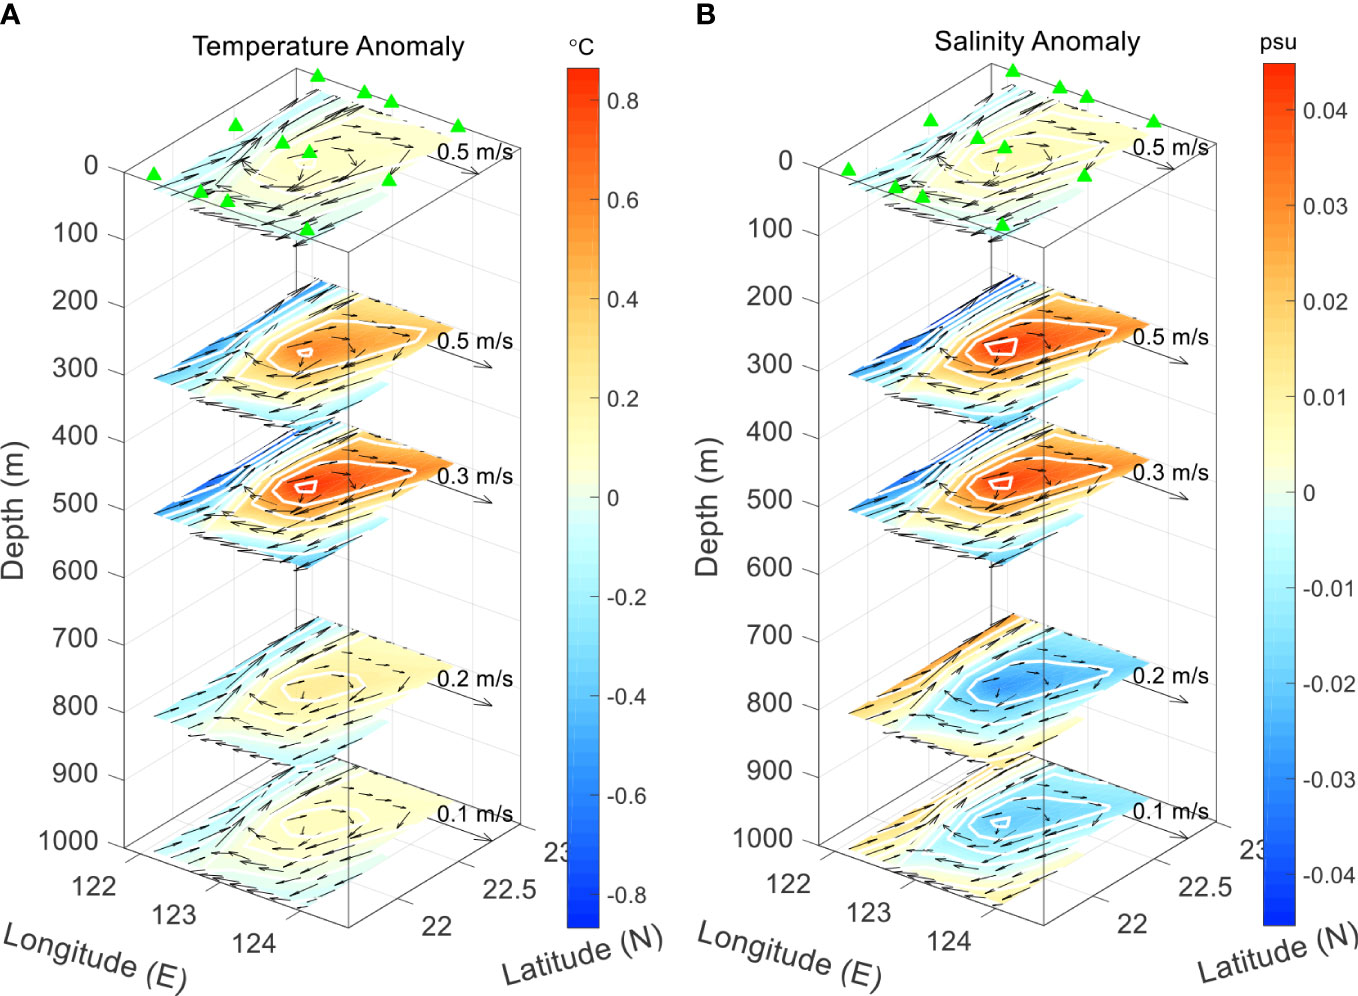
Figure 8 Three-dimensional structure of the anticyclonic eddy. (A) Temperature anomaly and (B) salinity anomaly; the vector is the geostrophic current, and the color shading represents the temperature and salinity anomaly.
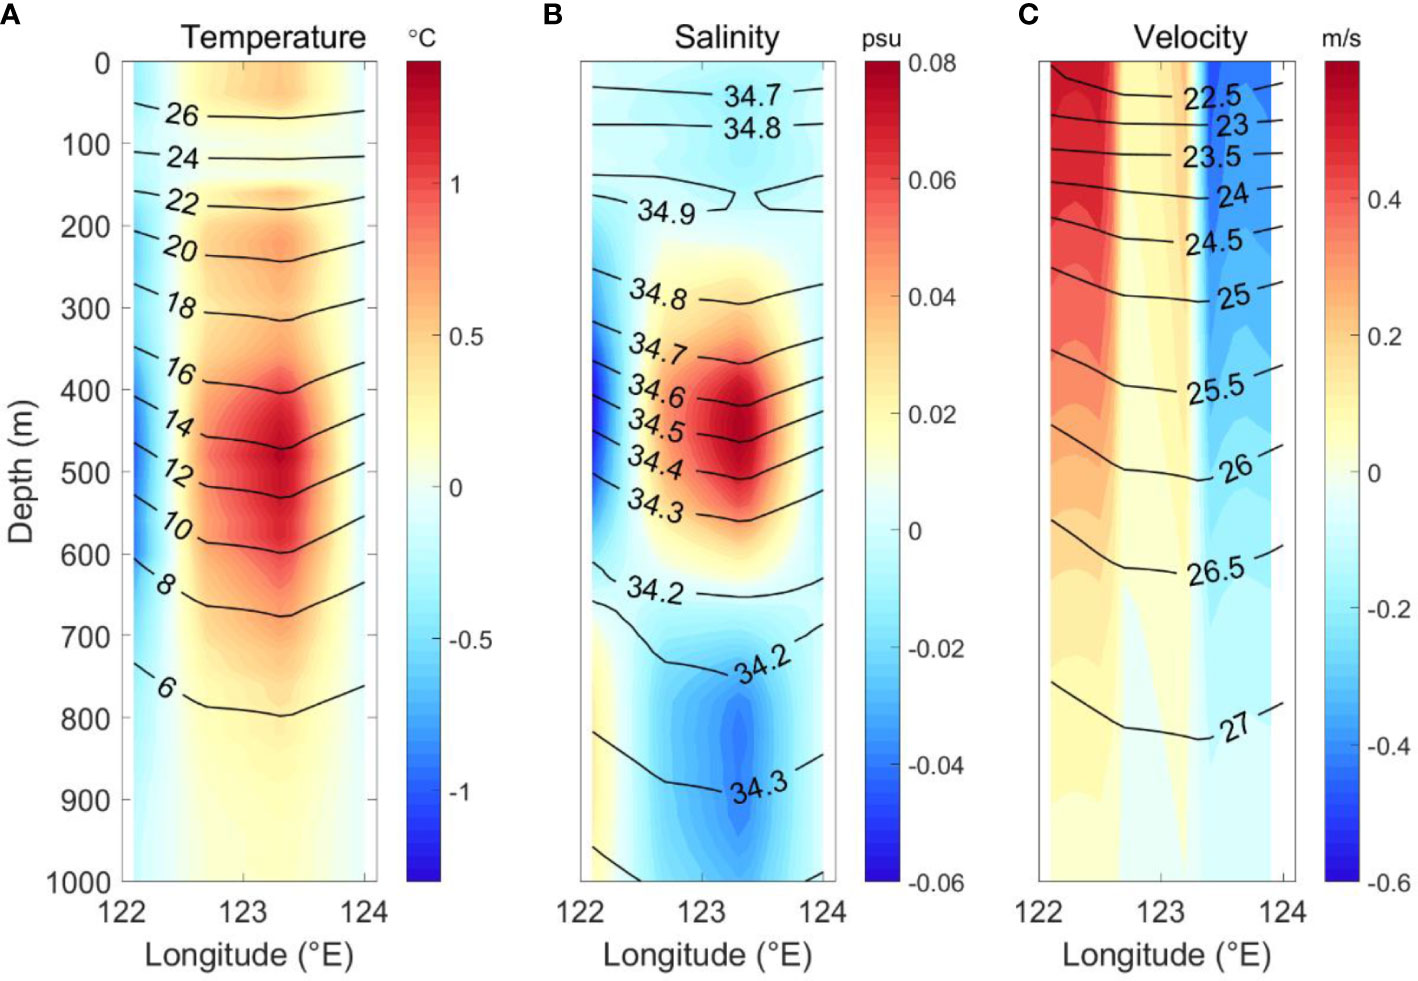
Figure 9 The temperature, salinity, and velocity along the 22.3°N section through the center of the anticyclonic eddy from (A, C). The color shading in (A–C) indicates temperature anomalies, salinity anomalies, and meridional velocity, respectively. The solid black lines in (A–C) indicate isothermal, isohaline, and isopycnic lines, respectively.
The largest positive temperature anomaly is located at the center of the eddy, with two positive temperature anomaly cores located at approximately 200 m and 500 m, with values of approximately 0.6°C and 1.4°C, respectively, which are basically located near the seasonal thermocline and the main thermocline. The salinity anomalies also show two cores below the subsurface layer, which are located at depths of 450 m and 850 m, with a maximum positive salinity anomaly of approximately 0.08 psu at 450 m. The characteristics of the salinity anomaly structure are related to the subsurface high-salinity water and intermediate waters. At the center of the anticyclonic eddy, downward movement of saline water from the subsurface will result in positive salinity anomalies at depths of 400–600 m. The downward transport of low-saline water in the intermediate layer will result in negative salinity anomalies below 600 m.
For the Kuroshio region west of 122.5°E, due to the see-saw like changes in the interaction between the anticyclonic eddy process, the variation of the Kuroshio is the opposite of the variation of the anticyclonic eddy. The Kuroshio side produces an overall negative temperature anomaly, and the salinity anomaly of the Kuroshio shows a negative–positive structure below 200 m. The upward movement of the low-salinity intermediate water at depths of 400–600 m results in a negative salinity anomaly at depths shallower than 600 m, with a maximum value of −0.06 psu at 450 m. Positive salinity anomalies of 0.04 psu are due to the upward movement of highly saline water in the deep sea below 700 m.
Figure 9C shows a velocity profile at the moment of the anticyclonic eddies, which shows in detail the characteristics of the velocity structure distribution inside the Kuroshio and anticyclonic eddies. The velocity at the center of the anticyclonic eddies is almost 0 m/s, with the velocity gradually increasing from the center outward. The left side of the eddy is connected to the Kuroshio, and the larger velocity range in the horizontal direction extends to approximately 122.75°E, thus illustrating the increase in the amplitude of the Kuroshio caused by the anticyclonic eddies.
4.2 The variation of cyclonic eddies interaction with Kuroshio
A cyclonic eddy structure is shown in Figure 10; the center of this eddy is located at 123.75°E, 22.35°N, and the radius is estimated to be approximately 60 km from the sea surface height. The maximum velocity of the eddy is approximately 0.7 m/s, and can exceed 0.1 m/s at 1,000 m. Based on the latitudinal section of the eddy center at 22.35°N (Figure 11), the isotherm, isohaline, and pycnocline are found to be nearly horizontal, with a slight upward convexity at the center of the cyclonic eddy. The elevation of the pycnocline is evident; for example, the 26 kg m−3 density contour is located between 450 m and 500 m in a downward concave structure at the anticyclonic eddy, while at the cyclonic eddy, it is almost entirely above 400 m and is nearly horizontal. It can also be seen that the negative temperature anomaly has two cores, corresponding to two thermoclines with a maximum value of −0.8°C, located between 100 and 200 m. The cyclonic eddy-induced salinity anomaly shows a negative–positive structure below the subsurface layer. The core of the negative salinity anomaly is located at approximately 350 m with a maximum value of −0.06 psu, while the core of the positive salinity is located at approximately 800 m with a maximum value of 0.04 psu. The salinity anomalies can also be explained as follows: the upward movement of eddy center causes the low saline water between 400-600m to upward lift, resulting in negative salinity anomalies above the intermediate layer, while the salinity anomalies below 600m are positive due to the upward lift of the deeper high saline water.
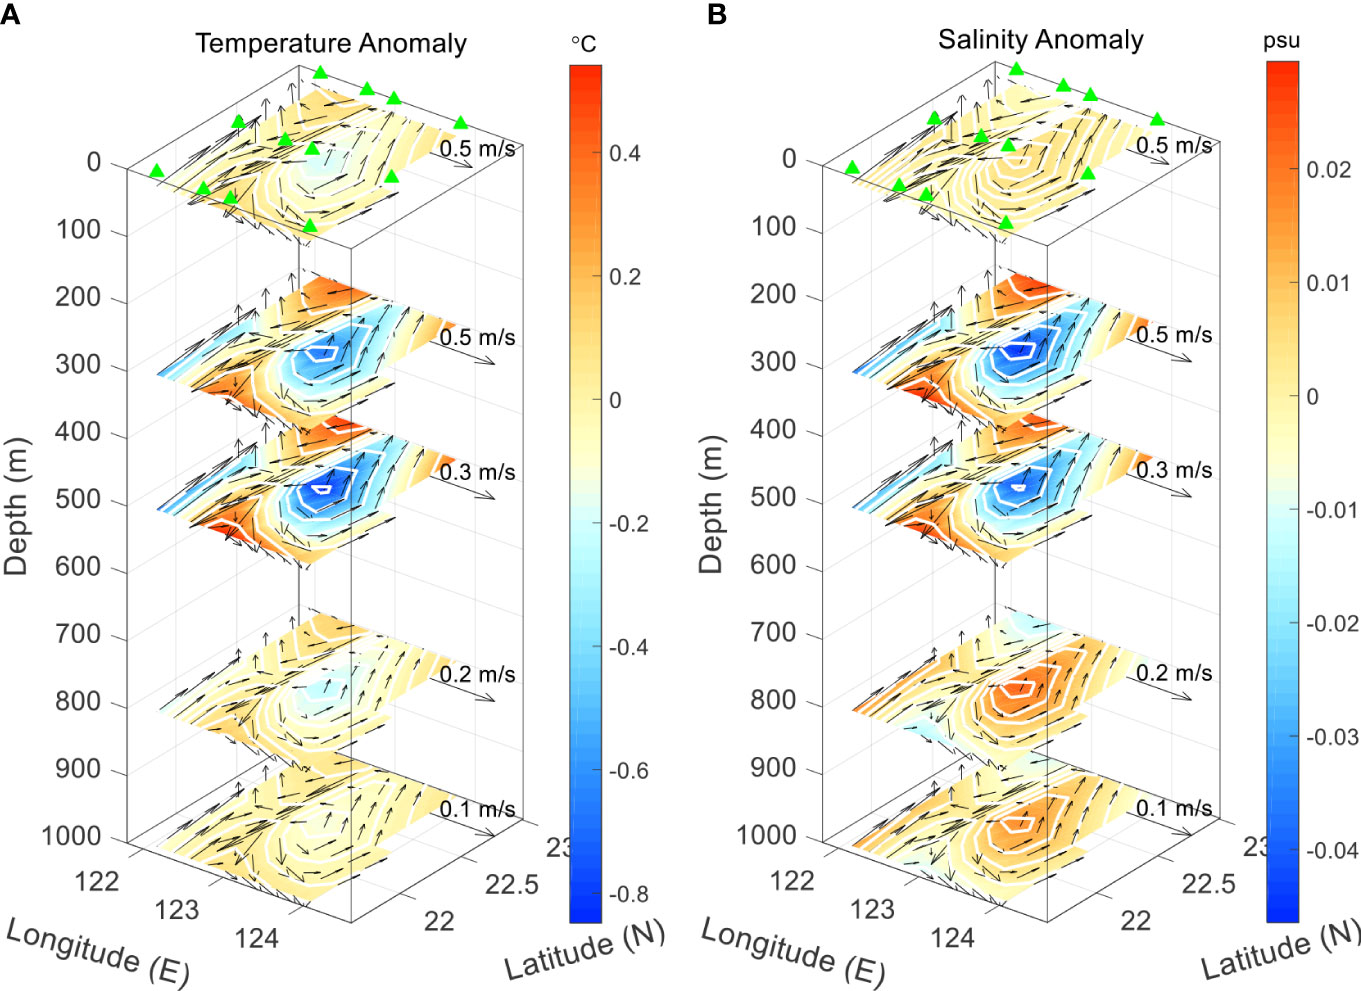
Figure 10 Three-dimensional structure of the cyclonic eddy. (A) Temperature anomaly and (B) salinity anomaly; the vector is the geostrophic current, and the color shading represents the temperature and salinity anomaly.
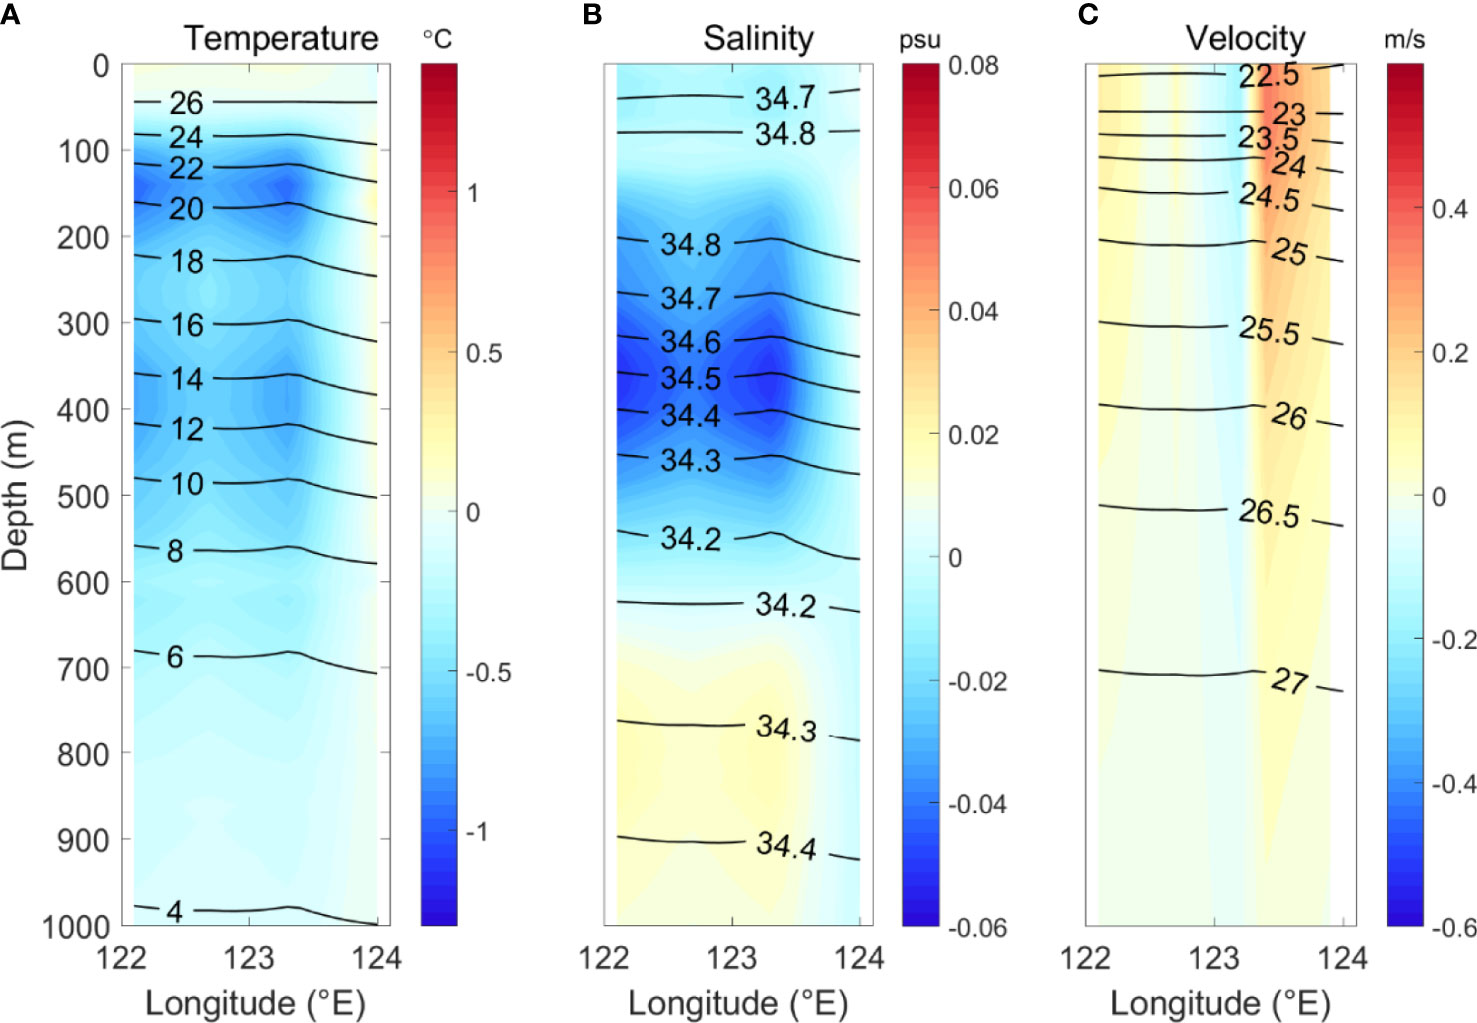
Figure 11 The temperature, salinity, and velocity along the 22.3°N section through the center of the cyclonic eddy from (A–C). The color shading in (A–C) indicates temperature anomalies, salinity anomalies, and meridional velocity, respectively. The solid black lines in (A–C) indicate isothermal, isohaline, and isopycnic lines, respectively.
For the cyclonic eddy impinging on the Kuroshio, the reduction in the tilt of the pycnocline has already been analyzed and the corresponding velocity distribution (Figure 11) clearly depicts this reduction in velocity. The velocity of the Kuroshio decreases to approximately 0.2 m/s and the amplitude of the Kuroshio decreases significantly. This is in contrast to the velocity of the eastern side of the cyclonic eddy, which is approximately 0.4 m/s. When a cyclonic eddy interacts with Kuroshio, it weakens the tilt of the pycnocline, and if the cyclonic eddy is strong enough, it can even induce the depth of the pycnocline on the Kuroshio side to be lower than that on the eddy side, resulting in a reversal of the Kuroshio direction.
5 Conclusion
Using the extra-large CPIES array deployed in the area from July 2018 to July 2019, the relationship between propagation time τ1,000, SLA, and pycnocline variability was established in conjunction with historical data. This revealed that pycnocline variability is one of the mechanisms of the eddy–current interaction process. The results show that a positive (negative) SLA corresponds to a smaller (larger) τ1,000 propagation time and thus to a deeper (shallower) depth of the pycnocline. During the impact between anticyclonic eddy and Kuroshio, the downward movement of the water at the inner center of the eddy depresses the pycnocline, while the upwelling of the water at the center of the Kuroshio generates a convex pycnocline. The interacting process increases the isopycnic tilt, thus increasing the Kuroshio velocity. The influence of the cyclonic eddy on the Kuroshio reduces the tilt of the pycnocline, resulting in a reduction in the Kuroshio velocity or amplitude.
Based on the temperature, salinity, and current data from the CPIES inversion, the three-dimensional structure of the mesoscale eddies and Kuroshio was constructed for the first time from the eddy interaction processes captured by the large observation array, showing that the influence depth of the mesoscale eddies and Kuroshio can exceed 1,000 m. During the interaction between anticyclonic eddies and Kuroshio, the temperature in the eddy center shows a positive anomaly, and the salinity shows a positive–negative structure. The corresponding Kuroshio variability is opposite to that of the anticyclonic eddy and shows negative temperature anomalies; negative salinity anomalies are seen above 600 m and positive salinity anomalies are observed below 600 m due to the uplift of the deeper high-saline water.
When a cyclonic eddy impinges the Kuroshio, pycnocline variability is almost horizontally distributed. The structures of the temperature and salinity anomalies within the cyclonic eddy and Kuroshio are similar, with the temperature showing an overall negative anomaly and the salinity anomaly showing a negative–positive structure below the subsurface layer. Both temperature and salinity changes are caused by the vertical movement of the water, such that the low-saline intermediate water above 600 m produces a negative salinity anomaly, while the upwelling of the deeper high-salinity water below 600 m causes a positive salinity anomaly. These results also demonstrate the feasibility of applying CPIES to the tracking and observing of mesoscale eddies, which is important for the study of heat and salt transport and for understanding how mesoscale eddies influence energy exchange.
Data availability statement
The original contributions presented in the study are included in the article/supplementary material. Further inquiries can be directed to the corresponding authors.
Author contributions
QR conceived the study. FY managed the research. QR, YL and RW performed the data analysis. FN, JW, XD, ZC, CZ, RZ, HZ and X-HZ carried out raw data analysis and were in charge of the necessary resources. QR led the manuscript writing and produced the figures, with relevant input from all authors. All authors contributed to the article and approved the submitted version.
Funding
This research is supported by the National Key Research and Development Program of China (No. 2022YFC3104104), the National Natural Science Foundation of China (No. 42206032), and the Natural Science Foundation of Shandong Province (No. ZR2022QD045). All data and code used in the current study are available from the corresponding author upon reasonable request.
Acknowledgments
The authors thank the reviewers for their comments on this paper. The authors also thank all the crew of the research vessel “HAI DA” for their help during the deployment and recovery of CPIES. The authors appreciate the constructive comments from all the reviewers, which greatly improved the content of the article. The comments have been fully considered and adapted in the revised manuscript accordingly.
Conflict of interest
The authors declare that the research was conducted in the absence of any commercial or financial relationships that could be construed as a potential conflict of interest.
Publisher’s note
All claims expressed in this article are solely those of the authors and do not necessarily represent those of their affiliated organizations, or those of the publisher, the editors and the reviewers. Any product that may be evaluated in this article, or claim that may be made by its manufacturer, is not guaranteed or endorsed by the publisher.
References
Buongiorno Nardelli B. (2013). Vortex waves and vertical motion in a mesoscale cyclonic eddy. J. Geophys. Res. Oceans 118, 5609–5624. doi: 10.1002/jgrc.20345
Chang Y. L., Miyazawa Y., Guo X. (2015). Effects of the STCC eddies on the kuroshio based on the 20-year JCOPE2 reanalysis results. Prog. Oceanography 135 (jun.), 64–76. doi: 10.1016/j.pocean.2015.04.006
Chelton D. B., Schlax M. G. (1996). Global observations of oceanic rossby waves. Science 272 (5259), 234–238.
Chelton D. B., Schlax M. G., Samelson R. M. (2011). Global observations of nonlinear mesoscale eddies. Prog. In Oceanography 91 (2), 167–216. doi: 10.1016/j.pocean.2011.01.002
Chelton D. B., Schlax M. G., Samelson R. M., de Szoeke R. A. (2007). Global observations of large oceanic eddies. Geophysical Res. Lett. 34 (15), L15606. doi: 10.1029/2007GL030812
Chen X., Dong H., Ke-Feng M., Yan L. (2018). Detailed investigation of the three-dimensional structure of a mesoscale cold eddy in the kuroshio extension region. Journal of Operational Oceanography 11:2, 87–99.
Chu X., Xue H., Qi Y., Chen G., Mao Q., Wang D., et al. (2014). An exceptional anticyclonic eddy in the south China Sea in 2010. J. Geophysical Research-Oceans 119 (2), 881–897. doi: 10.1002/2013JC009314
Dong D., Brandt P., Chang P., Yang X., Yan J., Zeng J. (2017). Mesoscale eddies in the northwestern pacific ocean: Three-dimensional eddy structures and heat/salt transports. J. Geophysical Research: Oceans 122, 9795–9813.
Dong C., McWilliams J. C., Liu Y., Chen D. (2014). Global heat and salt transports by eddy movement. Nat. Commun. 5, 3249. doi: 10.1038/ncomms4294
Donohue K., Watts D. R., Tracey K., Wimbush M., Park J.-H., Bond N., et al. (2008). Program studies the kuroshio extension. Eos Trans. Am. Geophysical Union 89 (17), 161–162. doi: 10.1029/2008EO170002
Guo J., Zhang Z., Xia C., Guo B., Yuan Y. (2018). Topographic–baroclinic instability and formation of kuroshio current loop. Dynamics Atmospheres Oceans 81, 15–29. doi: 10.1016/j.dynatmoce.2017.11.002
He Q., Zhan H., Cai S., He Y., Huang G., Zhan W. (2018). A new assessment of mesoscale eddies in the south china sea: Surface features, three-dimensional structures, and thermohaline transports. J. Geophysical Research: Oceans 123 (7), 4906–4929.
Hu J., Gan J., Sun Z., Zhu J., Dai M.. (2011). Observed three-dimensional structure of a cold eddy in the southwestern south China Sea. J. Geophysical Research: Oceans 116 (C5), C05016.
Jan S., Mensah V., Andres M., Chang M.-H., Yang Y. J. (2017). Eddy-kuroshio interactions: Local and remote effects. J. Geophysical Res. 122 (12), 9744–9764. doi: 10.1002/2017JC013476
Jan S., Yang Y. J., Wang J., Mensah V., Kuo T.-H., Chiou M.-D., et al. (2015). Large Variability of the kuroshio at 23.75°N east of Taiwan. J. Geophysical Res. Oceans 120 (3), 1825–1840. doi: 10.1002/2014JC010614
Kennelly M., Tracey K., Watts D. R. (2007). Inverted echo sounder data processing manual. inverted echo sounder data processing report. doi: 10.21236/ADA477328
Koszalka I., Bracco A., McWilliams J. C., Provenzale A. (2009). Dynamics of wind-forced coherent anticyclones in the open ocean. J. Geophysical Res. 114, C08011. doi: 10.1029/2009JC005388
Kwon Y. O., Alexander M. A., Bond N. A., Frankignoul C., Lu A. T. (2010). Role of the gulf stream and kuroshio–oyashio systems in Large-scale atmosphere–ocean interaction: A review. J. Climate 23 (12), 3249–3281. doi: 10.1175/2010JCLI3343.1
Liu W., Liu Q., Yinglai J. (2004). The kuroshio transport East of Taiwan and the Sea surface height anomaly from the interior ocean. J. Ocean Univ. China 3 (002), 135–140. doi: 10.1007/s11802-004-0023-x
Liu Y., Dong C., Guan Y., Chen D., McWilliams J., Nencioli F. (2012). Eddy analysis in the subtropical zonal band of the North Pacific Ocean. Deep-Sea Research Part I-Oceanographic Research Papers 68, 54–67. doi: 10.1016/j.dsr.2012.06.001
Li H., Xu F., Wang G. (2022). Global mapping of mesoscale eddy vertical tilt. J. Geophysical Research: Oceans 127, e2022JC019131.
Li H., Xu F., Wang G., Shi R. (2022). A multi-layer linear rossby wave dispersion relation for vertical tilt of mesoscale eddies. J. Geophysical Research: Oceans 127, e2022JC018703.
McGillicuddy D. J. (2016). Mechanisms of physical-biological-biogeochemical interaction at the oceanic mesoscale. Annu. Rev. Mar. Sci. 8, 125–159. doi: 10.1146/annurev-marine-010814-015606
Meinen C., Luther D., Watts D., Chave A., Tracey K. (2003). Mean stream coordinates structure of the subantarctic front: Temperature, salinity, and absolute velocity. J. Geophys Res. 108, 3263. doi: 10.1029/2002JC001545
Nan F., Xue H., Xiu P., Chai F., Shi M., Guo P. (2011). Oceanic eddy formation and propagation southwest of Taiwan. J. Of Geophysical Research-Oceans 116 (C12), C12045. doi: 10.1029/2011JC007386
Nitani H. (1972). “Beginning of the kuroshio,” in Kuroshio,Its physical aspects. Eds. Stommel H., Yoshida K. (Tokyo: Univ. of Tokyo Press), 129–163.
Qiu B. (1999). Seasonal eddy field modulation of the north pacific subtropical countercurrent: TOPEX/Poseidon observations and theory. J. Phys. Oceanography 29, 2471–2486. doi: 10.1175/1520-0485(1999)029<2471:SEFMOT>2.0.CO;2
Qiu B., Chen S. M. (2005). Eddy-induced heat transport in the subtropical North Pacific from Argo, TMI, and altimetry measurements. Journal of Physical Oceanography 35(4), 458–473. doi: 10.1175/JPO2696.1
Qiu B., Chen S. (2010a). Interannual variability of the north pacific subtropical countercurrent and its associated mesoscale eddy field. J. Phys. Oceanography 40 (1), 213–225. doi: 10.1175/2009JPO4285.1
Qiu B., Chen S. (2010b). Interannual variability of the north pacific subtropical countercurrent and its associated mesoscale eddy field. J. Phys. Oceanography 40 (1), 213–225. doi: 10.1175/2009JPO4285.1
Ren Q., Yu F., Nan F., Wang J., Xu A. (2020). Intraseasonal variability of the kuroshio east of Taiwan, China, observed by subsurface mooring during 2016–2017. J. Ocean. Limnol 38, 1408–1420. doi: 10.1007/s00343-020-9286-3
Shu Y., Xiu P., Xue H., Yao J., Yu J. (2016). Glider-observed anticyclonic eddy in northern south China Sea. Aquat. Ecosystem Health Manage. 19, 3, 233–3, 241. doi: 10.1080/14634988.2016.1208028
Tsai C.-J., Andres M., Jan S., Mensah V., Sanford T. B., Lien R.-C., et al. (2015). Eddy-kuroshio interaction processes revealed by mooring observations off Taiwan and Luzon. Geophysical Res. Lett. 42 (19), 8098–8105. doi: 10.1002/2015GL065814
Viúdez A. (2018). Two modes of vertical velocity in subsurface mesoscale eddies. J. Geophysical Research: Oceans 123, 3705–3722. doi: 10.1029/2017JC013735
Watts D. R., Qian X. S., Tracey K. L. (2001). Mapping abyssal current and pressure fields under the meandering gulf stream. J. Of Atmospheric And Oceanic Technol. 18 (6), 1052–1067. doi: 10.1175/1520-0426(2001)018<1052:MACAPF>2.0.CO;2
Watts D., Sun C., Rintoul S. (2001). A two-dimensional gravest empirical mode determined from hydrographic observations in the subantarctic front. J. Phys. Oceanogr 31, 2186–2209. doi: 10.1175/1520-0485(2001)031<2186:ATDGEM>2.0.CO;2
Xu C., Shang X.-D., Huang R. X. (2014). Horizontal eddy energy flux in the world oceans diagnosed from altimetry data. Sci. Rep. 4, 5316. doi: 10.1038/srep05316
Yang G., Wang F., Li Y., Lin P. (2013). Mesoscale eddies in the northwestern subtropical pacific ocean: Statistical characteristics and three-dimensional structures. J. Of Geophysical Research-Oceans 118 (4), 1906–1925. doi: 10.1002/jgrc.20164
Zhang Z., Zhang Y., Wang W., Huang R. X. (2013), Universal structure of mesoscale eddies in the ocean, Geophys. Res. Lett., 40, 3677–3681
Zhang D. X., Lee T. N., Johns W. E., Liu C. T., Zantopp R. (2001). The kuroshio east of Taiwan: Modes of variability and relationship to interior ocean mesoscale eddies. J. Of Phys. Oceanography 31 (4), 1054–1074. doi: 10.1175/1520-0485(2001)031<1054:TKEOTM>2.0.CO;2
Zhang Z., Tian J., Qiu B., Zhao W., Ping C., Wu D., et al. (2016). Observed 3D structure, generation, and dissipation of oceanic mesoscale eddies in the south China Sea. Sci. Rep. 6 (1), 24349. doi: 10.1038/srep24349
Zhang Z., Wang W., Qiu B. (2014). Oceanic mass transport by mesoscale eddies. Science 345 (6194), 322–324.
Zhang W.-Z., Xue H., Chai F., Ni Q. (2015). Dynamical processes within an anticyclonic eddy revealed from argo floats. Geophysical Res. Lett. 42 (7), 2342–2350. doi: 10.1002/2015GL063120
Zhao R., Zhu X.-H., Zhang C., Zheng H., Zhu Z.-N., Ren Q., et al. (2022). Summer anticyclonic eddies carrying kuroshio waters observed by a large CPIES array west of the Luzon strait. J. Phys. Oceanography 52 (11), 1520–0485. 2853.
Keywords: mesoscale eddy, three-dimension structure, Kuroshio, eddy current interaction, CPIES
Citation: Ren Q, Liu Y, Wang R, Nan F, Wang J, Diao X, Chen Z, Yu F, Zhang C, Zhao R, Zheng H and Zhu X-H (2023) Three-dimensional structure of mesoscale eddies and their interaction with Kuroshio based on observations from a CPIES array. Front. Mar. Sci. 10:1109894. doi: 10.3389/fmars.2023.1109894
Received: 28 November 2022; Accepted: 27 January 2023;
Published: 14 February 2023.
Edited by:
Guihua Wang, Fudan University, ChinaReviewed by:
Yukiharu Hisaki, University of the Ryukyus, JapanEiji Masunaga, Ibaraki University, Japan
Hong Li, Fudan University, China
Copyright © 2023 Ren, Liu, Wang, Nan, Wang, Diao, Chen, Yu, Zhang, Zhao, Zheng and Zhu. This is an open-access article distributed under the terms of the Creative Commons Attribution License (CC BY). The use, distribution or reproduction in other forums is permitted, provided the original author(s) and the copyright owner(s) are credited and that the original publication in this journal is cited, in accordance with accepted academic practice. No use, distribution or reproduction is permitted which does not comply with these terms.
*Correspondence: Yansong Liu, bGl1eWFuc29uZzA3QHFkaW8uYWMuY24=; Fei Yu, eXVmQHFkaW8uYWMuY24=
 Qiang Ren
 Yansong Liu
 Ran Wang
 Feng Nan
 Jianfeng Wang
 Xinyuan Diao
 Zifei Chen
 Fei Yu1,2,3*
 Hua Zheng