 Nan Zhang
 Huan Li
 Jiabao Zhang3
 Zheng Gong
- 1State Key Laboratory of Hydrology-Water Resources and Hydraulic Engineering, Hohai University, Nanjing, China
- 2Jiangsu Key Laboratory of Coast Ocean Resources Development and Environment Security, Hohai University, Nanjing, China
- 3Field Scientific Observation and Research Station of Ministry of Education for Tidal Flat Ecosystem in the Jiangsu Radial Sand Ridge Region, Hohai University, Nanjing, China
Introduction: The ecological environment of tidal flats often changes due to tidal erosion and sedimentation. The distribution of tidal flat surface sediment is a natural reflection of the changes in the external dynamic environment, the spatial and temporal distribution pattern is of great significance.
Methods: In this study, the output structure of traditional convolutional neural network is combined with BP neural network. Meanwhile, four phases of Sentinel-2 multispectral images were collected and combined with field data from the Doulonggang tidal flat in Jiangsu Province, China, to construct the sediment composition inversion model.
Results: The inversion accuracy was higher than 80% compared with the measured results. According to the inversion result, from 2017 to 2022, the surface sediment particle size of the tidal flat in Jiangsu varied seasonally and was coarse in summer and fine in winter. Additionally, the sediment composition tended to coarsen, showing an interannual change trend of increasing sand content and decreasing clay and silt contents.
Discussion: The above change of the sedimentary environment of the tidal flat may be caused by the decrease of fine grained sediment deposition, the introduction of exotic vegetation, the global sea level rise and the influence of human activities.
1 Introduction
A tidal flat is an important low-lying coastal landform located at the junction of sea and land. Such flats are widely distributed on the eastern coast of China, the western and southeastern coasts of Britain, the western coast of the Netherlands, the northwestern coast of the United States and the western coast of France (Dalrymple et al., 1992; Li et al., 2022). The tidal flat in China starts in Liaoning Province in the north and ends at the coast of Guangxi in the south. The tidal flat is 4000 km long, and the Jiangsu tidal flat within this coastal zone is the longest in China (Baoguo et al., 1997). The Jiangsu tidal flat is 888.9 km long, and it starts from the Xiuzhen estuary to the north of the Yangtze estuary. The Jiangsu tidal flat has a strong carbon sink capacity and plays an extremely essential role in improving coastal protection, protecting biodiversity and improving the social and economic value of Jiangsu (Liu et al., 2020).
However, tidal flats are among the regions most sensitive to global environmental change. In recent years, issues related to the vulnerability of the ecological environment of tidal flats have been reported many times (Kirwan and Megonigal, 2013; Temmerman and Kirwan, 2015; Murray et al., 2019; Schuerch et al., 2019). Global climate change and high-intensity tidal flat resource development have led to a sharp decline in the size of tidal flat wetlands in China. Between 1950 and 2000, the area of the tidal flat in the Yellow Sea decreased by approximately 50-80% (Murray et al., 2014). From 1985 to 2015, the tidal flat area of the Yangtze River estuary decreased by approximately 36% (Chen et al., 2016). Currently, the Jiangsu tidal flat also faces serious erosion issues (Yu and Zou, 2013). The distribution characteristics of tidal flat sediment components are very sensitive to the erosion of the external dynamic environment. Studying the evolution of tidal flat erosion and deposition can better alert people of the erosion risk of tidal flats in the future.
Understanding the characteristics of the sediment composition distribution is often of high value for decision-making, planning, and the construction of geo-morphodynamic models (Cabezas-Rabadán et al., 2021). However, the tidal flat environment is very complex, and it is very difficult to sample due to the abundance of inaccessible muddy surfaces. Although the accuracy of in situ observations of sediment components is relatively high (Wang and Ke, 1997; Jia et al., 2006; Gong et al., 2017), observations are difficult to obtain over large areas. Insufficient field data may lead to the oversimplification of the particle size distribution and hinder the prediction and modelling of tidal flat erosion and deposition trends (Buscombe et al., 2014). In view of the above problems, airborne and spaceborne remote sensing are used to map the clay content and intertidal grain size distribution (Rainey et al., 2003), the inverse contents of sand, silt and clay (Castillo et al., 2011) and different sediment types (Adam et al., 2008) to facilitate data acquisition. Additionally, various types of hyperspectral, multispectral and microwave satellite data are used to classify sediment types in intertidal zones (Yates et al., 1993), and inverse particle size parameters can be determined. The use of these data has been demonstrated in Germany (Jung et al., 2015), Italy (Pitarch et al., 2019), South Korea (Park, 2019), China’s Yangtze River estuary and East China Sea (Nasiha et al., 2019), the Jiangsu coast (Zhang et al., 2015) and other areas. Some scholars have also generated classification maps of tidal flat surface sediment (Fairley et al., 2018; Kim et al., 2019) through UAV remote sensing, which can improve the application of optical instruments in tidal flat research.
In the past, spectral methods were rarely used to obtain the properties of sediment in tidal flats due to the relatively low accuracy of results when building sediment composition inversion models. Moreover, most models can only be effectively applied in a specific single region at a given time, and generality is difficult to confirm at different spatial and temporal scales. In recent years, with advances in deep learning theory and computing power (Smirnov et al., 2014), convolutional neural network technology has achieved good results in a large number of remote sensing image recognition and classification tasks, such as slope detection (Ghorbanzadeh et al., 2019), wetland extraction (Mahdianpari et al., 2018), ship detection (Geng et al., 2021) and chlorophyll content inversion (Jin et al., 2021). In addition, some scholars applied convolutional neural networks to quantify the grain size on pebble beaches, and the verification result R2 reached 0.75 (Soloy et al., 2020). The above results show that convolutional neural networks have strong abstraction and generalization abilities and can identify the important features in remote sensing data. Moreover, such networks can be further applied to assess the distribution of sediment components in different historical periods and enhance the understanding on dynamic geomorphic processes. Thus, this approach has important value for developing dynamic geomorphic models of tidal flats.
The purpose of this study is to establish an inversion model of the tidal flat surface sediment composition by improving the convolutional neural network method and to use Sentinel-2 remote sensing imagery to obtain the spatial and temporal distributions of the sediment composition. The specific objectives are as follows: (1) establish and evaluate the applicability of convolutional neural network technology in the inversion of tidal flat sediment components, (2) obtain the spatial distribution characteristics of the sediment components of the Jiangsu Doulonggang tidal flat from 2017 to 2022 and (3) analyse and discuss the seasonal variations and interannual evolution of the sediment components of the Jiangsu Doulonggang tidal flat.
2 Materials and methods
2.1 Study area
In this study, the Doulonggang tidal flat was selected as the study area (Figure 1) to monitor the change in muddy tidal flats. Due to frequent changes in nearshore erosion and deposition, this area is the most typical muddy tidal flat in Jiangsu Province, China, which reflects the complex characteristics of mixed sand, silty sand, sandy silt, clayey silt, silt and other tidal flat sediment types (Wang and Ke, 1997). The Doulonggang tidal flat is located in Dafeng District, Yancheng city, which is in central-eastern Jiangsu Province, with an average width of 3-4 km, a slope of 0.01-0.03%, an irregular semidiurnal tide and a tidal range of 2-4 m near the shore (Dai et al., 2019).
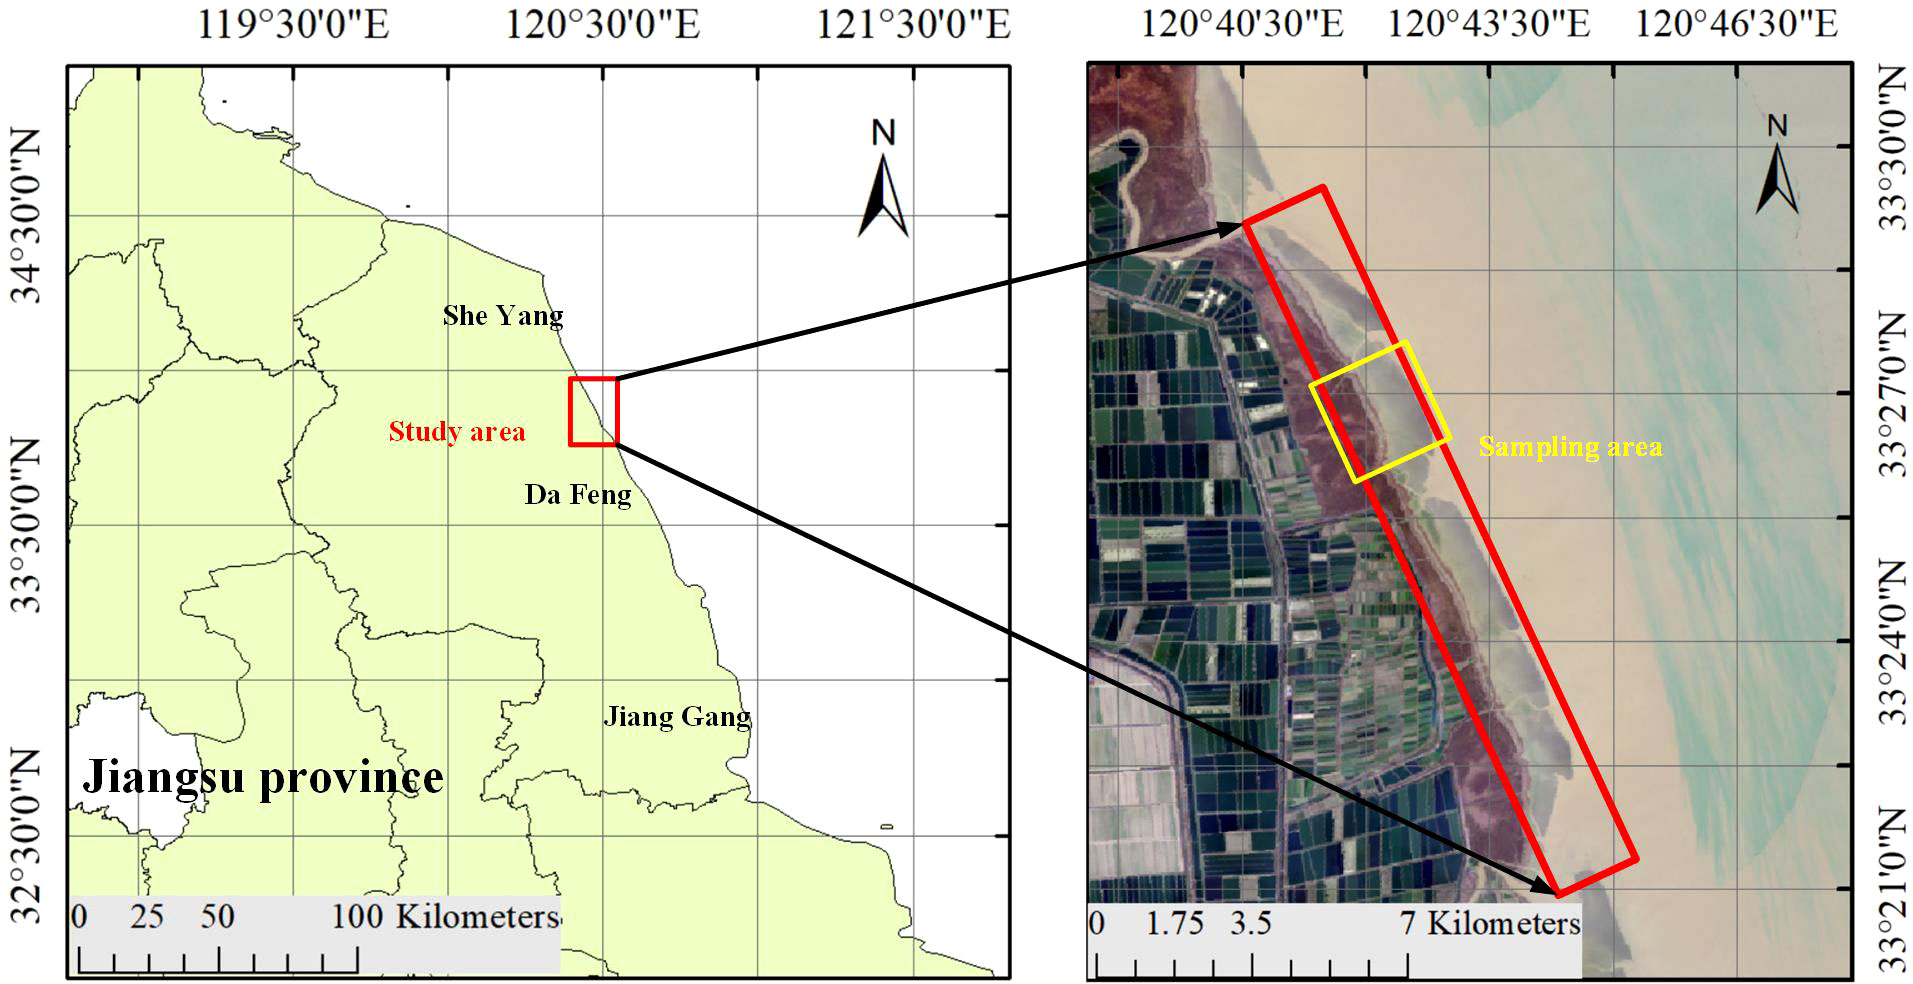
Figure 1 Monitoring and Study Area of Sediment Grain Size Change.
2.2 Sediment collection and analysis
2.2.1 Tidal flat sediment sampling
To ensure that the intertidal zone was always exposed during tidal flat sediment sampling and did not affect the normal progress of the sampling work, four periods of low tide on December 4, 2017 (42 sediment samples were collected), October 19, 2018 (140 sediment samples were collected), June 11, 2019 (108 sediment samples were collected), and November 3, 2019 (45 sediment samples were collected) were selected. Field sampling was performed at the Doulonggang tidal flat. The surface sediment (<3 cm) on the tidal flat was sampled, placed into a prenumbered sampling bag and sealed. As shown in Figure 2, 335 samples were obtained from this tidal flat sediment sampling.
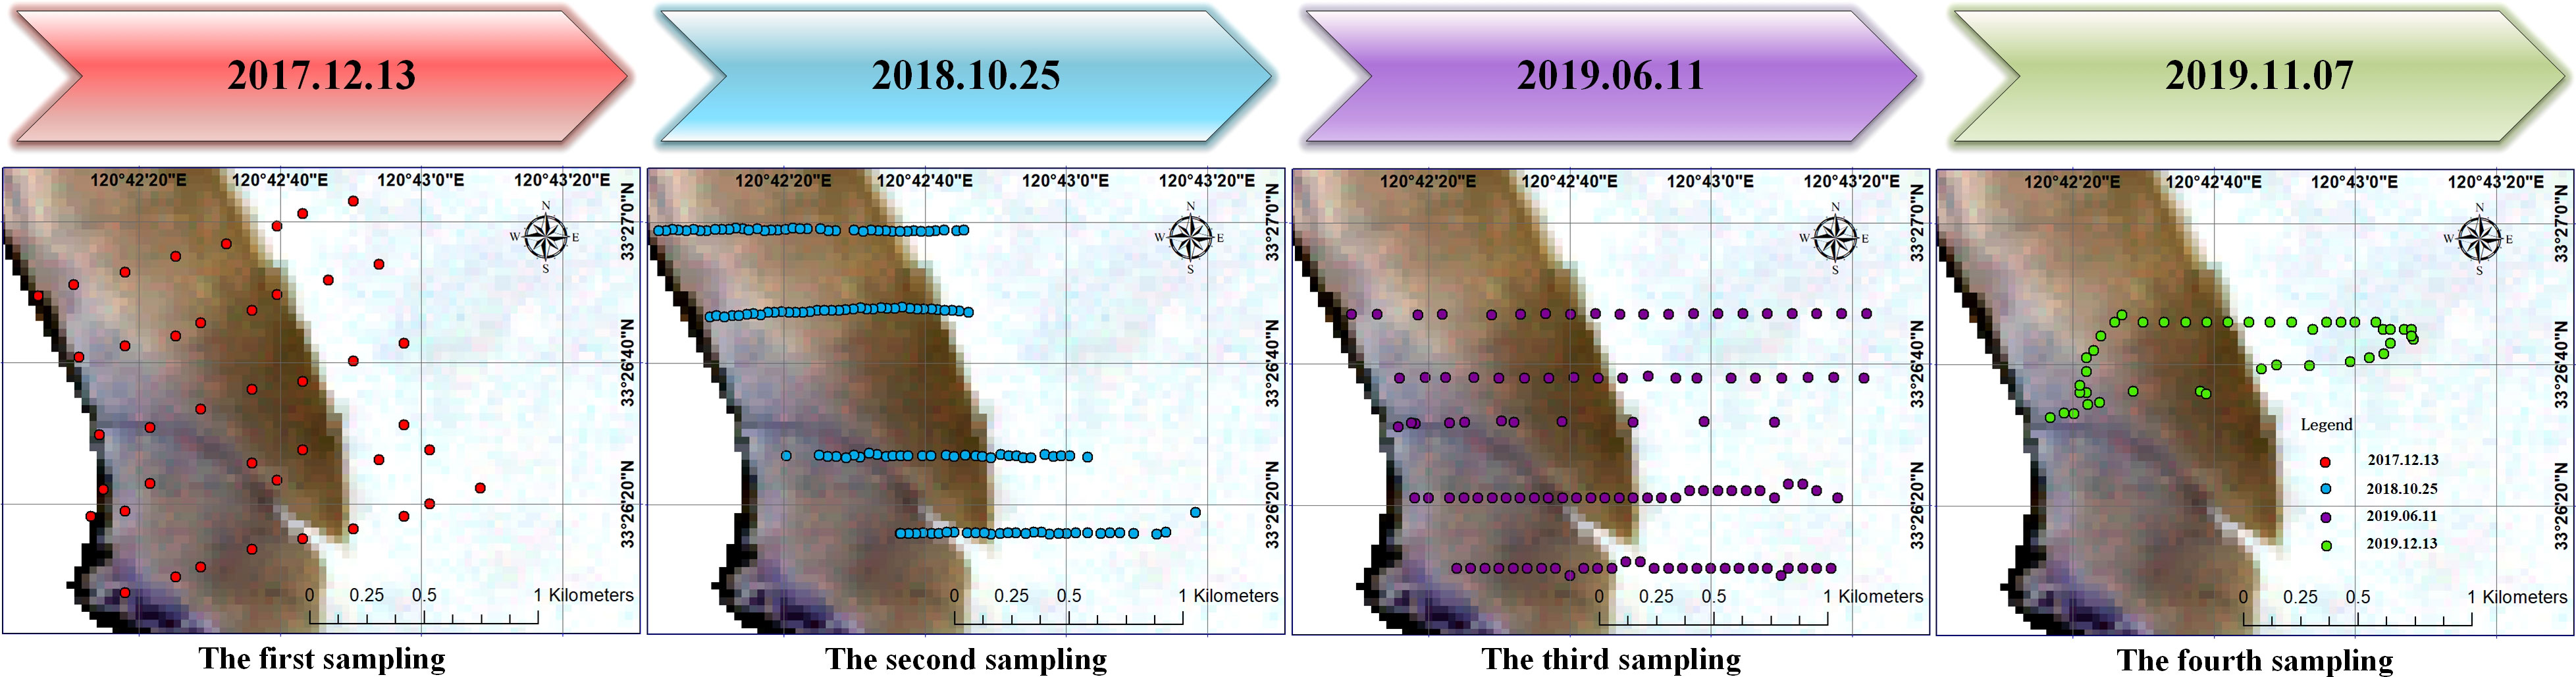
Figure 2 Location of Field Sampling Points in the Study Area.
2.2.2 Analysis of tidal flat sediment composition
A Mastersizer 3000 Laser Diffraction Particle Size Analyser was used to analyse the component content of sediment samples. The measuring range is 0.01-3500 µm. The relative error of repeated measurements of the same sample is less than 3%, which can be considered highly accurate (Choi et al., 2016).
After removing the carbonate in the sediment with hydrochloric acid and removing the organic matter in the sediment with hydrogen peroxide, the collected sample was divided into three suspensions. Each prepared soil particle suspension was analysed with the Mastersizer 3000 Laser Diffraction Particle Size Analyser to ensure that the shading was within the appropriate range. Three groups of particle size distribution tests were conducted, and the values of the three groups of tests were averaged to obtain the particle size distribution of the sample. According to the definitions of gravel, sand, silty sand and clay, the particle size distribution of the samples was divided, and the boundaries were 2 mm, 1/16 mm (0.0625 mm) and 1/256 mm (0.0039 mm), respectively. Finally, through statistical analysis, the proportions of gravel, sand, silt and clay in the sample were determined, the sediment component content was obtained, and the sediment was classified according to the Folk Triangle Sediment Classification Method (Folk et al., 1970).
2.3 Acquisition and preprocessing of multispectral remote sensing data
The multispectral remote sensing data used in this study were Sentinel-2 imagery from the European Space Agency. Sentinel-2 consists of two satellites, Sentinel-2A and Sentinel-2B, which were launched on June 23, 2015, and March 7, 2017, respectively (Duan et al., 2022). The unique dual-satellite remote sensing mode used by these satellites can obtain data through the same sensor, greatly improving the temporal resolution of the imagery. Data from wave bands B2 (wavelength 458-523 nm), B3 (wavelength 543-578 nm), B4 (wavelength 650-680 nm) and B8 (wavelength 785-900 nm), all with a spatial resolution of 10 m, were downloaded. The data can be downloaded for free on the Copernicus Open Access Hub (https://scihub.copernicus.eu/ ).
As shown in Table 1, eight Sentinel-2 images with no or little cloud cover were selected for this study. Sen2Cor is the processor for Sentinel-2 product generation and formatting. It corrects Sentinel-2 Level-1C products for atmospheric scattering and absorbance, delivering a Level-2A product (Pancorbo et al., 2021). In this study, after atmospheric correction (Bernardo et al., 2017) of the images by Sen2Cor_v2.8.0, the vegetation and water bodies in the tidal flat area were removed through supervised classification and threshold segmentation (Abbaszadeh et al., 2019), and the bare flat image was obtained for subsequent analysis. The imaging time and sampling time of Phases 1-4 were quasi-synchronous, and the images were mainly used to build training samples and establish a surface sediment inversion model. The images from Phases 5-8 were used for the inversion model application to obtain the spatial and temporal distributions of surface sediment components.
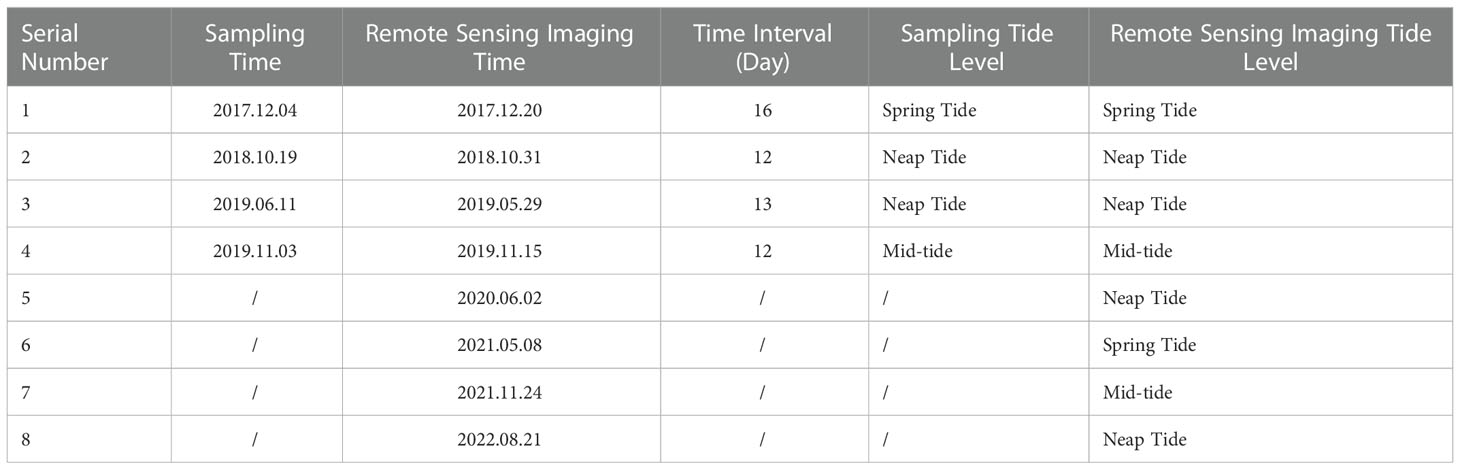
Table 1 Sediment sampling and remote sensing imaging times.
2.4 Normalization of multitemporal remote sensing data
Normalization is an important part of any multitemporal remote sensing inversion approach. Although radiance is generally used a reference after radiation correction, pre-processed images are often still incomparable due to different observation geometries and meteorological conditions during data collection. Normalization can make the features have the same metric scale,significantly affecting the applicability of inversion models (Paolini et al., 2007).
In this study, a statistics-based correction method was adopted for relative radiance correction (Li et al., 2014). Z score normalization was first conducted for each band according to the mean radiation value and standard variance of Sentinel-2 images of the study area in each period. Next, the radiation values of images in each period were converted to comparable relative values. Then, according to the mean and standard deviation of radiance for the reference image, the radiance of each band of the corrected image was projected to the domain consistent with the reference image. In this study, the image data from the first period (December 20, 2017) were selected to establish the reference image. The specific radiance correction equation is
In equation (1), gd is the pixel radiation value after correction of the source image; uf and σf are the mean and standard deviation of radiance for the reference image, respectively; and gr, ur, and σr are the pixel radiation, mean radiance and standard deviation of radiance for the source image, respectively.
2.5 Construction of the sediment composition inversion model
The sediment particles on the surface of a tidal flat are small, and the texture characteristics are not always obvious. The relationship between the content of a component and remote sensing spectral reflectance is very complicated. The convolutional neural network (CNN) can effectively reduce the complexity of parameters, and it has significant advantages for deep structures. Thus, CNNs are commonly used in deep learning, and their application scope is gradually expanding (Smirnov et al., 2014). However, most CNN structures are used for image classification, and they cannot be directly used to build inversion models. Therefore, the BP-CNN algorithm was improved in this study, and the adjustment content is shown in Figure 3.
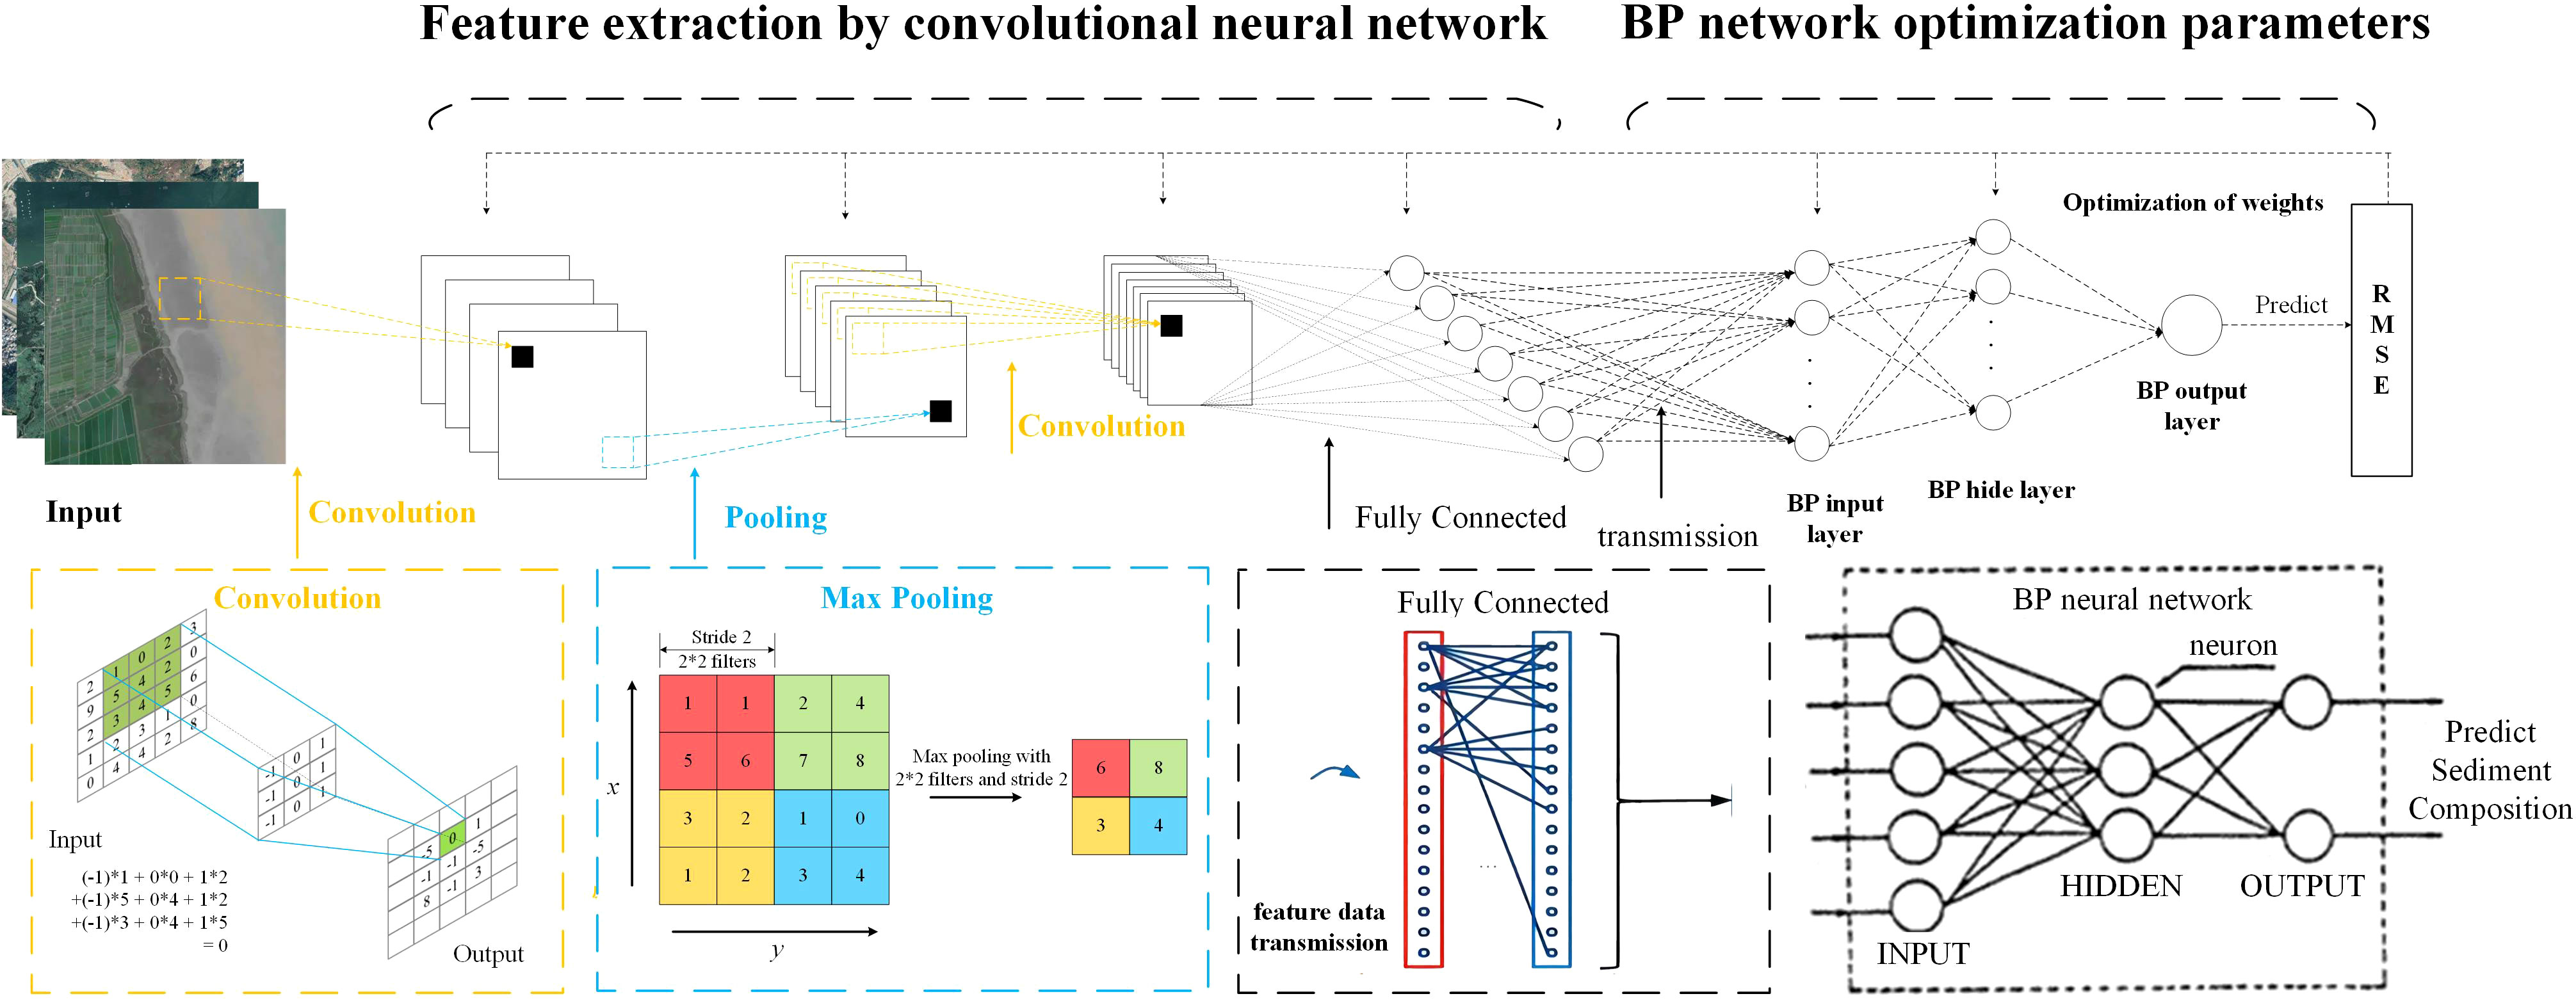
Figure 3 Structure of the Sediment Inversion Model.
In the BP-CNN structure, the convolution layer is moved around the input image through the convolution kernel and accumulates the product of the convolution kernel and image values to identify the characteristics of the input object. Pooling layers can compress the features of convolution, reduce the complexity of the convolution operation and ensure that the image features do not change due to rotation, translation, expansion, etc. In this study, the convolution layer and pooling layer in the convolutional network structure were used as feature extractors without modification.
In the network output, the fully connected layer does not classify the images but analyses the correlation between the feature values and the sediment component contents. Here, a back-propagation neural network was introduced to determine the optimal weight (lowest RMSE) for each feature by testing the correlation variation between the feature value and sediment component content. According to the prediction results, the network backpropagated the error to each layer of the network and updated the parameters according to the difference between the actual value and the predicted value to achieve promising training results.
Sediment samples and matched remote sensing images were used to generate training sets. The sample data from the first three imaging periods were randomly divided into a training set and a verification set at a ratio of 3:1. The training set was input into the sediment composition inversion model for training, and the accuracy of the model was evaluated using the verification set. After completing the training, the fourth phase of sample data was used to evaluate the accuracy and transferability of the model in retrieving tidal flat sediment components,and compared this article methods with stepwise linear regression, SVM regression, BP neural network and convolutional neural network.
3 Results and discussion
3.1 Particle size distribution analysis
The surface sediment of the tidal flat in the study area is mainly fine sediment, with almost no gravel. Therefore, the sediment was classified based on the Folk Triangle Gravel-Free Sediment Classification Method. As shown in Figure 4, the surface sediment types of the Doulonggang tidal flat are mainly silty sand (zS), sandy silt (sZ) and silt (Z), of which sandy silt (sZ) is the most widely distributed.
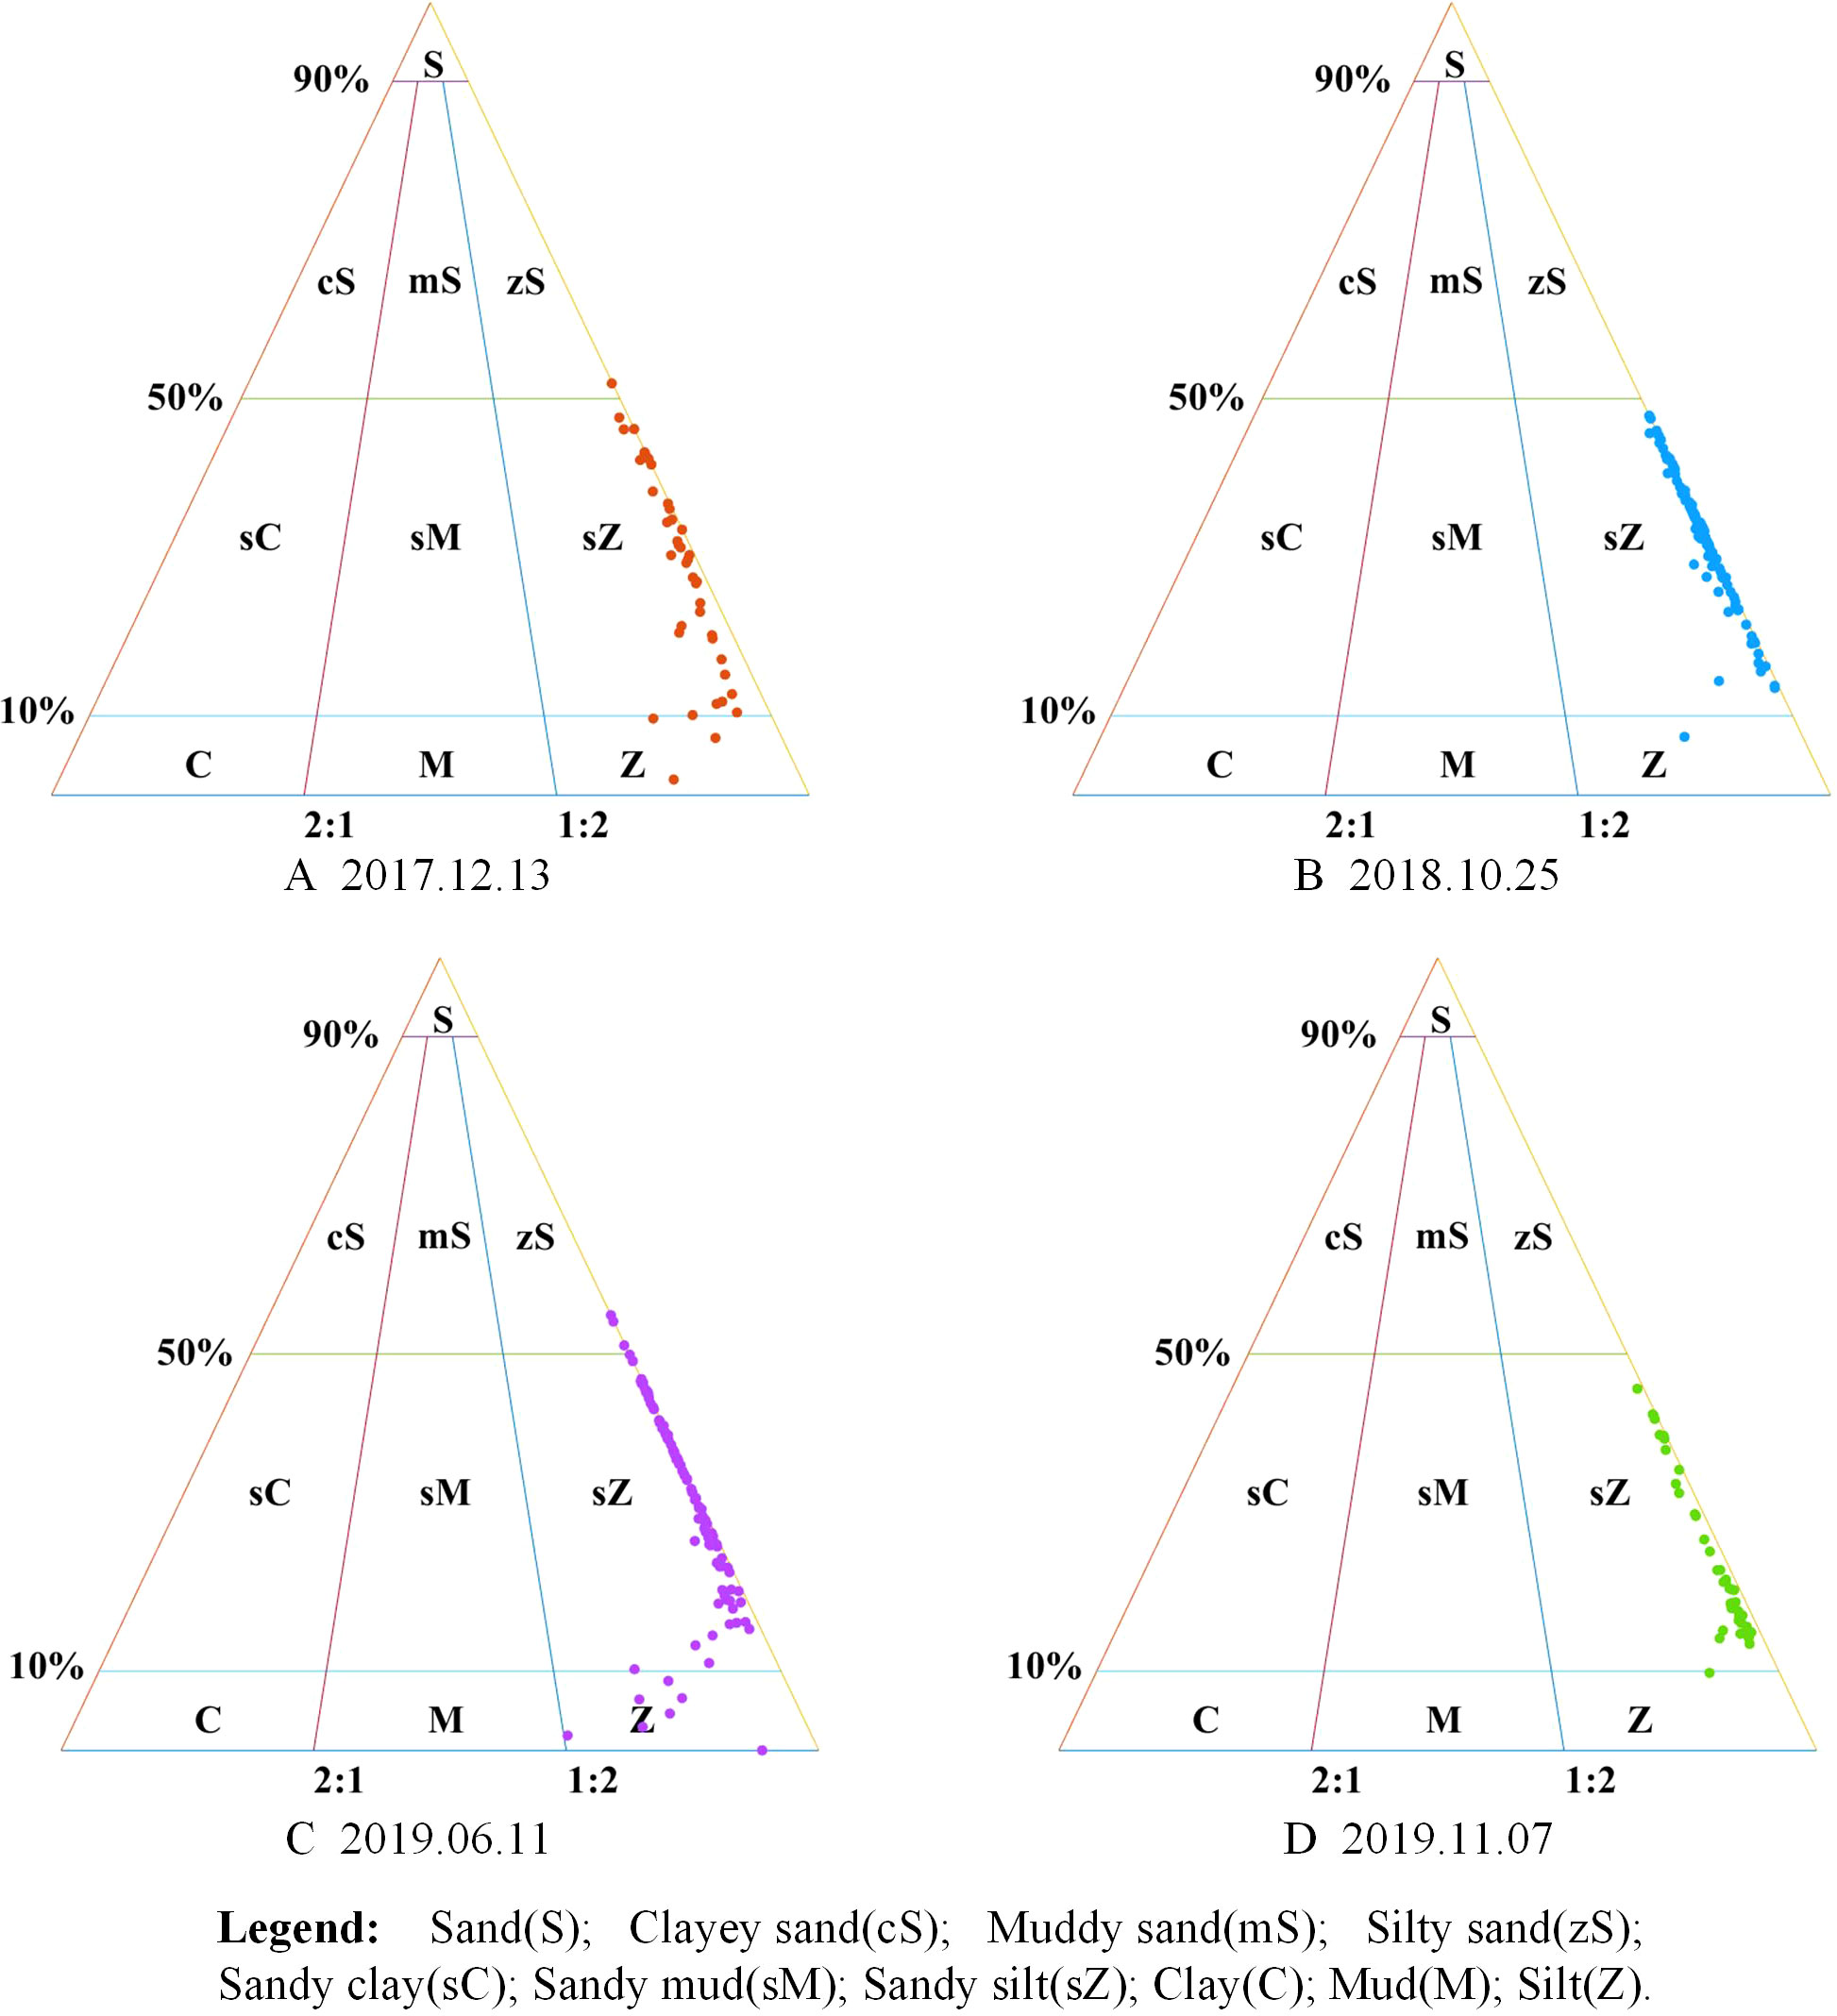
Figure 4 According to Folk Classification Theory, 335 Samples Obtained from Field Research were used for Particle Size Analysis.
As shown in Table 2, from 2017 to 2019, the clay content in the Doulonggang tidal flat was always low, with an average content of approximately 2%. The silt content was relatively high, accounting for approximately 45-85% of the sediment composition across the main part of the study area. The sand content was at a medium level, accounting for 10-50% of the sediment composition. The median sediment particle size D50 in the study area ranged from 8 μm to 80 μm, and the average median particle size was approximately 60 μm.
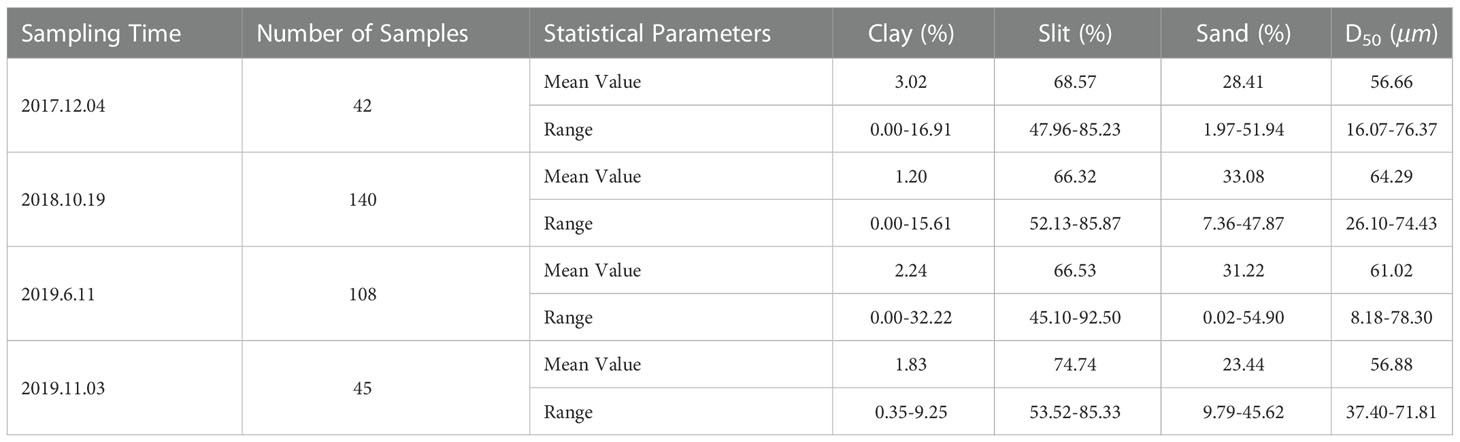
Table 2 Particle size distribution of the surface sediments at different time stages in the Doulonggang tidal flat.
3.2 Establishment of a remote sensing inversion model for sediment composition
The training set was input into the adjusted BP-CNN for training, and the training accuracy of the set observation model was verified(Phase 1-3). As shown in Figures 5A–C, the prediction accuracy R2 of the model for clay, silt and sand was 0.75. The root mean square error (RMSE) for clay was lower than 2.4, and the RMSEs for silt and sand were lower than 6.0.
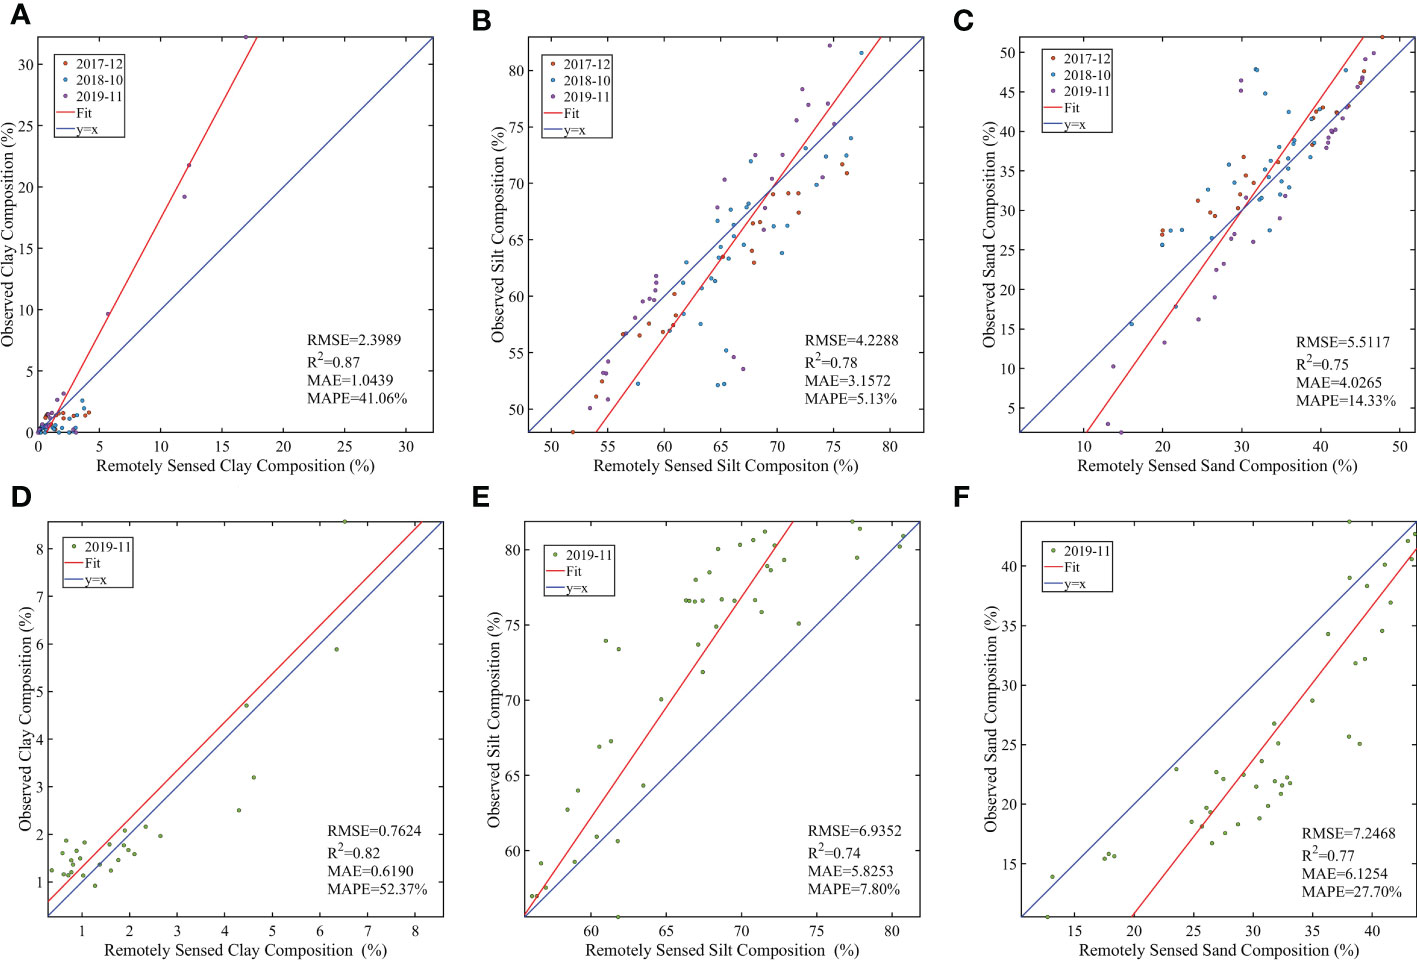
Figure 5 Accuracy of the Sediment Composition Inversion Model used in the BP-CNN Model. (A–C) show the training accuracy of the model for clay, silt and sand(Phase 1-3). (D–F), show the validation accuracy for clay, silt and sand (Phase 4). The accuracy of the model prediction results was higher than 80%.
After debugging the model, the sample data for Phase 4 were used to further evaluate the model. As shown in Figures 5D–F, the R2 of the validation group reached 0.74, and the RMSE was not significantly different from that for the training validation set. Additionally, the mean absolute error (MAE) of the two inspections was no greater than 1.05 for clay and 6.5 for silt and sand. The mean absolute percentage error (MAPE) of silt and sand was less than 30%, and the MAPE of clay was approximately 50%. The proposed method is compared with the traditional method based on the same verification set in Table 3. The results show that the BP-CNN method can accurately identify the relative relationship among each sediment component, and the inversion model displays good accuracy and transferability.
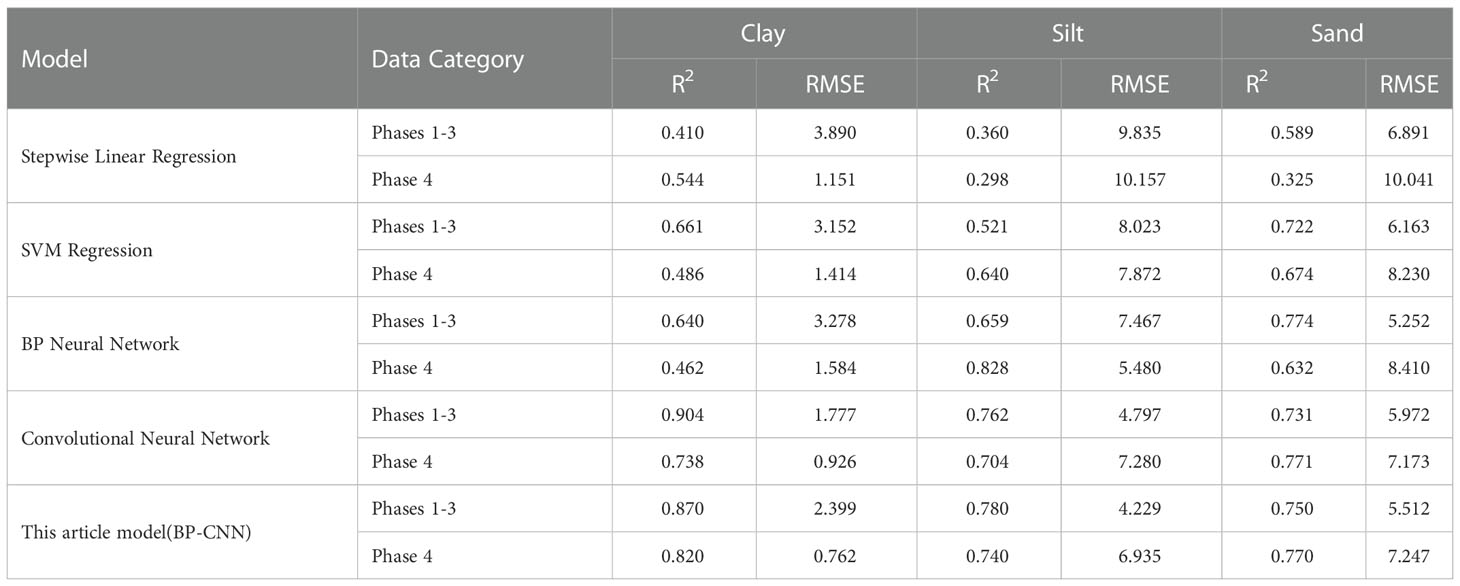
Table 3 The accuracy of different methods in tidal flat sediment composition inversion.
3.3 Inversion results for the surface sediment composition
To clearly assess the changes in the distribution of the surface sediment components of the Doulonggang tidal flat in recent years, the sediment inversion model was applied to eight phases of Sentinel-2 (Table 1) data during the period of 2017-2022.
3.3.1 Inversion diagram of the surface sediment component contents in the Doulonggang tidal flat
Figure 6 shows the change in sediment composition in the Doulonggang tidal flat from 2017 to 2022 based on the developed BP-CNN. According to the inversion results, the sediment in the study area was mainly silty sand, followed by sand and then clay, which was consistent with the measured results above.
1. As shown in Figures 6A–H, the clay in the study area was mainly distributed along the front edge of the salt marsh. The clay content only slightly increased in summer and remained relatively low in other periods.
2. As shown in Figures 6I–P, the silt content in the study area was relatively high, and silt was mainly distributed from the front edge of the salt marsh to the intertidal zone. The content ranged from 45% to 85% and was low in summer and relatively high in winter.
3. As shown in Figures 6Q–X, the sand in the study area was mainly distributed in the subtidal zone, near the water border, and the content near the shore was relatively low. The seasonal variation in the sand content was opposite that for silt, with a low content in winter and a high content in summer.
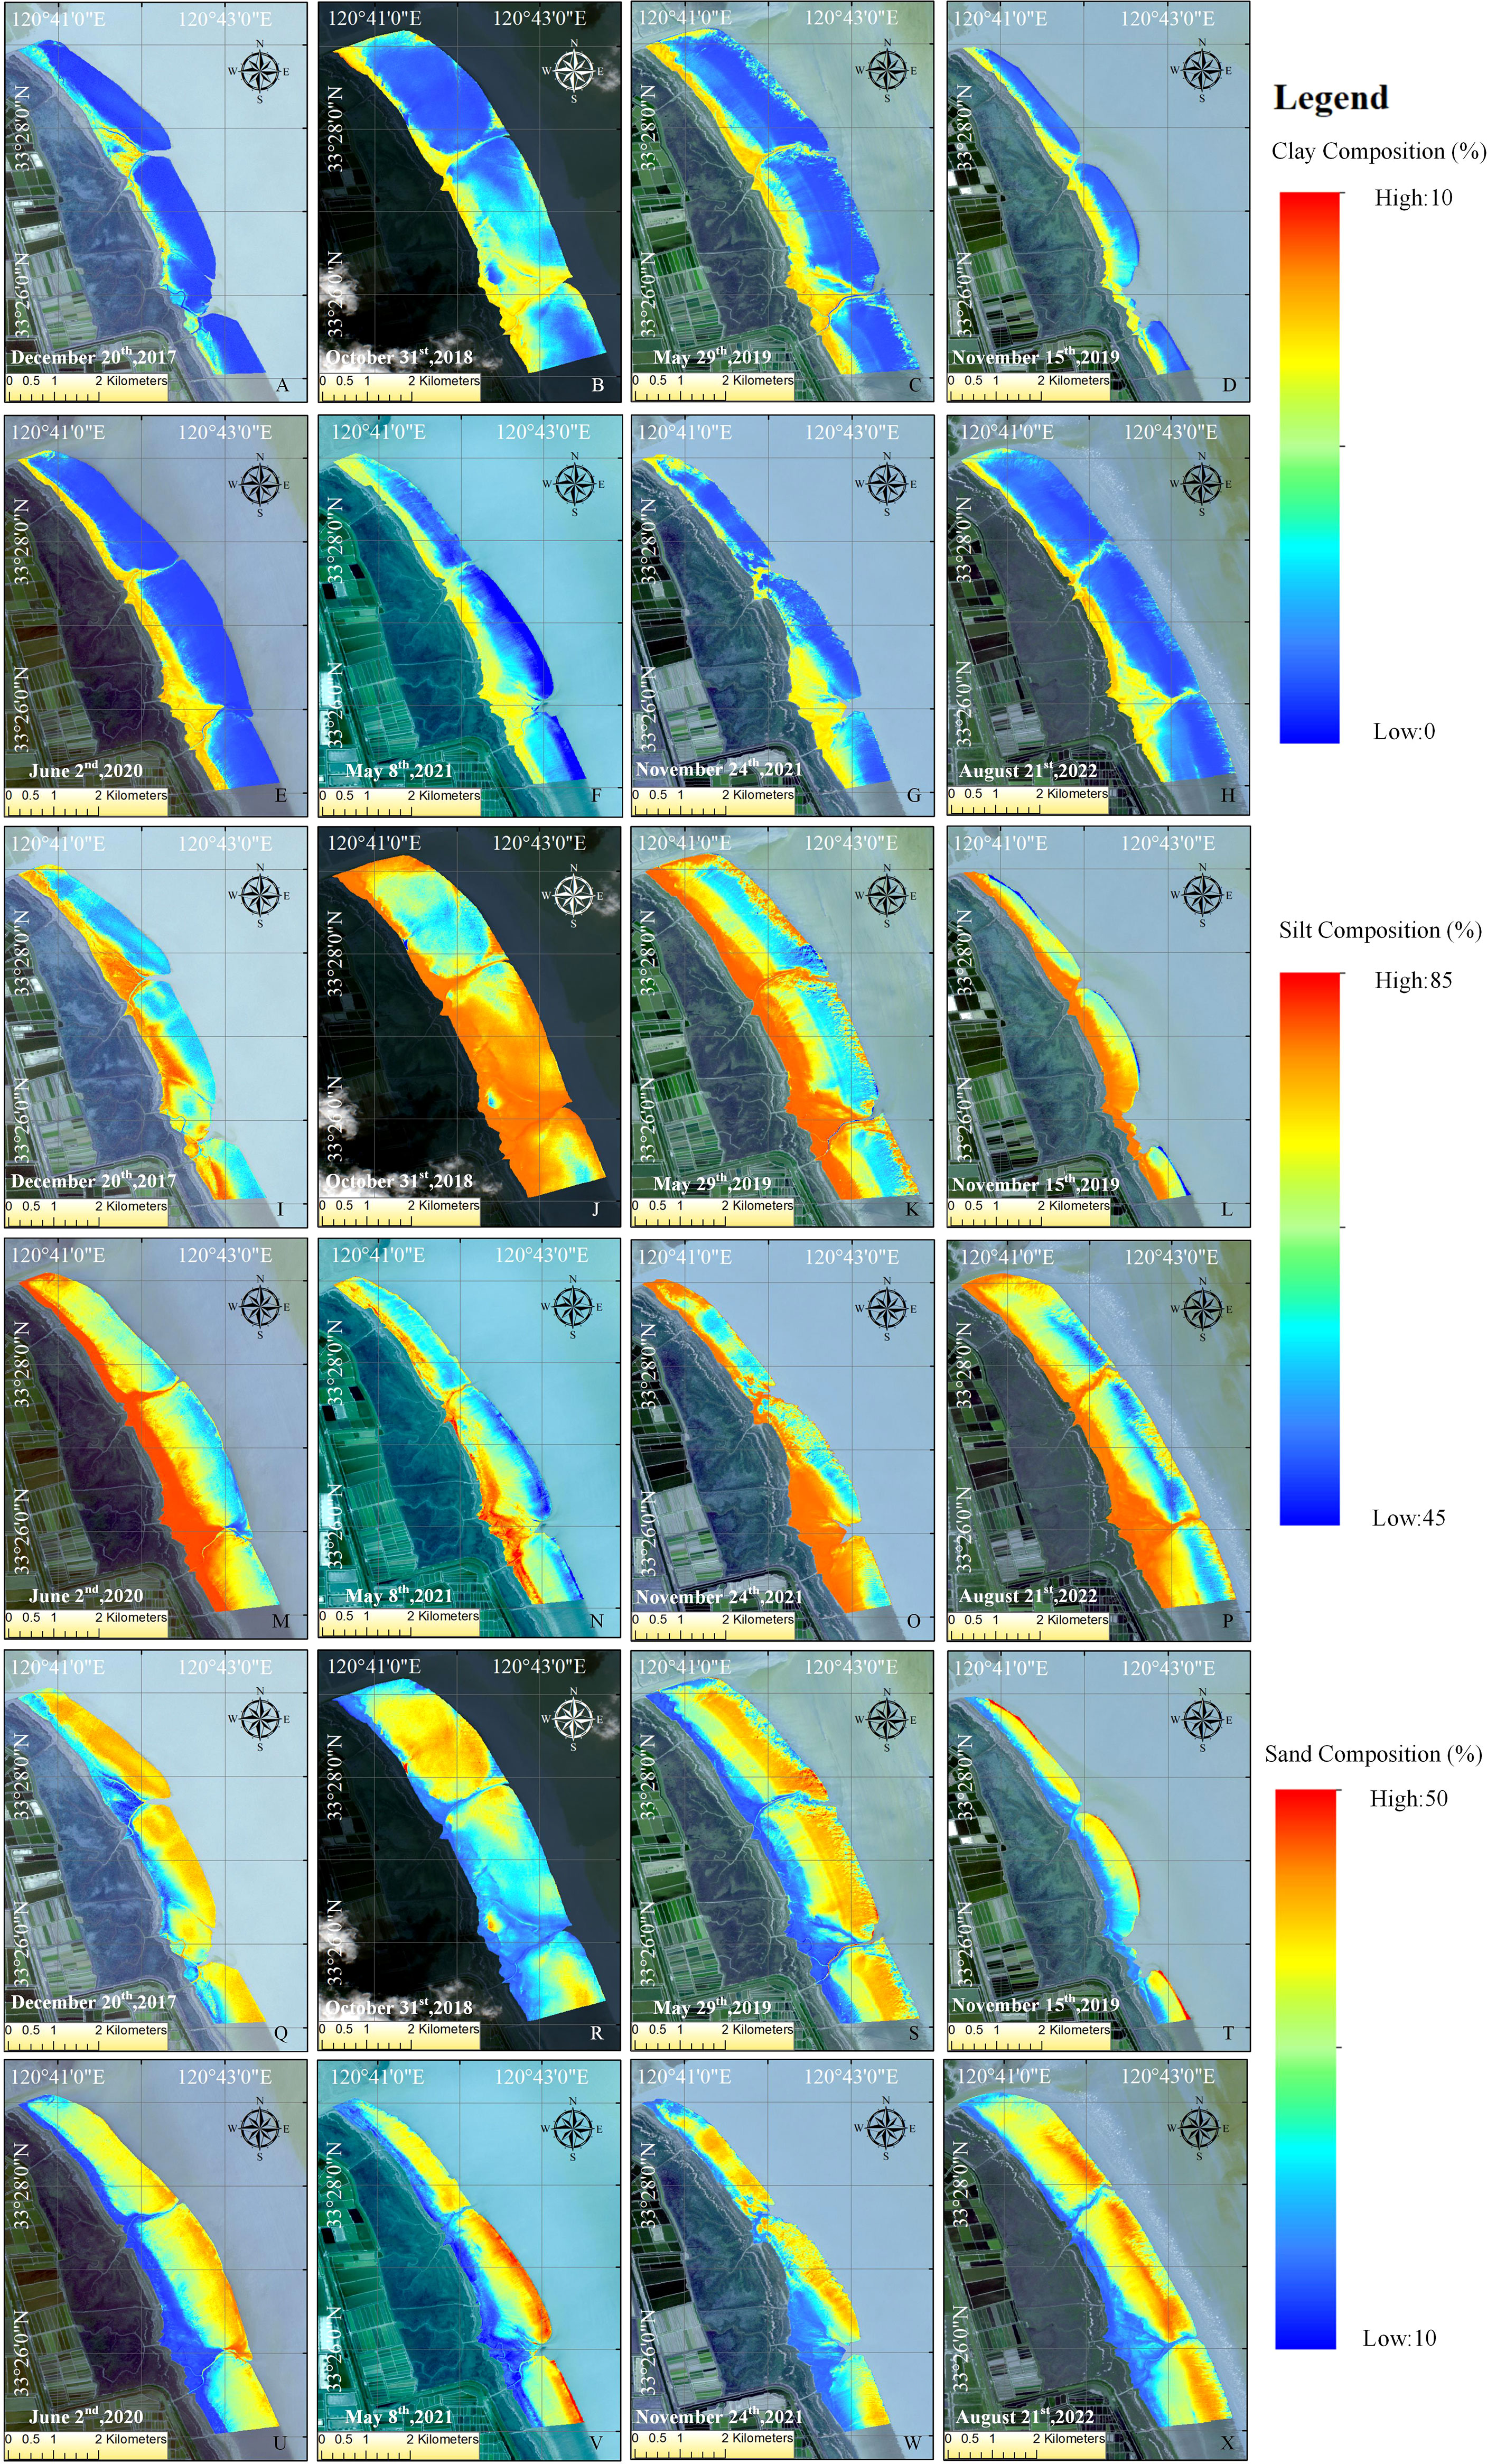
Figure 6 Inversion Diagram of the Sediment Component Contents in the Tidal Flat from 2017 to 2022 based on the BP-CNN Model Results. (A–H), (I–P), and (Q–X), respectively show the spatial distribution of clay,silt and sand from 2017 to 2022. The sediment in the study area was mainly silty sand, followed by sand and then clay.
In general, the grain sizes of mud and sand in the study area trend from fine to coarse from land to sea and have coarsened in recent years.
3.3.2 Distribution characteristics of surface sediment components in different seasons and years
We calculated the average of the inversion content of sediment components in the study area in different periods and observed the corresponding evolution trend. The results are shown in Figure 7. The grain size distribution of the surface sediment in the Doulonggang tidal flat area was variable at different time intervals. Because the clay content was very small, only the seasonal and interannual spatial and temporal changes for sand and silt are discussed.
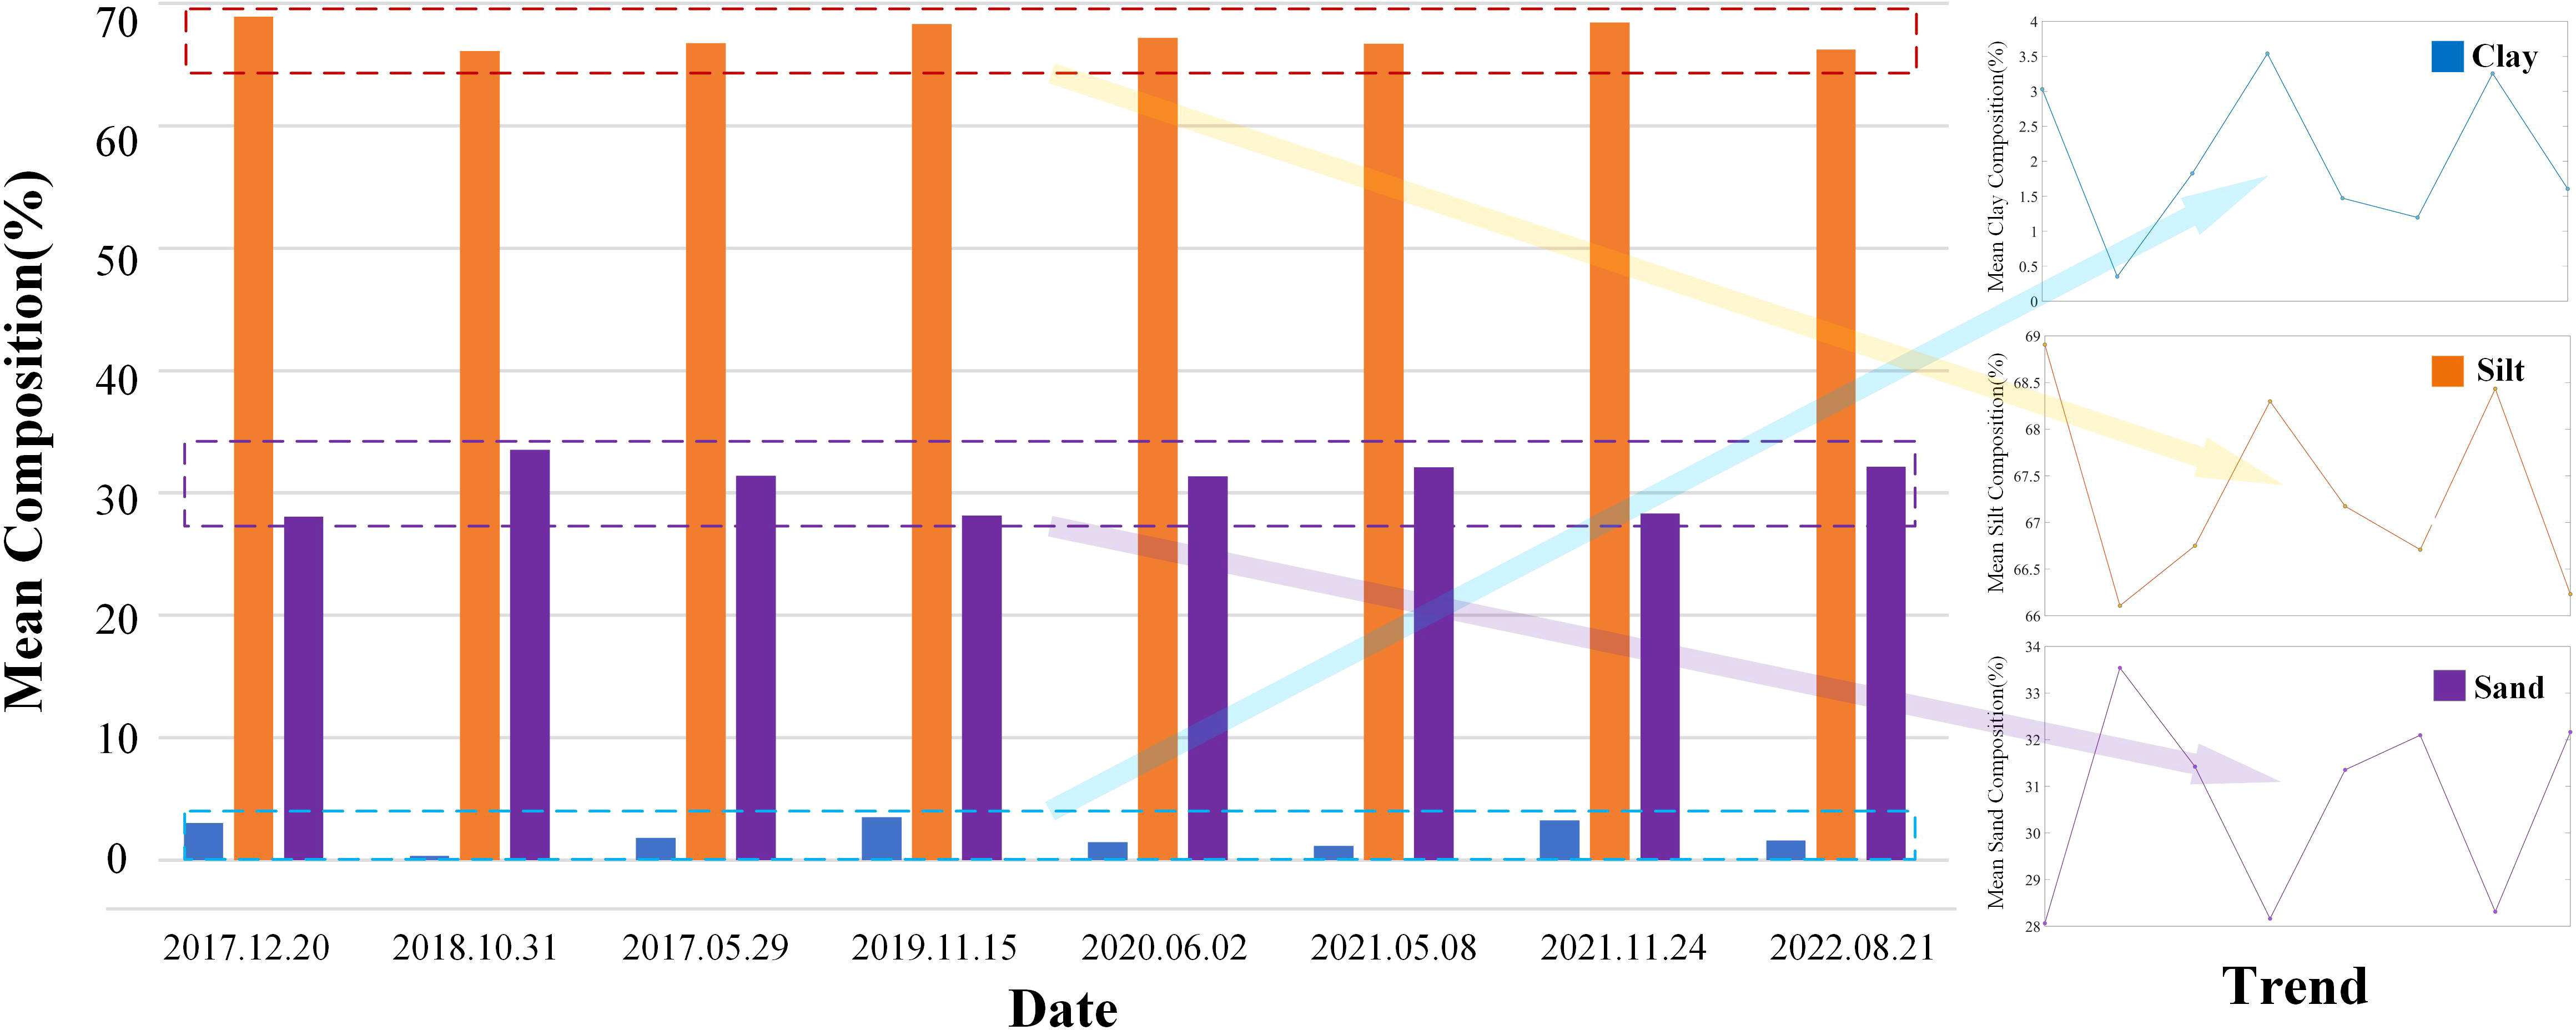
Figure 7 Evolution Trend of the Average Contents of Sediment Components in the Doulonggang Tidal Flat from 2017 to 2022.
The grain size of the surface sediment in the study area exhibited a seasonal variation pattern of coarse in summer and fine in winter. This phenomenon is consistent with in situ observations (Gong et al., 2017) and the results simulated by hydrodynamic models (Jia et al., 2006; Gong et al., 2017; Zhu et al., 2022). The seasonal variation of tidal flat particle size is highly correlated with the tidal range: (1) The tidal flat range in Jiangsu in summer is large,and the silt content in summer declined. For example, the silt content on November 24, 2021, was significantly higher than that on May 8, 2021, and August 21, 2022. (2) In winter, the tidal range of Jiangsu tidal flat is small, the silt content rebounded, but the reduction in summer was greater than the increase in winter. Overall, the silt content in the study area is declining. However, the sand content displays the opposite pattern. The sand content in the intertidal middle zone and lower zone is low in winter and high in summer.
The particle size of the surface sediment increased slowly year to year, as follows: (1) From 2017 to 2022, the surface mud and silt of the Doulonggang tidal flat were eroded to varying degrees. The loss of silt in the intertidal zone was the most severe, and the distribution range of near-shore silt declined over time. Although the silt content increased in the winters of 2019 and 2021, the silt content decreased considerably overall. (2) Moreover, the sand content in the intertidal zone increased rapidly, and the distribution range expanded. The sediment on the tidal flat surface coarsened over time. The sand content in the study area decreased in winter and increased slowly in other seasons. Overall, the sand content increased each year.
In general, from 2017 to 2022, the sand content of the Jiangsu tidal flat increased, the clay and silt contents decreased, the sediment type gradually changed to sandy silt (sZ), and the sediment particle size gradually coarsened. Tidal flat development and evolution are often very complex. From the perspective of sediment sources, the sediment in the study area comes from the southward transport of waste erosion materials from the Yellow River Delta. The construction of coastal seawalls in Jiangsu may affect the hydrodynamic balance of the original tidal flat, causing reflection interference within the seawall and weakening the energy of tidal flat entering the tidal current. As a result, the sediment transported from the seawall with relatively fine particle size is more likely to be silted in the seawall, while deposition outside the seawall is relatively slow. Therefore, fine sediment particles are gradually lost.
Meanwhile, according to the inversion results, we observed that the sediment particle size is finer in the Spartina zone, while the sediment particle size increases obviously in subtidal zone. This may be because Spartina trap too much sediment, resulting in weakened siltation in other places, making the tidal flat coarser. At the same time, in recent years, the global sea level has risen due to the greenhouse effect, and ocean dynamic conditions have been strengthened, which has intensified the ability of currents to erode sediment (Ji and Jiang, 1994). Therefore, the grain size of tidal flat sediments has coarsened. In addition, the sedimentary environment of tidal flats may change under the influence of human activities (Zhang and Feng, 2011), such as vegetation introduction, reclamation and dike construction (Dethier et al., 2022; Pan et al., 2022), as well as port engineering, which ultimately lead to changes in the tidal flat in Jiangsu.
4 Conclusion
In this study, the Doulonggang tidal flat in Jiangsu Province was selected as the study area, and a remote sensing inversion method for determining tidal flat sediment components was investigated. Based on Sentinel-2 imagery, the distribution of surface sediment components was inversely estimated. The research conclusions are as follows:
1. Considering the complex relationship between the contents of surface sediment components and the remote sensing spectral reflectance for tidal flat areas, the traditional CNN was improved. An inversion model for determining the contents of surface sediment components (sand, silt, and clay) was built, achieving an average R2 of 0.75. Based on measured values, the accuracy of the model prediction results was higher than 80%, indicating that Sentinel-2 remote sensing data can be used for the fine-scale inversion of sediment components.
2. The spatial distribution characteristics of surface sediments such as clay, silt and sand in the Doulonggang tidal flat were described. The surface sediment characteristics varied seasonally from coarse in summer to fine in winter. The phenomenon of the gradual coarsening of the sediment grain size in the Jiangsu tidal flat from 2017 to 2022 was analysed. The interannual variation in surface sediment fluctuated, and the magnitude of variations gradually increased year to year.
3. The error in BP-CNN model-based inversion was mainly due to the limited number of samples and the mismatch between imagery dates and survey data collection dates, thus limiting the model inversion accuracy. It is suggested to further analyse and predict the mechanism of sediment coarsening by applying dynamic numerical simulation technology.
Data availability statement
The original contributions presented in the study are included in the article/Supplementary material. Further inquiries can be directed to the corresponding author.
Author contributions
NZ: Conceptualization, Methodology, Software, Investigation, Visualization, and Writing – Original Draft. HL: Supervision, Writing, Reviewing and Editing, Funding Acquisition. JZ: Supervision, Funding Acquisition. JC: Supervision, Funding Acquisition. HW: Software, Validation. ZG: Supervision, Funding Acquisition. All authors contributed to the article and approved the submitted version.
Funding
This work was supported in part by National Key R&D Program of China under Grant 2022YFC3106204, in part by the China National Funds for Distinguished Young Scientists under Grant 51925905, in part by the National Natural Science Foundation of China under Grant 41976156, in part by the Marine Science and Technology Innovation Project of Jiangsu Province under Grant JSZRHYKJ202214, and in part by the Carbon Peak Carbon Neutral Science and Technology Innovation Projects of Jiangsu Province under Grant BK20220020.
Acknowledgments
The authors would like to thank Xiaowei Yue, Yunhua Shu, and Liu Wei, for their assistance in sample collection and sediment composition experiment. The authors also extremely grateful to Wanpeng Yue, Fuzheng Xia, Xiquan Chen, Fei Zhu,and Tianyu Li, who have kindly provided assistance and companionship in the course of preparing this paper.
Conflict of interest
The authors declare that the research was conducted in the absence of any commercial or financial relationships that could be construed as a potential conflict of interest.
Publisher’s note
All claims expressed in this article are solely those of the authors and do not necessarily represent those of their affiliated organizations, or those of the publisher, the editors and the reviewers. Any product that may be evaluated in this article, or claim that may be made by its manufacturer, is not guaranteed or endorsed by the publisher.
Supplementary material
The Supplementary Material for this article can be found online at: https://www.frontiersin.org/articles/10.3389/fmars.2023.1109146/full#supplementary-material
References
Abbaszadeh M., Mahdavi R., Rezai M. (2019). Assessment of sedimentation process in flood water spreading system using IRS (P5) and supervised classification algorithms (case study: Dahandar plain, minab city, south of iran). remote sens. Appl. Soc Environ. 16, 100269. doi: 10.1016/j.rsase.2019.100269
Adam S., De Backer A., Degraer S., Monbaliu J., Toorman E. A., Vincx M. (2008). Sediment characterization of intertidal mudflats using remote sensing. Proc. Mar. Sci. 9, 109–124. doi: 10.1016/S1568-2692(08)80011-3
Baoguo Y., Ying W., Dakui Z. (1997). THE TIDAL FLAT RESOURCE OF CHINA. J. OF Natural Resour. 12, 307–316. doi: 10.11849/zrzyxb.1997.04.003
Bernardo N., Watanabe F., Rodrigues T., Alcântara E. (2017). Atmospheric correction issues for retrieving total suspended matter concentrations in inland waters using OLI/Landsat-8 image. Adv. Space Res 59, 2335–2348. doi: 10.1016/j.asr.2017.02.017
Buscombe D., Rubin D. M., Lacy J. R., Storlazzi C. D., Hatcher G., Chezar H., et al. (2014). Autonomous bed-sediment imaging-systems for revealing temporal variability of grain size. Limnol. Oceanogr. Methods 12, 390–406. doi: 10.4319/lom.2014.12.390
Cabezas-Rabadán C., Pardo-Pascual J. E., Palomar-Vázquez J. (2021). Characterizing the relationship between the sediment grain size and the shoreline variability defined from sentinel-2 derived shorelines. Remote Sens. 13, 2829. doi: 10.3390/rs13142829
Castillo E., Pereda R., Luis J. M., Medina R., Viguri J. (2011). Sediment grain size estimation using airborne remote sensing, field sampling, and robust statistic. environ. Monit. Assess. 181, 431–444. doi: 10.1007/s10661-010-1839-z
Chen Y., Dong J., Xiao X., Zhang M., Tian B., Zhou Y., et al. (2016). Land claim and loss of tidal flats in the Yangtze estuary. Sci. Rep. 6, 24018. doi: 10.1038/srep24018
Choi T. J., Park J. Y., Choi J. Y. (2016). Partitioning of grain-size component populations in bimodal sediments. J. Coast. Res. 75, 1322–1326. doi: 10.2112/si75-265.1
Dai W., Li H., Gong Z., Zhang C., Zhou Z. (2019). Application of unmanned aerial vehicle technology in geomorphological evolution of tidal flat. Adv. Water Sci. 30, 359–372. doi: 10.14042/j.cnki.32.1309.2019.03.006
Dalrymple R. W., Zaitlin B. A., Boyd R. (1992). Estuarine facies models; conceptual basis and stratigraphic implications. J. Sediment. Res. 62, 1130–1146. doi: 10.1306/D4267A69-2B26-11D7-8648000102C1865D
Dethier E. N., Renshaw C. E., Magilligan F. J. (2022). Rapid changes to global river suspended sediment flux by humans. Science 376, 1447–1452. doi: 10.1126/science.abn7980
Duan Z., Chu S., Cheng L., Ji C., Li M., Shen W. (2022). Satellite-derived bathymetry using landsat-8 and sentinel-2A images: assessment of atmospheric correction algorithms and depth derivation models in shallow waters. Opt. Express 30, 3238–3261. doi: 10.1364/OE.444557
Fairley I., Mendzil A., Togneri M., Reeve D. (2018). The use of unmanned aerial systems to map intertidal sediment. Remote Sens. 10, 1918. doi: 10.3390/rs10121918
Folk R. L., Andrews P. B., Lewis D. W. (1970). Detrital sedimentary rock classification and nomenclature for use in new Zealand. N. Z. J. Geol. Geophys. 13, 937–968. doi: 10.1080/00288306.1970.10418211
Geng X., Shi L., Yang J., Li P., Zhao L., Sun W., et al. (2021). Ship detection and feature visualization analysis based on lightweight CNN in VH and VV polarization images. Remote Sens. 13, 1184. doi: 10.3390/rs13061184
Ghorbanzadeh O., Blaschke T., Gholamnia K., Meena S., Tiede D., Aryal J. (2019). Evaluation of different machine learning methods and deep-learning convolutional neural networks for landslide detection. Remote Sens. 11, 196. doi: 10.3390/rs11020196
Gong Z., Jin C., Zhang C., Zhou Z., Zhang Q., Li H. (2017). Temporal and spatial morphological variations along a cross-shore intertidal profile, jiangsu, China. Cont. Shelf Res. 144, 1–9. doi: 10.1016/j.csr.2017.06.009
Jia J., Wang Y., Gao S., Wang A., Li Z. (2006). Interpreting grain-size trends associated with bedload transport on the intertidal flats at dafeng, central jiangsu coast. Chin. Sci. Bull. 51, 341–351. doi: 10.1007/s11434-006-0341-z
Ji Z., Jiang Z. (1994). Impacts of sea level rise on coastal erosion in the changjiang river delta and north jiangsu coastal plain. Chin. Geogr. Sci. 4, 310–321. doi: 10.1007/BF02664369
Jin D., Lee E., Kwon K., Kim T. (2021). A deep learning model using satellite ocean color and hydrodynamic model to estimate chlorophyll-a concentration. Remote Sens 13, 2003. doi: 10.3390/rs13102003
Jung R., Adolph W., Ehlers M., Farke H. (2015). A multi-sensor approach for detecting the different land covers of tidal flats in the German wadden sea — a case study at norderney. Remote Sens. Environ. 170, 188–202. doi: 10.1016/j.rse.2015.09.018
Kim K. L., Kim B. J., Lee Y. K., Ryu J. H. (2019). Generation of a large-scale surface sediment classification map using unmanned aerial vehicle (UAV) data: a case study at the hwang-do tidal flat, Korea. Remote Sens. 11, 229. doi: 10.3390/rs11030229
Kirwan M. L., Megonigal J. P. (2013). Tidal wetland stability in the face of human impacts and sea-level rise. Nature 504, 53–60. doi: 10.1038/nature12856
Li W., Sun K., Zhang H. (2014). Algorithm for relative radiometric consistency process of remote sensing images based on object-oriented smoothing and contourlet transforms. J. Appl. Remote Sens. 8, 83607. doi: 10.1117/1.Jrs.8.083607
Liu R., Pu L., Zhu M., Huang S., Jiang Y. (2020). Coastal resource-environmental carrying capacity assessment: a comprehensive and trade-off analysis of the case study in jiangsu coastal zone, eastern China. Ocean Coast. Manage. 186, 105092. doi: 10.1016/j.ocecoaman.2020.105092
Li T., Zhang G., Wang S., Mao C., Tang Z., Rao W. (2022). The isotopic composition of organic carbon, nitrogen and provenance of organic matter in surface sediment from the jiangsu tidal flat, southwestern yellow sea. Mar. pollut. Bull. 182, 114010. doi: 10.1016/j.marpolbul.2022.114010
Mahdianpari M., Salehi B., Rezaee M., Mohammadimanesh F., Zhang Y. (2018). Very deep convolutional neural networks for complex land cover mapping using multispectral remote sensing imagery. Remote Sens. 10, 1119. doi: 10.3390/rs10071119
Murray N. J., Clemens R. S., Phinn S. R., Possingham H. P., Fuller R. A. (2014). Tracking the rapid loss of tidal wetlands in the yellow sea. Front. Ecol. Environ. 12, 267–272. doi: 10.1890/130260
Murray N. J., Phinn S. R., DeWitt M., Ferrari R., Johnston R., Lyons M. B., et al. (2019). The global distribution and trajectory of tidal flats. Nature 565, 222–225. doi: 10.1038/s41586-018-0805-8
Nasiha H. J., Shanmugam P., Sundaravadivelu R. (2019). Estimation of sediment settling velocity in estuarine and coastal waters using optical remote sensing data. Adv. Space Res. 63, 3473–3488. doi: 10.1016/j.asr.2019.02.023
Pancorbo J. L., Lamb B. T., Quemada M., Hively W. D., Gonzalez-Fernandez I., Molina I. (2021). Sentinel-2 and WorldView-3 atmospheric correction and signal normalization based on ground-truth spectroradiometric measurements. ISPRS J. Photogramm. Remote Sens. 173, 166–180. doi: 10.1016/j.isprsjprs.2021.01.009
Pan Y., Yin S., Chen Y. P., Yang Y. B., Xu C. Y., Xu Z. S. (2022). An experimental study on the evolution of a submerged berm under the effects of regular waves in low-energy conditions. Coast. Eng. 176, 104169. doi: 10.1016/j.coastaleng.2022.104169
Paolini L., Grings F., Sobrino J. A., Muñoz J. C. J., Karszenbaum H. (2007). Radiometric correction effects in landsat multi-date/multi-sensor change detection studies. Int. J. Remote Sens. 27, 685–704. doi: 10.1080/01431160500183057
Park N. W. (2019). Geostatistical integration of field measurements and multi-sensor remote sensing images for spatial prediction of grain size of intertidal surface sediments. J. Coast. Res. 90, 190. doi: 10.2112/si90-023.1
Pitarch J., Falcini F., Nardin W., Brando V. E., Di Cicco A., Marullo S. (2019). Linking flow-stream variability to grain size distribution of suspended sediment from a satellite-based analysis of the Tiber river plume (Tyrrhenian sea). Sci. Rep. 9, 19729. doi: 10.1038/s41598-019-56409-8
Rainey M. P., Tyler A. N., Gilvear D. J., Bryant R. G., McDonald P. (2003). Mapping intertidal estuarine sediment grain size distributions through airborne remote sensing. Remote Sens. Environ. 86, 480–490. doi: 10.1016/s0034-4257(03)00126-3
Schuerch M., Spencer T., Temmerman S., Kirwan M. L., Wolff C., Lincke D., et al. (2019). Author correction: Future response of global coastal wetlands to sea-level rise. Nature 569, E8. doi: 10.1038/s41586-019-1205-4
Smirnov E. A., Timoshenko D. M., Andrianov S. N. (2014). Comparison of regularization methods for ImageNet classification with deep convolutional neural networks. AASRI Proc. 6, 89–94. doi: 10.1016/j.aasri.2014.05.013
Soloy A., Turki I., Fournier M., Costa S., Peuziat B., Lecoq N. (2020). A deep learning-based method for quantifying and mapping the grain size on pebble beaches. Remote Sens. 12, 3659. doi: 10.3390/rs12213659
Temmerman S., Kirwan M. L. (2015). Building land with a rising sea. Science 349, 588–589. doi: 10.1126/science.aac8312
Wang X., Ke X. (1997). Grain-size characteristics of the extant tidal flat sediments along the jiangsu coast, China. Sediment. Geol. 112, 105–122. doi: 10.1016/S0037-0738(97)00026-2
Yates M. G., Jones A. R., McGrorty S., Goss-Custard J. D. (1993). The use of satellite imagery to determine the distribution of intertidal surface sediments of the wash, England. Estuar. Coast. Shelf Sci. 36, 333–344. doi: 10.1006/ecss.1993.1020
Yu W. J., Zou X. Q. (2013). The research on the farmer households’ economic behavior and sustainable utilization issues in tidal flat of jiangsu province. Adv. Sci. Lett. 19, 1819–1822. doi: 10.1166/asl.2013.4573
Zhang C., Feng X. (2011). Natural and human-induced effects on grain size of surface sediments along the lianyungang muddy coast, China. Chin. J. Oceanol. Limnol. 29, 387–397. doi: 10.1007/s00343-011-0007-9
Zhang Y., Huang Z., Chen C., He Y., Jiang T. (2015). Particle size distribution of river-suspended sediments determined by in situ measured remote-sensing reflectance. Appl. Opt. 54, 6367–6376. doi: 10.1364/AO.54.006367
Keywords: Jiangsu tidal flat, sediment component content, satellite remote sensing, multitemporal, convolutional neutral network
Citation: Zhang N, Li H, Zhang J, Chen J, Wu H and Gong Z (2023) Study of the spatial and temporal distributions of tidal flat surface sediment based on multitemporal remote sensing. Front. Mar. Sci. 10:1109146. doi: 10.3389/fmars.2023.1109146
Received: 27 November 2022; Accepted: 04 January 2023;
Published: 20 January 2023.
Edited by:
Sha Lou, Tongji University, ChinaReviewed by:
Aijun Wang, Ministry of Natural Resources, ChinaQing Xu, Ocean University of China, China
Copyright © 2023 Zhang, Li, Zhang, Chen, Wu and Gong. This is an open-access article distributed under the terms of the Creative Commons Attribution License (CC BY). The use, distribution or reproduction in other forums is permitted, provided the original author(s) and the copyright owner(s) are credited and that the original publication in this journal is cited, in accordance with accepted academic practice. No use, distribution or reproduction is permitted which does not comply with these terms.
*Correspondence: Huan Li, YW51b2xpaHVhbkAxNjMuY29t