Abstract
The Indian Ocean Dipole (IOD) is one of the dominant interannual variabilities in the Indian Ocean (IO), and an extreme IOD, in particular, has dramatic effects on the weather, agriculture, and ecosystem around it. Therefore, the formation of an extreme IOD has been a worldwide research focus. Among 13 positive IOD (PIOD) events, two type-east and two type-comparable PIODs developed into extreme events during the 1960–2020 period. This investigation focuses on the cause of the formation of the type-east extreme PIOD, as previous studies have discussed the origin of the type-comparable extreme PIOD. Composite analysis showed that, as an entity, the strong East Asian and Australian monsoon (EAAM) may result in an evident easterly wind anomaly around the Indonesian region of the Marine Continent during May to August of the years when type-east PIODs occurred. The easterly wind anomaly associated with the EAAM was stronger in the extreme IOD group, whereas it was relatively weak in the regular group. The difference in the easterly wind anomaly between the extreme and regular groups could result in a vertical motion anomaly by enhancing the anomalous westward current. The stronger vertical motion created an upwelling in the deep-layer cold water, resulting in a more distinct difference in the vertical temperature gradient. All these conditions promoted the transformation of the type-east PIODs that occurred in 1961 and 1994 into extreme events and are indicative of the importance of vertical advection terms in the formation of type-east extreme PIODs. This study reveals the cause of the formation of type-east extreme PIODs, which will be helpful in understanding IOD diversity.
1 Introduction
The tropical Indian Ocean (TIO) has its own unique climate system because the equatorial Indian Ocean (IO) lacks a stable easterly wind and the thermocline is relatively flat along the equator (Schott et al., 2009; Cai et al., 2013). Therein, a remarkable sea surface temperature (SST) dipole mode, known as the Indian Ocean Dipole (IOD), occurs interannually in the TIO and has attracted much attention due to its prominent climate impacts along the TIO rim and on other remote regions (Saji et al., 1999; Webster et al., 1999; Ashok et al., 2003; Saji and Yamagata, 2003; Qiu et al., 2014; Li et al., 2016).
The IOD has positive and negative phases. Positive IOD (PIOD) events are defined as above-normal SST anomalies (SSTAs) in the western TIO and below-normal SSTAs in the eastern TIO. Negative IOD (NIOD) events are the opposite of PIOD events (Saji et al., 1999). Moreover, the amplitude of the PIOD is generally larger than that of the NIOD (Hong et al., 2008a; Hong et al., 2008b), which might be the reason for the PIOD having led to more serious disasters.
IOD events can be classified into many types according to their triggering mechanism, evolution, or SSTA pattern. For example, the classification of IODs either coincides with or is independent of the El Niño–Southern oscillation (ENSO) (Allan et al., 2001; Ashok et al., 2003; Fischer et al., 2005; Drbohlav et al., 2007; Hong et al., 2008b; Guo et al., 2015; Yang et al., 2015), but IODs could also be classified into spring- and autumn-type events based on their mature phase (Sun et al., 2014). In all classification criteria, the classification of IOD according to the SSTA pattern is of particular interest because an IOD with a different SSTA pattern has different effects on the climate over the IO and surrounding countries and even on remote regions (Birkett et al., 1999; Latif et al., 1999; Webster et al., 1999; Saji and Yamagata, 2003; Han et al., 2006; Cai et al., 2013; Nur’utami and Hidayat, 2016; Lestari et al., 2018).
Previous studies have defined type-west IODs as those in which the SSTA amplitude in the western TIO exceeds twice that in the southeastern TIO, type-east IODs are those in which the SSTA amplitude in the southeastern TIO exceeds twice that in the western TIO, and type-comparable IODs have comparable SSTA amplitudes at both poles (Sun et al., 2014; Cai et al., 2020; Jiang et al., 2022). Following the definition of the IOD and the classification criteria, we identified 13 PIOD and nine NIOD events during the past ~61 years from 1960 to 2020. Of the 13 PIODs, those in 1972, 1987, 2012, and 2015 were classified as type-west PIODs; the events in 1961,1967, 1994, and 2006 were classified as type-east PIODs; and those in 1963, 1982, 1997, 2002, and 2019 were classified as type-comparable PIODs.
Compared with regular IOD events, extreme IOD events have always led to much more severe natural disasters (Xiao et al., 2020), such as floods, droughts, and wildfires, over the IO and its surrounding regions. For example, in 2019, an extreme PIOD caused a catastrophic drought in northern Australia. Such climatic conditions tend to trigger forest fires and are also unfavorable for the development of rain, which helps control fires. The Australian forest fires lasted from September to December and resulted in the severe loss of wildlife resources.
During the past 61 years, from 1960 to 2020, four extreme PIOD events occurred in 1961, 1994, 1997, and 2019. Of these, the events in 1961 and 1994 were classified as type-east PIODs, while those in 1997 and 2019 were considered to be type-comparable PIODs. In comparison to that of regular type-comparable PIODs, the formation of extreme type-comparable PIODs is attributed to stronger Bjerknes feedback and/or wind–evaporation–SST (WES) feedback, which are positive feedbacks that promote the development of PIODs. There are still marginal differences in the development process of the extreme type-comparable PIODs between 1997 and 2019, although the type-comparable PIODs showed similar formation mechanisms.
The formation of the extreme PIOD in 1997 was mainly attributed to a very powerful Bjerknes feedback, which was thought to be associated with the super El Niño that occurred in the same year (Saji et al., 1999; Webster et al., 1999). The other extreme PIOD with type-comparable characteristics occurred in 2019, mainly due to two positive feedback processes: one was the Bjerknes feedback, which was caused by the residual consequence of the weak 2018 Pacific warm conditions (Du et al., 2020), and the other process was a WES feedback, which was triggered by the strengthening Australian high and the weakening sea level pressure over the South China Sea/Philippine Sea (Lu and Ren, 2020).
Although previous studies have investigated the formation mechanism of extreme PIODs with type-comparable characteristics, the mechanism of extreme PIODs with type-east characteristics remains poorly understood. Research on this issue will enhance our understanding of the formation of extreme IODs and will help improve forecasts of possible disastrous events associated with the IOD. Therefore, the present study aimed to investigate the causes and conditions of the formation of type-east extreme PIODs. In Section 2, the data and method used in this study are described. Section 3 presents the analysis and results. Finally, the summary and discussion are given in Section 4.
2 Data and methods
For this study, we used the following data: 1) monthly SST data from the Extended Reconstructed SST product of the National Oceanic and Atmospheric Administration (NOAA), which has a 2° × 2° horizontal resolution; 2) monthly wind field data with 2.5° × 2.5° horizontal resolution, which were obtained from the National Centers for Environmental Prediction (NCEP) and the National Center for Atmospheric Research (NCAR) reanalysis dataset (Kalnay, 1996) ; 3) multilevel oceanic 3D temperature and velocity data from the Simple Ocean Data Assimilation (SODA version 2.2.4) reanalysis dataset; and 4) surface heat flux data (Kumar and Hu, 2012) from the ensemble mean of the NCEP–NCAR reanalysis data.
The dipole mode index (DMI), which measures the strength of the IOD, was defined as the difference between the area-averaged SSTAs at the west pole (10° S–10° N, 50°–70° E) and the east pole (10° S–0°, 90°–110° E) (Saji et al., 1999). A DMI value exceeding one standard deviation above normal during the September to November period was regarded as a classic IOD event. As shown in the time series of the DMI (Figure 1), there were 13 PIOD events, with four type-east PIOD events (1961, 1967, 1994, and 2006), five type-comparable PIOD events (1963, 1982, 1997, 2002, and 2019), and four type-west PIOD events (1972, 1987, 2012, and 2015). Notably, four PIOD events (i.e., 1961, 1994, 1997, and 2019) whose amplitudes exceeded twice the standard deviation of the DMI were classified into the extreme PIOD group. The PIODs in 1961 and 1994 showed type-east features, such as the dipole pattern being mainly due to the SSTA at the east pole.
Figure 1

Time series of the normalized dipole mode index (DMI) derived from the National Oceanic and Atmospheric Administration (NOAA) Extended Reconstructed SST V5 for the 1960–2020 period. The black and dotted lines indicate one and two times the standard deviation, respectively.
To investigate the specific dynamic and thermodynamic air–sea processes causing the difference between the extreme and regular groups of type-east PIODs, a mixed-layer budget was used to analyze the temperature tendency. The mixed-layer temperature tendency equation (Li et al., 2002; Wang et al., 2012) is given below:
where u, v, and ω represent the three dimensions of the oceanic current; T is the mixed-layer temperature; ( )' denotes the anomaly of variables; represents the climatological mean variables; Qnet is the summation of the downward shortwave radiation absorbed in the mixed layer (Qsw), net downward surface longwave radiation, and surface latent and sensible heat fluxes; R is the residual term; ρ is the seawater density; cp is the specific heat of seawater; and H is the mixed-layer depth. Here, H was defined as the depth at which the ocean temperature was 0.8°C lower than the surface temperature (Wang et al., 2012; Chen et al., 2016). All the budget terms in Eq. 1 were integrated from the surface to the mixed-layer depth. Considering the shortwave penetration below the mixed layer, the Qsw absorbed in the mixed layer is given as follows (Wang 2012):
where Qsurf is the net downward surface shortwave radiation.
3 Results
To investigate the cause of the type-east extreme PIOD formation, we first identified the extreme and regular PIOD events by analyzing the DMI. The normalized DMI results showed 13 classic PIOD events that occurred in 1961, 1963, 1967, 1972, 1982, 1987, 1994, 1997, 2002, 2006, 2012, 2015, and 2019 (Figure 1). Of these 13 PIODs, four events that occurred in 1961, 1994, 1997, and 2019 were apparently stronger than the remaining events and were classified as the extreme group. The DMI, which was determined using the SSTAs at the west and east poles, was the main judgment basis for the IOD. According to the dominance of the SSTAs at the different poles of the IOD, the PIOD could be classified into three types: type-east, type-comparable, and type-west. For this reason, there were some differences in the formation mechanism of the different types of PIODs.
Of the four extreme PIODs, the extreme events in 1961 and 1994 were type-east PIODs, while the remaining extreme events in 1997 and 2019 were classified as type-comparable PIODs. In addition, it appeared that no type-west PIOD cases developed into extreme events during the past 60 years. Previous studies have discussed the reasons for the 1997 and 2019 type-comparable PIODs having been able to develop into extreme events. Considering the lack of understanding on the causes of the formation of extreme events in type-east PIODs, we conducted the following detailed research.
The composite analysis showed the evolutions of the SSTAs for the extreme and regular groups at the east and west poles (Figure 2). The SSTA at the east pole was lower in the extreme group than that in the regular group from May to September (Figure 2A), and the difference was above the 90% significance level; however, the composites of the west pole SSTAs showed little difference between the extreme and regular groups (Figure 2B). In addition, the SSTAs were not obviously different between the extreme and regular groups in the years (−) and (+) because the significance level was less than 90% (Figure 2). These results illustrate that the SSTA at the east pole primarily determined whether or not the type-east PIOD could develop into extreme or regular events. Furthermore, the type-east PIOD generally occurred in the summer, matured in the autumn, and ended in the winter. Its lifetime was concentrated within 1 year, and the SSTA signal associated with the IOD appeared to have little continuity in the year just before and the year right after the PIOD event in the IO (Figure 2).
Figure 2
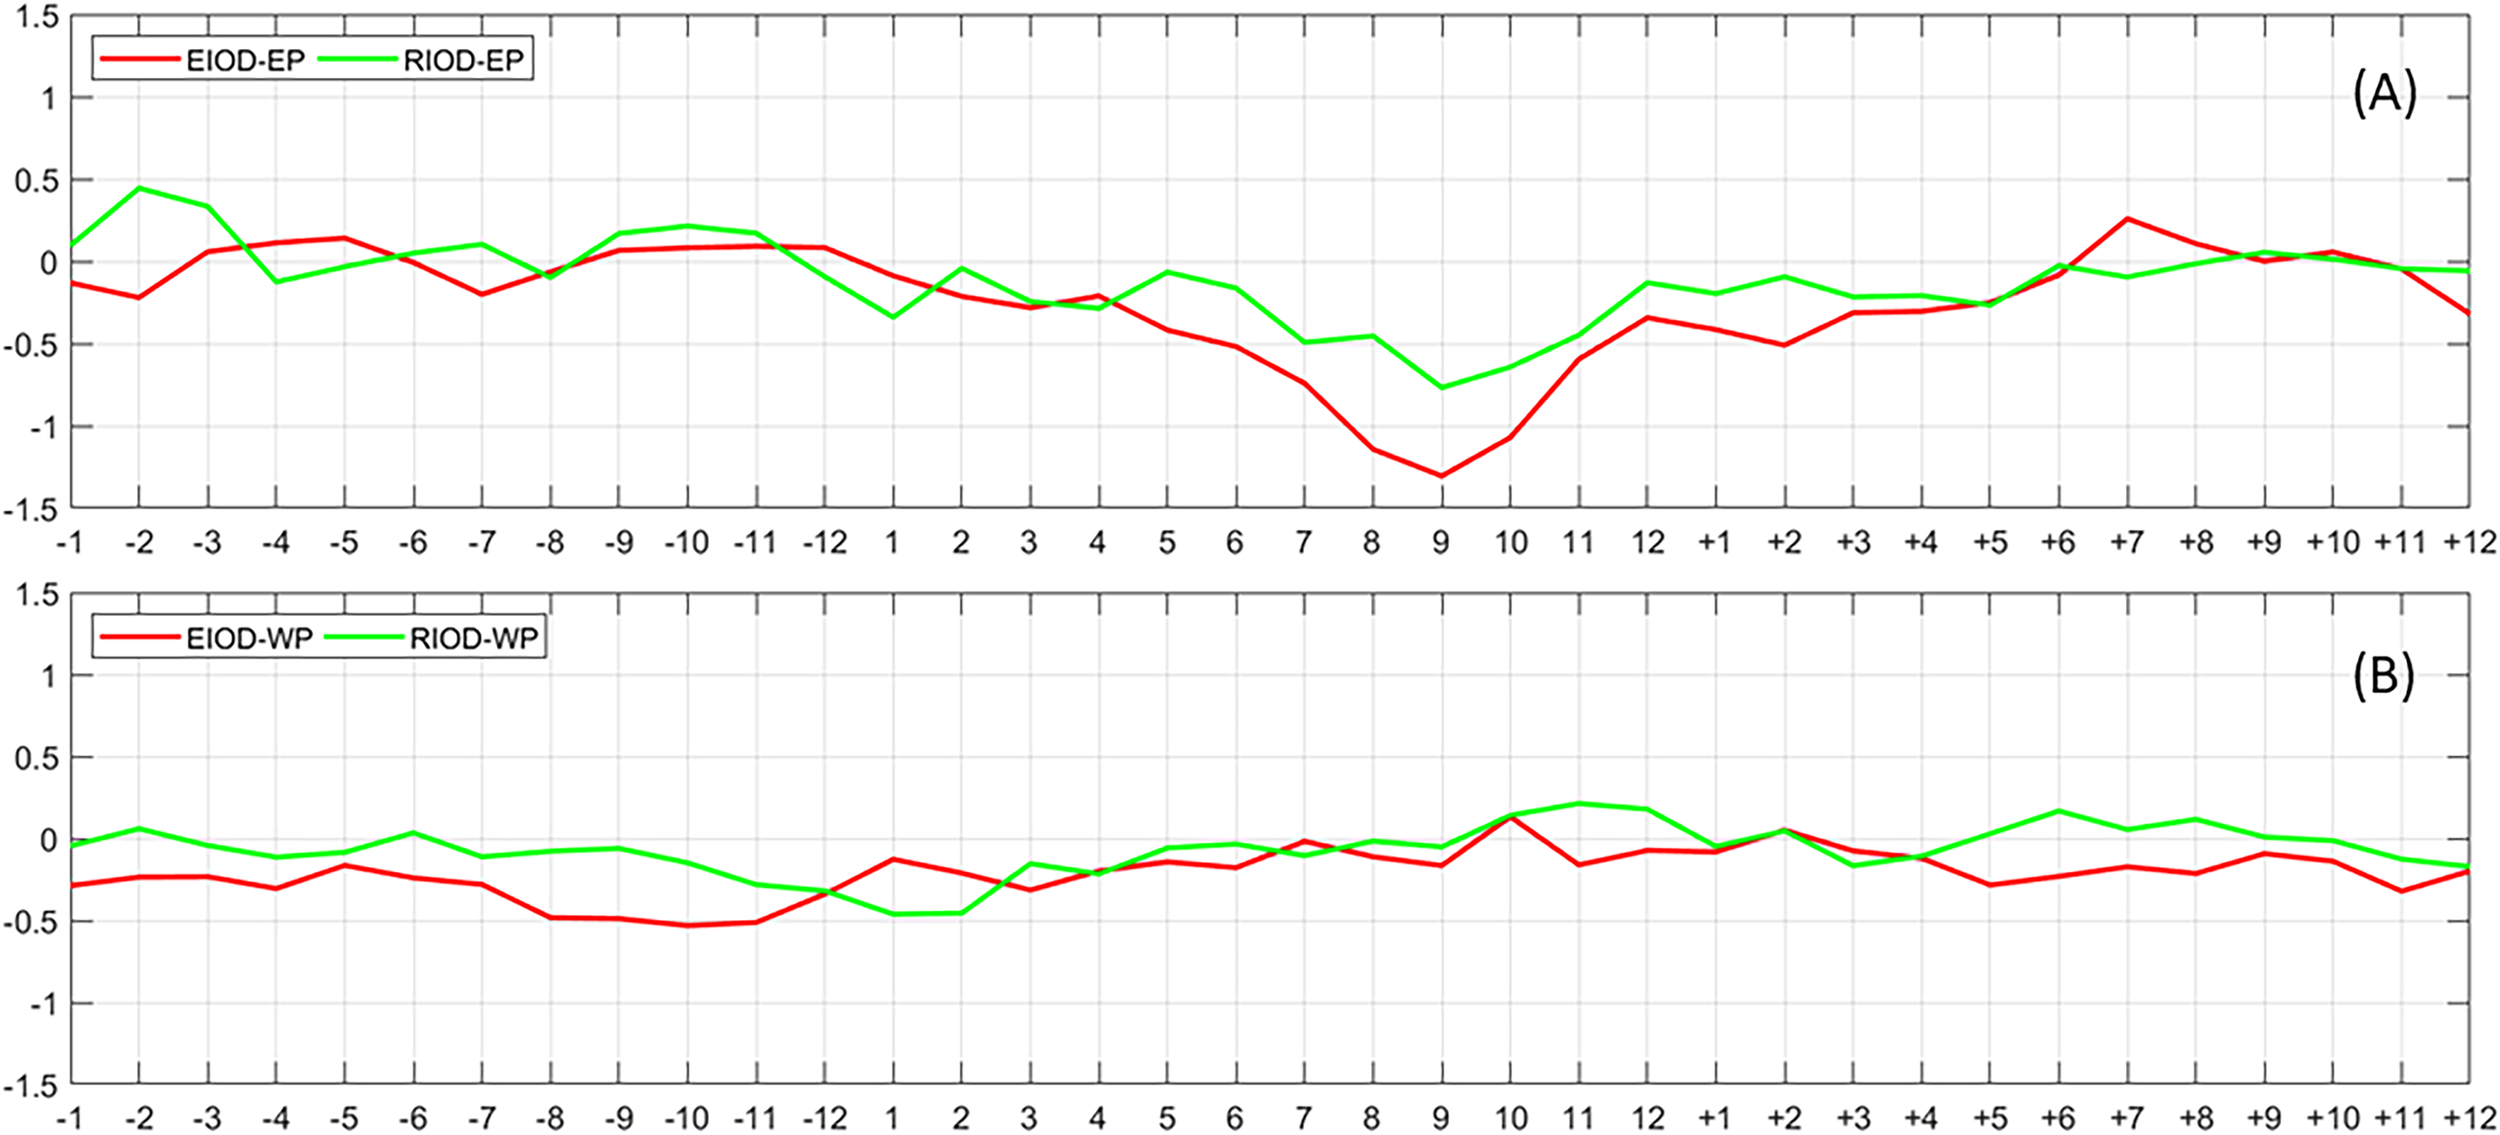
Temporal evolution of the composite sea surface temperature anomalies (SSTAs; in degree Celsius) at the east pole (A) and west pole (B). The red and green lines indicate the results derived from the extreme and regular Indian Ocean Dipole (IOD) groups, respectively. Here, minus and plus signs denote 1 year before and 1 year after the positive IOD (PIOD) year, respectively.
The composites of the east pole SSTAs in the extreme and regular groups were very similar in April of the type-east PIOD year; subsequently, the SSTA in the extreme group deceased at a faster rate than that in the regular group, and the SSTA difference between the two groups reached its peak in September (Figure 2). Therefore, we regarded the May to August period as the tendency analysis key period, as the obvious SSTA difference between the extreme and regular groups occurred from April to May and the amplitude of the difference reached its maximum in September, which also indicated that the tendency is around zero at this time. The evolutions of the SSTA tendency in the two groups showed that the gradually enlarging SSTA difference could be attributed to the cumulative effect of the SSTA tendency during the May to August period (Figure 3). Thus, a key issue that should be addressed is the cause of the SSTA tendency difference during this period.
Figure 3
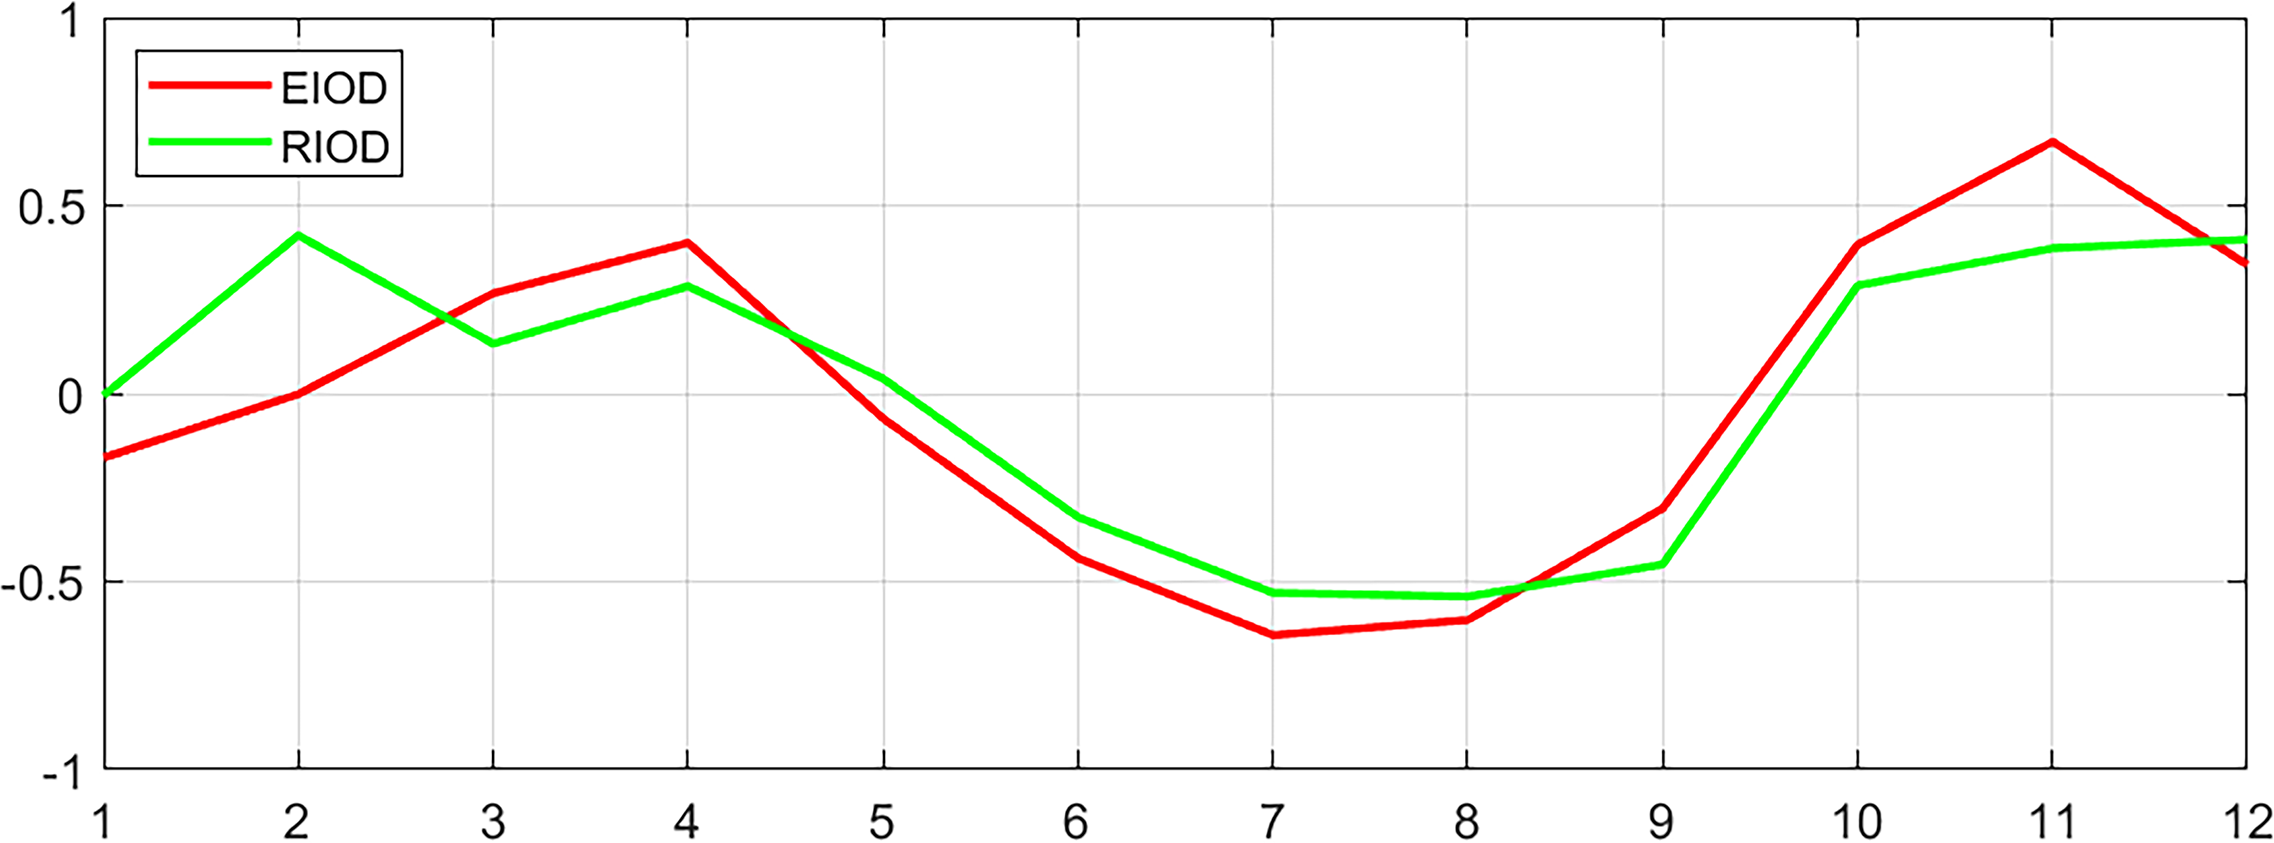
Temporal evolution of the composite east-pole sea surface temperature anomaly (SSTA) tendency (in degree Celsius per month) for the extreme Indian Ocean Dipole (IOD) group (red) and the regular IOD group (green).
Here, Eq. 1 was utilized to evaluate the difference in the tendency of the mixed-layer temperature anomaly (MLTA) between the extreme and regular groups during the May to August period. Figure 4 shows the implementation of the heat budget on the differences in the MLTAs between the two groups. Among the diagnostic terms, the estimated MLTA difference tendency (term 11), which is the sum of the components of the tendency equation (terms 1–10), approximated the actual MLTA difference tendency (term 12). This finding implies that the mixed-layer heat budget was approximately balanced. Note that the most important component that mainly contributed to the tendency of MLTA difference between the two groups was vertical advection (Figure 4), denoting the well-known thermocline feedback.
Figure 4
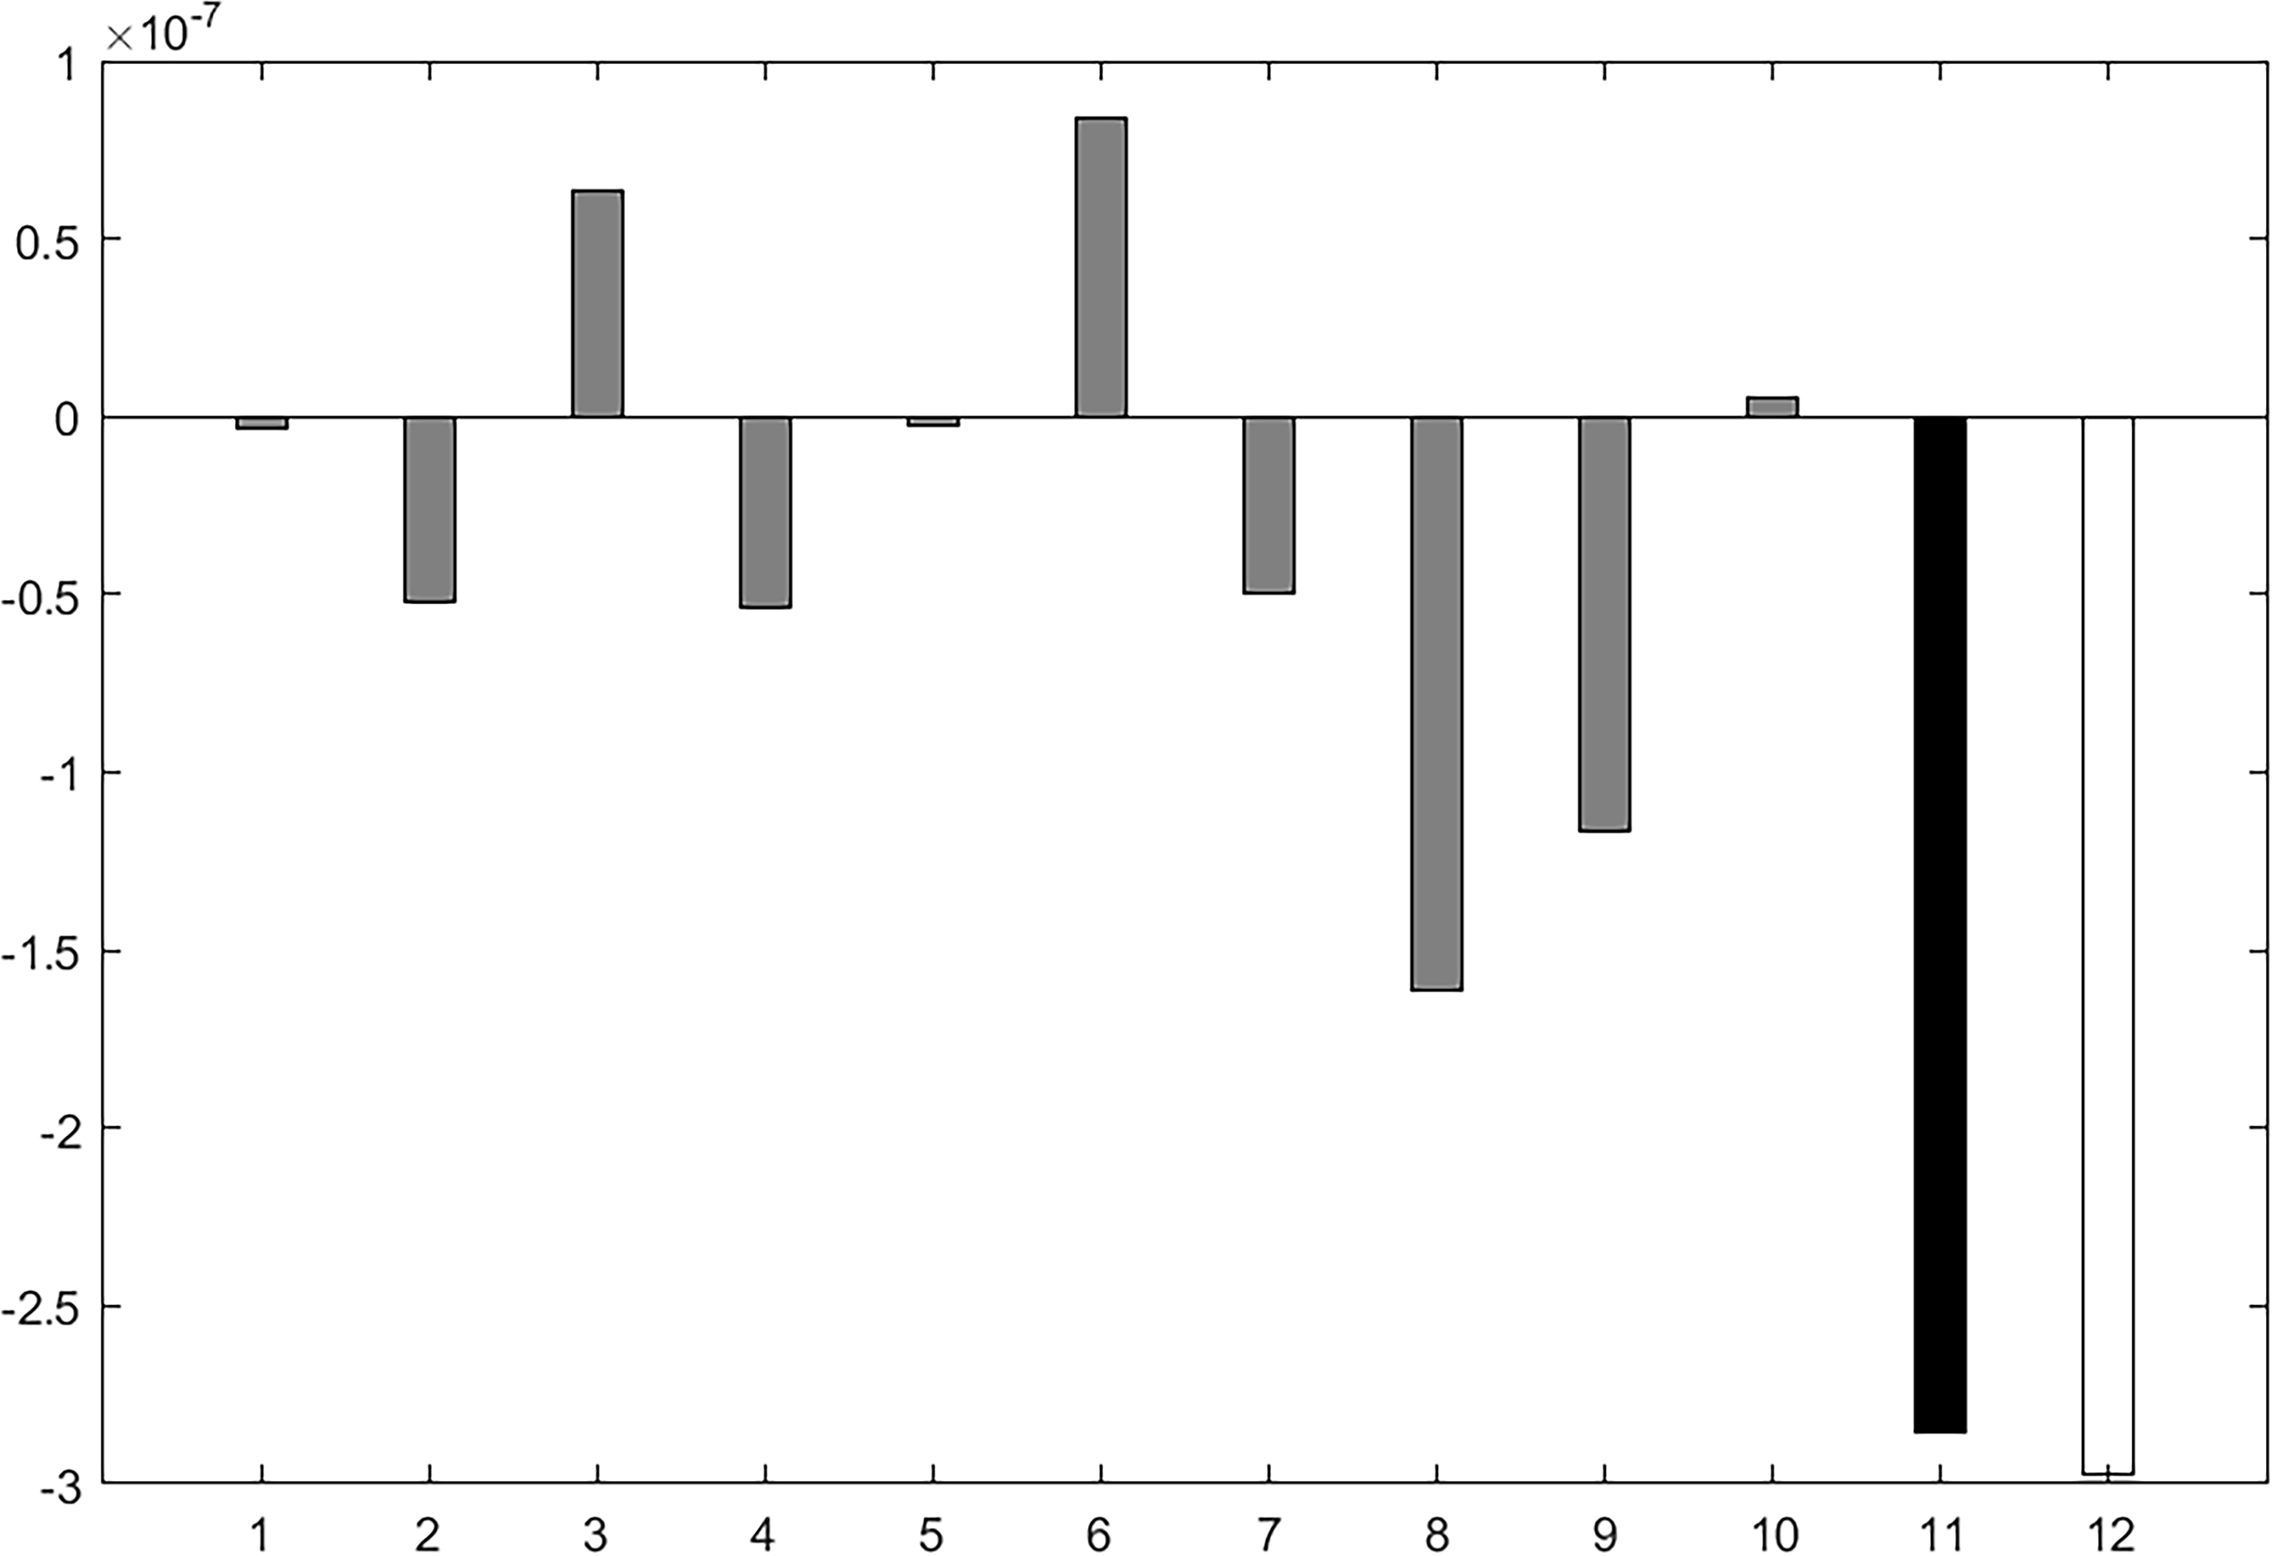
Composite mixed-layer heat budget terms (in degree Celsius per second) for the difference between the extreme and regular groups during the May to August period in the positive Indian Ocean Dipole (PIOD) year. Terms 1–10 denote , , −u'∂T′/∂x , , , −v'∂T′/∂y , , , −ω'∂T′/∂z , and , respectively. Term 11 is the sum of the first 10 terms, while term 12 is the mixed-layer temperature tendency, ∂T'/∂t .
Vertical advection includes the vertical gradient of the mean temperature by the upwelling difference (extreme group minus regular group) (term 7), the mean upwelling by the vertical gradient of the temperature difference (term 8), and the upwelling difference by the vertical gradient of the temperature difference (term 9). During the onset phase (May to June), the heat budget results showed that terms 7, 8, and 9 all promoted the MLTA difference between the two groups. Therein, terms 7 and 8 were approximately −6.26 × 10⁻⁸°C s−1 and −3.01 × 10⁻¹¹°C s−1, respectively. The absolute value of term 7 was much greater than that of term 8, making the largest contribution to the tendency. The vertical motion difference played the most important role in causing the mixed-layer temperature difference between the two groups in this period.
However, term 1 () provided the largest positive contribution (−1.22 × 10⁻⁸°C s−1) to the SSTA tendency (−3.85 × 10⁻⁸°C s−1) between the two groups in May. Therefore, the differences in the vertical motion and vertical temperature gradient could be attributed to the anomalous westward current between the two groups (Figures 5A, B). The westward current difference occurred in May and gradually strengthened the vertical motion in the following months, which could more efficiently carry the deep-layer cold water to the upper layer, which then led to a colder MLTA in the east pole of the IOD (Figure 5B). Subsequently, the westward current difference could have been maintained by the east–west SST difference, and it continued to strengthen the vertical motion upwelling the deep-layer cold water. With the accumulation effect from the upwelling associated with the vertical motion difference, the vertical gradient of the sea temperature difference gradually became more crucial to the difference in the MLTA. Eventually, the difference in the vertical temperature gradient made the largest contribution on the SSTA tendency difference between the two groups (Figure 5C). The vertical advection provided the most important contribution to the tendency difference between extreme and regular groups during the whole development phase of the IOD (from May to August). Moreover, the contributions of terms 8, 9 and 7 of the vertical advection are large, media and small in order (Figure 4). Thus, the westward current difference between the two groups played a key role in the entire development phase.
Figure 5
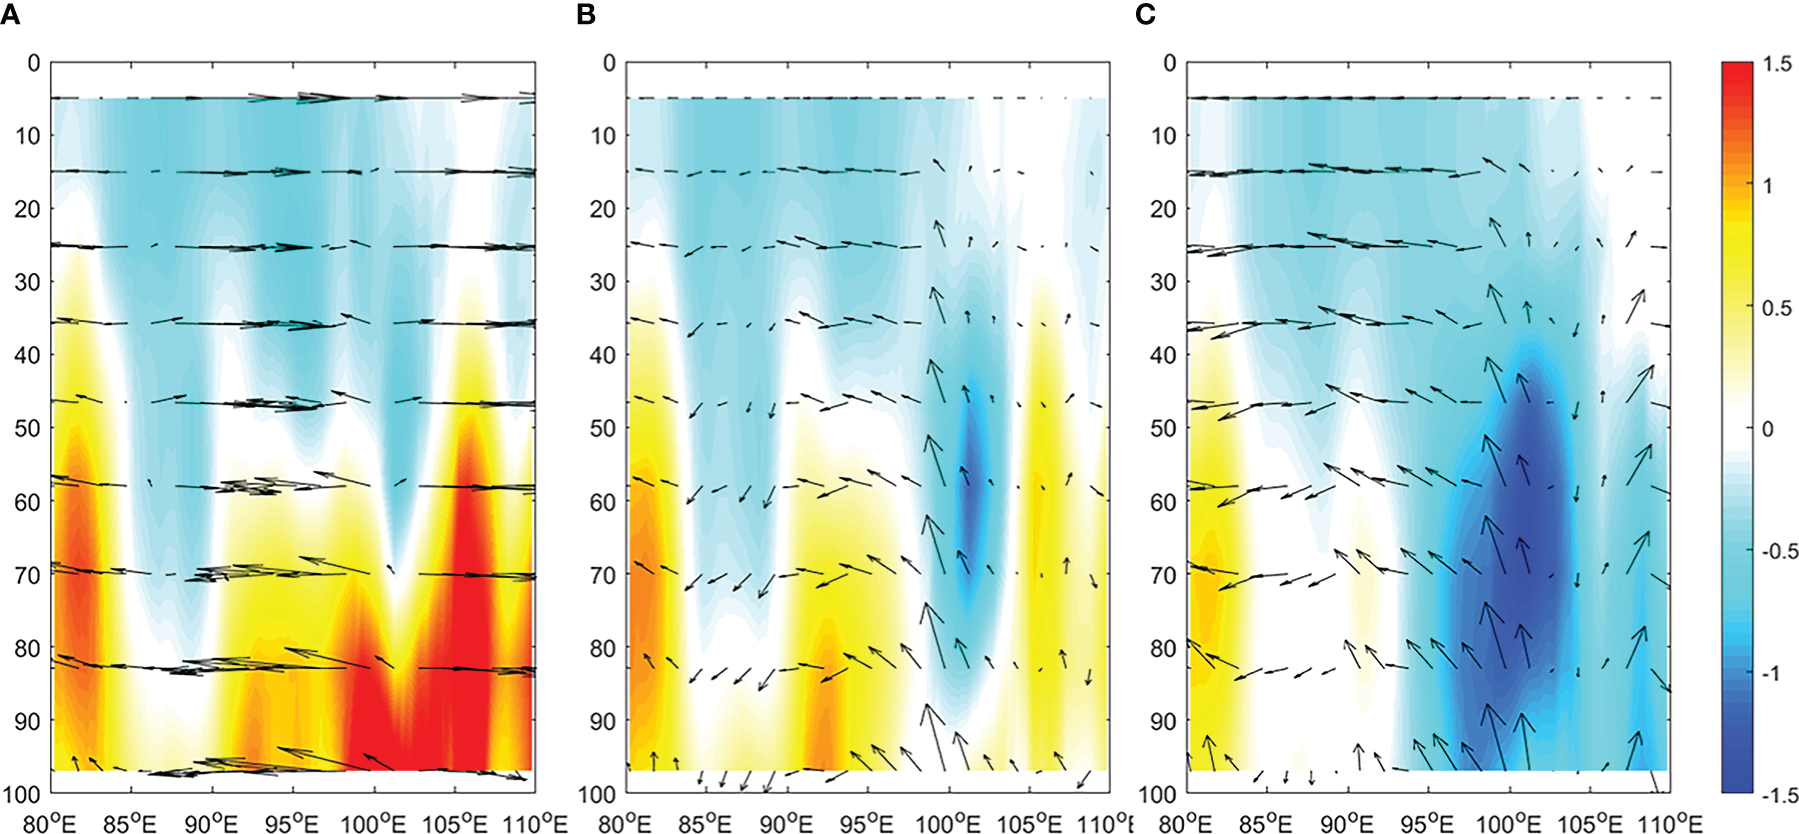
Composite longitudinal depth section of the oceanic temperature (shading; in degree Celsius) and current (vector; zonal velocity in meters per second and vertical velocity in millimeters per second) difference between the extreme and regular positive Indian Ocean Dipole (PIOD) groups averaged over 10° S–0° in May (A) and the periods from May to June (B) and May to August (C).
To understand the cause of the westward current difference between the extreme and regular groups, we investigated the differences between the atmospheric circulation and mixed-layer current. The westward current difference at the east pole appeared to be attributed to the easterly wind difference based on an analysis of the differences among the atmospheric circulation, upper oceanic current, and the MLTAs between the extreme and regular groups during the May to August period (Figure 6). The next question to be discussed is what caused the easterly wind difference.
Figure 6
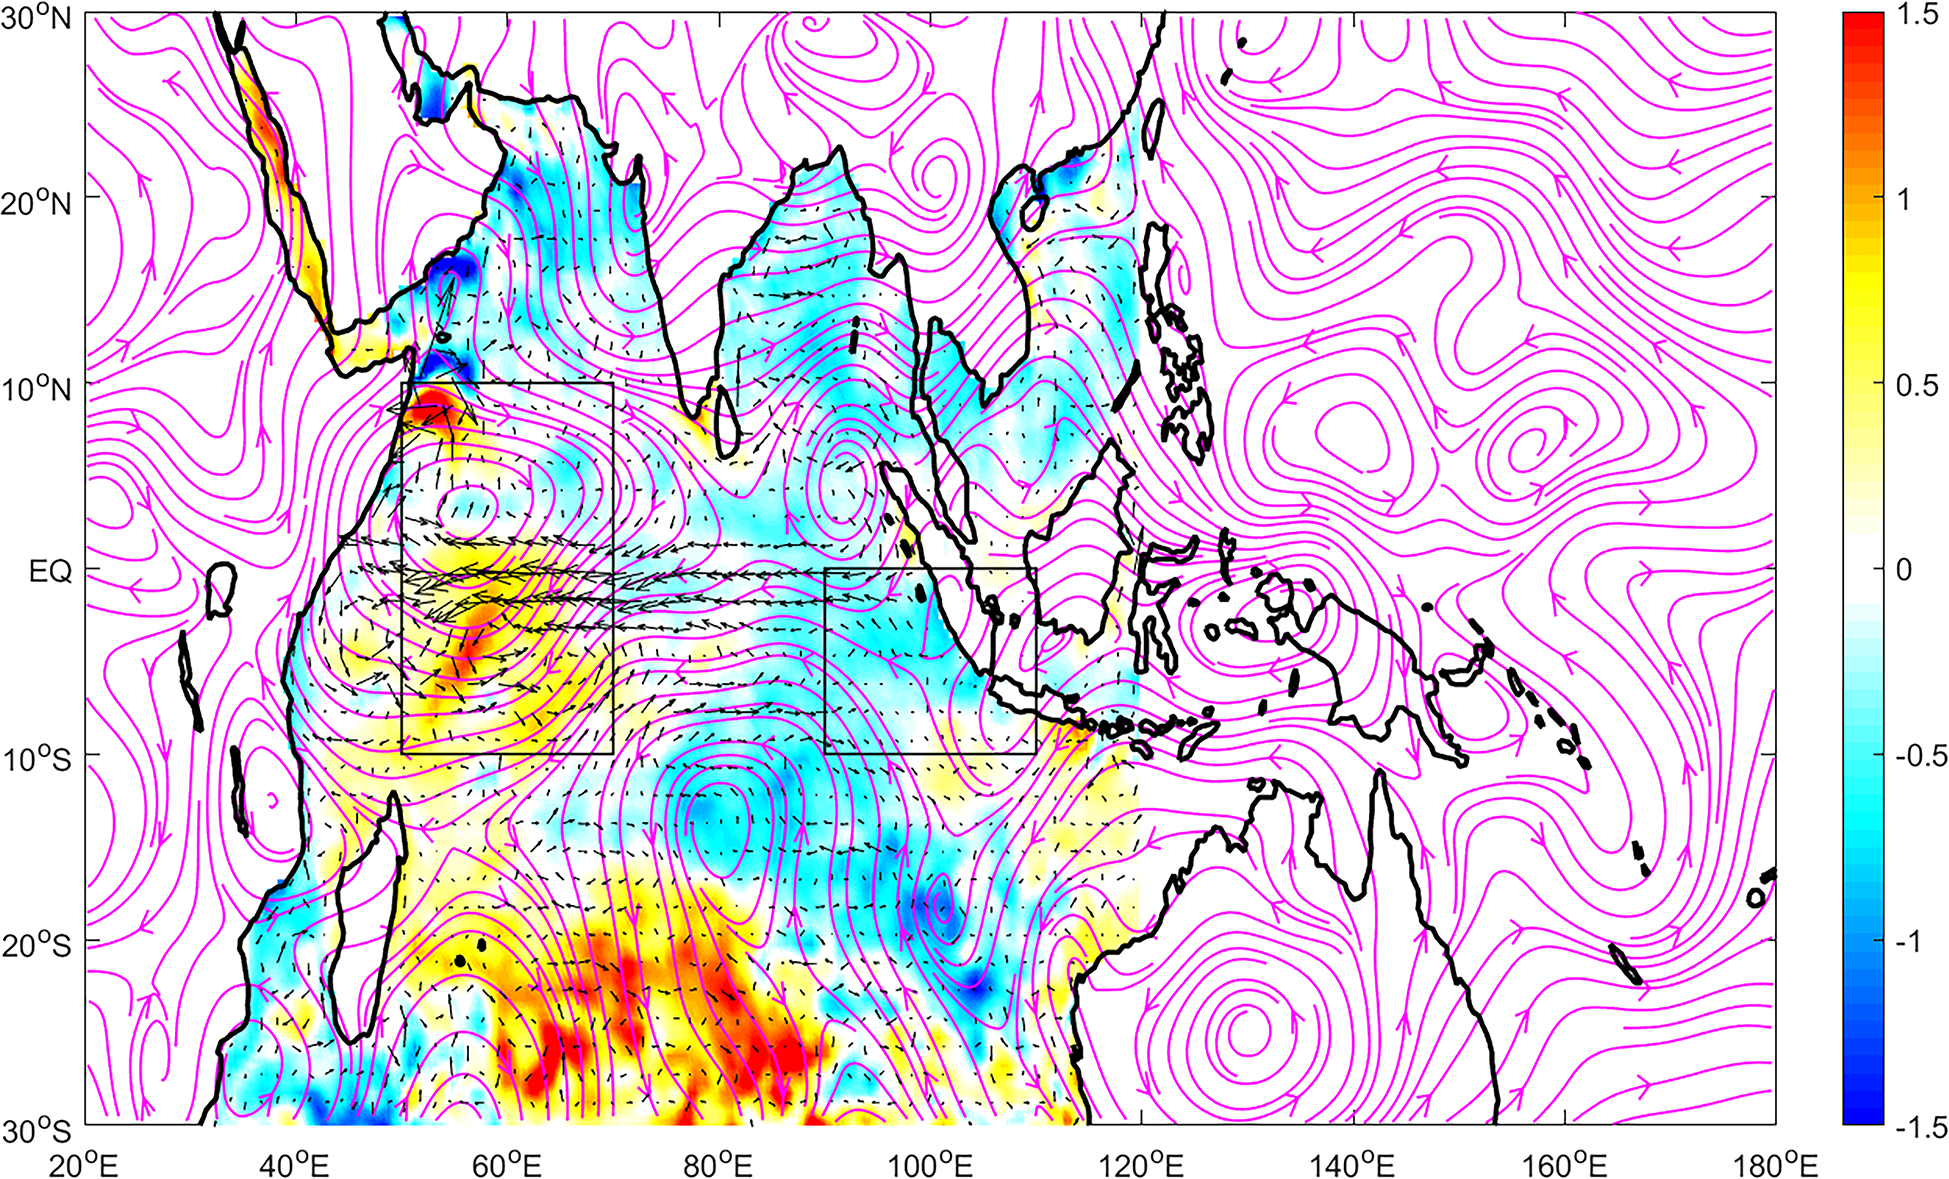
Composite of the difference in the mixed-layer temperature (shading; in degree Celsius), current (vector; in meters per second), and the 850-hPa wind (streamline) between the extreme and regular groups during the development phase (from May to August) of the Indian Ocean Dipole (IOD).
We analyzed the differences in the SST, atmospheric circulation, and oceanic mixed-layer current between the extreme and regular groups during the onset phase, which probably gave rise to the differences in the subsequent evolution, in order to determine the reasons for the PIOD intensity difference between the two groups. There was a negative SSTA at the east pole, and the SSTA at the east pole was colder in the extreme group than in the regular group (Figure 7). Moreover, the anomalous mixed-layer currents were located westward at the east pole in the two groups and were consistent with the easterly wind anomaly in the region (Figure 7). This finding further indicates that the easterly wind anomaly played an important role in the formation of the type-east PIOD, and it confirmed that the difference in the wind anomalies between the two groups was the dominant reason for the different IOD intensities.
Figure 7

Composite of the anomalies of the sea surface temperature (SST) (shading, in degree Celsius), current (vector, in meters per second), and the 850-hPa wind (streamline) in the extreme (A) and regular (B) groups during the onset phase (from May to June).
The Asian–Australian monsoon, which occurred over the 40°–160° E, 30° S–30° N region, had profound impacts on the IOD (Webster et al., 1999; Li et al., 2002). The East Asian and Australian monsoons (EAAMs), which are key components of the Asian–Australian monsoon system, could be strong as an entity during some boreal summers, and under this condition, the EAAMs could jointly produce an easterly wind anomaly near the Marine Continent (MC) of Indonesia (Xu and Guan, 2017a; Xu and Guan, 2017b; Chen and Guan, 2017). The joint monsoon index of the EAAMs (Chen et al., 2017; Chen et al., 2020) was larger in the extreme group than in the regular group, which suggests that the EAAMs, particularly for the Australian winter monsoon, were likely to be stronger in the extreme group than in the regular group. The difference in the easterly wind anomaly in the region of the MC and the eastern TIO may be attributed to the EAAM difference between the two groups.
The composite analyses on precipitation and wind indicated that the negative precipitation anomaly occupied the Australian and east pole areas of the IOD and induced an anticyclonic wind anomaly at the 850-hPa level, which showed an anomalous easterly wind at the east pole in the May to June period of the extreme group (Figure 8A). In the same period of the regular group, the negative precipitation anomaly occurred on Java Island and its surrounding areas. Although the precipitation anomaly likewise induced an easterly wind anomaly at the east pole (Figure 8B), the easterly wind anomaly was relatively weak in comparison to the easterly wind anomaly for the extreme group (Figure 8C). From May to August, the precipitation anomaly, wind anomaly, and the difference between the extreme and regular groups were more obvious (Figure 9). The results further confirmed that the stronger Australian high due to the EAAM intensity difference made the easterly wind anomaly stronger in the extreme group than in the regular group. The westward current difference that was forced by the easterly wind difference eventually propelled the formation of extreme PIOD.
Figure 8
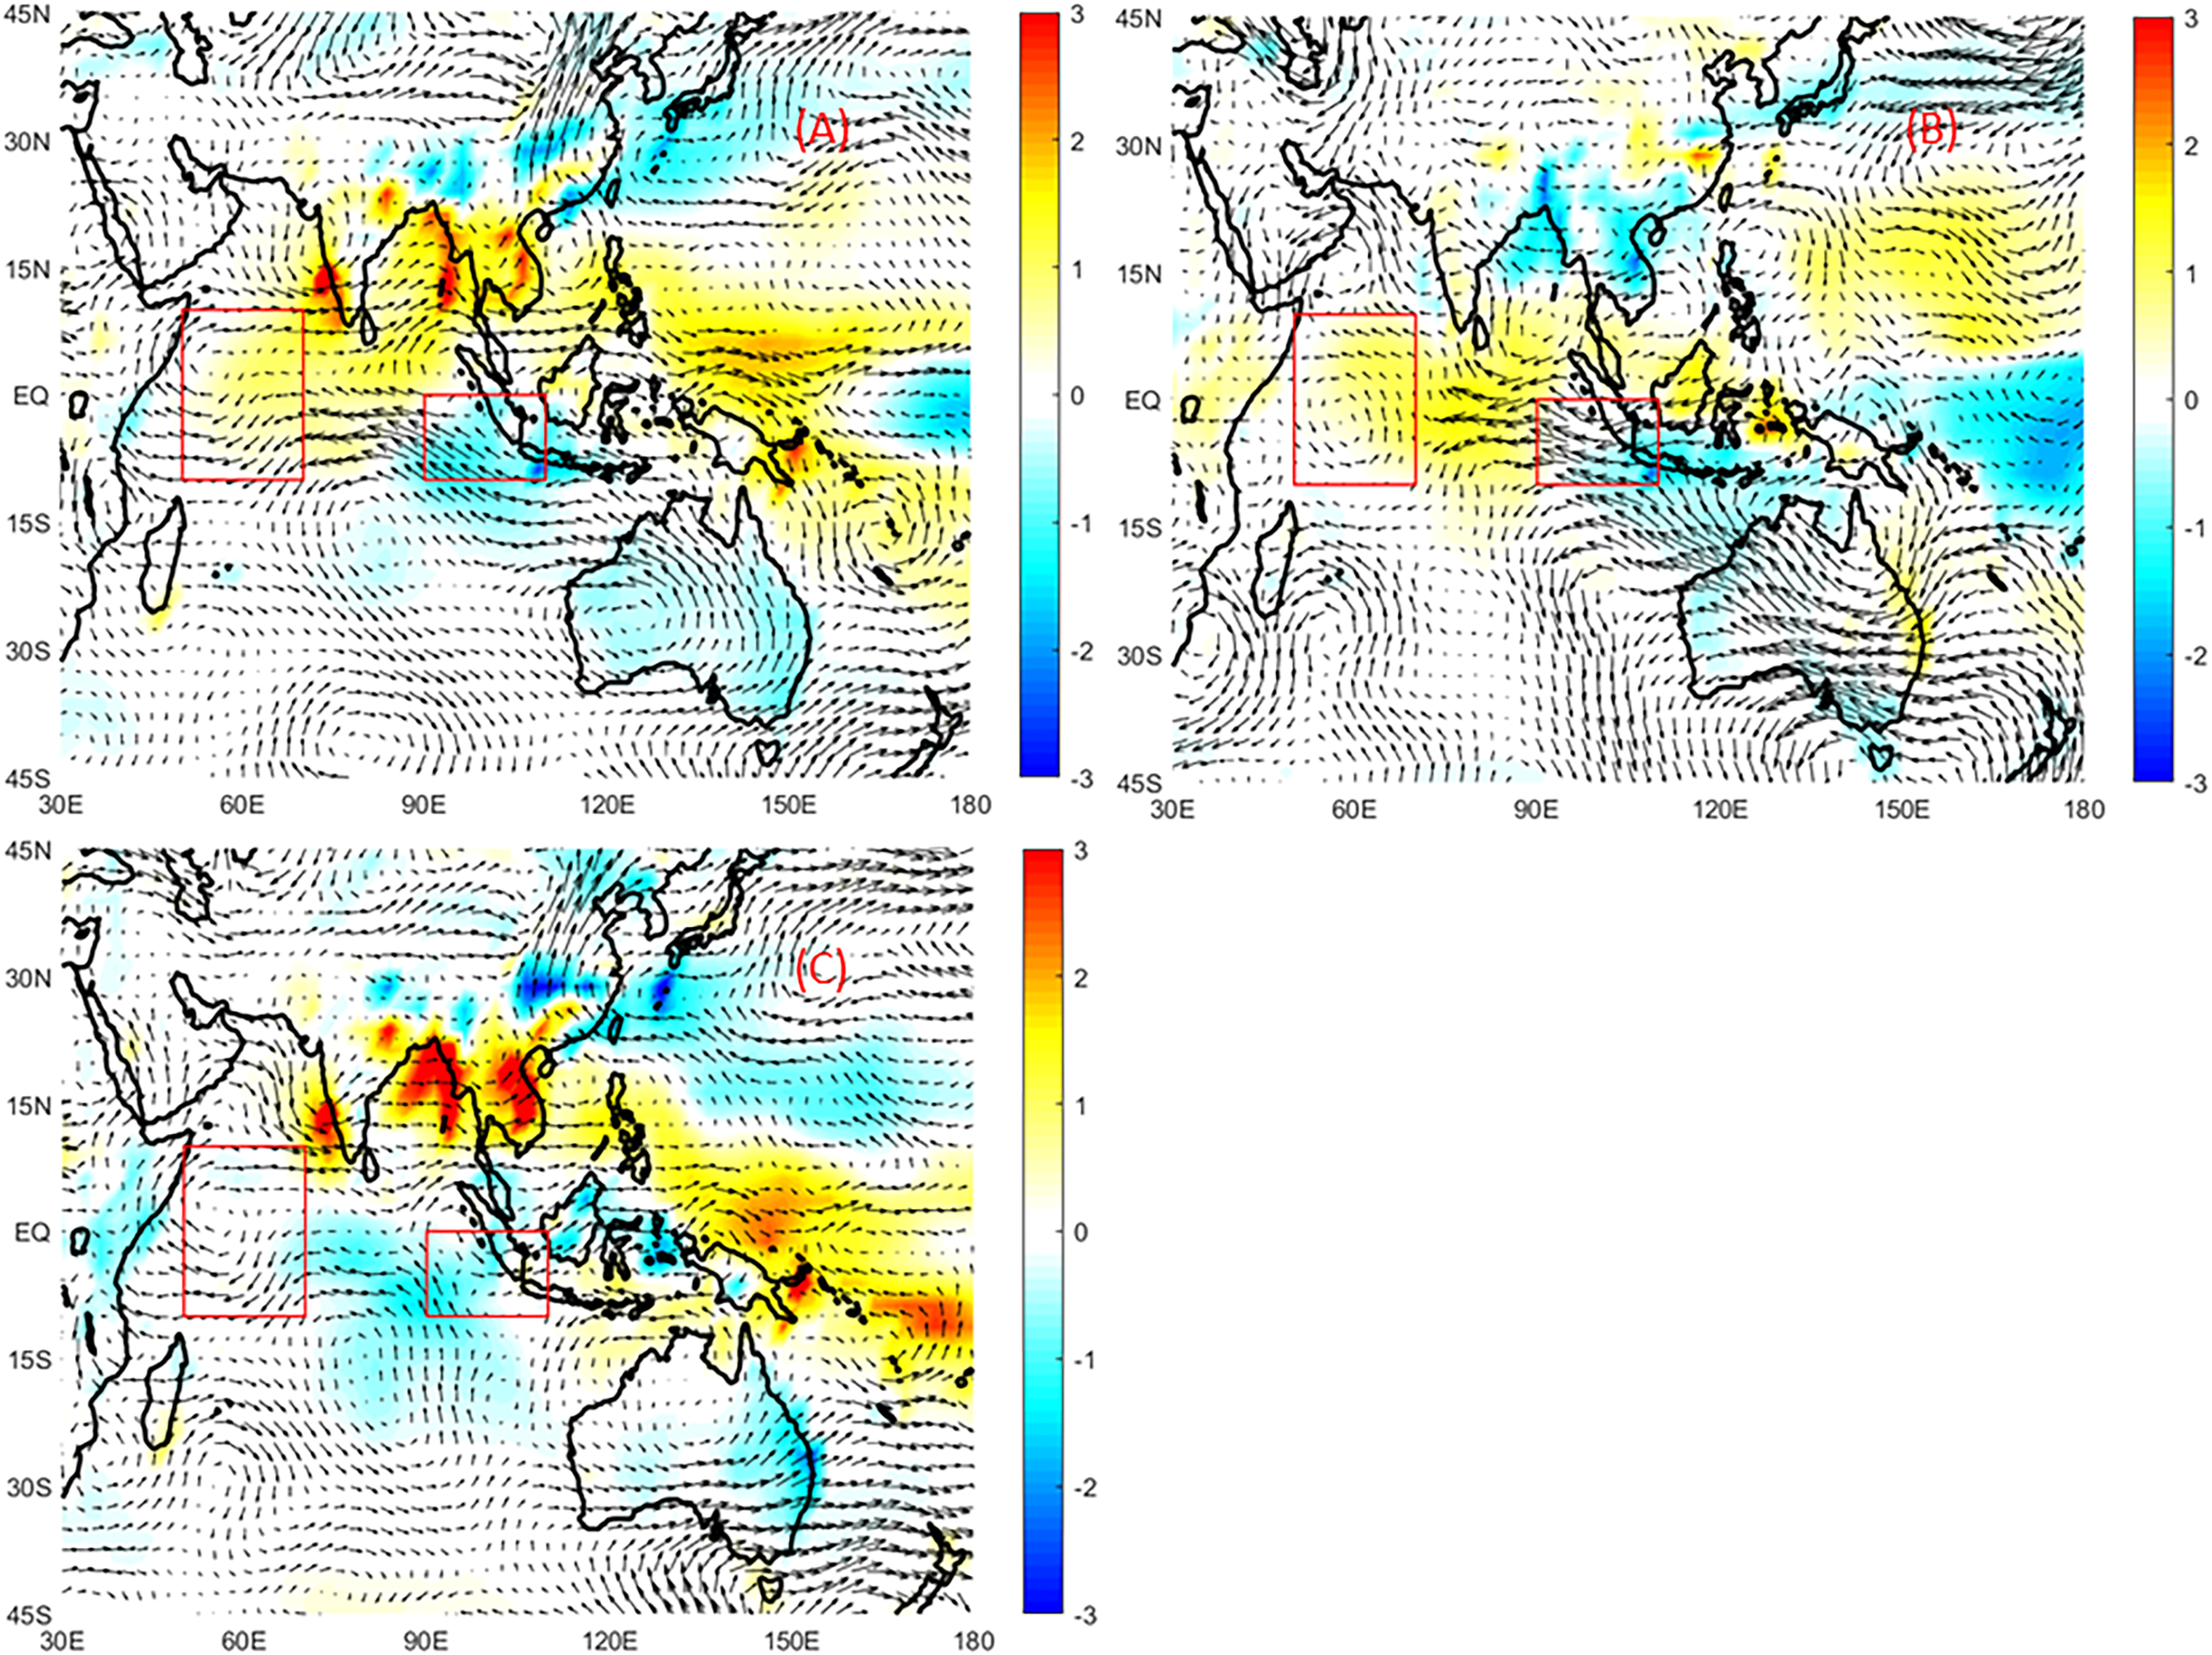
Composite of the precipitation anomaly (shading, in millimeters per day) and the 850-hPa wind anomaly (vector, in meters per second) for the extreme (A) and regular (B) groups and the difference between the two groups (C) during the May to June period.
Figure 9
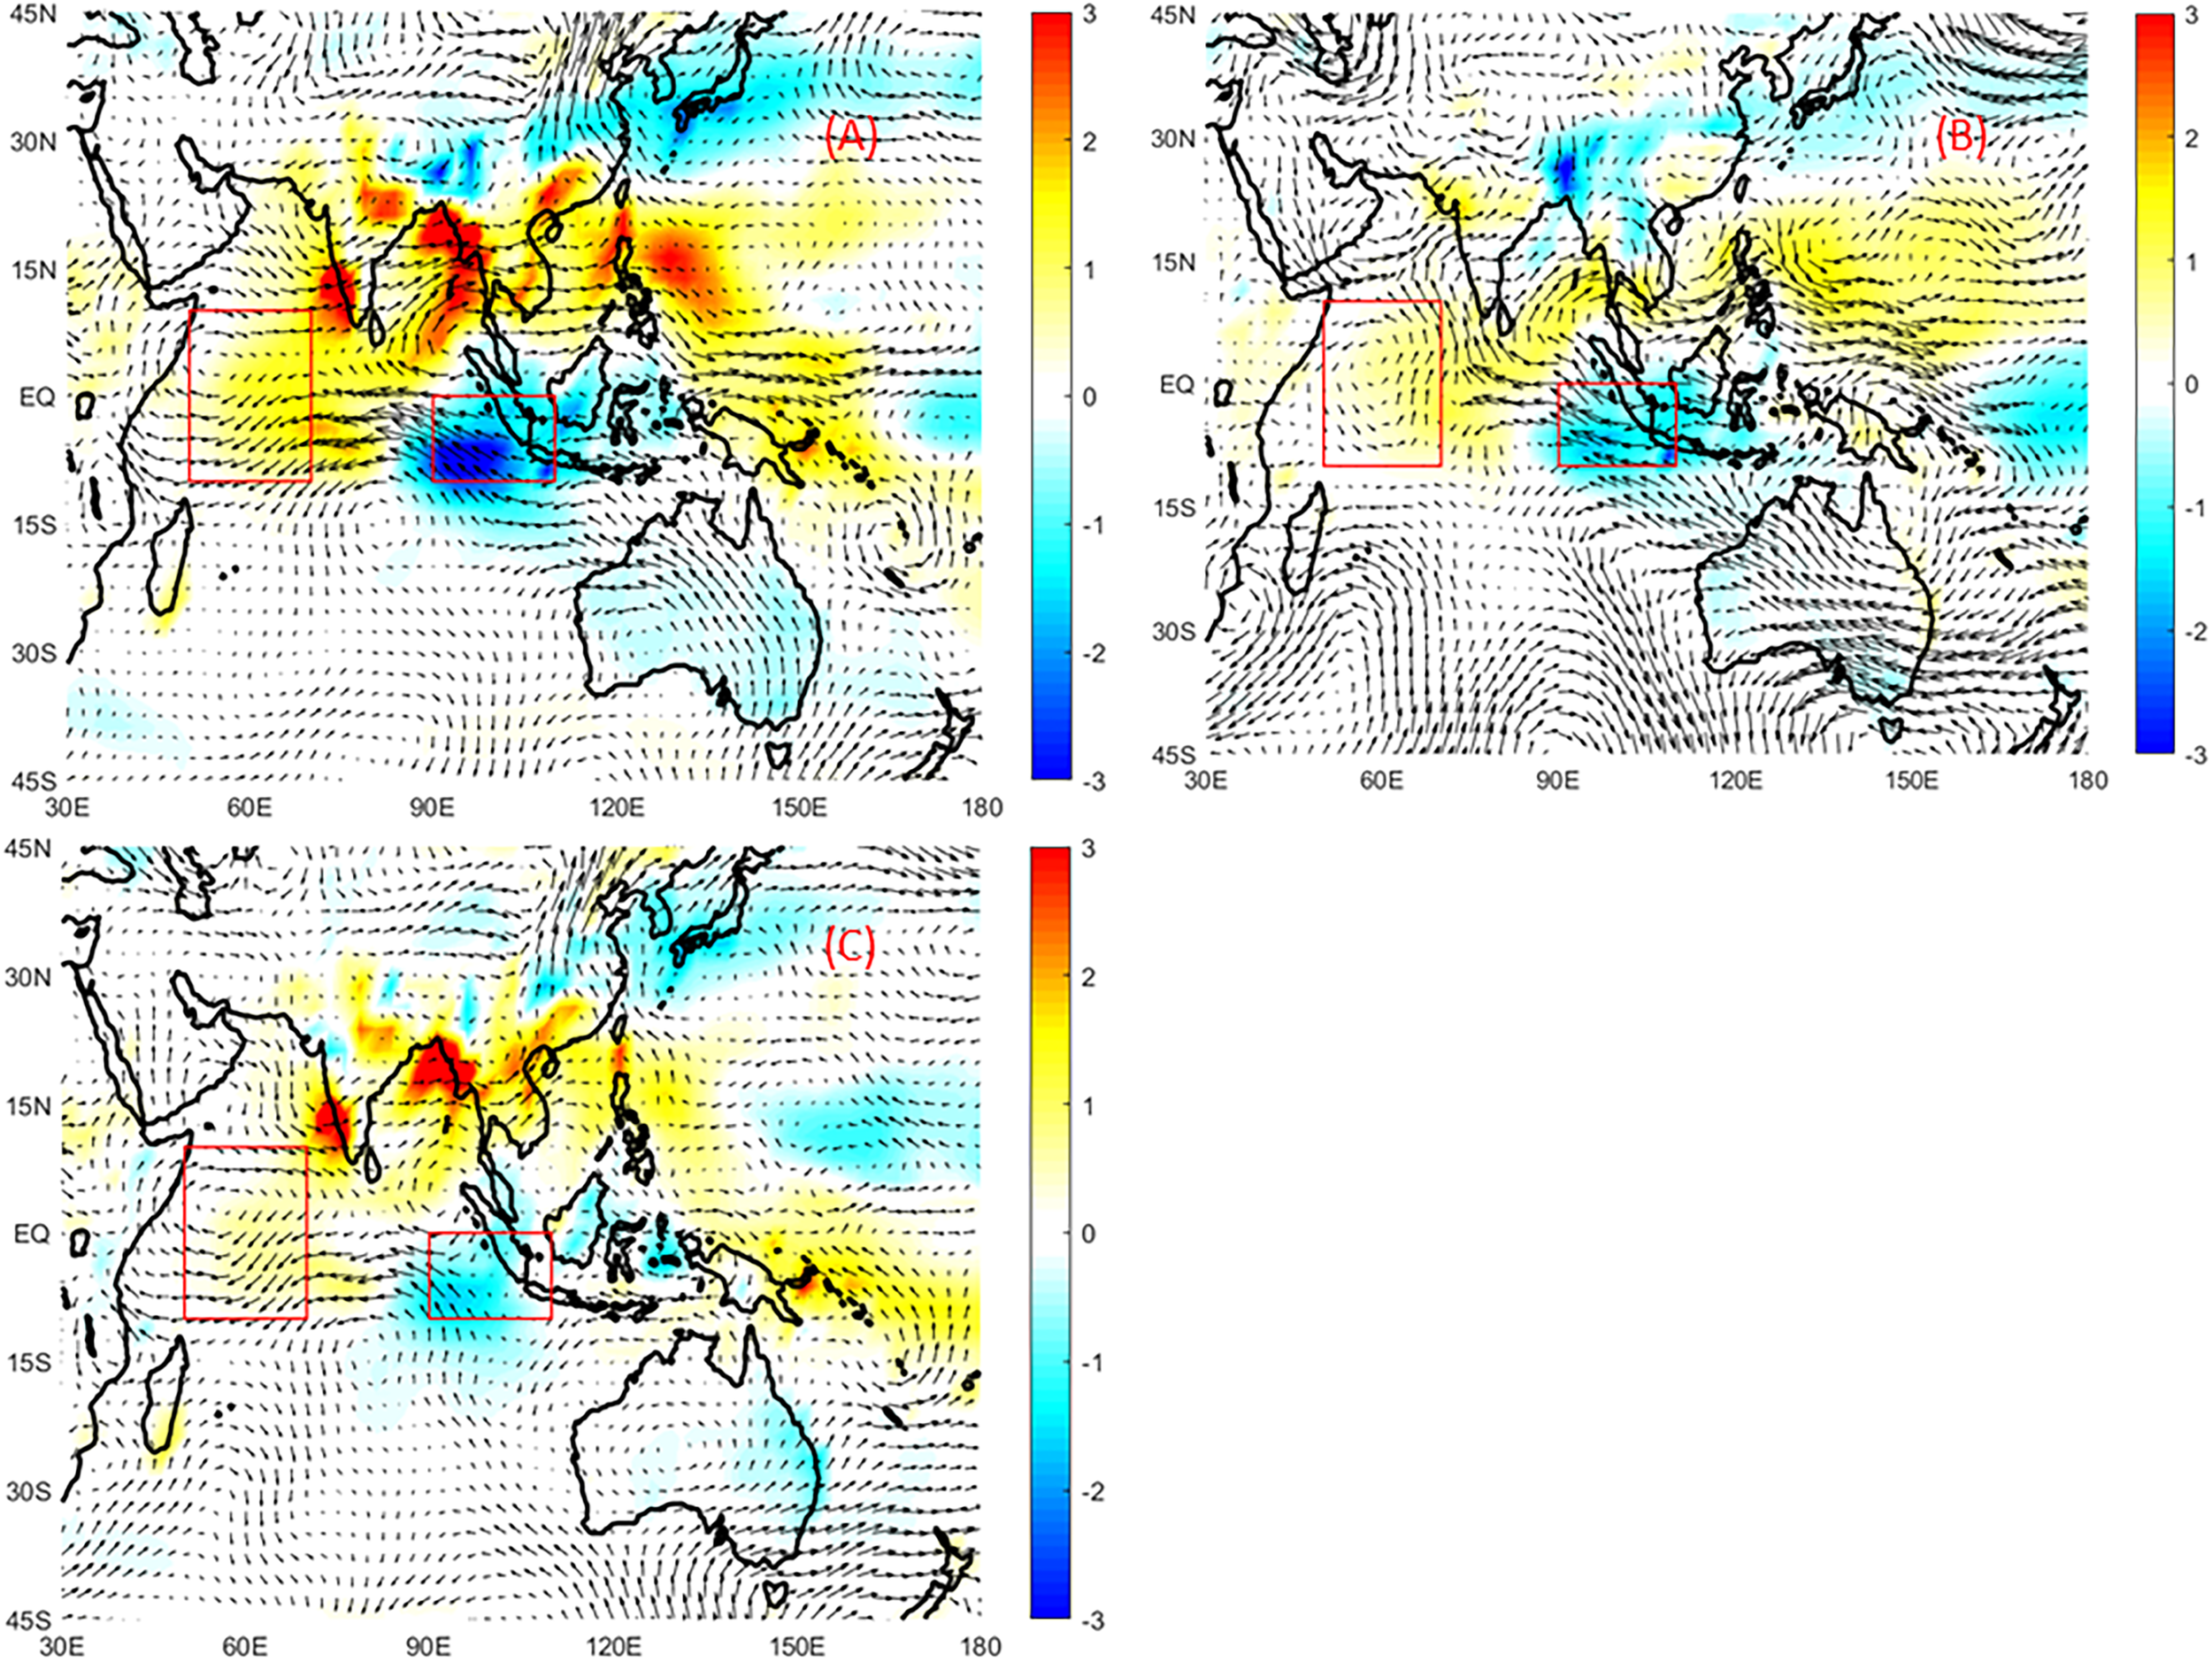
The same as Figure 8, but for the May to August period.
4 Summary and discussion
The IOD is the most notable interannual signal in the TIO and includes positive and negative events, similar to ENSO. The PIODs could be classified into type-east, type-comparable, and type-west according to their spatial pattern and dynamics. Four super PIOD events occurred during the 1960–2020 period, including those in 1961, 1994, 1997, and 2019. Among the four extreme cases, the events that occurred in 1961 and 1994 were type-east PIOD events, while those that occurred in 1997 and 2019 were type-comparable PIOD events. The aim of this study was to investigate the reasons for the type-east PIODs in 1961 and 1994 possibly developing into super events.
A composite analysis of the SSTAs verified that it was mainly due to the SSTA difference at the east pole that the type-east PIOD was remarkably stronger in the extreme group than in the regular group. The mixed-layer heat budget showed that the tendency of the SSTA difference between the extreme and regular groups was primarily dependent on the vertical advection terms during the May to August period. Further analysis illustrated that the vertical temperature gradient difference played the most important role in the difference in the type-east PIOD intensities between the extreme and regular groups. The difference in the vertical temperature gradient between the two groups, which was closely associated with the vertical motion difference, became the most important factor modulating the tendency because the vertical motion could cool the MLTA by upwelling the cold water from the deep layer.
The vertical motion difference could be mainly induced by the western current difference, which was forced by the easterly wind difference between the extreme and regular groups in the east TIO. The composite results showed that the difference in the easterly wind anomaly may be attributed to the difference in the EAAM intensity during boreal summer. The East Asian summer monsoon and the winter Australian monsoon, as an entity, were stronger in the extreme group than in the regular group. While the EAAMs were anomalously strong during boreal summer, they intensified the Australian high and northwestern subtropical anticyclone, i.e., the anticyclone anomaly wind field in the northwestern subtropical Pacific and Australia, which facilitated the easterly wind anomaly near the equator region covering the east pole area. The easterly wind difference associated with the EAAMs ultimately produced the extreme type-east PIOD events in 1961 and 1994 and the regular events in 1967 and 2006.
Very complex relationships exist between the East Asian summer monsoon and the Australian winter monsoon because they may be affected by ENSO and even some atmospheric processes in middle- and high-latitude regions. Except for the complementary relationship between the East Asian summer monsoon and the Australian winter monsoon, as an entity, they also had simultaneously homodromous variations. However, the environmental factors and processes modulating the EAAMs are still unknown and need to be further researched to improve the forecasting of extreme PIOD events.
Statements
Data availability statement
The data that support the findings of this study are publicly available and can be derived from the following sources: TC best-track dataset (https://www.ncdc.noaa.gov/ibtracs/index.php?name=ib-v4-access), and NCEP/NCAR and NOAA reanalysis data (https://psl.noaa.gov/data/gridded/reanalysis/).
Author contributions
ZX and YZ gathered and analyzed data, ZL and YF proposed the scientific question, discussed the results and co-wrote the manuscript. All authors edited the manuscript.
Funding
This study was financially supported by the Laoshan Laboratory (nos. LSKJ202202700 and LSKJ202202704), the Shanghai Typhoon Institute (no. TFJJ202206) and WESTPAC/IOC.
Acknowledgments
The authors thank JTWC, NCEP/NCAR, and NOAA for the use of the datasets employed herein.
Conflict of interest
The authors declare that the research was conducted in the absence of any commercial or financial relationships that could be construed as a potential conflict of interest.
Publisher’s note
All claims expressed in this article are solely those of the authors and do not necessarily represent those of their affiliated organizations, or those of the publisher, the editors and the reviewers. Any product that may be evaluated in this article, or claim that may be made by its manufacturer, is not guaranteed or endorsed by the publisher.
References
1
AllanR. J.ChambersD.DrosdowskyW.HendonH.LatifM.NichollsN.et al. (2001). Is there an Indian ocean dipole and is it independent of the El niño–southern oscillation? CLIVAR Exchanges6, 18–22.
2
AshokK.GuanZ. Y.YamagataT. (2003). A look at the relationship between the ENSO and the Indian ocean dipole. J. Meteorol. Soc. Jpn.81 (1), 41–56. doi: 10.2151/jmsj.81.41
3
BirkettC.MurtuguddeR.AllanT. (1999). Indian Ocean climate event brings floods to East africa’s lakes and the sudd marsh. Geophys. Res. Lett.26, 1031–1034. doi: 10.1029/1999GL900165
4
CaiW.YangK.WuL. X.HuangG.SantosoA.BenjaminN.et al. (2020). Opposite response of strong and moderate positive Indian ocean dipole to global warming. Nat. Clim. Change11, 27–32. doi: 10.1038/s41558-020-00943-1
5
CaiW.ZhengX. T.WellerE.CollinsM.CowanT.LengaigneM.et al. (2013). Projected response of the Indian ocean dipole to greenhouse warming. Nat. Geosci.6 (12), 999–1007. doi: 10.1038/ngeo2009
6
ChenW.GuanZ. Y. (2017). A joint monsoon index for East Asian-Australian monsoons during boreal summer. Atmos. Sci. Lett.18 (10), 403–408. doi: 10.1002/asl.782
7
ChenW.GuanZ. Y.YangH. D. (2020). Complementary relationship between East Asian summer monsoon and Australian winter monsoon and the related circulation anomalies. Trans. Atmos. Sci.43 (5), 834–844. doi: 10.13878/j.cnki.dqkxxb.20200616001
8
ChenL.LiT.BeheraS. K.DoiT. (2016). Distinctive precursory air-Sea signals between regular and super El niños. Adv. Atmos. Sci.33, 996–1004. doi: 10.1007/s00376-016-5250-8
9
DrbohlavH. K. L.GualdiS.NavarraA. (2007). A diagnostic study of the Indian ocean dipole mode in El niño and non–El niño years. J. Clim.20, 2961–2977. doi: 10.1175/JCLI4153.1
10
DuY.ZhangY. H.ZhangL. Y.TozukaT.NgB.CaiW. (2020). Thermocline warming induced extreme Indian ocean dipole in 2019. Geophys. Res. Lett.47, e2020GL090079. doi: 10.1029/2020GL090079
11
FischerA. S.TerrayP.GuilyardiE.GualdiS.DelecluseP. (2005). Two independent triggers for the Indian ocean dipole/zonal mode in a coupled GCM. J. Clim.18, 3428–3449. doi: 10.1175/JCLI3478.1
12
GuoF. Y.LiuQ. Y.SunS.YangJ. L. (2015). Three types of Indian ocean dipoles. J. Clim.28, 3073–3092. doi: 10.1175/JCLI-D-14-00507.1
13
HanW.ShinodaT.FuL. L.MccrearyJ. P. (2006). Impact of atmospheric intraseasonal oscillations on the indian ocean dipole during the 1990s. J. Phys. Oceanogr.36 (4), 670–690. doi: 10.1175/JPO2892.1
14
HongC. C.LiT.KugJ. S. (2008a). Asymmetry of the Indian ocean dipole. part I: Observational analysis. J. Clim.21, 4834–4848. doi: 10.1175/2008JCLI2222.1
15
HongC. C.LiT.LuoJ. J. (2008b). Asymmetry of the Indian ocean dipole. part II: Model diagnosis. J. Clim.21, 4849–4858. doi: 10.1175/2008JCLI2223.1
16
JiangJ. L.LiuY. M.MaoJ. Y.LiJ. P.ZhaoS. W.YuY. Q. (2022). Three types of positive Indian ocean dipoles and their relationships with the south Asian summer monsoon. J. Clim.35, 405–424. doi: 10.1175/JCLI-D-21-0089.1
17
KalnayE. (1996). The NCEP/NCAR 40-year reanalysis project. Bull. Am. Meteor. Soc77, 437–471. Coauthors. doi: 10.1175/1520-0477(1996)077<0437:TNYRP>2.0.CO;2
18
KumarA.HuZ. Z. (2012). Uncertainty in the ocean-atmosphere feedbacks associated with ENSO in the reanalysis products. Clim. Dyn.39, 575–588. doi: 10.1007/s00382-011-1104-3
19
LatifM.DommengetD.DimaM.GrotznerA. (1999). The role of Indian ocean sea surface temperature in forcing east African rainfall anomalies during December–January 1997/98. J. Clim.12, 3497–3504. doi: 10.1175/1520-0442(1999)012<3497:TROIOS>2.0.CO;2
20
LestariD. O.SutriyonoE.SabaruddinI. (2018). Severe drought event in Indonesia following 2015/16 El niño/ positive Indian dipole events. J. Phys. Conf. Ser.1011012040. doi: 10.1088/1742-6596/1011/1/012040
21
LiZ.LiT.YuW.LiK.LiuY. (2016). What controls the interannual variation of tropical cyclone genesis frequency over bay of Bengal in the post-monsoon peak season? Atmos. Sci. Lett.17, 148–154. doi: 10.1002/asl.636
22
LiT.ZhangY. S.LuE.WangD. L. (2002). Relative role of dynamic and thermodynamic processes in the development of the Indian ocean dipole: An OGCM diagnosis. Geophys. Res. Lett.29 (23), 2110. doi: 10.1029/2002GL05789
23
LuB.RenH. L. (2020). What caused the extreme Indian ocean dipole event in 2019? geophys. Res. Lett.47, e2020GL087768. doi: 10.1029/2020GL087768
24
Nur’utamiM. N.HidayatR. (2016). Influences of IOD and ENSO to Indonesian rainfall variability: Role of atmosphere ocean interaction in the indo-pacific sector. Procedia. Environ. Sci.33, 196–203. doi: 10.1016/j.proenv.2016.03.070
25
QiuY.CaiW. J.GuoX. G.NgB. (2014). The asymmetric influence of the positive and negative IOD events on china's rainfall. Sci. Rep.4 (1), 4943. doi: 10.1038/srep04943
26
SajiN. H.GoswamiB. N.VinayachandranP. N.YamagataT. (1999). A dipole mode in the tropical Indian ocean. Nature401 (6751), 360–363. doi: 10.1038/43854
27
SajiN. H.YamagataT. (2003). Possible impacts of Indian ocean dipole mode events on global climate. Clim. Res.25 (2), 151–169. doi: 10.3354/cr025151
28
SchottF. A.XieS. P.McCrearyJ. P. (2009). Indian Ocean circulation and climate variability. Rev. Geophys.47, RG1002. doi: 10.1029/2007RG000245
29
SunS. W.FangY.TanaLiuB. C. (2014). Dynamical mechanisms for asymmetric SSTA patterns associated with some Indian ocean dipoles. J. Geophys. Res. Oceans.119, 3076–3097. doi: 10.1002/2013JC009651
30
WangL.LiT.ZhouT. J. (2012). Intraseasonal SST variability and air-sea interaction over the kuroshio extension region during boreal summer. J. Clim.25, 1619–1634. doi: 10.1175/JCLI-D-11-00109.1
31
WebsterP. J.MooreA. M.LoschniggJ. P.LebenR. R. (1999). Coupled ocean-atmosphere dynamics in the Indian ocean during 1997-98. Nature401 (6751), 356–360. doi: 10.1038/43848
32
XiaoF.WangD.LeungM. Y. (2020). Early and extreme warming in the south China Sea during 2015/2016: Role of an unusual Indian ocean dipole event. Geophys. Res. Lett.47 (17), e2020GL089936. doi: 10.1029/2020GL089936
33
XuQ.GuanZ. Y. (2017a). Interdecadal change of diabatic forcing over key region of the maritime continent and its possible relations with east Asian summer monsoon anomalies. J. Trop. Meteorol. (in Chinese).33, 21–29.
34
XuQ.GuanZ. Y. (2017b). Interannual variability of summertime outgoing longwave radiation over the maritime continent in relation to East Asian summer monsoon anomalies. J. Meteorol.31, 665–677. doi: 10.1007/s13351-017-6178-3
35
YangY.XieS. P.WuL. X.KosakaY.LauN. C.VecchiG. A. (2015). Seasonality and predictability of the Indian ocean dipole mode: ENSO forcing and internal variability. J. Clim.28, 8021–8036. doi: 10.1175/JCLI-D-15-0078.1
Summary
Keywords
Indian Ocean Dipole (IOD), extreme event analysis, Asian–Australian monsoon, easterly wind anomaly, heat budget analysis
Citation
Li Z, Xu Z, Zheng Y and Fang Y (2023) Air sea conditions facilitate a transformation of the positive Indian Ocean Dipole with distinct east pole characteristics into an extreme event. Front. Mar. Sci. 10:1106130. doi: 10.3389/fmars.2023.1106130
Received
23 November 2022
Accepted
06 February 2023
Published
01 March 2023
Volume
10 - 2023
Edited by
Jinbao Song, Zhejiang University, China
Reviewed by
DX Wang, Sun Yat-sen University, China; Weichen Tao, Institute of Atmospheric Physics (CAS), China
Updates
Copyright
© 2023 Li, Xu, Zheng and Fang.
This is an open-access article distributed under the terms of the Creative Commons Attribution License (CC BY). The use, distribution or reproduction in other forums is permitted, provided the original author(s) and the copyright owner(s) are credited and that the original publication in this journal is cited, in accordance with accepted academic practice. No use, distribution or reproduction is permitted which does not comply with these terms.
*Correspondence: Zhi Li, lizhi@fio.org.cn
This article was submitted to Physical Oceanography, a section of the journal Frontiers in Marine Science
Disclaimer
All claims expressed in this article are solely those of the authors and do not necessarily represent those of their affiliated organizations, or those of the publisher, the editors and the reviewers. Any product that may be evaluated in this article or claim that may be made by its manufacturer is not guaranteed or endorsed by the publisher.