- 1State Key Laboratory of Estuarine and Coastal Research, East China Normal University, Shanghai, China
- 2Great Lakes Research Center, Michigan Technological University, Houghton, MI, United States
- 3Institute of Eco-Chongming, East China Normal University, Shanghai, China
- 4Department of Estuarine and Delta Systems, Netherlands Institute for Sea Research (NIOZ), Yerseke, Netherlands
- 5Faculty of Civil Engineering and Geosciences, Delft University of Technology, Delft, Netherlands
- 6State Key Laboratory of Hydrology-Water Resources and Hydraulic Engineering, Hohai University, Nanjing, China
With the capacity to reduce wave energy and trap sediment, Scirpus mariqueter has become an important native species of annual grass for ecology restoration at the Yangtze Estuary in eastern China. Due to seasonal variances of biophysical characteristics, S. mariqueter usually bends and breaks in winter, resulting in flattened stems that may reduce its wave attenuation capacity. To investigate the effects of vegetation flattening on wave attenuation, a set of flume experiments were conducted for flattened and standing vegetation under different wave conditions. The model vegetation was designed to represent the wilted S. mariqueter collected in winter with dynamic similarity. Results showed that the wave damping coefficient for flattened vegetation (βF) was 33.6%-72.4% of that for standing vegetation (βS) with the same vegetation length. Both βF and βS increased with wave height but decreased with water depth. A wave attenuation indicator (WAI) was defined to generate empirical formulas for βS and βF as well as their ratio βF/βS. The empirical formulas were then applied to modify the existing standing vegetation-based wave attenuation model for flattened vegetation and performed successfully. Understanding the wave attenuation characteristics of flattened vegetation is essential for the management of ecological restoration and coastal protection.
1 Introduction
Saltmarshes play a key role in coastal ecosystems by providing habitats to numerous species (e.g., birds, fish, etc.), cycling nutrients, trapping sediment, and sequestering carbon (Chmura et al., 2003; Sousa et al., 2010; Barbier et al., 2011; Chen et al., 2018). Saltmarshes can also serve as a buffer for storm surges and waves (Jadhav et al., 2013; Anderson and Smith, 2014; Möller et al., 2014; Maza et al., 2015; Christie et al., 2018; Garzon et al., 2019; Maza et al., 2022).With these features, saltmarshes have been widely identified as one of the most important components in nature-based solutions for coastal protection, which are more ecological and sustainable than conventional hard engineering structures (Temmerman et al., 2013).
The most common saltmarshes along the shoreline of the Yangtze Estuary in China include Scirpus mariqueter (Figure 1B), Phragmites australis (Figure 1B), and Spartina alterniflora (Figure 1B). The change of the percentages of different plant species in saltmarshes would significantly influence their wave attenuation capacity and characteristics, due to different land cover types, positions, and transect lengths (Xue et al., 2021) as well as different geometrical and mechanical properties (Ysebaert et al., 2011). For example, when the coverage of S. mariqueter increased from 50% to 75% and Spartina alterniflora coverage decreased from 50% to 25%, the wave attenuation of S. mariqueter increased by 91% and and that of S. alterniflora decreased by 43% respectively (Zhao et al., 2023). Therefore, quantifying the wave attenuation capacity of S. mariqueter is essential to understand the function of saltmarshes for coastal protection and resilience.
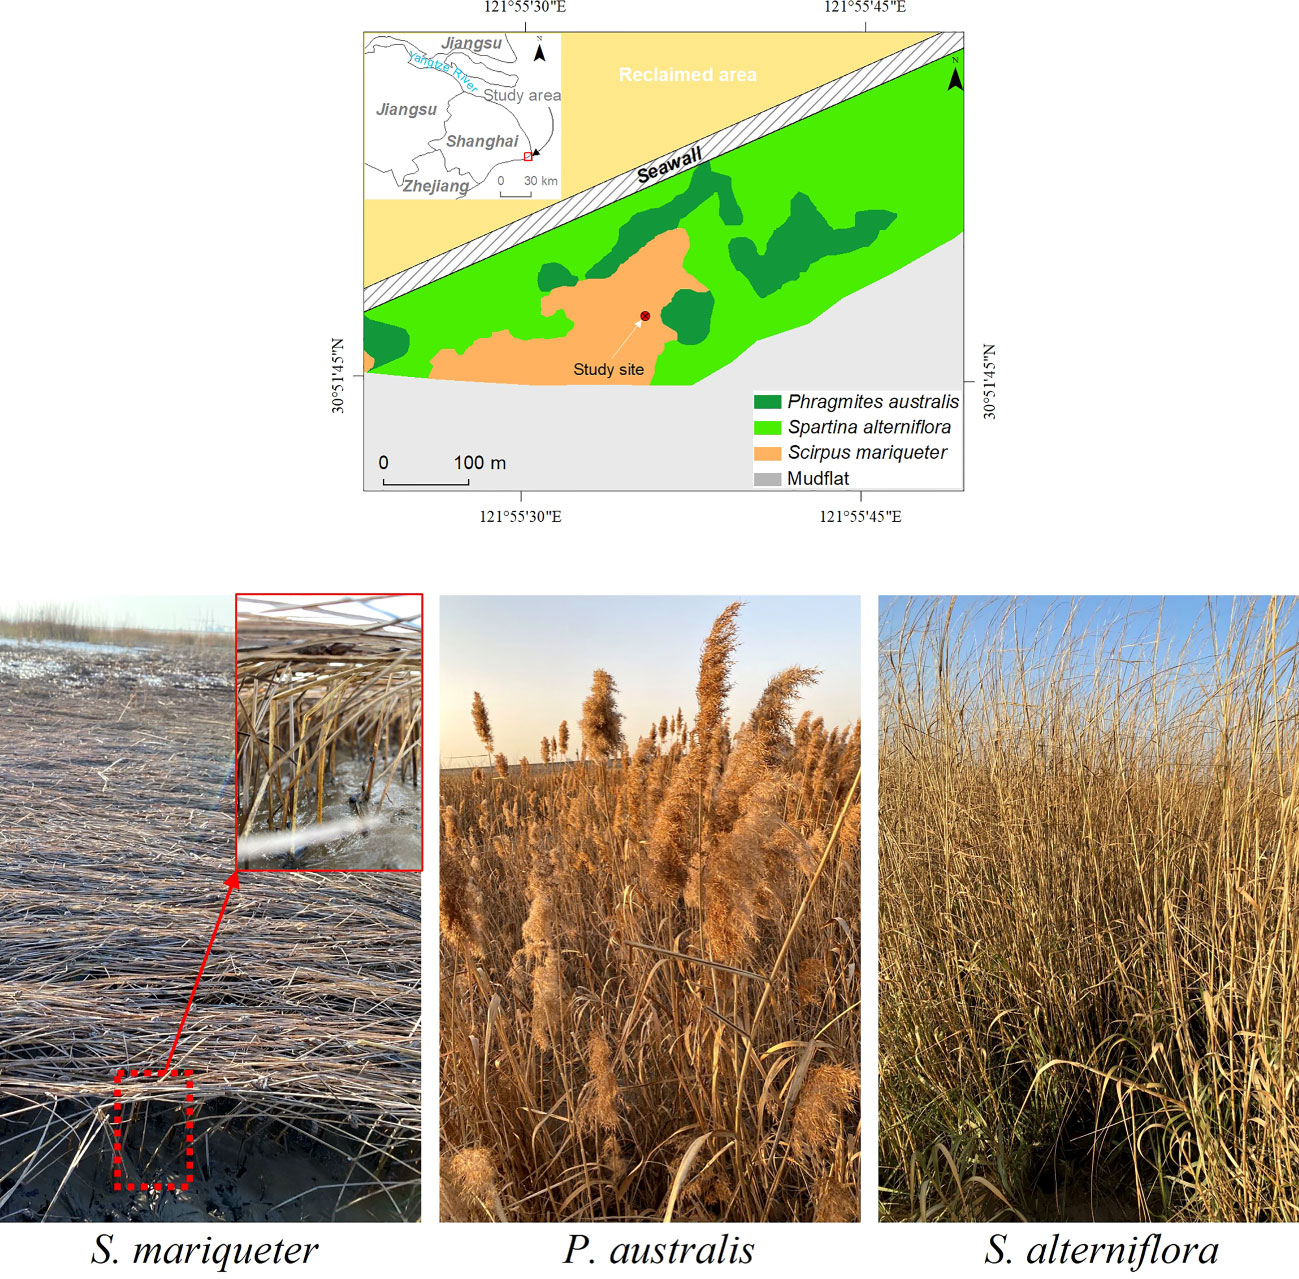
Figure 1 (A) Sampling site (Nanhui shore, Shanghai), (B) and photos of S. mariqueter, P. australis and S. alterniflora in January 2021. The S. mariqueter was flattened and the photo in red solid square showed broken stems in red dashed square.
Wave attenuation by vegetation is mainly dependent on its geometrical and mechanical properties (e.g.,stem stiffness, vegetation height, plant population density, meadow length, standing biomass, age etc.) and wave conditions (wave height, wavelength, and water depth)(Bouma et al., 2005; Anderson and Smith, 2014; Paul et al., 2016; van Veelen et al., 2020; Zhu et al., 2020b; Zhu et al., 2020c; Maza et al., 2021; Maza et al., 2022). Currents can also strengthen or waken the wave attenuation by vegetation (Hu et al., 2014; Maza et al., 2015; Losada et al., 2016). Although the plant density of S. mariqueter was much larger than that of S. alterniflora (2352 ± 355 and 334 ± 12 stems/m2), with thinner and shorter stems, S. mariqueter marshes reduce less wave height than S. alterniflora (Ysebaert et al., 2011). The wave attenuation of S. mariqueter is more sensitive to water level change compared to S. alterniflora, especially under submergence conditions (Ysebaert et al., 2011; Garzon et al., 2019). Associated with seasonal variance, the stem diameter and plant density decrease dramatically in winter, resulting in smaller wave attenuation, e.g., the field observation in Ge et al. (2018) indicated that the wave height attenuation by 180 m-width S. mariqueter dropped by 30% from 80% in summer to 50% in winter.
In winter, S. mariqueter begins to wilt in November and stops growing. Under the continuous actions of hydrodynamic forces, wilted stems are easy to bend, break, and even swiped away (Ge et al., 2018). The vegetation with a broken stem displays a flattened posture (Figure 1B). As wilted vegetation cannot recover like in growing seasons, the vegetation flattening continues through the whole winter until the aboveground biomass totally disappears at the end of January. Compared to unbroken vegetation that has a standing posture, flattened vegetation with bending stems experiences a less drag (Vuik et al., 2018). Generally, the wave attenuation is due to the work of vegetation drag. The drag can be decomposed into form drag in the stem-normal direction and friction drag in the stem-tangential direction (Dean and Dalrymple, 1991; Luhar and Nepf, 2016; Zhu et al., 2020b). For rigid vegetation without motion, the form drag dominates for standing vegetation while the friction drag dominates for flattened vegetation (Vuik et al., 2018). Usually, friction is much smaller than form drag, such that the flattened vegetation showed a smaller wave attenuation compared with standing vegetation. Take Scirpus maritimus as an example, the wave attenuation by flattened vegetation is 66% of that by standing vegetation (Vuik et al., 2018). However, for flexible vegetation, both form drag and friction drag are important due to vegetation motion under wave force (Zhu et al., 2020b). Therefore, it is challenging to quantify the wave attenuation by flattened flexible vegetation, leading to a significant knowledge gap in restoring S. mariqueter for coastal protection, especially in winter storms.
The objective of this study is to quantify the wave attenuation by S. mariqueter with flattened flexible stems. The S. mariqueter was collected in Nanhui, Shanghai, China on Jan 4th 2021. Based on the measured geometrical and mechanical properties of S. mariqueter, representative model vegetation with dynamical similarity was used in the flume experiments to explore the difference between the wave attenuations by standing and flattened vegetation. The characteristics of standing and flattened vegetation in different wave conditions are analyzed. Based on the experimental data, an empirical formula to quantify the effects of vegetation flattening is developed and applied to existing wave attenuation models for flattened vegetation. Finally, the wave attenuation of standing vegetation, flattened vegetation, and the vertical part of the flattened vegetation is investigated through a case study under storm events.
2 Materials and methods
2.1 Sampling of S. mariqueter
The sampling site (30°51’N, 121°55’E) is located at the Nanhui Foreland salt marshes on the seaward side of a seawall (Figure 1A). The area behind the seawall was reclamation area which had been wetlands before 2001(Tian et al., 2016). This area has a mixed semidiurnal tide with a mean tide tidal range of 3.2 m and a maximum tidal range of over 4 m during spring tides (Zhu et al., 2014). The sampling site is submerged in water at high tide and exposed to air at low tide. With the spreading of the invasive species S. alterniflora, the native species S. mariqueter has shrunk to a small region (Figure 1A). To preserve biodiversity and improve the resilience of the coastal ecosystem, ecological measures are being conducted to restore S. mariqueter (Yuan et al., 2022). S. mariqueter is usually observed to start to flatten in December and last until January at the end of the growing season. We collected S. mariqueter samples on Jan 4th 2021 when most S. mariqueter are flattened. Almost all of the S. mariqueter stems were broken at 10 cm from the base, resulting in flattened stems above the breaking point (Figure 1B). Three 25 × 25 cm2 quadrats of S. mariqueter were collected for measurements. The measured plant density (N) was 2148 ± 414 stems/m2, calculated from the average number of shoots over the three quadrats. All of the stems were cut from the base and taken to the lab to measure the geometrical and mechanical properties.
The stem length (l) was measured from total 30 stems from the three quadrats with 10 stems for each quadrat. The measured stem length ranged from 21.4 to 44.3 cm with an average of 34.2 cm. The cross section of S. mariqueter was triangular and oriented in a random direction. The height of each side of the cross-section was measured using a caliper. As the cross-section is close to an equilateral triangle, the mean height at three sides is defined as the section height (hs), such that the second moment of area is . The measured section height ranged from 1.27 to 1.89 mm with an average of 1.56 mm. The elastic modulus (Young’s modulus, E) was measured with 20 specimens from 20 stems by a three-point bending test (Vuik et al., 2018). The measured E ranged from 1.9 to 7.2 GPa with an average of 3.9 GPa. The measured values are summarized in Table 1 and also compared with the values in literature.

Table 1 The morphological and mechanical properties of S. mariqueter and the representative vegetation model.
2.2 Flume experiments
As it is difficult to keep the flattening state and bioactivity of stems by moving S. mariqueter in the flume, we used dynamically similar model vegetation to explore the effects of stem flattening on wave attenuation. The field measurements of the wave attenuation by S. mariqueter will be documented in another paper in preparation, where the plant properties and wave conditions were measured from May to November 2021 covering the whole growing season of S. mariqueter. The field measurements included plant properties and wave data from May to November 2021 across the growing season of S. mariqueter. To model the vegetation, hollow polypropylene (PP) tubes with circular cross-section were selected based on the dynamic similarity. The model was full scale. The outer diameter of the model stem was 1.8 mm, which was comparable to the measured section height (1.27-1.89 mm) and side lengths of S. mariqueter. The wall thickness of the model stem was 0.4 mm and the elastic modulus was 1.739 GPa, yielding a flexural rigidity (EI) of 876 N·mm2, which was slightly larger than the maximum measured value of 676 N·mm2 for S. mariqueter. The EI of the model vegetation is 30% larger than the measured maximum EI of S. mariqueter. The wave attenuation by the model vegetation is estimated to be larger than the real S. mariqueter. However, the effects of EI on wave attenuation become less sensitive when the vegetation is very flexible. For example in Zhu et al. (2021), the wave energy dissipation decreased by 6.7% when EI decreased by 76%. The mass density of the model stem was 0.92 g/cm3. As the PP tubes were filled with air, the effective mass density of PP tube was 0.64 g/cm3, which was larger than the measured value of 0.35 ± 0.05 g/cm3, yielding a smaller buoyancy. However, according to the theory in Henderson (2019), the effects of buoyancy on stem motion were much smaller than stiffness and therefore ignorable. Although there are some other parameters governing the motion of stems (Zhu et al., 2021), these parameters are not as important as the stiffness and buoyancy for the wave conditions in this study and therefore not discussed in detail here. The designed vegetation length (l) was 50 cm (Figures 2A, C), slightly longer than the maximum measurement of 44.3 cm. To represent flattened vegetation, the model vegetation was folded at 10 cm above the base (Figures 2B, D), which was comparable to the folding point at 13.3 ± 2.6 cm observed in the field. To keep the same configuration, the vegetation was folded towards the direction of wave propagation after finishing the experiments for standing vegetation. Due to buoyancy, the horizontal part of the vegetation curves upward at 20° with the horizontal line (Figure 2D). The model vegetation was installed in and evenly distributed on a 5 mm-thick acrylic plate, which was fixed at the bottom of the flume. There are 4455 stems over 9 acrylic plates, covering a 4.5 m-long area along the flume (Figure 2E). The plant density was therefore 1980 stems/m2, similar to the measured plant density in this study and literature (e.g. Ysebaert et al., 2011; Ge et al., 2018).
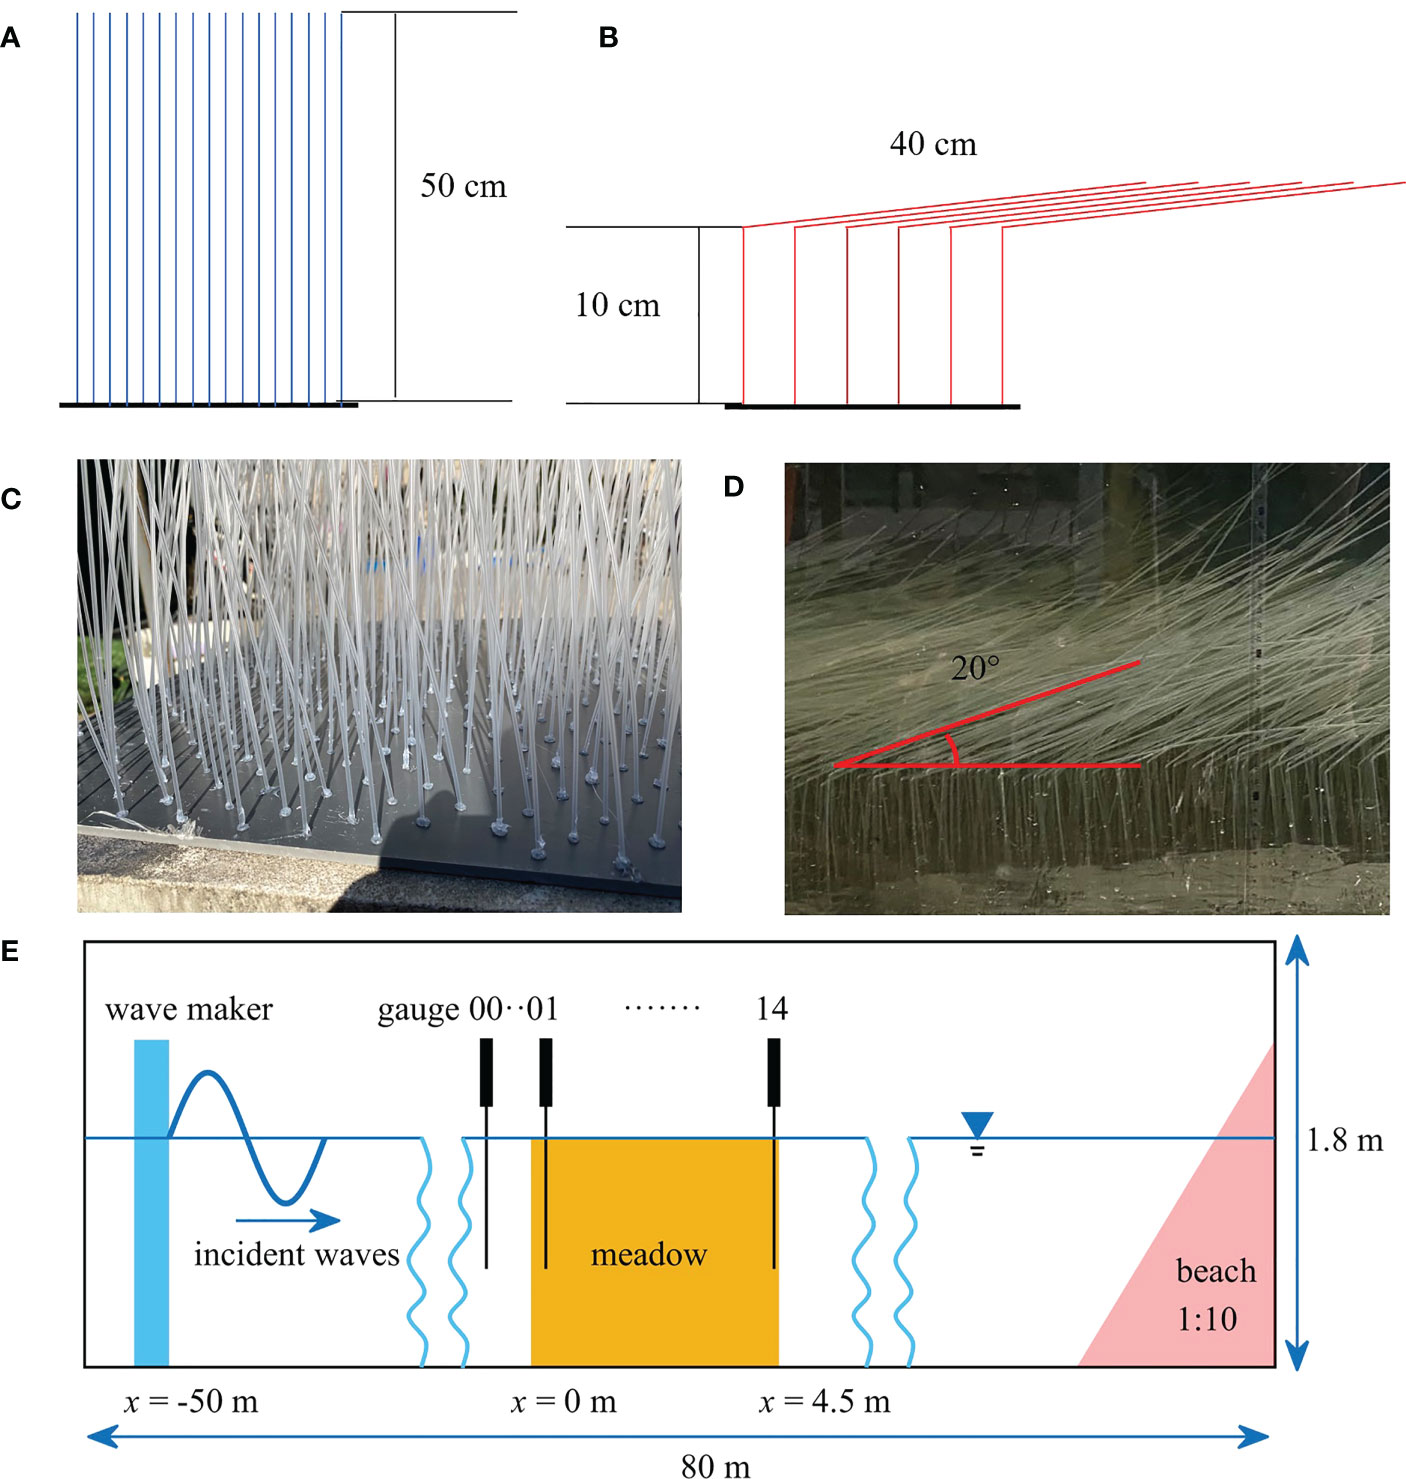
Figure 2 Sketches of (A) standing and (B) flattened vegetation. Photos of the (C) standing and (D) flatten model vegetation in the flume. (E) Experimental setup for measuring the wave attenuation by vegetation (dimensions are not scaled).
The laboratory experiments were conducted in the 80 m-long, 1 m-wide, and 1.8 m-high wave flume at Hohai University in Nanjing, China. In common condition at Nanhui, the mean water depth was from 0.58 to 1.13 m, with wave height from 0.06 to 0.15 m and wave period from 0.8 s to 2.8 s (Liu et al., 2021). So the wave conditions in the present study can represent most wave periods and wave heights under common conditions. In the present study, the water depth (h) was from 0.5 m to 0.6 m, such that both standing and flattened vegetation were completely submerged. Due to the limitation of flume and wave paddle, the water depth cannot be over 0.7 m. The regular incident wave height (HI0) was from 0.05 to 0.15 m. The wave period (T) was from 1.2 to 3 s, yielding wavelength (λ) of 2.05 to 6.4 m, where λ=2π/k with k the wave number. The wave number is determined from the dispersion relation (2π/T)2=gk tanh kh with g the gravitational acceleration (Dean and Dalrymple, 1991). The meadow length was 4.5 m, covering 0.7 to 2.2 wavelength. The designed wave conditions are summarized in Table 2.

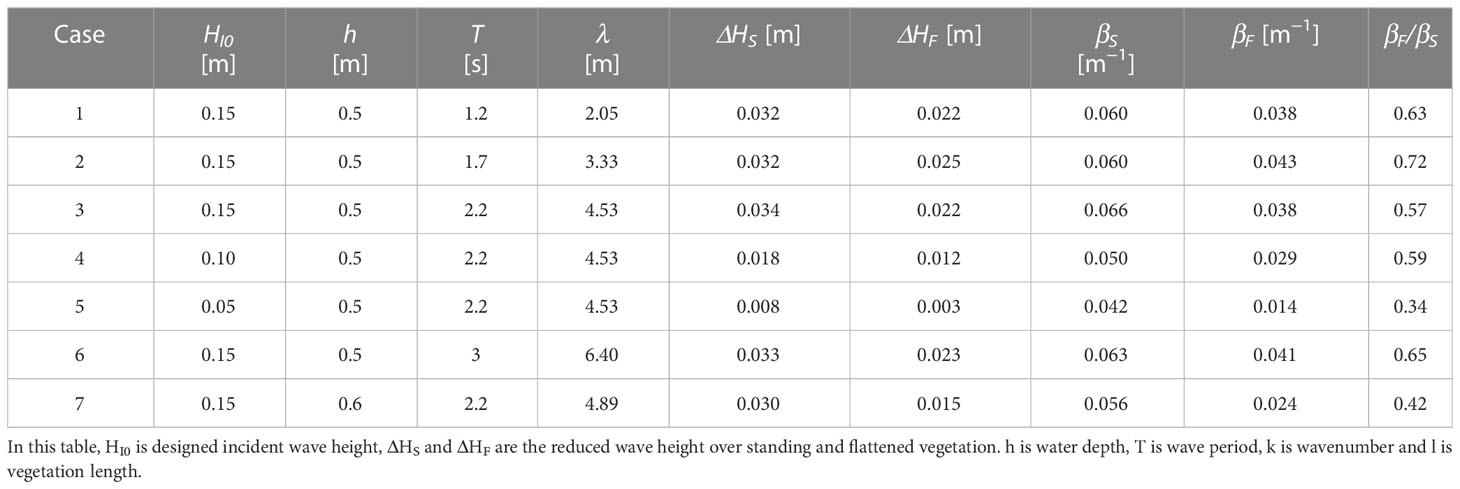
Table 2 Wave conditions for the flume experiments, where HI0 is incident wave height, h is water depth, T is wave period, λ is wavelength, k is wave number, and l is stem length.
The wave height over the meadow was measured by 15 wave gauges. A reference gauge was placed 50 cm upstream in front of the leading edge. Other gauges were fixed across the meadow with 10-30 cm intervals depending on the wavelength. The sampling time was 5 min at a rate of 1 kHz, including 100-250 waves. The data were extracted after 3 mins, when the measured waves are at steady state. According to Dalrympleet al. (1984), the wave height decays as,
where H(x) is the local wave height at x m from the leading edge (Figure 2A), HI0 is the incident wave height at x = 0, and β is wave damping coefficient. The wave damping coefficient is fitted based on the measured wave heights along the meadow using the methods in Appendix A.
3 Results
3.1 Wave attenuation
β is more related to wave height which had a wide range in the experiment. The wave attenuation under different wave conditions can be more significantly shown with β. The measured wave damping coefficients for both standing vegetation (βS) and flattened vegetation (βF) are shown in Table 3. To investigate the characteristics of the wave attenuation capacity of vegetation in different wave conditions, β was presented as a function of HI0, h, and λ as shown in Figure 3. Obviously, βF is smaller than βS for all the tested cases with βF/βS ranged from 33.6% to 72.4%, indicating that the wave attenuation of flattened vegetation is smaller than that of standing vegetation. Nevertheless, βF varies with wave conditions in a similar pattern to βS (Figure 3).
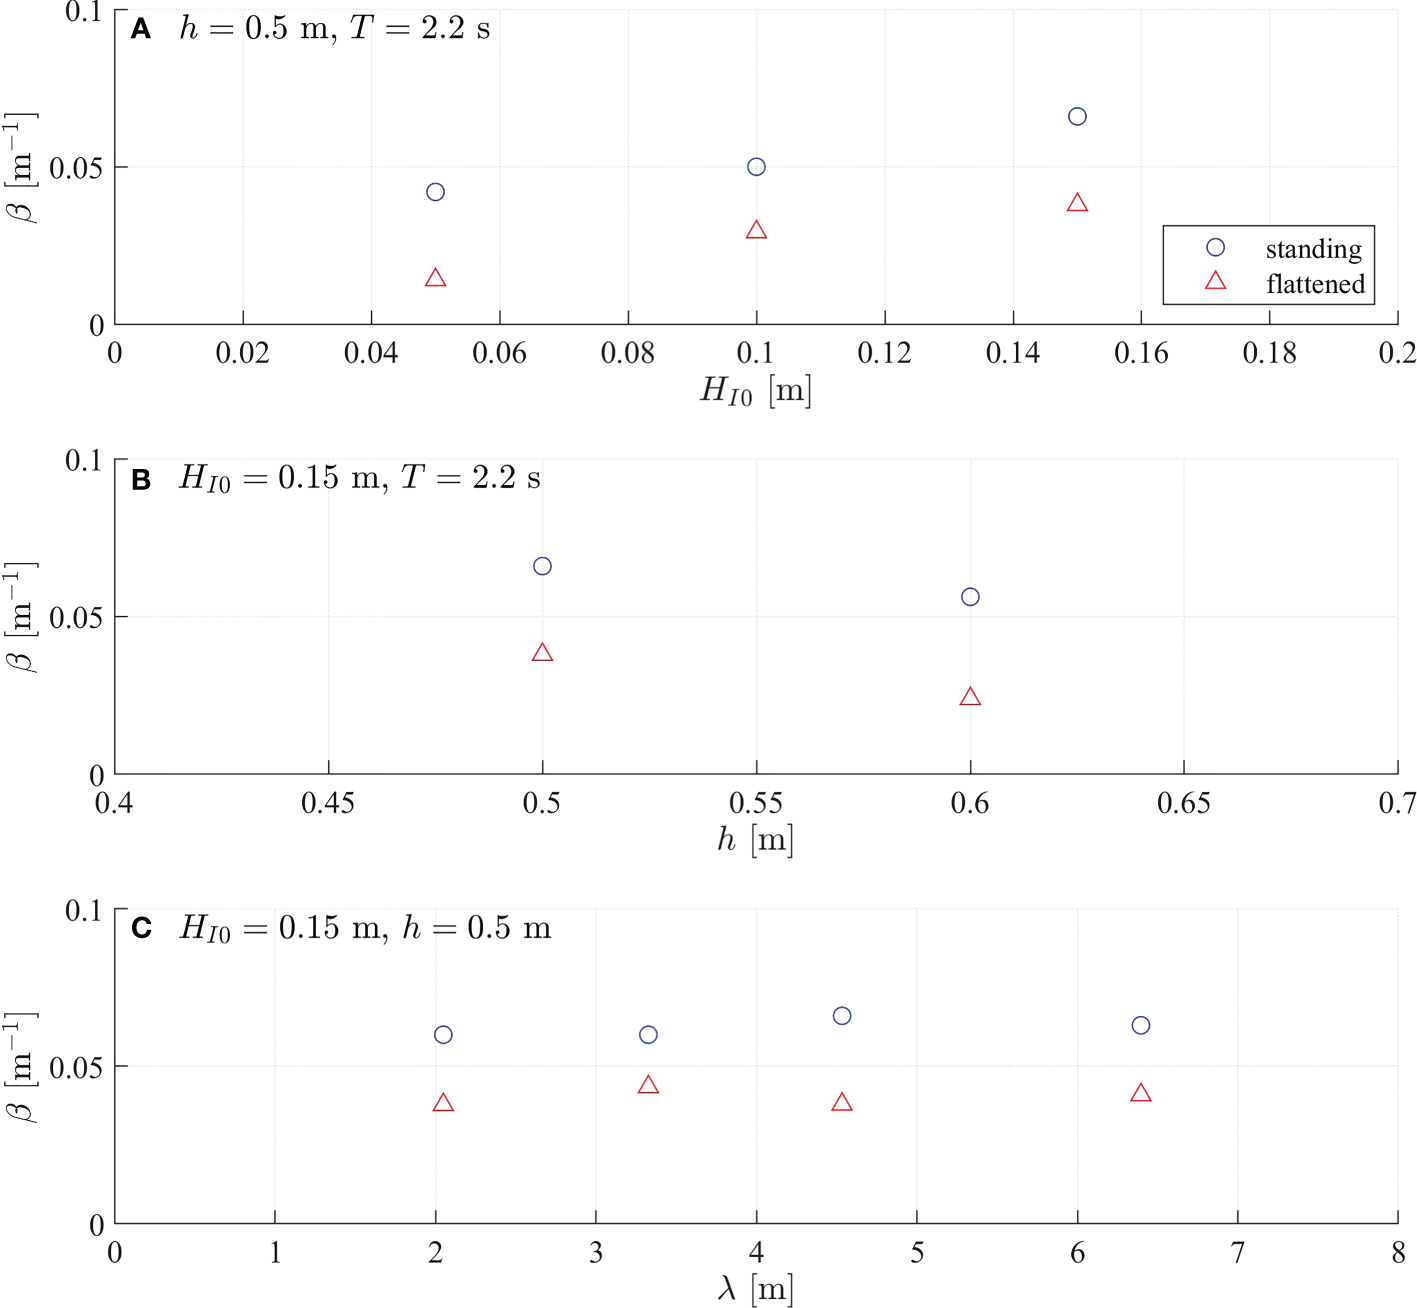
Figure 3 Measured wave damping coefficient (β,m–1) as a function of (A) incident wave height (HI0,m), (B) water depth (h,m), and (C) wavelength (λ,m). The results for standing and flattened vegetation are denoted by blue circles and blue triangles, respectively.
As shown in Figure 3A, both βS and βF increase with HI0, indicating that both standing and flattened vegetation can damp more wave energy in larger waves. However, the wave attenuation reduces with increasing water depth (Figure 3B). As water depth rises, the wave orbital velocity decreases, yielding a smaller drag and therefore reducing wave attenuation. Associated with the water level rise, the wave energy also moves upward because the wave energy concentrates near the water surface and decays along water depth. Consequently, less wave energy is damped by the more deeply submerged flattened vegetation such that βF drops more dramatically than βS (Figure 3B). For instance in Figure 3B, βS dropped 16.7% from 0.066 m–1 to 0.056 m–1 while βF dropped 36.8% from 0.038 m–1 to 0.024 m–1 when the water depth increased by 20% from 0.5 m to 0.6 m. The wave damping coefficient does not show a significant change with λ in these experiments (Figure 3C).
3.2 Empirical formulas for wave damping coefficients
Numerous studies have been conducted to quantify the wave damping coefficient (β) of standing vegetation based on the formula in (Dalrymple et al., 1984), which is given by,
The challenge is to calibrate the bulk drag coefficient CD for a vegetation meadow. Conventionally, CD is fitted as a function of Reynolds number (Re) or Keulegan–Carpenter number (KC) (e.g., Mendez and Losada (2004); Anderson and Smith (2014); Hu et al. (2014); Ozeren et al. (2014); van Veelen et al. (2020)). As Re and KC do not include vegetation rigidity (EI), these formulas are not applicable to other vegetation with different flexibilities. Alternatively, Luhar and Nepf (2016) proposed a technique that considers the effects of blade flexibility by using effective blade length (le), which is defined as the length of a rigid blade that dissipates the same wave energy as the flexible blade with the original length (l). The effective blade length is usually fitted as a function of the Cauchy number (Ca) and the ratio of the blade length to wave excursion (L) (Luhar and Nepf, 2016; Lei and Nepf, 2019). Zhu et al. (2023) demonstrated that the combination of CD–Re relation and effective plant height (EPH) can provide high accuracy in predicting wave attenuation in salt marshes. In the meantime, to avoid the uncertainties in using the formulas of bulk drag coefficient or effective blade length, Maza et al. (2022) developed a parameter, hydraulic standing biomass (HSB), to fit the wave damping coefficient, where HSB is defined as a function of the meadow mean height, standing biomass, and incident flow characteristics.
Unlike standing vegetation, flattened vegetation is composed of two parts: the vertical part and the horizontal part. The vertical part has no free end and the horizontal part is not clamped. Thus, the flattened vegetation cannot be simplified as a cantilever beam such that the CaL-based scaling law for effective blade length (Luhar and Nepf, 2016; Lei and Nepf, 2019) is not applicable to flattened vegetation because that CaL-based scaling law is derived from the static forcing balance between drag and blade stiffness by assuming the blade is a cantilever beam (Luhar and Nepf, 2016).
As it is challenging to define an effective blade length for flattened vegetation due to its complicated morphology, we developed a dimensionless wave attenuation indicator (WAI, -) to formulate βS and βF, inspired from Maza et al. (2019; 2021; 2022). The wave attenuation indicator is defined based on the characteristics of βS and βF with respect to HI0, h, and λ and given by
Note that the first two terms of the right hand side of equation (3) reflect wave attenuation in shallow water waves since the wave damping coefficient in shallow water waves is proportional to HI0l/h2 (Dalrymple et al., 1984; Zhu et al., 2021).Therefore, we add a term 1/tanh kh such that WAI can be used for a wider range of wave conditions. As WAI approaches 0, β should be 0. Thus, we use an exponential form β=aWAIb to generate empirical formulas for the wave damping coefficients for both standing and flattened vegetation. The sample size was 7.
The βS has the following relation with WAI,
with R2 = 0.789 and the p-value of 0.008 (Figure 4A). The relation between βF and WAI is
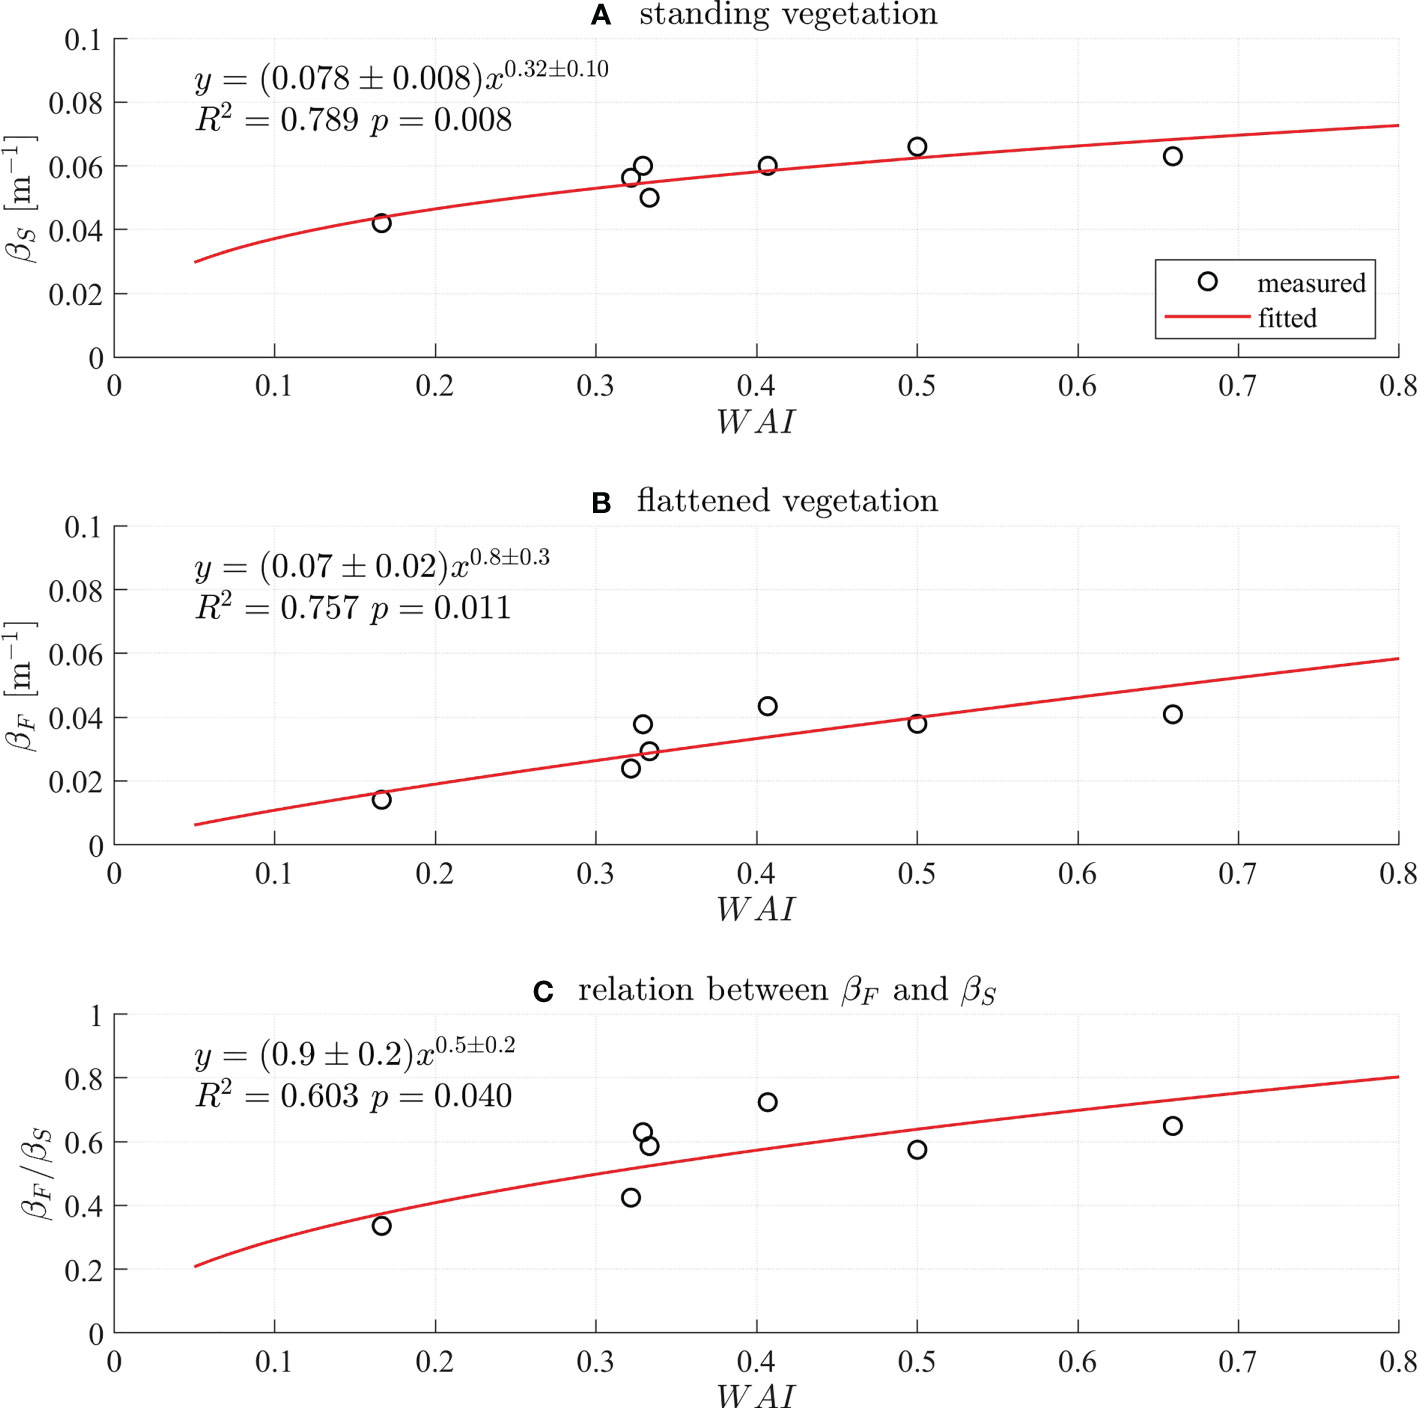
Figure 4 Empirical formulas for the wave damping coefficient of (A) standing vegetation (βS, m–1) and (B) flattened vegetation (βF, m–1) with respect to WAI defined in (3). (C) Relation between βF and βS as a function of WAI.
with R2 = 0.757 and the p-value of 0.011 (Figure 4B). The ratio βF/βS also shows a relation with WAI and given by
with R2 = 0.603 and the p-value of 0.04 (Figure 4C). The empirical formulas (4) and (5) provide a simple way to predict the wave attenuation by standing and flattened vegetation. The results are believed to be applicable to the vegetation species that have similar dynamics of the model vegetation.
3.3 Wave attenuation model for flattened vegetation
Most previous research focused on modeling wave attenuation by standing vegetation (e.g. Dalrymple et al., 1984; Kobayashi et al., 1993; Mendez and Losada, 2004; Zhu et al., 2020b; Zhu et al., 2022). Although there are some wave attenuation models for flattened vegetation (Vuik et al., 2018), or the horizontal part of mangrove roots (Suzuki et al., 2019), they assumed rigid vegetation without swaying in waves, and therefore are not applicable for flattened flexible vegetation. Due to the complicated physic processes induced by the blade sheltering and interaction from horizontal stems (Figure 2D), it is difficult to develop a new sophisticated wave attenuation model, particularly for flattened flexible vegetation. A simple technique to predict the wave attenuation by flattened vegetation is modifying an existing wave attenuation model for standing flexible vegetation by using a factor such as equation (6). To assess this idea, we selected the newest analytical wave attenuation model developed by Zhu et al. (2022) for standing flexible vegetation, which considered drag, inertia force, and the effects of higher-order blade motions. The inputs of Zhu et al. (2022) model included hydrodynamic parameters (water depth, wave height, wave period), plant properties (stem mass density, stem length, stem rigidity, stem cross-section dimensions, stem Young’s modulus, canopy density, and meadow length) and hydrodynamic coefficients. As the model vegetation is a flexible cylinder, the formulas for drag coefficient and added mass coefficient in Hu et al. (2021) were used is study. After obtaining the damping coefficient for standing vegetation (β_s), the damping coefficient for flattened vegetation is calculated from with βF/βS given by equation (6).
The fitted β by equation (4) and (5) compared with measured β and showed good agreement with normalized root mean square error (NRMSE) of 0.07 and 0.2 for standing and flattened vegetation, respectively (Figure 5A), where the normalization is based on the average of measured β. Additionally, the calculated β is compared with measured β in Figure 5B. For standing vegetation, the calculated damping coefficient from the model in Zhu et al. (2022) showed a small NRMSE of 0.31 (Figure 5B), which is larger than that of fitted β with NRMSE = 0.07 (Figure 5A). The calculated β overestimated by 16% (calculated from the slope of the linear fitting in Figure 5B). For flattened vegetation, the calculated β has a NRMSE of 0.46 (Figure 5B), which is larger than fitted β with NRMSE= 0.20 (Figure 5A). The calculated β for flattened vegetation is overestimated by 10% (Figure 5B). It should be noted that if the calculated β for standing vegetation is not overestimated with a slope of 1, the slope for the corresponding β for flattened vegetation would be 1.1*1/1.16 = 0.95, indicating that the β for flattened vegetation may be underestimated by 5%. This is also acceptable for engineering application, indicating the success of modifying the existing standing vegetation-based wave attenuation model for flattened vegetation.
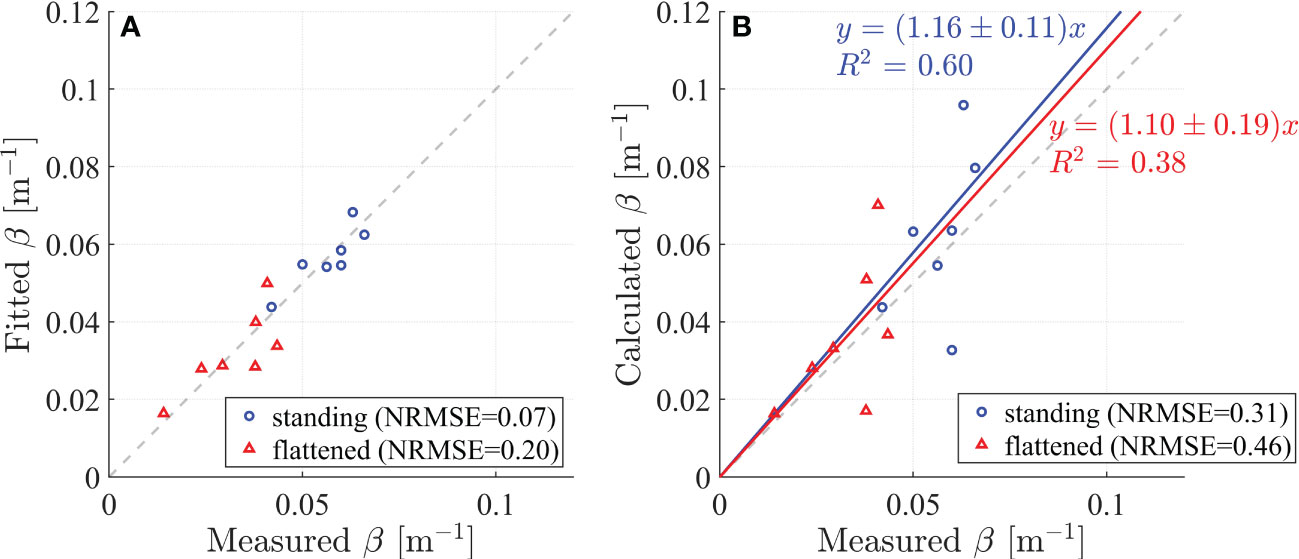
Figure 5 (A) Comparison between measured and fitted wave damping coefficients (β). (B) Comparison between measured and calculated β. The results for standing and flattened vegetation are denoted by blue circles and red triangles, respectively.
3.4 Case study under storm wave conditions
To explore the wave attenuation potential of flattened vegetation under extreme water depth and wave height during storms, a case study was performed based on the observed wave conditions in a storm at Nanhui shore, Shanghai. The wave conditions were measured from Sept. 10 to 17 in 2021. Two TWR-2050 (RBR cooperation, Canada) wave sensors were deployed at marsh edge (s1) and 35 m inside the vegetation (s2). The wave data at s1 was used in the present study. The storm closed to Shanghai with the shortest distance 116 km in East China Sea and wind speed up to 42 m/s, classified as Severe Typhoon. The peak wave period (Tp) ranged from 3 to 9 s. The maximum depth was 1.43 m and the significant wave height was up to 0.68 m (Li et al., 2022). The sample size was 104. The wave conditions of the experiments can cover part of storm conditions. The linear relation between water depth and wave height is
with R2 = 0.29 (Figure 6A). The linear relation between wavelength and wave height is
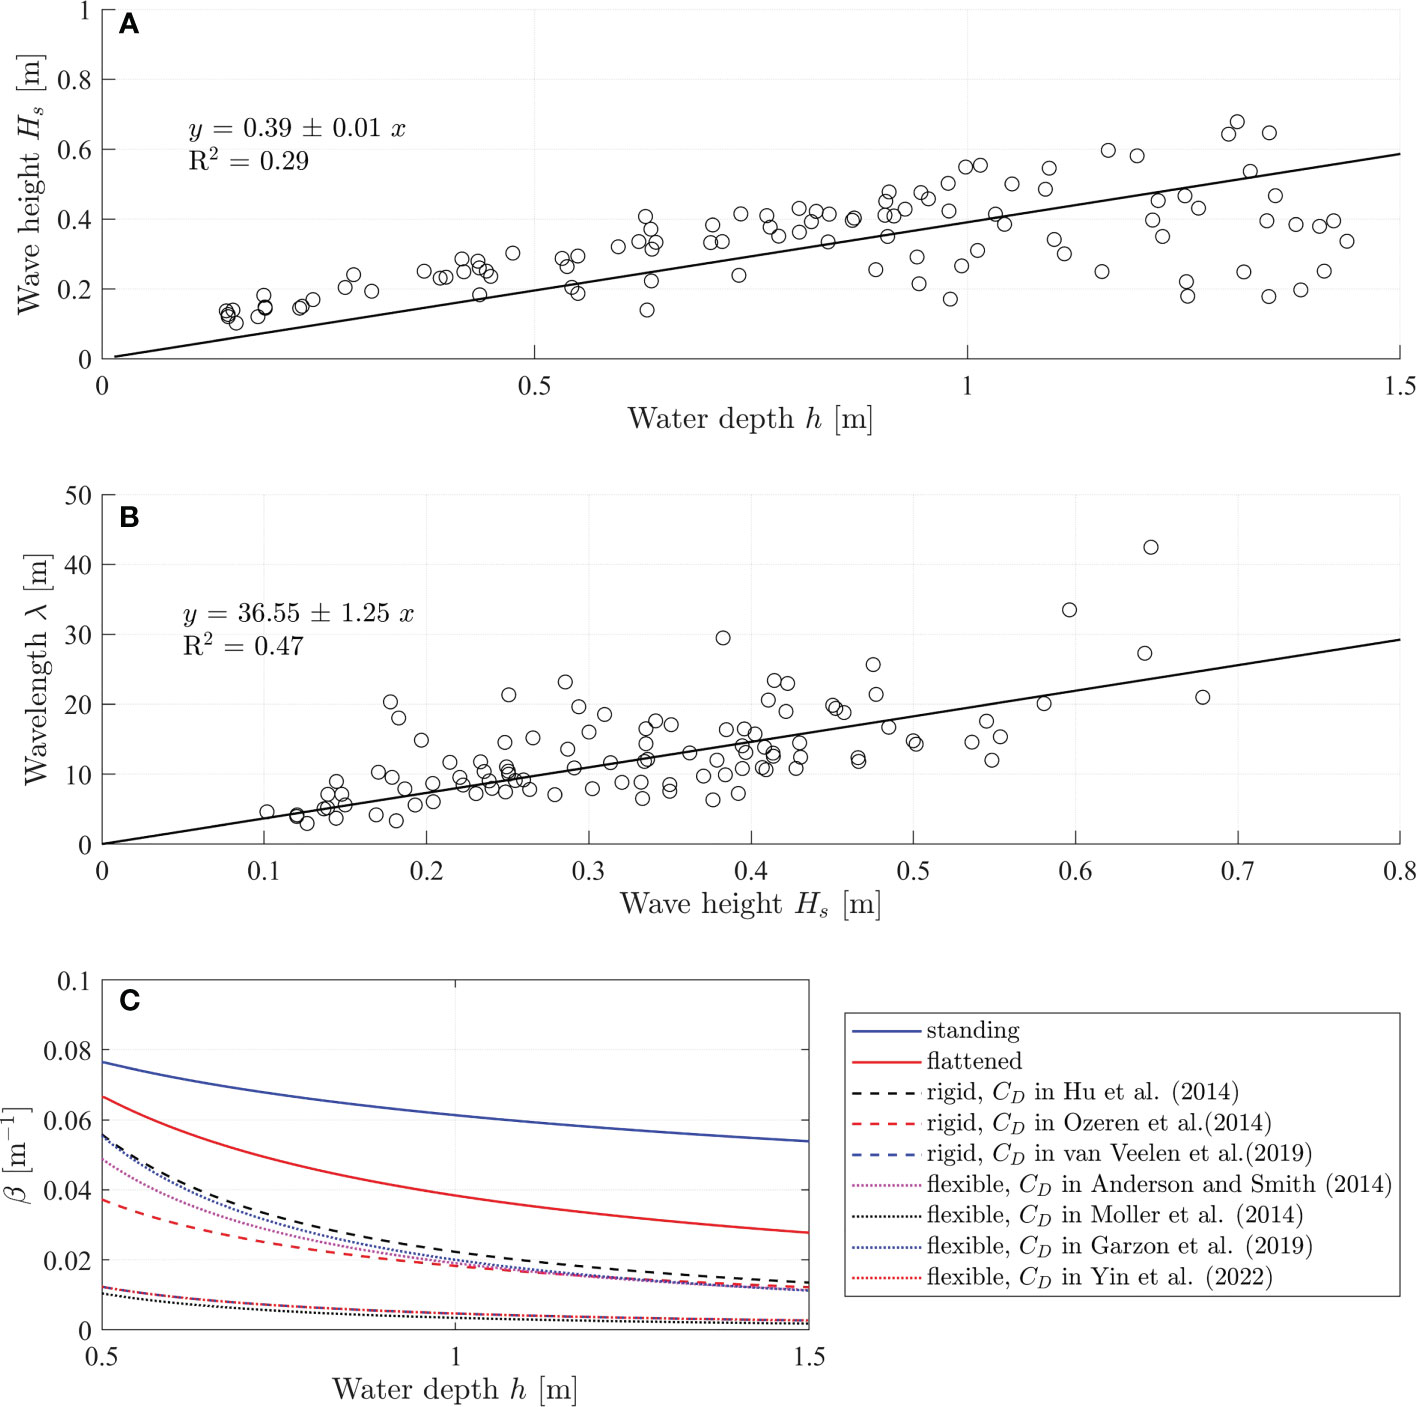
Figure 6 (A) Measured significant wave height (Hs) and water depth (h) during September 10 to 17 in 2021 at Nanhui shore (Li et al., 2022). (B) Relation between wave length and wave height. (C) Comparisons between the wave damping coefficient by fully standing vegetation (solid blue line), flattened vegetation (solid red line), and the 10 cm vertical unfolded part of the flattened vegetation (dashed and dotted lines). The (β) by standing vegetation and flattened vegetation were calculated based on the empirical formulas (4) and (5), respectively. The β by the 10 cm vertical unfolded part of the flattened vegetation was calculated by the formula (2) in Dalrymple et al. (1984) with the bulkdrag coefficient for rigid cylinder-type vegetation (dashed lines) and flexible cylinder-type vegetation (dotted lines).
with R2 = 0.75 (Figure 6B). In this preliminary case study, the vegetation are assumed to have the same properties as the model vegetation in the experiments, namely, the vegetation length is l = 50 cm and the flattened vegetation folds at 10 cm above bottom, the vegetation diameter is b = 1.8 mm, and the plant density is N = 1980 stems/m2. We assumed that we can use the modification factor for flattened vegetation in equation (6), that was derived for regular waves, for the irregular waves in the case study using H = Hs, and T = Tp. This seems to be a fair assumption as the significant wave height is the average of the highest of wave height in a short-term record that is linked to the mean wave transmission, and the modification βF/βS is a relative factor. The water depth is designed as 0.5 m to 1.5 m such that the vegetation is fully submerged. With a given water depth, the wave height and wavelength are calculated from equation 7 and 8, respectively. The wave damping coefficients for standing vegetation and flattened vegetation are calculated from the empirical formulas 4 and 5, respectively. The flattened vegetation is composed of two parts: the vertical unfolded part and the horizontal folded part. To further understand the wave attenuation by flattened vegetation, especially the contribution of the folded horizontal part, the wave damping coefficient by the vertical unfolded part (lv = 10 cm) is also calculated by using the equation (2). Equation (2) is sensitive to the bulk drag coefficient CD. We selected some representative formulas for cylinder-type vegetation from literature as shown in Table 4. The results were shown in Figure 6C.
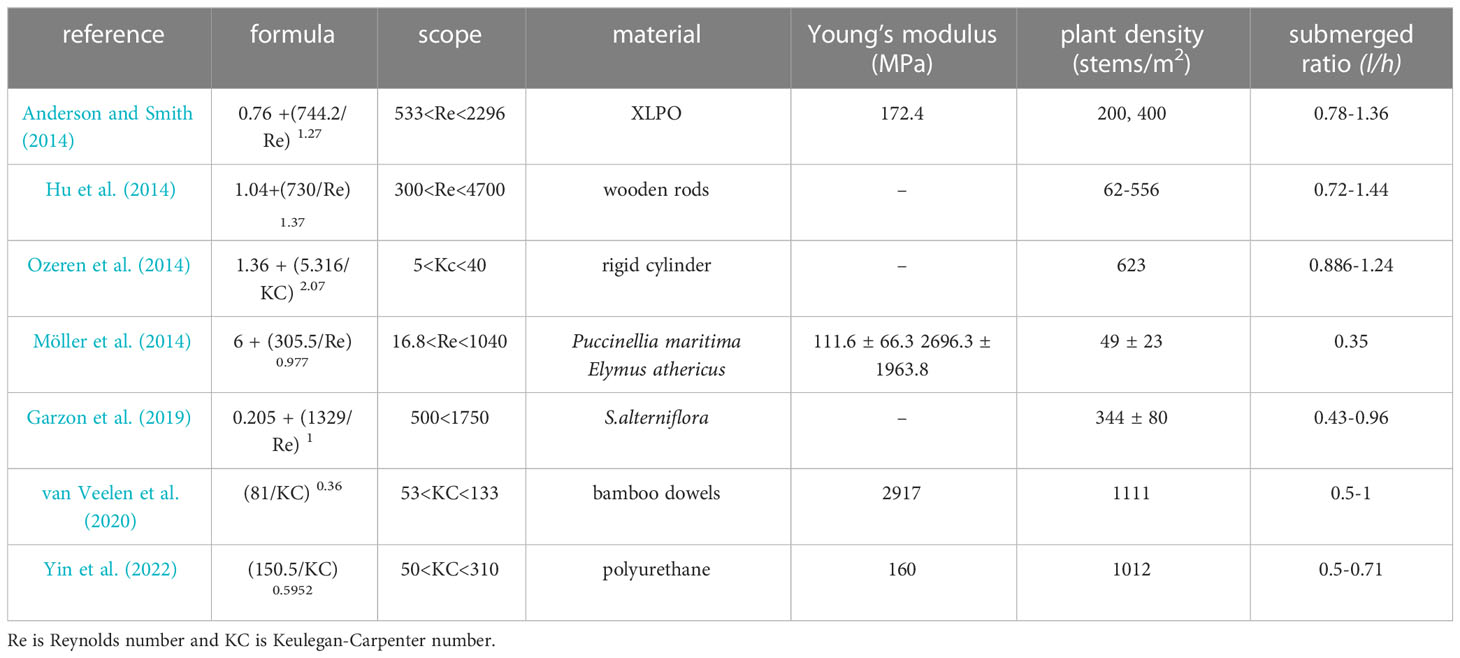
Table 4 Formulas of the bulk drag coefficient (CD) for the wave attenuation by standing cylinder-type vegetation.
Comparisons between the wave damping coefficient by fully standing vegetation (βS), flattened vegetation (βF), and the vertical unfolded part of the flattened vegetation (βV) under storm events are shown in Figure 6C. During the storm, the wave height and wavelength increase as the storm comes associated with increasing water depth (storm surge). With increasing water depth, all the wave damping coefficients βS, βF, and βV decrease indicating that the wave attenuation capacity decreases as the storm strengthens. The wave attenuation by flattened vegetation drops quicker as water depth increases. As expected, βS>βF>βV, indicating that standing vegetation provides the largest wave attenuation. As the vegetation breaks to be flattening, the wave attenuation decreases. However, the wave attenuation by flattened vegetation is larger than that by only the vertical part of the flattened vegetation, indicating that the horizontal part of the flattened vegetation also plays a significant role in wave attenuation and contributes to wave attenuation.
4 Discussion
Flattening of S. mariqueter is very common in winter due to its wilting and intensified storms and waves in winter. On one hand, the flattening stems construct a ‘shelter’ to prevent the resuspension of sediment and therefore enhance their ability to stabilize sediment. On the other hand, the flattening of S. mariqueter reduces its wave attenuation capacity remarkably and therefore increases the risk of sediment erosion and the vulnerability of sheltered species. The reduction of wave attenuation is more dramatic in high water levels such as high tides and storm surges since the wave attenuation indicator WAI is inversely proportional to h2 in equation (3). The reduction of wave attenuation also makes more stems behind the leading stems exposed to large wave conditions, which will affect the establishment and restoration of S. mariqueter (Schwarz et al., 2011; Zhao et al., 2021) and its ecological services. To improve the coastal ecosystem services, especially with flattened S. mariqueter, it is important to take measures to compensate for the reduction of wave attenuation, e.g., installing wooden defense (Van Cuong et al., 2015; Dao et al., 2018), bamboo fences (Dao et al., 2021; Mai Van et al., 2021), floating vegetation offshore (Zhu et al., 2020a),or other nature-based coastal structures on the offshore site.
As the vegetation flattening has shown significant effects on wave attenuation, it is essential to quantify the effects of vegetation flattening on wave attenuation for the restoration of S. mariqueter and coastal protection and management. The developed empirical formulas (4-6) as well as the modification of the existing standing vegetation-based wave attenuation model for flattened vegetation (Section 3) presented good performance to predict wave attenuation for tested model conditions, which can be applied in the restoration of S. mariqueter and coastal management. The formulas are also easy to implement into large-scale models such as SWAN (Booij et al., 1999), XBeach (Roelvink et al., 2009) and TOMAWAC (http://www.opentelemac.org/) to analyze the influences of flattening-induced reduction of wave attenuation on sediment transport, shoreline changes, and regional ecosystem services. In practice, the flattened vegetation maybe considered as bottom roughness and using a wave friction factor to describe the effects of vegetation on wave decay. But the formulas are developed with limited data, which limited its application to other conditions with different wave and vegetation parameters. The transform between the wave damping coefficient and wave friction factor is shown in Appendix B.
As a first step to quantify the wave attenuation by flattened flexible vegetation, this study focused on the ‘bulk’ wave attenuation under different wave conditions. To explore the detailed mechanisms for wave attenuation, it is essential to understand the motion and drag of flattened flexible vegetation, which is more challenging due to the vegetation interaction and sheltering since the flattened vegetation are overlapped (Figures 1B, 2D). Our next step is to investigate the drag of flattened flexible vegetation with different overlaps, which will be used to further analyze the effects of overlaps on vegetation sheltering and wave attenuation. In addition, the folding/breaking point determines the lengths of the erect part (dominated by normal drag) and flattened part (dominated by friction drag) and therefore influences the wave attenuation, which needs fully understanding. Due to technical limitations, we used circular cylinders to mimic S. mariqueter. Although dynamical similarities were considered, there may still be uncertainties. To solve the issues in flume experiments, future work will focus on field observations for real S. mariqueter. In the field, the percentage of flattened vegetation in a marsh decreases from seaward to landward, resulting mixing of flattened and standing vegetation, whose wave attenuation is also worth further studies.
5 Conclusion
In this study, the wave attenuation of flattened S. mariqueter was investigated using flume experiments with dynamically similar model vegetation. The results showed that the wave attenuation of flattened vegetation is smaller than that of standing vegetation. However, wave attenuation characteristics of flattened vegetation showed a similar pattern with standing vegetation: the wave damping coefficient (β) increased with wave height but decreased with water depth. Based on the wave attenuation characteristics, a wave attenuation indicator WAI was defined to generate empirical formulas for βS and βF as well as their ratio βF/βF. The empirical formulas were applied to modify the existing standing vegetation-based wave attenuation model for flattened vegetation and performed very well. A case study showed that the wave attenuation of both standing and flattened vegetation decreases when the storm approaches associated with increasing water depth by storm surge. The wave attenuation by flattened vegetation is larger than that by only the vertical part of the flattened vegetation, indicating that the horizontal folded stems also contribute significantly to the wave attenuation. Precisely quantifying the wave attenuation of flattened vegetation is essential for the restoration of S. mariqueter and coastal protection and management. Future work will focus on the field observation of wave attenuation by S. mariqueter under storm events.
Data availability statement
The original contributions presented in the study are included in the article/supplementary material. Further inquiries can be directed to the corresponding authors. The code is accessible through the link: https://github.com/lzhu7/waveAttenuationByFlexibleVegetation.
Author contributions
LZ, YM, and XL contributed to the conception and design of the study. CD supported flume experiments. YM conducted the flume experiments and data collection. YM, LX, WZ, TL, and SL collected field data. YM and LZ performed the data analysis and wrote the original draft of the manuscript. ZP, BH, TB, and XL provided scientific insights and edited the manuscript. LZ and XL directed and supervised the study. XL acquired funding. All authors contributed to the article and approved the submitted version.
Funding
This study was funded by the National Natural Science Foundation of China (42176164, 42141016). This paper is also supported by the project “Coping with deltas in transition” within the Programme of Strategic Scientific Alliances between China and The Netherlands (PSA). This study was also financed by the Chinese Ministry of Science and Technology (2016YFE0133700, 2022YFE0136700), Science and Technology Commission of Shanghai Municipality (22JC1400900), and Royal Netherlands Academy of Arts and Sciences (PSA-SA-E-02). The support was provided by China Scholarship Council (CSC) during the visit to NIOZ and TU Delft (No: 202106140131).
Acknowledgments
The authors would like to thank Yuxin Bi, Lin Su and Lv Gong for helping with field work. All the data are included in the paper.
Conflict of interest
The authors declare that the research was conducted in the absence of any commercial or financial relationships that could be construed as a potential conflict of interest.
Publisher’s note
All claims expressed in this article are solely those of the authors and do not necessarily represent those of their affiliated organizations, or those of the publisher, the editors and the reviewers. Any product that may be evaluated in this article, or claim that may be made by its manufacturer, is not guaranteed or endorsed by the publisher.
References
Anderson M. E., Smith J. M. (2014). Wave attenuation by flexible, idealized salt marsh vegetation. Coast. Eng. 83, 82–92. doi: 10.1016/j.coastaleng.2013.10.004
Barbier E. B., Hacker S. D., Kennedy C., Koch E. W., Stier A. C., Silliman B. R. (2011). The value of estuarine and coastal ecosystem services. Ecol. Monogr. 81, 169–193. doi: 10.1890/10-1510.1
Booij N., Ris R. C., Holthuijsen L. H. (1999). A third-generation wave model for coastal regions: 1. model description and validation. J. Geophys. Res.: Oceans 104, 7649–7666. doi: 10.1029/98JC02622
Bouma T. J., Vries M. B. D., Low E., Kusters L., Herman P. M. J., Tánczos I. C., et al. (2005). Flow hydrodynamics on a mudflat and in salt marsh vegetation: identifying general relationships for habitat characterisations. Hydrobiologia 540, 259–274. doi: 10.1007/s10750-004-7149-0
Chen Y., Li Y., Thompson C., Wang X., Cai T., Chang Y. (2018). Differential sediment trapping abilities of mangrove and saltmarsh vegetation in a subtropical estuary. Geomorphology 318, 270–282. doi: 10.1016/j.geomorph.2018.06.018
Chmura G. L., Anisfeld S. C., Cahoon D. R., Lynch J. C. (2003). Global carbon sequestration in tidal, saline wetland soils. Global Biogeochem. Cycles 17, 1111. doi: 10.1029/2002GB001917
Christie E. K., Spencer T., Owen D., McIvor A. L., Möller I., Viavattene C. (2018). Regional coastal flood risk assessment for a tidally dominant, natural coastal setting: North Norfolk, southern north Sea. Coast. Eng. 134, 177–190. doi: 10.1016/j.coastaleng.2017.05.003
Dalrymple R. A., Kirby J. T., Hwang P. A. (1984). Wave diffraction due to areas of energy dissipation. J. Waterway Port Coastal Ocean Eng. 110, 67–79. doi: 10.1061/(ASCE)0733-950X(1984)110:1(67
Dao H. T., Hofland B., Suzuki T., Stive M. J. F., Mai T., Tuan L. X. (2021). Numerical and small-scale physical modelling of wave transmission by wooden fences. J. Coast. Hydraulic Structures 1, 22. doi: 10.48438/jchs.2021.0004
Dao T., Stive M. J., Hofland B., Mai T. (2018). Wave damping due to wooden fences along mangrove coasts. J. Coast. Res. 34, 1317–1327. doi: 10.2112/JCOASTRES-D-18-00015.1
Dean R. G., Dalrymple R. A. (1991). Water wave mechanics for engineers and scientists (Singapore: World Scientific Publishing Company).
Garzon J. L., Maza M., Ferreira C. M., Lara J. L., Losada I. J. (2019). Wave attenuation by Spartina saltmarshes in the Chesapeake bay under storm surge conditions. J. Geophys. Res.: Oceans 124, 5220–5243. doi: 10.1029/2018JC014865
Ge F., Bo T., Zhou Y.-X., He Q., Qian W.-W. (2018). Analyzing the role of salt marshes on attenuating waves with Rb16-2050 mesearues in changjiang estuary. Resour. Environ. Yangtze Basin 27, 1784–1792. doi: 10.11870/cjlyzyyhj201808014
Henderson S. M. (2019). Motion of buoyant, flexible aquatic vegetation under waves: simple theoretical models and parameterization of wave dissipation. Coast. Eng. 152, 103497. doi: 10.1016/j.coastaleng.2019.04.009
Hu J., Mei C. C., Chang C.-W., Liu P. L. (2021). Effect of flexible coastal vegetation on waves in water of intermediate depth. Coast. Eng. 168, 103937. doi: 10.1016/j.coastaleng.2021.103937
Hu Z., Suzuki T., Zitman T., Uittewaal W., Stive M. (2014). Laboratory study on wave dissipation by vegetation in combined current–wave flow. Coast. Eng. 88, 131–142. doi: 10.1016/j.coastaleng.2014.02.009
Jadhav R. S., Chen Q., Smith J. M. (2013). Spectral distribution of wave energy dissipation by salt marsh vegetation. Coast. Eng. 77, 99–107. doi: 10.1016/j.coastaleng.2013.02.013
Kobayashi N., Raichle A. W., Asano T. (1993). Wave attenuation by vegetation. J. Waterway Port Coastal Ocean Eng. 119, 30–48. doi: 10.1061/(ASCE)0733-950X(1993)119:1(30)
Lei J., Nepf H. (2019). Wave damping by flexible vegetation: Connecting individual blade dynamics to the meadow scale. Coast. Eng. 147, 138–148. doi: 10.1016/j.coastaleng.2019.01.008
Li G.-r., Gong G.-N., Zhang S.-L., Gao M.-H., Zhang B.-L., Ma Y.-X., et al. (2022). Observation of physical variables of coastal wetland and response of wetland system under the influence of typhoon process. Haiyang Xuebao 45, 1–10. doi: 10.12284/hyxb2022-00
Liu B., Chen Y., Cai T., Li Y., Sun L. (2021). Estimating waves and currents at the saltmarsh edge using acoustic doppler velocimeter data. Front. Mar. Sci. 987. doi: 10.3389/fmars.2021.708116
Losada I. J., Maza M., Lara J. L. (2016). A new formulation for vegetation-induced damping under combined waves and currents. Coast. Eng. 107, 1–13. doi: 10.1016/j.coastaleng.2015.09.011
Luhar M., Nepf H. M. (2016). Wave-induced dynamics of flexible blades. J. Fluids Structures 61, 20–41. doi: 10.1016/j.jfluidstructs.2015.11.007
Madsen O. S., Poon Y.-K., Graber H. C. (1988). Spectral wave attenuation by bottom friction. Theory, 492–504. doi: 10.1061/9780872626874.035
Mai Van C., Ngo A., Mai T., Dao H. T. (2021). Bamboo fences as a nature-based measure for coastal wetland protection in Vietnam. Front. Mar. Sci. 8. doi: 10.3389/fmars.2021.756597
Maza M., Lara J. L., Losada I. J. (2019). Experimental analysis of wave attenuation and drag forces in a realistic fringe rhizophora mangrove forest. Adv. Water Resour. 131, 103376. doi: 10.1016/j.advwatres.2019.07.006
Maza M., Lara J. L., Losada I. J. (2021). Predicting the evolution of coastal protection service with mangrove forest age. Coast. Eng. 168, 103922. doi: 10.1016/j.coastaleng.2021.103922
Maza M., Lara J. L., Losada I. J. (2022). A paradigm shift in the quantification of wave energy attenuation due to saltmarshes based on their standing biomass. Sci. Rep. 12, 1–13. doi: 10.1038/s41598-022-18143-6
Maza M., Lara J., Losada I., Ondiviela B., Trinogga J., Bouma T. (2015). Large-Scale 3-d experiments of wave and current interaction with real vegetation. part 2: Experimental analysis. Coast. Eng. 106, 73–86. doi: 10.1016/j.coastaleng.2015.09.010
Mendez F. J., Losada I. J. (2004). An empirical model to estimate the propagation of random breaking and nonbreaking waves over vegetation fields. Coast. Eng. 51, 103–118. doi: 10.1016/j.coastaleng.2003.11.003
Möller I., Kudella M., Rupprecht F., Spencer T., Paul M., van Wesenbeeck B. K., et al. (2014). Wave attenuation over coastal salt marshes under storm surge conditions. Nat. Geosci. 7, 727–731. doi: 10.1038/ngeo2251
Ozeren Y., Wren D. G., Wu W. (2014). Experimental investigation of wave attenuation through model and live vegetation. J. Waterway Port Coastal Ocean Eng. 140, 04014019. doi: 10.1061/(ASCE)WW.1943-5460.0000251
Paul M., Rupprecht F., Möller I., Bouma T. J., Spencer T., Kudella M., et al. (2016). Plant stiffness and biomass as drivers for drag forces under extreme wave loading: A flume study on mimics. Coast. Eng. 117, 70–78. doi: 10.1016/j.coastaleng.2016.07.004
Roelvink D., Reniers A., van Dongeren A., van Thiel de Vries J., McCall R., Lescinski J. (2009). Modelling storm impacts on beaches, dunes and barrier islands. Coast. Eng. 56, 1133–1152. doi: 10.1016/j.coastaleng.2009.08.006
Schwarz C., Ysebaert T., Zhu Z., Zhang L., Bouma T. J., Herman P. M. J. (2011). Abiotic factors governing the establishment and expansion of two salt marsh plants in the Yangtze estuary, China. Wetlands 31, 1011–1021. doi: 10.1007/s13157-011-0212-5
Sousa A. I., Lillebø A. I., Pardal M. A., Caçador I. (2010). Productivity and nutrient cycling in salt marshes: Contribution to ecosystem health. Estuarine Coast. Shelf Sci. 87, 640–646. doi: 10.1016/j.ecss.2010.03.007
Suzuki T., Hu Z., Kumada K., Phan L. K., Zijlema M. (2019). Non-hydrostatic modeling of drag, inertia and porous effects in wave propagation over dense vegetation fields. Coast. Eng. 149, 49–64. doi: 10.1016/j.coastaleng.2019.03.011
Temmerman S., Meire P., Bouma T. J., Herman P. M. J., Ysebaert T., De Vriend H. J. (2013). Ecosystem-based coastal defence in the face of global change. Nature 504, 79–83. doi: 10.1038/nature12859
Tian B., Wu W., Yang Z., Zhou Y. (2016). Drivers, trends, and potential impacts of long-term coastal reclamation in china from 1985 to 2010. Estuarine Coast. Shelf Sci. 170, 83–90. doi: 10.1016/j.ecss.2016.01.006
Van Cuong C., Brown S., To H. H., Hockings M. (2015). Using melaleuca fences as soft coastal engineering for mangrove restoration in kien giang, Vietnam. Ecol. Eng. 81, 256–265. doi: 10.1016/j.ecoleng.2015.04.031
van Veelen T. J., Fairchild T. P., Reeve D. E., Karunarathna H. (2020). Experimental study on vegetation flexibility as control parameter for wave damping and velocity structure. Coast. Eng. 157, 103648. doi: 10.1016/j.coastaleng.2020.103648
Vuik V., Suh Heo H. Y., Zhu Z., Borsje B. W., Jonkman S. N. (2018). Stem breakage of salt marsh vegetation under wave forcing: A field and model study. Estuarine Coast. Shelf Sci. 200, 41–58. doi: 10.1016/j.ecss.2017.09.028
Xue L., Li X., Shi B., Yang B., Lin S., Yuan Y., et al. (2021). Pattern-regulated wave attenuation by salt marshes in the Yangtze estuary, China. Ocean Coast. Manage. 209, 105686. doi: 10.1016/j.ocecoaman.2021.105686
Yin K., Xu S., Gong S., Chen J., Wang Y., Li M. (2022). Modeling wave attenuation by submerged flexible vegetation with xbeach phase-averaged model. Ocean Eng. 257, 111646. doi: 10.1016/j.oceaneng.2022.111646
Ysebaert T., Yang S.-L., Zhang L., He Q., Bouma T. J., Herman P. M. J. (2011). Wave attenuation by two contrasting ecosystem engineering salt marsh macrophytes in the intertidal pioneer zone. Wetlands 31, 1043–1054. doi: 10.1007/s13157-011-0240-1
Yuan L., Liu D., Tian B., Yuan X., Bo S., Ma Q., et al. (2022). A solution for restoration of critical wetlands and waterbird habitats in coastal deltaic systems. J. Environ. Manage. 302. doi: 10.1016/j.jenvman.2021.113996
Zhao Y., Peng Z., He Q., Ma Y. (2023). Wave attenuation over combined salt marsh vegetation. Ocean Eng. 267. doi: 10.1016/j.oceaneng.2022.113234
Zhao Z., Zhang L., Li X., Yuan L., Bouma T. J. (2021). The onset of secondary seed dispersal is controlled by germination-features: A neglected process in sudden saltmarsh establishment. Limnol. Oceanogr. 66, 3070–3084. doi: 10.1002/lno.11860
Zhu L., Chen Q., Ding Y., Jafari N., Wang H., Johnson B. D. (2023). Towards a unified drag coefficient formula for quantifying wave energy reduction by salt marshes. Coast. Eng. 180, 104256. doi: 10.1016/j.coastaleng.2022.104256
Zhu L., Huguenard K., Fredriksson D. W., Lei J. (2022). Wave attenuation by flexible vegetation (and suspended kelp) with blade motion: Analytical solutions. Adv. Water Resour. 162, 104148. doi: 10.1016/j.advwatres.2022.104148
Zhu L., Huguenard K., Zou Q.-P., Fredriksson D. W., Xie D. (2020a). Aquaculture farms as nature-based coastal protection: Random wave attenuation by suspended and submerged canopies. Coast. Eng. 160, 103737. doi: 10.1016/j.coastaleng.2020.103737
Zhu L., Lei J., Huguenard K., Fredriksson D. W. (2021). Wave attenuation by suspended canopies with cultivated kelp (Saccharina latissima). Coast. Eng. 168, 103947. doi: 10.1016/j.coastaleng.2021.103947
Zhu Z., Yang Z., Bouma T. J. (2020c). Biomechanical properties of marsh vegetation in space and time: effects of salinity, inundation and seasonality. Ann. Bot. 125, 277–290. doi: 10.1093/aob/mcz063
Zhu Q., Yang S., Ma Y. (2014). Intra-tidal sedimentary processes associated with combined wave–current action on an exposed, erosional mudflat, southeastern Yangtze river delta, China. Mar. Geol. 347, 95–106. doi: 10.1016/j.margeo.2013.11.005
Zhu L., Zou Q.-P., Huguenard K., Fredriksson D. W. (2020b). Mechanisms for the asymmetric motion of submerged aquatic vegetation in waves: a consistent-mass cable model. J. Geophys. Res.: Oceans 125, e2019JC015517. doi: 10.1029/2019JC015517
Appendix A. Methods to fit the wave damping coefficient β with wave reflection
According to Dalrymple et al. (1984), the wave height decays as,
where H(x) is the local wave height at x m from the leading edge (Figure 2A), HI0 is the incident wave height at x = 0. β was expressed as, β=kDHI0, where kD is wave decay coefficient.
The wave reflection is less than 10% in this flume. Due to wave reflection, the wave height oscillated along the vegetation meadow (Figure A1). Assuming the reflected wave height decays at the same wave decay coefficient kD as the incident wave, the local wave height over the vegetation is expressed as Zhu et al. (2021),
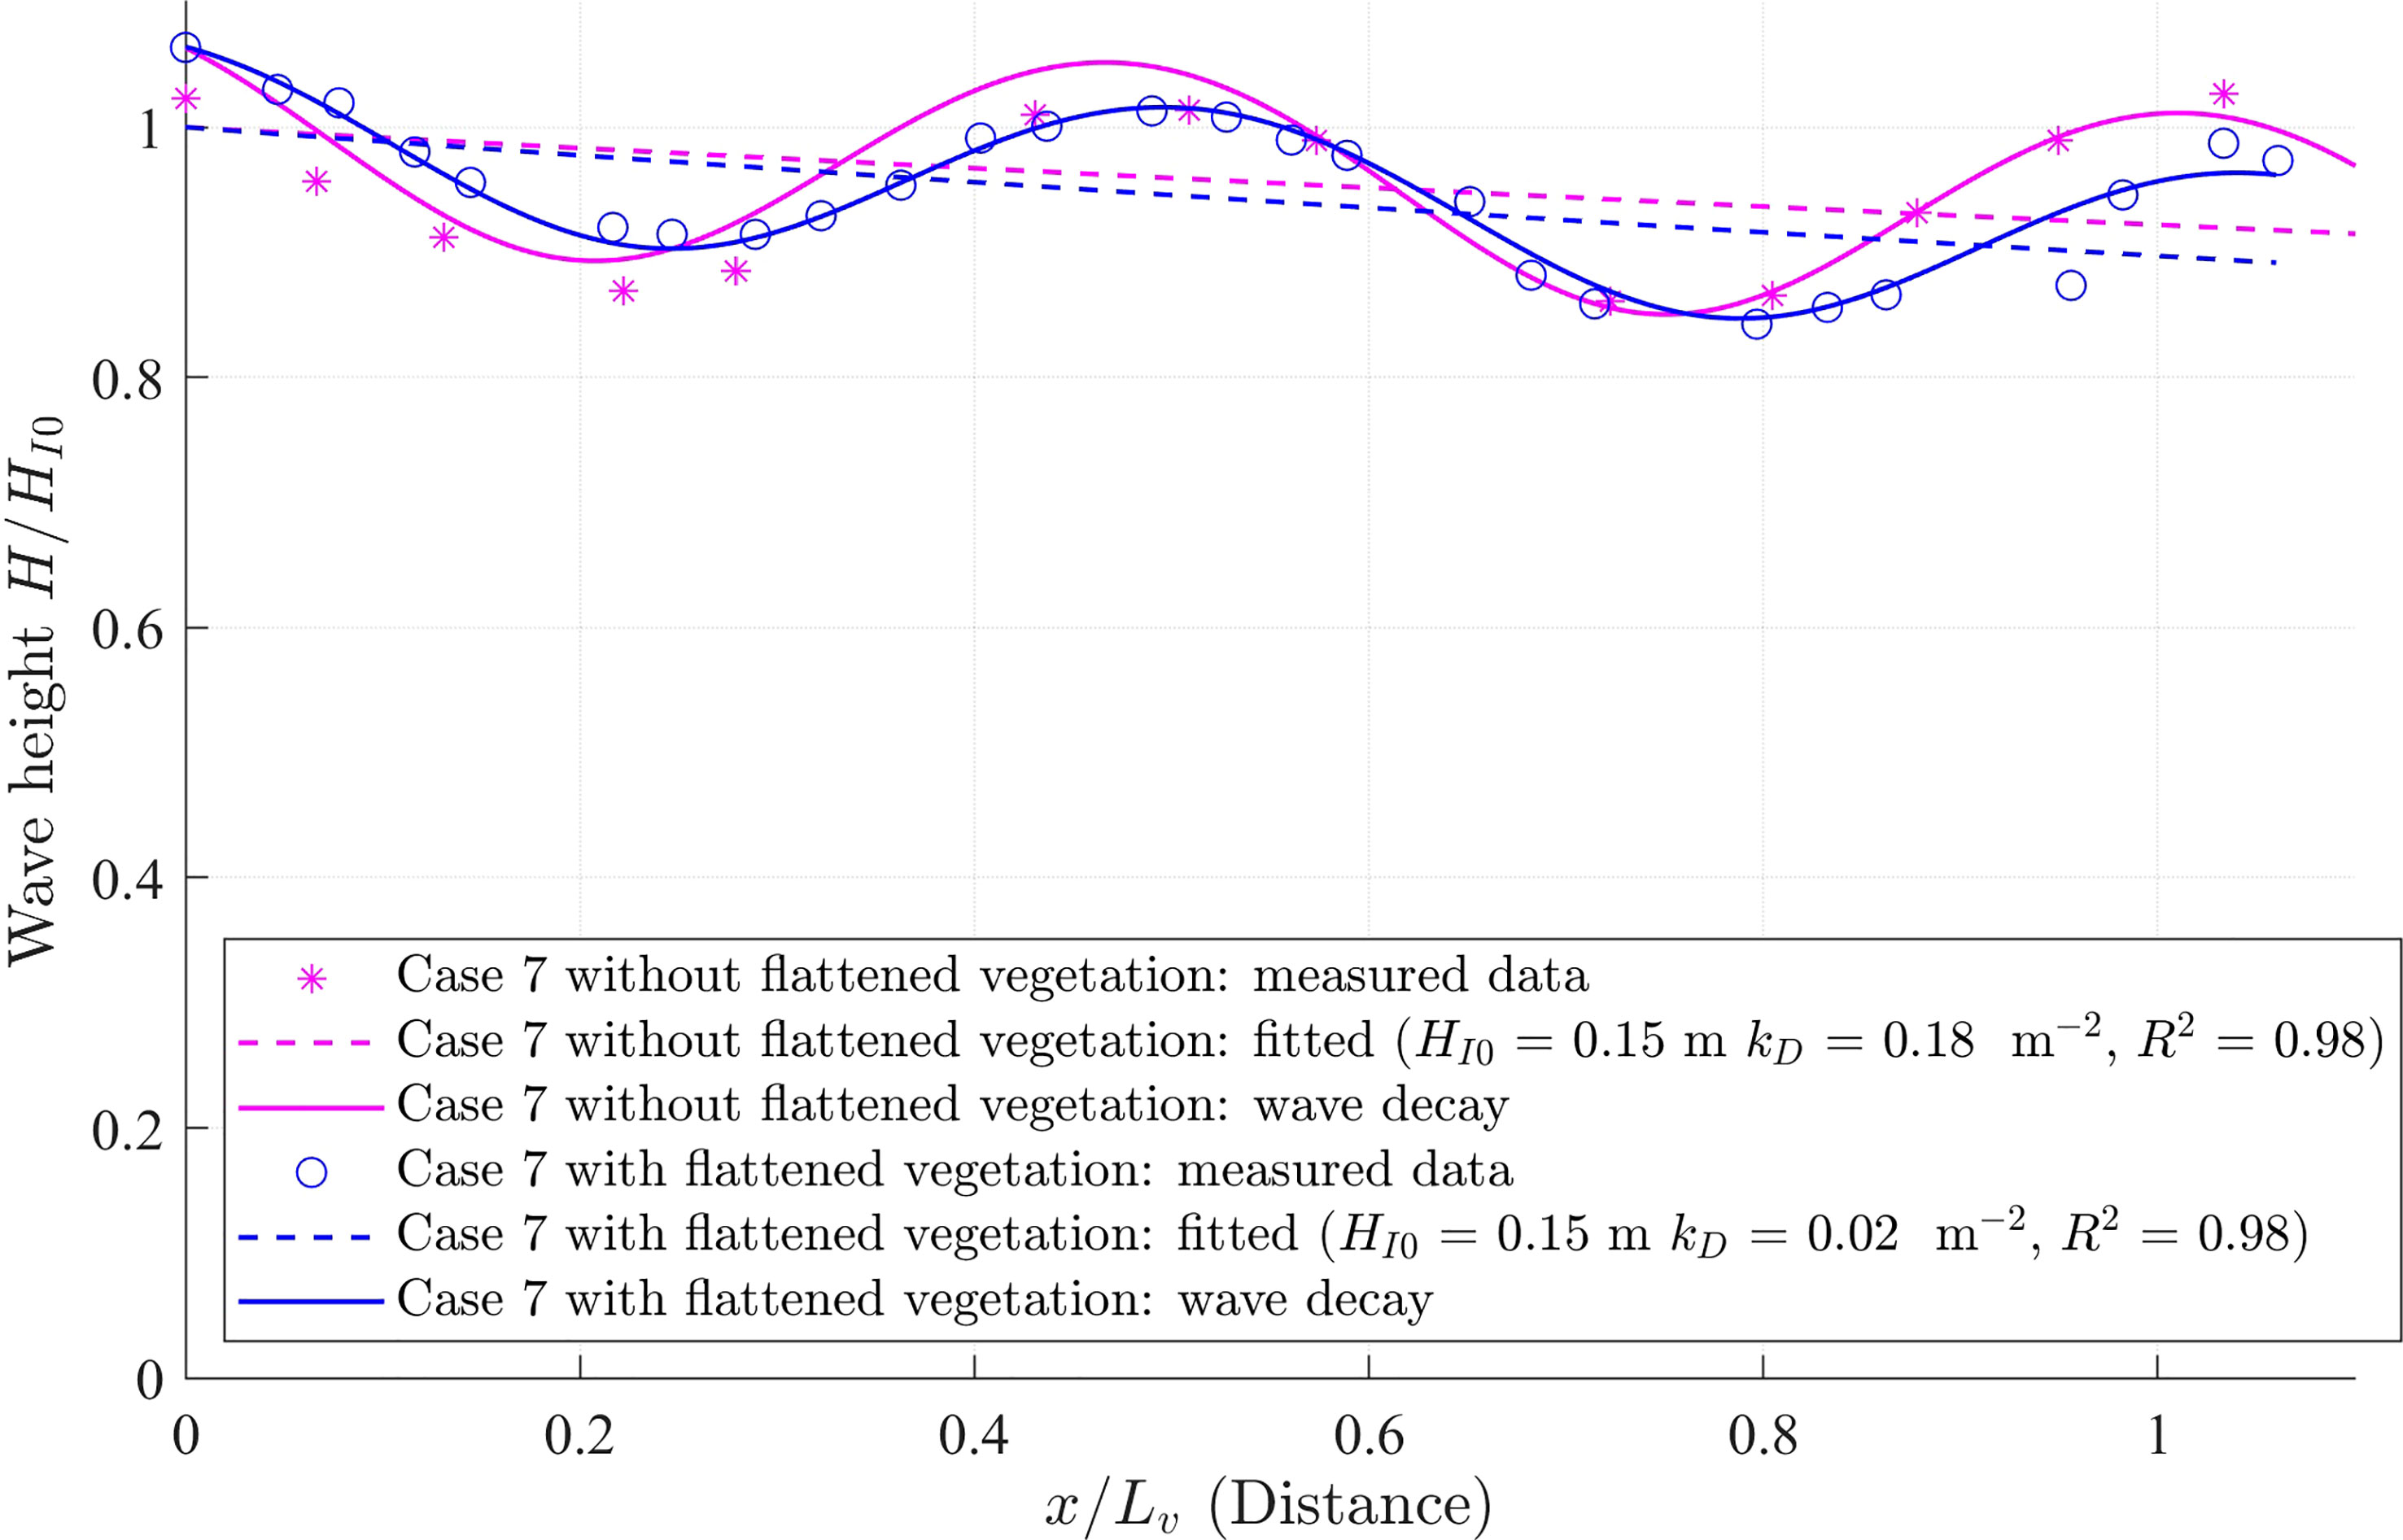
Figure A1 Measured (magenta asterisks for that without vegetation and blue circles for that with vegetation) and fitted (solid lines) wave heights (H) normalized by the incident wave height (HI0) along the vegetation regions for Case 7. The calculated incident wave height decay with fitted HI0 and kD is denoted by dashed lines. The magenta lines are for the case without vegetation while the blue lines are for the case with vegetation. The horizontal distance is normalized by the canopy length as x/Lv.
where is the reflective wave height by beach at the end of the flume, which induced fluctuation of wave height as shown in (Figure A1). Phase lag means phase lag of wave propagation. Thus, kD, and can be fitted from equation (A2) with given HI0 and H(x) along the meadow. In this study, the nonlinear regression model ‘fitnlm’ in MATLAB R2022a was used to fit these variables. To remove the effects of the bottom roughness and wall friction from the flume, the wave decay coefficient (kDW) from the empty flume under the same wave condition was subtracted from the measured wave decay coefficient (kDWV), such that the wave decay coefficient by only vegetation is
With fitted kD, the wave damping coefficient β can be obtained from
Appendix B. Wave friction factor (fw) due to vegetation
Under storm and large water depth, the vegetation was deeply submerged and serves strengthening the bottom roughness. According to Madsen et al. (1988), the bottom stress (τb) due to vegetation can be expressed as
where fw is wave friction factor and ub=0.5ω/sinh kh is the near-bottom maximum orbital velocity. Thus the wave height decay can be obtained from the energy equation
Solving equation B2 yields
with the wave damping coefficient (β) given by
Note that the factor 4 in the first term on the right side of equation (B4) is 1 in equation (18) in (Dalrymple et al., 1984) and equation (9.41) in Dean and Dalrymple (1991) because they defined the bottom stress as (equation 9.15 in Dean and Dalrymple (1991), which is of our definition (B1). Therefore, with given wave damping coefficient (β), the wave friction factor can be obtained by solving equation (B4), which yields
Keywords: Scirpus mariqueter, wave attenuation, flattened vegetation, wave attenuation indicator, flume experiment, natural coastal protection, empirical model
Citation: Ma Y, Zhu L, Peng Z, Xue L, Zhao W, Li T, Lin S, Bouma TJ, Hofland B, Dong C and Li X (2023) Wave attenuation by flattened vegetation (Scirpus mariqueter). Front. Mar. Sci. 10:1106070. doi: 10.3389/fmars.2023.1106070
Received: 23 November 2022; Accepted: 20 March 2023;
Published: 14 April 2023.
Edited by:
Dominic Reeve, Swansea University, United KingdomReviewed by:
Barbara Zanuttigh, University of Bologna, ItalyAna Genua-Olmedo, Rey Juan Carlos University, Spain
Qin Chen, Northeastern University, United States
Copyright © 2023 Ma, Zhu, Peng, Xue, Zhao, Li, Lin, Bouma, Hofland, Dong and Li. This is an open-access article distributed under the terms of the Creative Commons Attribution License (CC BY). The use, distribution or reproduction in other forums is permitted, provided the original author(s) and the copyright owner(s) are credited and that the original publication in this journal is cited, in accordance with accepted academic practice. No use, distribution or reproduction is permitted which does not comply with these terms.
*Correspondence: Longhuan Zhu, bHpodTdAbXR1LmVkdQ==; Xiuzhen Li, eHpsaUBza2xlYy5lY251LmVkdS5jbg==
 Yuxi Ma
 Longhuan Zhu
 Zhong Peng
 Liming Xue
 Wenzhen Zhao1
 Tianyou Li
 Tjeerd J. Bouma
 Bas Hofland
 Xiuzhen Li