 Sha Lou1,2*
 Xiaolan Chen1Shengyu Zhou1
 Gangfeng Ma3Shuguang Liu1,2
 Larisa Dorzhievna Radnaeva4
 Elena Nikitina4Irina Viktorovna Fedorova5
- 1Department of Hydraulic Engineering, Tongji University, Shanghai, China
- 2Key Laboratory of Yangtze River Water Environment, Ministry of Education, Tongji University, Shanghai, China
- 3Department of Civil and Environmental Engineering, Old Dominion University, Norfolk, VA, United States
- 4Laboratory of Chemistry of Natural Systems, Baikal Institute of Nature Management of Siberian Branch of the Russian Academy of Sciences, Ulan-Ude, Russia
- 5Institute of Earth Sciences, Saint Petersburg State University, St Petersburg, Russia
Sediment transport modeling for flows with cylinders is very challenging owing to the complicated flow–cylinder–sediment interactions, especially under the combined wave-current flows. In this paper, an improved formulation for incipient sediment suspension considering the effect of cylinder density (i.e., solid volume fraction) is employed to simulate the bottom sediment flux in the flow with cylinders. The proposed model is calibrated and validated using laboratory measurements under unidirectional and combined wave-current flows in previous studies. It is proved that the effects of cylinders on sediment suspension can be accounted for through a modified critical Shields number, and the proposed model is capable of simulating sediment suspension under both unidirectional and combined wave–current flows reasonably well with the average the coefficients of determination and model skills greater than 0.8 and 0.64.
1 Introduction
In estuarine and coastal areas, various types of flows involving cylinders exist. These cylinders, such as aquatic vegetation in wetlands (mangrove, reed, and seaweed/kelp), masts in aquafarm for laver or oysters, and piles foundations of offshore windfarms, can significantly affect flow structure (Nepf and Vivoni, 2000; Nepf, 2012; Lou et al., 2018), wave propagation (Moller et al., 1999; Mendez and Losada, 2004; Augustin et al., 2009), and turbulence development (Nepf, 1999; Ghisalberti and Nepf, 2002; Neumeier, 2007). The cylinders reduce mean flow and convert mean kinetic energy to turbulent kinetic energy (TKE), which have great influence on sediment suspension and transport (Balke et al., 2012; Ros et al., 2014). Furthermore, waves and currents usually coexist in coastal zones. Wave-current interactions play an important role in coastal ocean dynamics and nearshore sediment transport (Van Hoften and Karaki, 1976). With the presence of cylinders, sediment suspension under the combined wave-current flow become more complicated, which makes it more difficult to simulate sediment transport in flow with cylinders.
Field observations indicated that the presence of cylinders reduced resuspension and promoted particle retention, for example, studies in Lake Hiidenvesi (Horppila and Nurminen, 2003) and Lake Taihu (Zhu et al., 2015). On the other hand, laboratory studies provided contrary results and showed that sediment resuspension was enhanced in the flows with cylinders comparing to bare bed condition (Tinoco and Coco, 2016; Tinoco and Coco, 2018; Lou et al., 2022). These contrasting findings reflected the influence of cylinders on the flow at two scales: array- and stem- scales (Zhang and Nepf, 2019). In the field, the expanse of cylinders (e.g. the length of region covered by vegetation in wetlands in the order of hundred meters) can lead to the damping of flow and sediment resuspension in the array-scale. In the laboratory, the cylinders enhance sediment resuspension due to stem-generated turbulence. It is found out that cylinder density significantly affects the incipient motion of the sediment (Tinoco and Coco, 2016; Tinoco and Coco, 2018; Tang et al., 2019; Yang and Nepf, 2019). Although the flow velocity is significantly damped with dense cylinders, the amount of sediment lifted into suspension increases owing to the increasing turbulent kinetic energy under unidirectional currents (Tinoco and Coco, 2016; Yang and Nepf, 2019) and oscillatory flows (Ros et al., 2014; Tang et al., 2019). The incipient velocity of sediment motion decreases within cylinder canopy (Tang et al., 2013; Yang et al., 2016; Tinoco and Coco, 2018).
Although field investigations and experimental studies provide a certain basis for the establishment of numerical models, sediment transport modeling for flows with cylinders is more challenging owing to complicated flow–cylinder–sediment interactions. Sediment suspension determined by the bottom sediment flux was related to the turbulent flow structure altered by cylinders. Lopez and Garcia (1998) established a two-equation turbulence model to determine the mean flow and turbulence structure of open channels through cylinders and used this model to estimate sediment transport processes, assuming that the average sediment deposition near the bed and the entrainment rate were in equilibrium. A three-dimensional turbulence model was proposed by Liu and Shen (2008) by introducing cylinder density and drag force into the control equations of flow in the presence of cylinders, and an empirical relation proposed by Van Rijn (1984) was employed to solve the sediment transport equations in flow affected by the cylinders. With an enhanced Manning’s roughness coefficient and cylinder-induced drag force representing the effect of the cylinders on flow, sediment flux was computed with the formula of Van Rijn (1993), disregarding the effect of the cylinders on sediment suspension (Hu et al., 2018). The equilibrium sediment transport rates by Wu’s formula (Wu and Wang, 2007) were used for bed load, and the suspended sediment flux was modeled by bed shear stress estimated from mean flow velocity with the cylinder effects implemented by additional terms of the cylinder drag and water volume reduction caused by the cylinders (He et al., 2017). A similar method was used in a sediment transport model established by Ma et al. (2013), in which the sediment flux was computed by bed shear stress estimated from mean flow velocity with cylinder effects implemented by additional terms of the cylinder drag. However, in flow with cylinders, the generation of turbulence in the wakes of cylinders exceeds that associated with bed shear, such that the previously used bare bed sediment transport models based on bed shear stress need to be improved to better describe sediment suspension affected by cylinders.
In our previous work (Lou et al., 2021), a vegetated flow and sediment transport model was developed for investigating flow–cylinder(vegetation)–sediment interactions. In the model, the vegetation-induced turbulence was simulated by an improved k-ϵ turbulence closure, in which shear and stem-scale wake turbulent kinetic energies were solved separately due to the different length scales of turbulence in vegetated flow. It simulated both unidirectional and oscillatory flows as well as turbulence structures reasonably well. However, one of the disadvantages of the model was that it included more coefficients for calibration compared to traditional k-ϵ turbulence closure, which introduced uncertainties to model results and restrained its applications.
In this paper, we propose a modified critical Shields number to account for the effects of cylinders on bottom sediment suspension, which will be implemented into the Non-Hydrostatic WAVE (NHWAVE) model (Ma et al., 2012). Purpose of the proposed model is to simplify the numerical simulation of sediment transport in flow with cylinders. With fewer parameters, the sediment initiation can be identified and simulated, which aims to simplify the numerical simulation of sediment transport in flow with cylinders, especially for the combined wave-current flow. In the proposed model, the modified critical Shields number affected by cylinders is determined by the cylinder features (solid volume fraction of cylinders ϕ and the cylinder induced-drag coefficient) and the bottom drag coefficient, and the traditional k-ϵ turbulence closure with a cylinder-induced turbulence production term including both shear and stem-scale turbulence is adopted. The model will be validated by using the experimental measurements collected in a wave-current flume at Tongji University in our previous study (Chen et al., 2020; Lou et al., 2022) and a dataset presented by Lu (2008). The performance of the model will be evaluated by computing the model skill (MS), the determination coefficient (R2) and the Root Mean Square Error (RMSE). Effects of cylinder densities on sediment suspension will be analyzed and the interactions between flow–cylinder–sediment will be examined. The main purpose of this paper is to study sediment suspension mechanisms affected by cylinders under both unidirectional and the combined wave-current flows, and to estimate the accuracy of mathematical descriptions of the bottom sediment flux considering the effects of cylinders on sediment suspension threshold condition.
2 Model formulations
The hydrodynamic and sediment transport model in this study is based on the Non-Hydrostatic WAVE (NHWAVE) model, which was originally developed by Ma et al. (2012). It has been well validated and widely applied to study coastal wave processes, including wave/flow–cylinder–sediment interactions (Ma et al., 2013; Ma et al., 2015; Wu et al., 2016).
2.1 NHWAVE model
The vegetation module in NHWAVE is based on the Volume-averaged and Reynolds-averaged Navier-Stokes equations. The effects of the cylinders on the mean flow were modeled by drag forces in the momentum equations. This treatment has been proven successful in simulating turbulent structures in vegetated flows by other modeling efforts (Sheng et al., 2012; Wu et al., 2016). The governing equations, numerical schemes, and boundary conditions were introduced in Ma et al., 2013; Ma et al. (2012). The drag force is given by
where CD is the cylinder drag coefficient, a is the frontal area of cylinders per unit volume, u is the velocity vector.
A nonlinear k–ϵ turbulence model was implemented in the NHWAVE model to simulate turbulent flows. According to Nepf (1999), the large-scale mean kinetic energy is converted to small-scale turbulent kinetic energy in flows with cylinders, and turbulent diffusivity is reduced owing to a downward shift in turbulent-length scale. In the NHWAVE model, these processes were modeled by introducing a cylinder-induced turbulence production term, Pv, in the k–ϵ equations (Ma et al., 2012; Ma et al., 2013). The modified k–ϵ equations are written as
where k is the turbulence kinetic energy; ϵ is the energy dissipation; D is the total water depth; Ps and Pb are shear and buoyancy productions, respectively; υt is the turbulent eddy viscosity and υ is the kinematic water viscosity; σk(=1.0), σϵ(=1.3), C1ϵ(=1.44), C2ϵ(=1.92), and Cμ(=0.09) are empirical coefficients (Rodi, 1987); the coefficient C3ϵ is selected as zero for a stably stratified water column (Snyder and Hsu, 2011); Cfk(=1.0) and Cfϵ(=1.33) are drag-related coefficients based on Lopez and Garcia (1998).
2.2 Sediment transport model
To study sediment dynamics in flows with cylinders, suspended sediment concentration was computed from the advection–diffusion equation formulated in σ coordinates in the NHWAVE model (Ma et al., 2015).
where C is the suspended sediment concentration; ωs is the sediment settling velocity; σh and σv are the horizontal and vertical Schmidt numbers of the sediment, respectively. To solve the sediment transport equation, a no-flux boundary condition was employed at the free surface.
At the bottom, the mass exchange of the suspended sediment was considered by the erosion and deposition fluxes:
where E and D are sediment fluxes for erosion and deposition, respectively.
For non-cohesive sediments, a pickup function (Van Rijn, 1984) is typically used to simulate the fluxes, expressed as
where D50 is the median grain size, ρs is the sediment density, ρ is the water density, ψ is the Shields number given by
where is the bottom shear stress, ψc is the critical Shields number for incipient sediment motion.
For the combined wave–current flow, the bottom shear stress is expressed as , calculated using Eq. (11) considering the nonlinear interactions between waves and currents (Soulsby, 1995; Soulsby, 1997).
where fw is the wave friction coefficient, fw=1.39(A/z0)-0.52, in which , , T is the wave period, and Uw is the velocity at the wave boundary layer. is the bottom shear stress under the unidirectional flow, calculated by
where cd is the bottom friction coefficient, and Uc is the mean velocity near the bottom. is the bottom shear stress under a pure wave condition, computed as
In a flow without cylinders, the critical Shields number, ψc, is considered to be a constant which is related to the sediment characteristics, which can be calculated by
with the dimensionless viscosity .
However, it has been reported that the incipient velocity decreases under both unidirectional flows and wave conditions affected by cylinders (Tang et al., 2013; Ros et al., 2014; Tang et al., 2019). The turbulence, instead of mean flow, determines sediment resuspension through arrays of rigid vegetation (Tinoco and Coco, 2016; Yang et al., 2016; Tinoco and Coco, 2018). Hence, the sediment transport models based on bed shear stress developed for bare bed do not work well for flows with cylinders.
Based on experimental measurements, Tinoco and Coco (2016) proposed a function to estimate the critical Shields number for unidirectional flow with cylinders (Eq. 15), which was modified for wave conditions (Eq. 16) in Tinoco and Coco (2018) based on the study in Yang et al. (2016). These functions were obtained under the conditions of vegetation solid volume fraction Φ=0.008-0.079, and stem Reynolds number Red=200-20000 for unidirectional flow, and wave period T=2.5s, wave height H=0.01–0.10m under wave conditions.
where ψc,0 is the critical Shields number in the flows without cylinders, ψc,ϕ is the modified critical Shields number affected by cylinders, and ϕ is the solid volume fraction of cylinders.
Ratios of obstructed to unobstructed critical Shields values in the flows with cylinders using Eq. 15 and Eq. 16 are displayed in Figure 1. It is shown that the values of ψc,ϕ/ψc,0 are approximately the same when the solid volume fraction ϕ is smaller than 0.03.
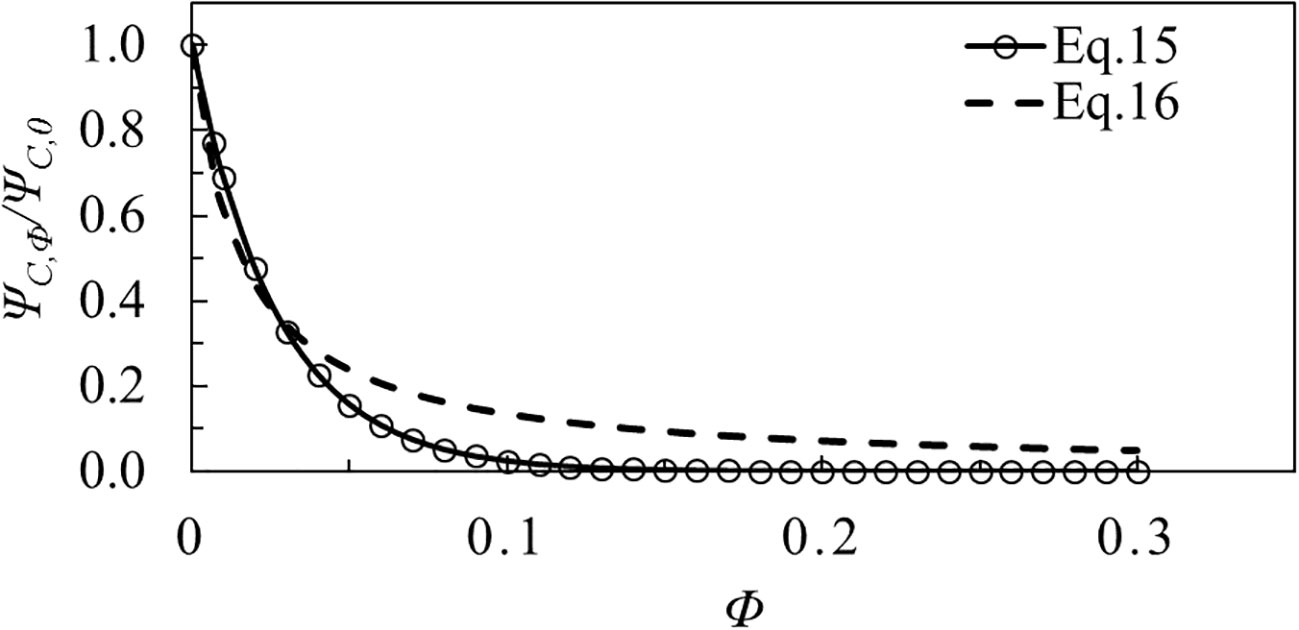
Figure 1 Ratios of obstructed to unobstructed critical Shields values in the flow with cylinders.
To demonstrate the effects of cylinders on sediment suspension, numerical simulations were also carried out using the traditional critical Shield number without cylinders (Eq. 14). The predicted suspended sediment concentrations from the improved model (Eq. 15 and 16) and the traditional model (Eq. 14) under both unidirectional and combined wave–current flows were compared.
2.3 Assessment of model performance
The developed model was validated using the experimental measurements, and the model performance was assessed by calculating the model skill (MS), the coefficient of determination (R2) and the Root Mean Square Error (RMSE). The model skill (Wilmott, 1981) describes the degree to which the measured deviations about the measured mean correspond to the simulated deviations about the measured mean, as shown in Eq. 17. Perfect agreement between the model results and measurements yields MS of 1.0 whereas complete disagreement yields MS of 0.
where XS and XM are simulated and measured variables being compared, is its sample mean, I is the number of the data.
The coefficient of determination (R2) is a number that indicates how well the data fit a statistical model (Gao et al., 2018). The coefficient of determination for a linear regression model with one independent variable is given by
where σxs is the standard deviation of XS, and σXM is the standard deviation of XM. A R2 of 1 indicates that the regression line perfectly fits the data, while a R2 of 0 indicates that the line does not fit the data at all.
The root mean square error (RMSE), which is a typical metric for measuring the differences between samples and estimators, was also calculated as an additional assessment for the vertically varying density case.
3 Model calibration and validation
To evaluate the performance of NHWAVE with the improved sediment transport model, a number of experimental datasets were chosen for model calibration and validation. Experiments in our previous studies (Chen et al., 2020; Lou et al., 2022) were adopted to calibrate the model, including conditions of unidirectional flow (Test 1) and combined wave-current flows (Test 2-4). Another dataset collected in the experiments of sediment suspension under directional flow affected by rigid submerged cylinders (Lu, 2008) was used to further validate the model, which has also been applied to validate the model in Li et al. (2020). The hydraulic conditions and characteristics of cylinders in these experiments were listed in Tables 1–3. The cylinders were arrayed regularly in the experiments.
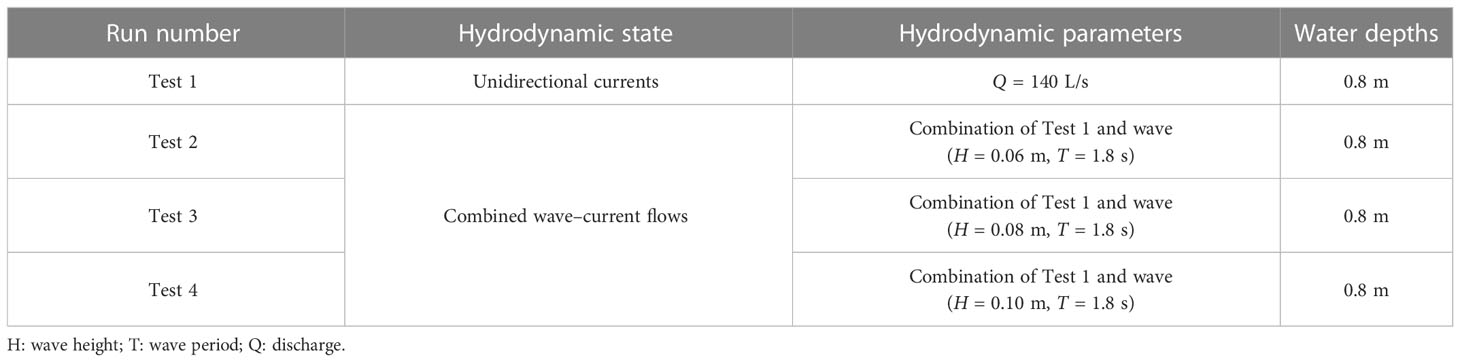
Table 1 Hydrodynamic conditions in experiments conducted by Chen et al. (2020) and Lou et al. (2022) .
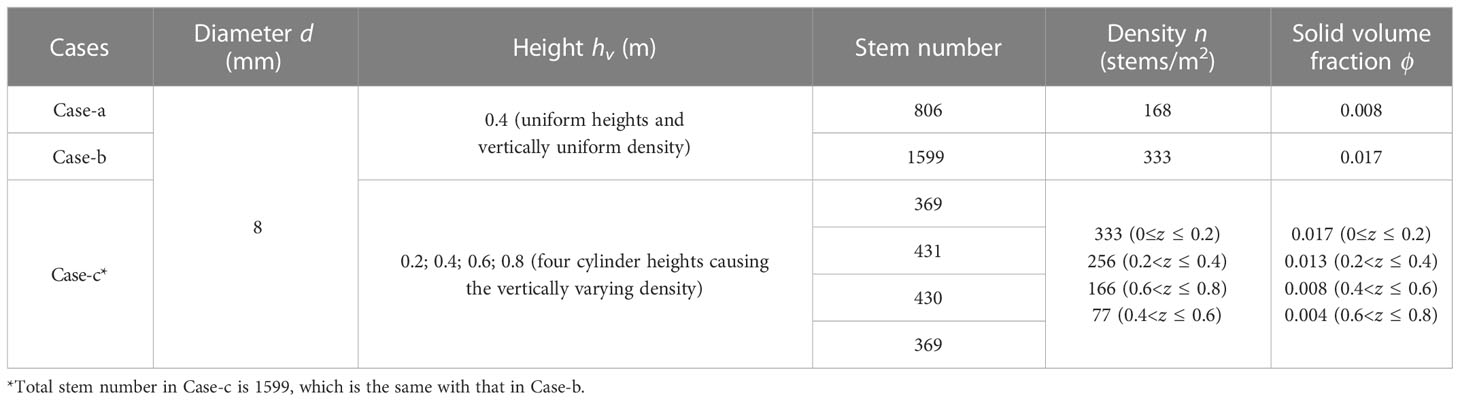
Table 2 Cylinder configurations in experiments conducted by Chen et al. (2020) and Lou et al. (2022).
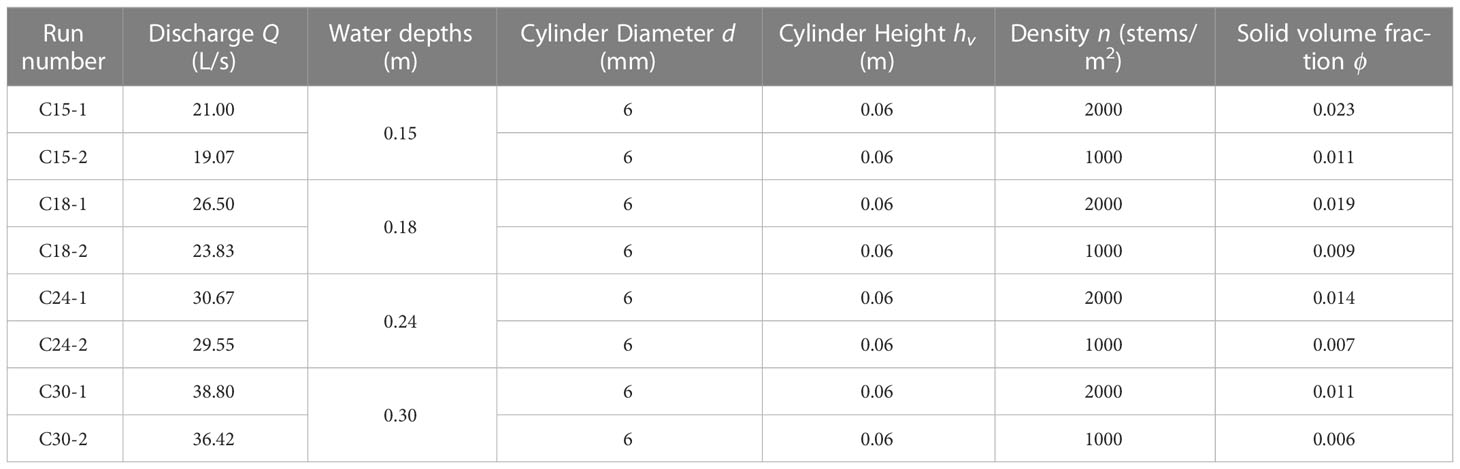
Table 3 Hydrodynamic conditions and cylinder configurations in experiments conducted by Lu (2008).
To reproduce the vegetated flow in the experiments, the computational domain was discretized by 64 cells in the streamwise direction with intervals of 0.1 m and 50 vertical layers. Periodic boundary conditions were imposed at the streamwise boundaries (Ma et al., 2013). The flow was driven by an external pressure gradient determined by the flow condition in the laboratory. The time step was adjusted during the simulation based on the stability restriction. Cylinder-induced bulk drag coefficient CD is a key parameter for the simulation of flows with cylinders, which is also the main parameter of model calibration. According to laboratory studies, the value of CD increases with cylinder density and decreases with the increasing stem Reynolds number (Tinoco and Cowen, 2013; Ni, 2014; Lou et al., 2018; Yang and Nepf, 2019), In this study, empirical equations proposed by Tanino and Nepf (2008); Sonnenwald et al. (2019) and Ghisalberti and Nepf (2004) were adopted to estimate this coefficient.
3.1 Calibrations
Datasets in experiments in our previous studies (Chen et al., 2020; Lou et al., 2022) were adopted to calibrate the model, including conditions of unidirectional flow (Test 1) and combined wave-current flows (Test 2-4).
In these simulations, the range of CD was calculated as 0.3–1.5 using the empirical equations (Ghisalberti and Nepf, 2004; Tanino and Nepf, 2008; Sonnenwald et al., 2019). For sediment simulations, the median grain size of 0.16 mm was used, and the settling velocity ωs was selected as 0.002 m/s computed by the equation of Soulsby (1997). The critical Shields parameter was taken as 0.03 for flows without cylinders, calculated using the equation in Guo (2002). The modified critical Shields parameters for flows with cylinders were calculated using Eqs. 15 and 16, and the values of 0.02, 0.0145, and 0.02–0.026 were obtained for the sparse (Case-a with uniform cylinder height), dense (Case-b with uniform cylinder height), and vertically varying cylinder density (Case-c with different cylinder heights) cases.
3.1.1 Unidirectional flow (Test 1)
The measured mean flow, TKE, and suspended sediment concentration under a unidirectional flow (Test 1) were adopted to validate the established model. Figure 2 shows the comparisons of measured and simulated mean flow velocities affected by cylinders. The data were measured within cylinders by Chen et al. (2020). The simulated results generally agreed with the measurements. The results showed better agreements in Cases-a and b with vertically uniform cylinder density (uniform cylinder heights), with both the model skills and R2 values larger than 0.95. The simulated mean velocity in Case-a was greater than that in Case-b, in accordance with the measurements. The computed mean velocity in Case-c was relatively lower than the measurement, indicating that the cylinder-induced drag force was larger in the simulation than that in the measurements. In Case-c, the average model skills and R2 values were relatively low with the values smaller than 0.5, while the average RMSE value as an additional assessment was 0.06, which indicated acceptable model accuracy. The simulated results of mean velocities proved that the gradient of mean velocity was much smaller in Case-c with vertically varying cylinder density than that in case with uniform density.
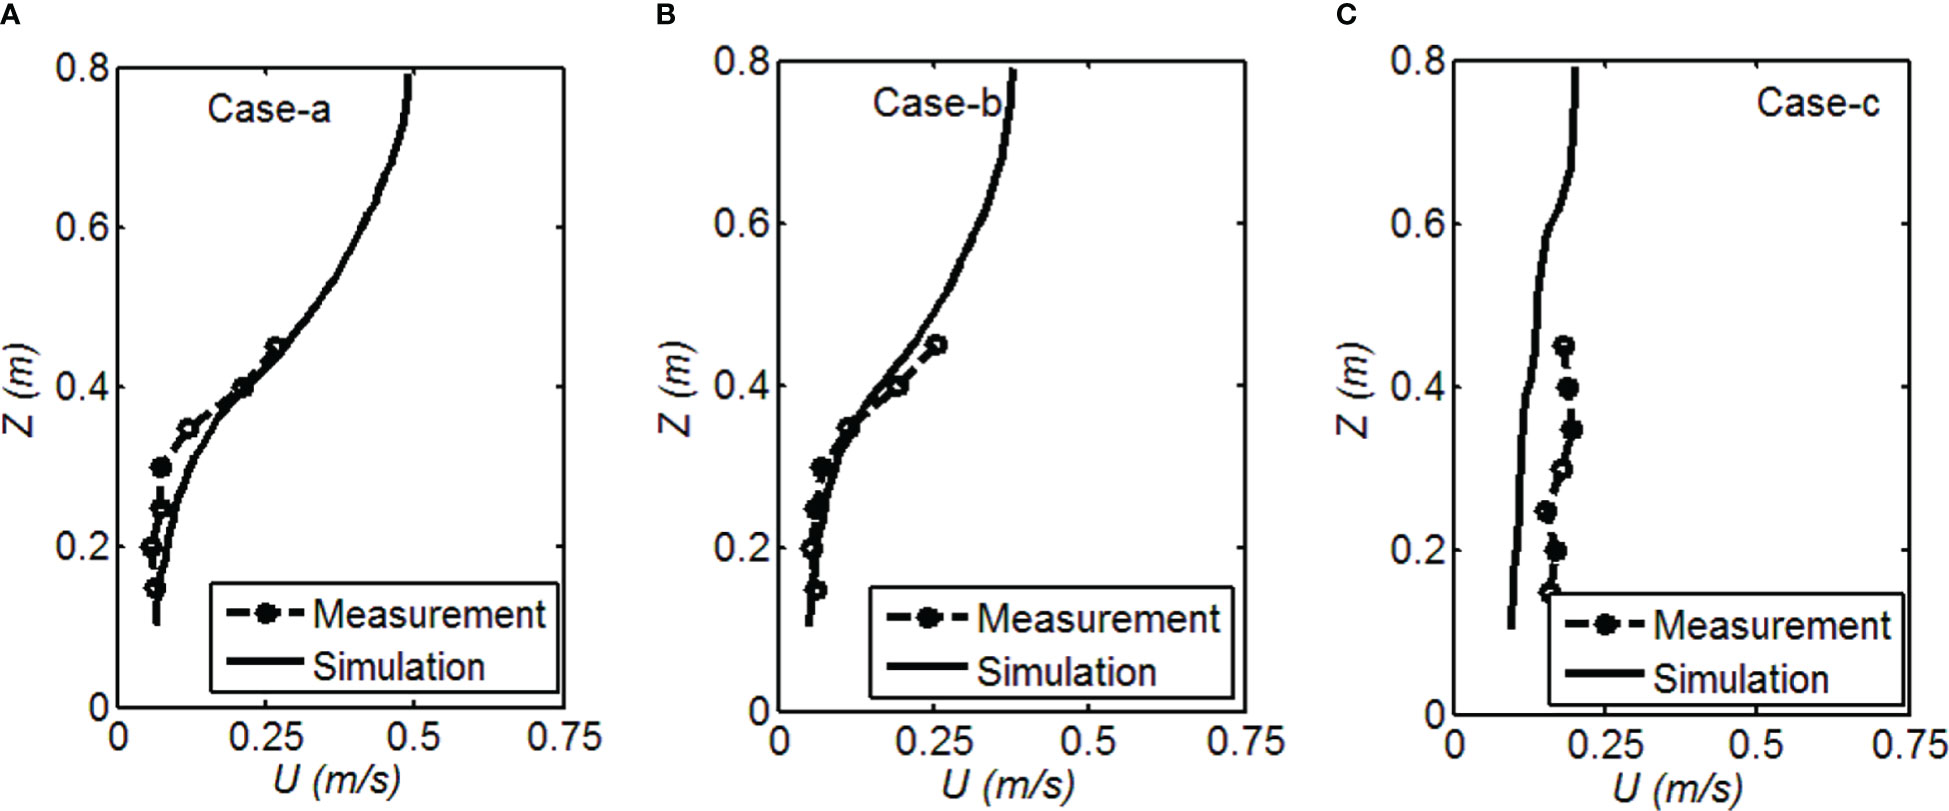
Figure 2 Comparisons of measured and simulated mean velocities in Test 1: (A) Case-a, (B) Case-b, (C) Case-c.
Under a unidirectional flow, the mean velocity was reduced significantly in the cylinder region. Cylinder density significantly affected the mean velocity. The U in Case-b with a higher cylinder density was slightly smaller than that in Case-a; the U in Case-c with vertically varying cylinder density was higher near the bottom and lower in the upper layer than that in Cases-a and b with uniform density. The gradient of mean velocity in Case-c was much smaller than that in Cases-a and b. In Case-c, some cylinders had a height of the water depth, thereby resulting in a more uniform vertical distribution of the mean velocity. The distributions of mean velocity in all the cases have shown a turbulent boundary-layer profile, which was due to the small canopy drag compared with the bed drag with the cylinder mainly contributing to the bed roughness.
The simulated TKE normalized by friction velocity u* are compared with the measured data in Figure 3, assuming that the lowest grid and measurement points near the bottom fall in the logarithmic velocity profile. Generally, the agreements between simulations and measurements were acceptable in Cases-a and b with uniform cylinder density (both the model skills and R2 values were larger than 0.90). The model could effectively simulate the TKE peak around the cylinder top in the cases with uniform cylinder density. Under the unidirectional condition, the gradually increasing of TKE from the cylinder top to the bottom was found in both measurement and simulation. The largest values of TKE occurred near the cylinder top due to the shear stress caused by the great velocity gradient. Relatively larger deviations occurred in Case-b near the bottom, where the simulations were greater than the measurements. The results implied that cylinder-induced turbulence production was lower in the measurements than that in the simulations in Case-b. In the laboratory experiments, the equipment (ADV) in the measurement was set up among the cylinders, which cannot catch all of the small stem-scale turbulence in the case with dense cylinders. The TKE values in Case-c were much lower than those in Cases-a and b. Affected by the vertically varying cylinder density, the turbulence was relatively higher around the layer interfaces under unidirectional currents, i.e. z =0.2, 0.4 and 0.6 m, where cylinder density varies abruptly and strong shear was produced. The simulated vertical profile of TKE showed an extremely small gradient in Case-c, consistent with the measurements. However, the simulated TKE value was relatively lower than the measured data in Case-c with the model skills and R2 values lower than 0.3 and RMSE of 0.02. In the simulation, the peaks of TKE value at z =0.4 and 0.6 m were reproduced, while that at z =0.2 m was absent compared with measured data. In Case-c, turbulence was produced by both the multi-shear layers due to the different cylinder heights and the stem-scale turbulence. The TKE value affected by the vertically varying cylinder density was complicate especially near the bottom (z=0.2 m), which could not be well resolved in the simulation.
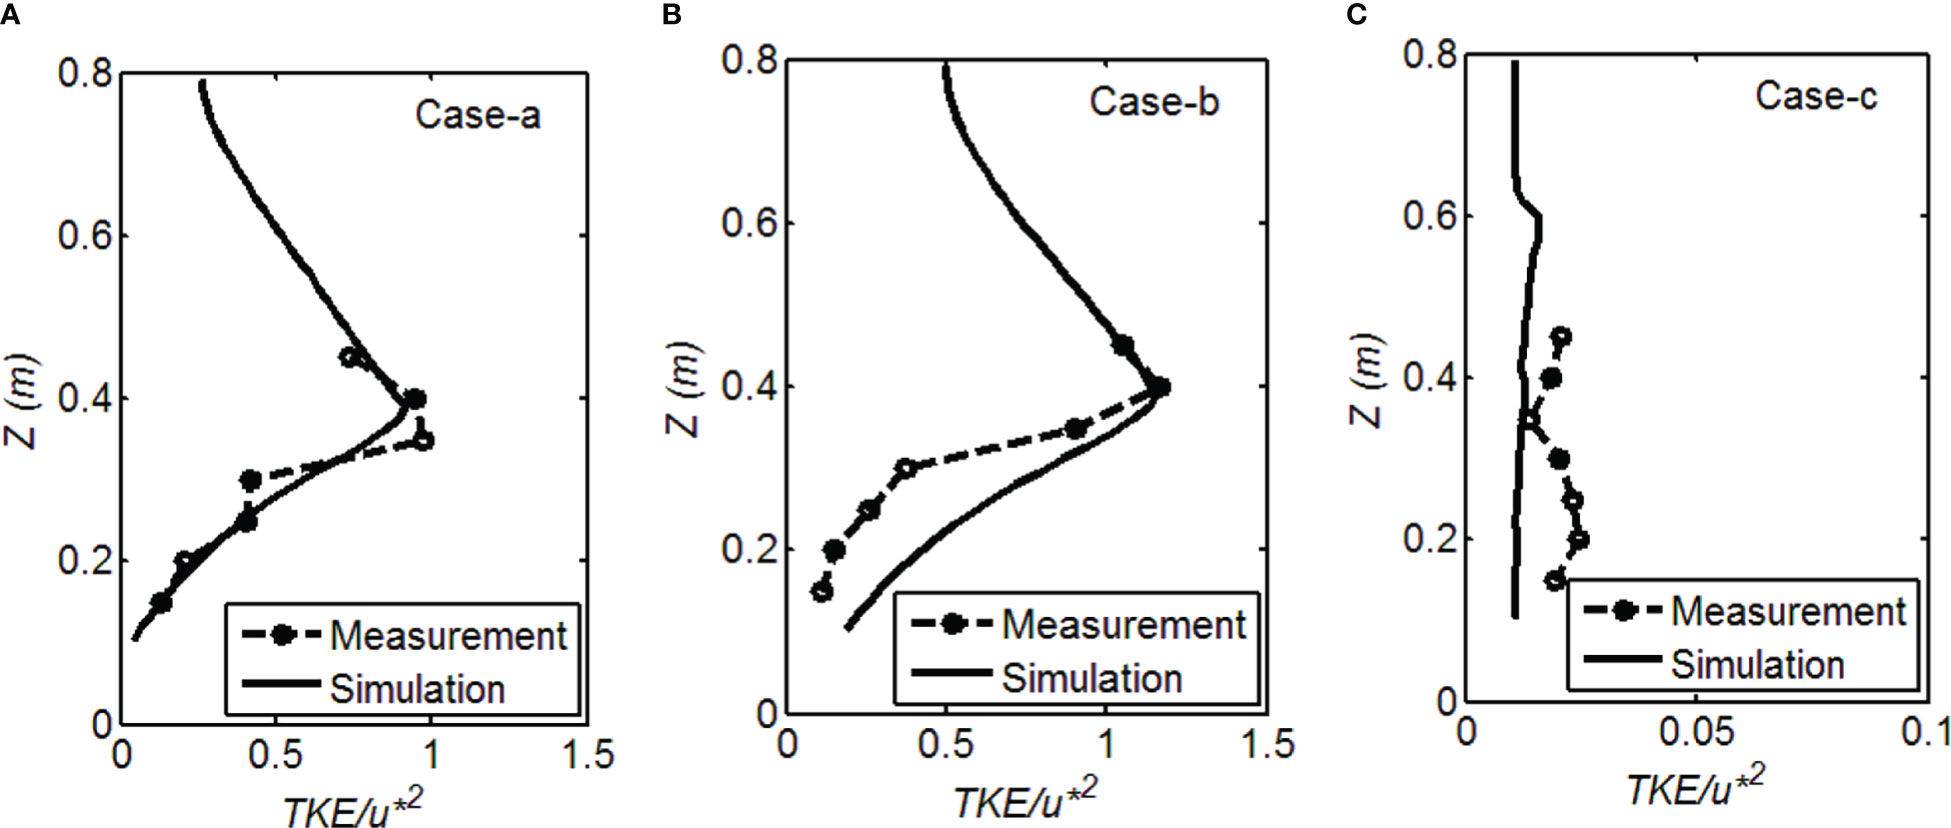
Figure 3 Comparisons of measured and simulated TKEs in Test 1: (A) Case-a, (B) Case-b, (C) Case-c.
Under the unidirectional flow (Test 1), the largest values of turbulent kinetic energy (TKE) occurred around the cylinder top in cases a and b owing to strong shear turbulence. Affected by the submerged cylinders, the discontinuity in drag appearing at the top of the cylinders generated a region of shear resembling a free shear layer near the top of the canopy, which resulted in higher TKE values around the canopy top and relatively lower near the bottom. The maximum value of TKE was higher in Case-b than that in Case-a, which was consistent with the results of (Nepf, 1999), that dense cylinders generate stronger shear and greater array-scale turbulence near the cylinder top, but large-scale shear eddies are constrained in the upper layer. In Case-c with vertically varying cylinder density, the vertical distribution of the TKE showed more than one reflection point. The varying cylinder heights in Case-c yielded multiple shear layers throughout the water column (0.2–0.6 m), resulting in a higher turbulence near the bottom than that in case with uniform density.
The comparisons of the vertical distributions of measured and simulated sediment concentrations for Cases-a, b and c in Test 1 are shown in Figure 4. The simulation results from the improved and the traditional sediment transport model were both compared with the measured data. The computed suspended sediment concentrations using the improved sediment transport model matched relatively well with the measurements, especially near the bottom layer (z<0.2m). The model skills were 0.85–0.88 and R2 was 0.8–0.88 in the three cases. The near-bed suspended sediment concentration can directly reflect the level of sediment suspension. The simulated sediment concentrations near bottom were in good agreement with the measurements, which proved that the proposed model can reproduce sediment suspension affected by cylinders based on the modified critical Shield number. However, the suspended sediment concentrations in the upper layer of water column were underestimated in Case-c. In Case-c, the simulated values of mean velocity and TKE were relatively smaller than the measurements, resulting in smaller bottom shear stress and diffusivity in the simulation. To better simulate the sediment concentration in the upper layer, the vegetation-induced turbulence including shear and stem-scale wake turbulent kinetic energies should be both considered in the future simulation. Sediment concentrations from the traditional sediment transport model were much lower than the measurements, and there was even no sediment suspension in Case-b and Case-c. Due to the higher cylinder densities in Case-b and Case-c, the flow velocities were damped severely, which resulted in small bed shear stress and the underestimation of sediment suspension using the traditional sediment transport model.
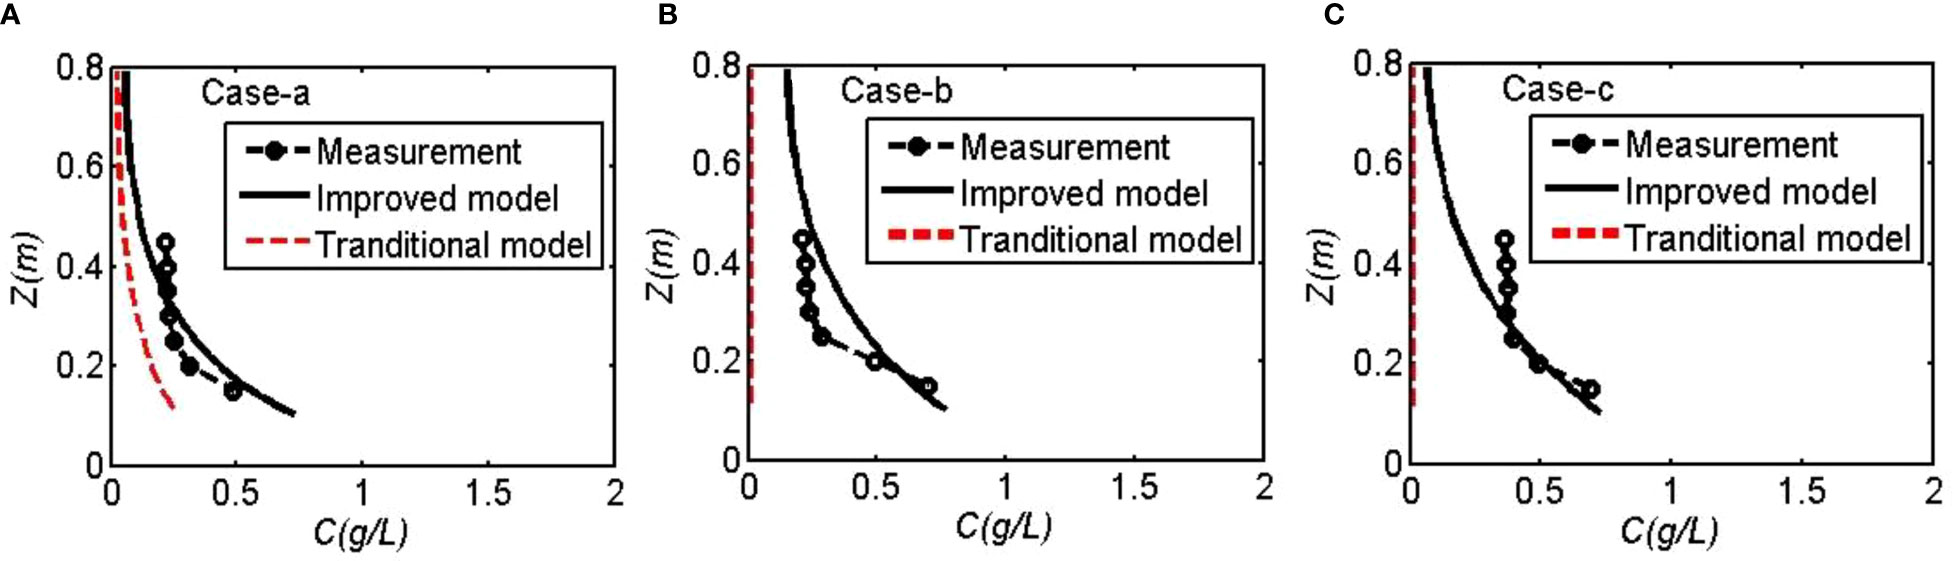
Figure 4 Comparisons of measured and simulated sediment concentrations in Test 1: (A) Case-a, (B) Case-b, (C) Case-c.
Comparing the sediment concentrations in Case-a with sparse cylinders and Case-b with dense cylinders, it was found that the sediment concentrations increased with the growing cylinder density, especially near the bottom, which agreed well with the results in Tinoco and Coco, 2018; Tinoco and Coco, 2016). It was also proved that the bottom sediment suspension was mainly contributed by the turbulence generated around cylinder stems. In other words, the incipient motion velocity decreased with the increasing cylinder density in flows with cylinders. The sediment concentrations were higher in Case-b and Case-c than that in Case-a under a unidirectional flow (Test 1). Although the solid volume fractions were the same near the bottom in these cases, the vertically varying cylinder density promoted sediment suspension due to higher turbulence near the bottom than that in case with uniform density.
3.1.2 Combined wave-current flows (Tests 2-4)
To further validate the sediment model, experimental data from Tests 2, 3, and 4 were used to simulate sediment suspension in combined wave-current flows. Figures 5–7 show that the computed suspended sediment concentrations using the improved sediment transport model agreed with the measurements near the bottom, while some deviations appeared in the upper layer, where the simulated sediment concentrations were smaller than the measured data. The model skills were 0.83–0.85, 0.66–0.88, and 0.54–0.73 in Tests 2, 3, and 4, respectively (Table 4). The R2 values were 0.84–0.88, 0.84–0.88, and 0.84–0.89 in Tests 2, 3, and 4, respectively (Table 4). The sediment concentration increased gradually with the growing wave height. Higher wave height induced larger bed shear stress, which enhanced bottom sediment flux and sediment suspension. More suspended sediment was kept stay in the upper layer by the relatively larger turbulent kinetic energy due to higher wave height. Using the modified Shields number given in Eqs. 15 and 16, the model could predict sediment suspension near bottom under combined wave–current flows with a certain accuracy. Due to the similar reason as in Test 1, the suspended sediment concentrations in the upper layer of water column were also underestimated in the combined wave-current flows, especially in Case-c. Affected by cylinders with vertically varying density, the sediment simulation was more difficult due to the complicate turbulence in both canopy- and stem- scale. On the contrary, the sediment suspension was significantly underestimated using the traditional sediment transport model. It is necessary to consider the cylinder effects on the threshold condition of sediment suspension in the flows with cylinders.
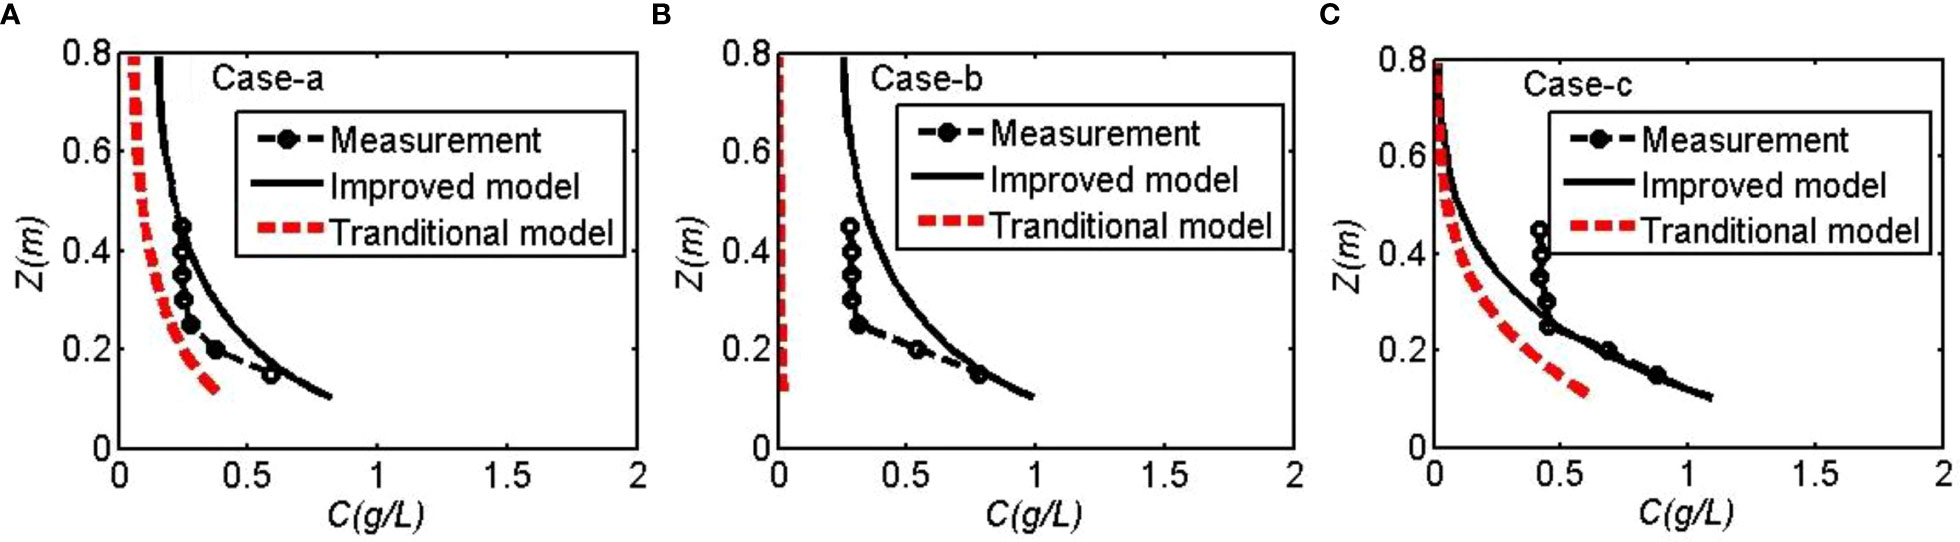
Figure 5 Measured and simulated sediment concentrations in Test 2: (A) Case-a, (B) Case-b, (C) Case-c.
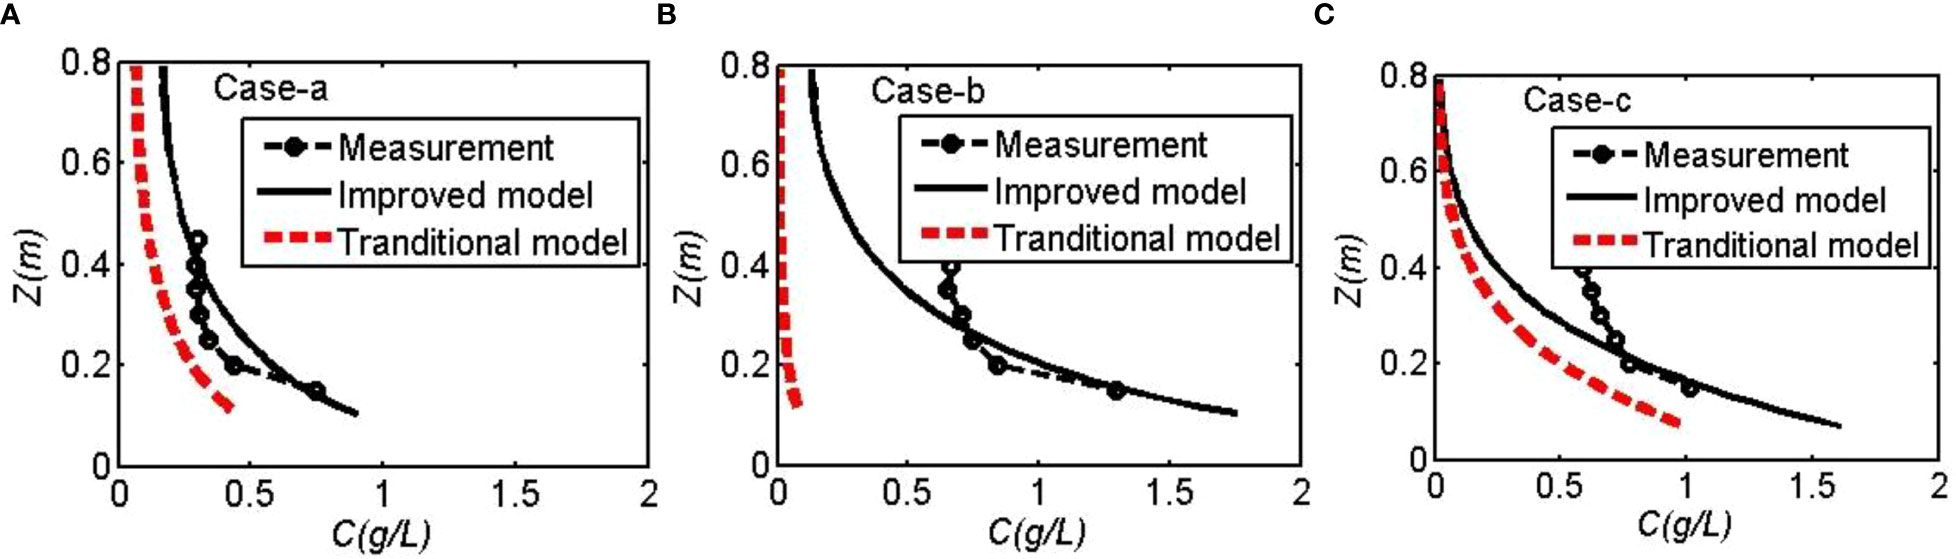
Figure 6 Measured and simulated sediment concentrations in Test 3: (A) Case-a, (B) Case-b, (C) Case-c.
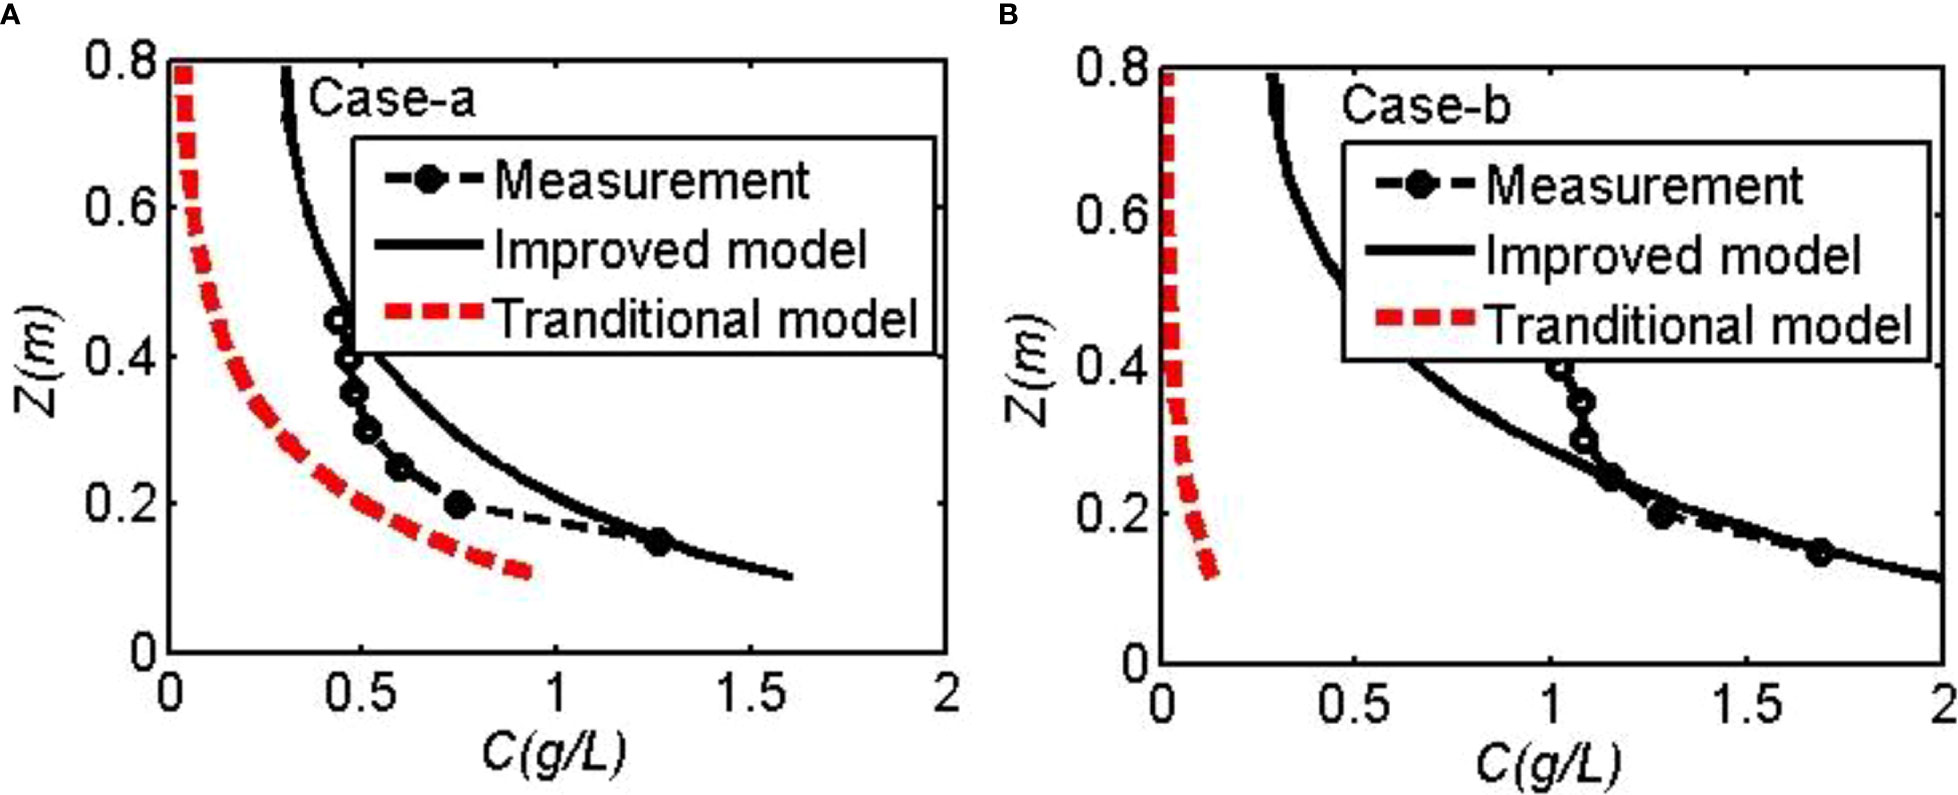
Figure 7 Measured and simulated sediment concentrations in Test 4: (A) Case-a, (B) Case-b.
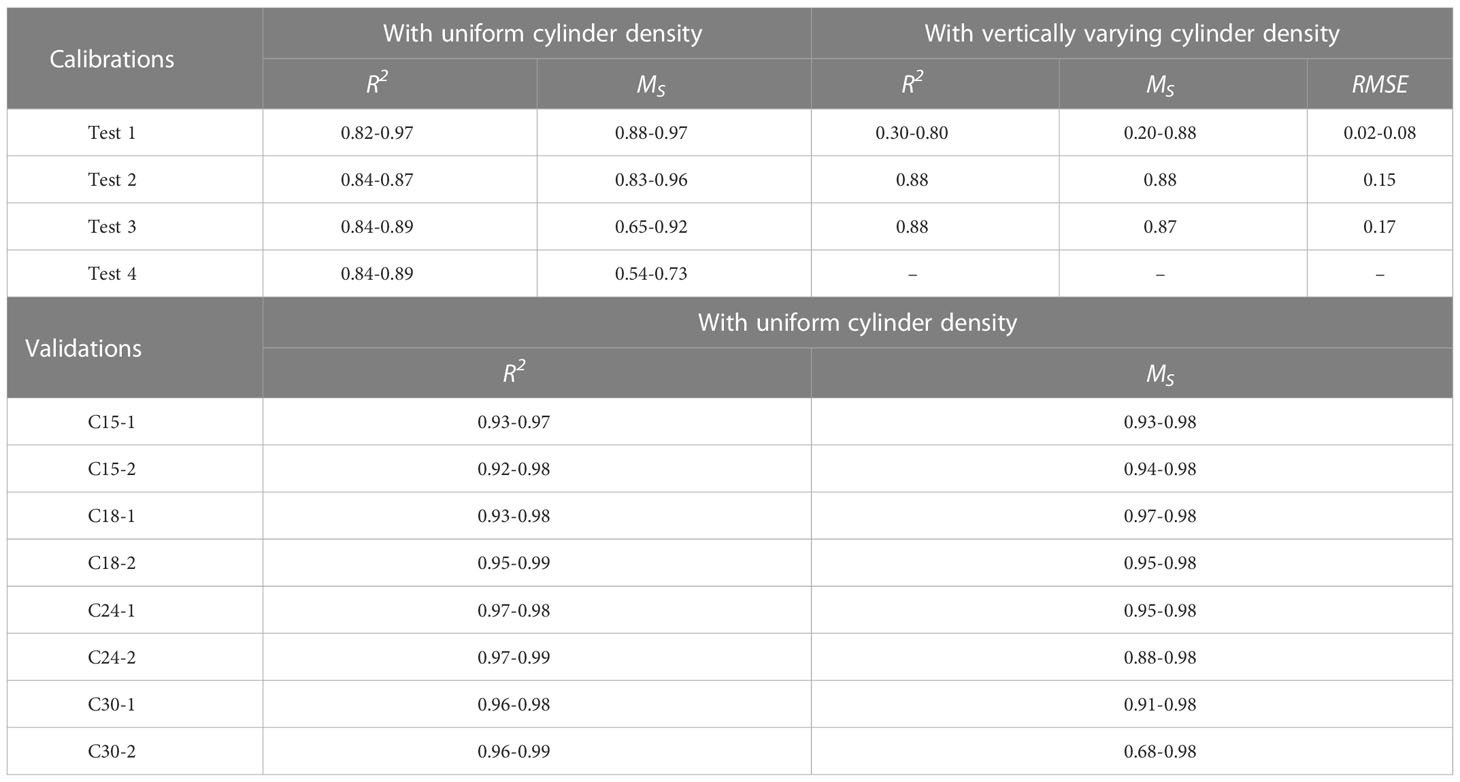
Table 4 Accuracy of model calibrations and validations.
Comparing the results in Cases-a and b, it was clear that the suspended sediment concentration increased with cylinder density, indicative of the effects of cylinders on suspended sediment transport in stem scale. Although the stem numbers were the same in Case-b and Case-c, the sediment distributions were slightly different. In Case-c, which was affected by vertically varying cylinder density, the array-scale turbulence caused by both the multi-shear layers and stem-scale turbulence affected sediment suspension. The imposed waves increased sediment suspension compared to the results under different hydrodynamic conditions. The co-occurring waves greatly enhanced bottom shear stress and promoted sediment suspension, and the sediment concentration was found to be increased with the growing wave height, especially near the bottom. In the upper layer (z>0.2m), there were clear deviations between the measured and simulated data. The sediment concentration near the bottom was mainly controlled by the bottom sediment flux, while it was determined by turbulent diffusivity in the upper layer.
3.2 Validations
The proposed model was further verified using another experimental dataset by Lu (2008), which has also been applied to validate the model in Li et al. (2020). The material of sediment particles used in the experiments (Lu, 2008) was plastic with the median grain size of 0.217 mm and sediment density of 1.082 g/cm3. The CD values were 0.6–0.7 in the simulations according to the empirical equations (Lou et al., 2021). The settling velocity ωs was 0.0047 m/s based on the experimental measurements (Lu, 2008; Li et al., 2020). The critical Shields parameter was calculated as 0.035 for flows without cylinder using the equation in Guo (2002). The modified critical Shields parameters for flows with cylinders were in the range of 0.02-0.03 calculated using Eq. (15).
To validate the proposed model, model results were compared with experimental datasets in 8 tests (Table 3). Figure 8 shows the comparisons of measured and simulated mean velocities. There was a good correlation between measured and predicted values with both the model skills and R2 values larger than 0.93 (Table 4). Deviations between model results and experimental data were found at z/h<0.25 in tests C24-2 and at z/h<0.2 in C30-2. Larger values of flow velocity in the simulations were caused by the underestimation of CD.
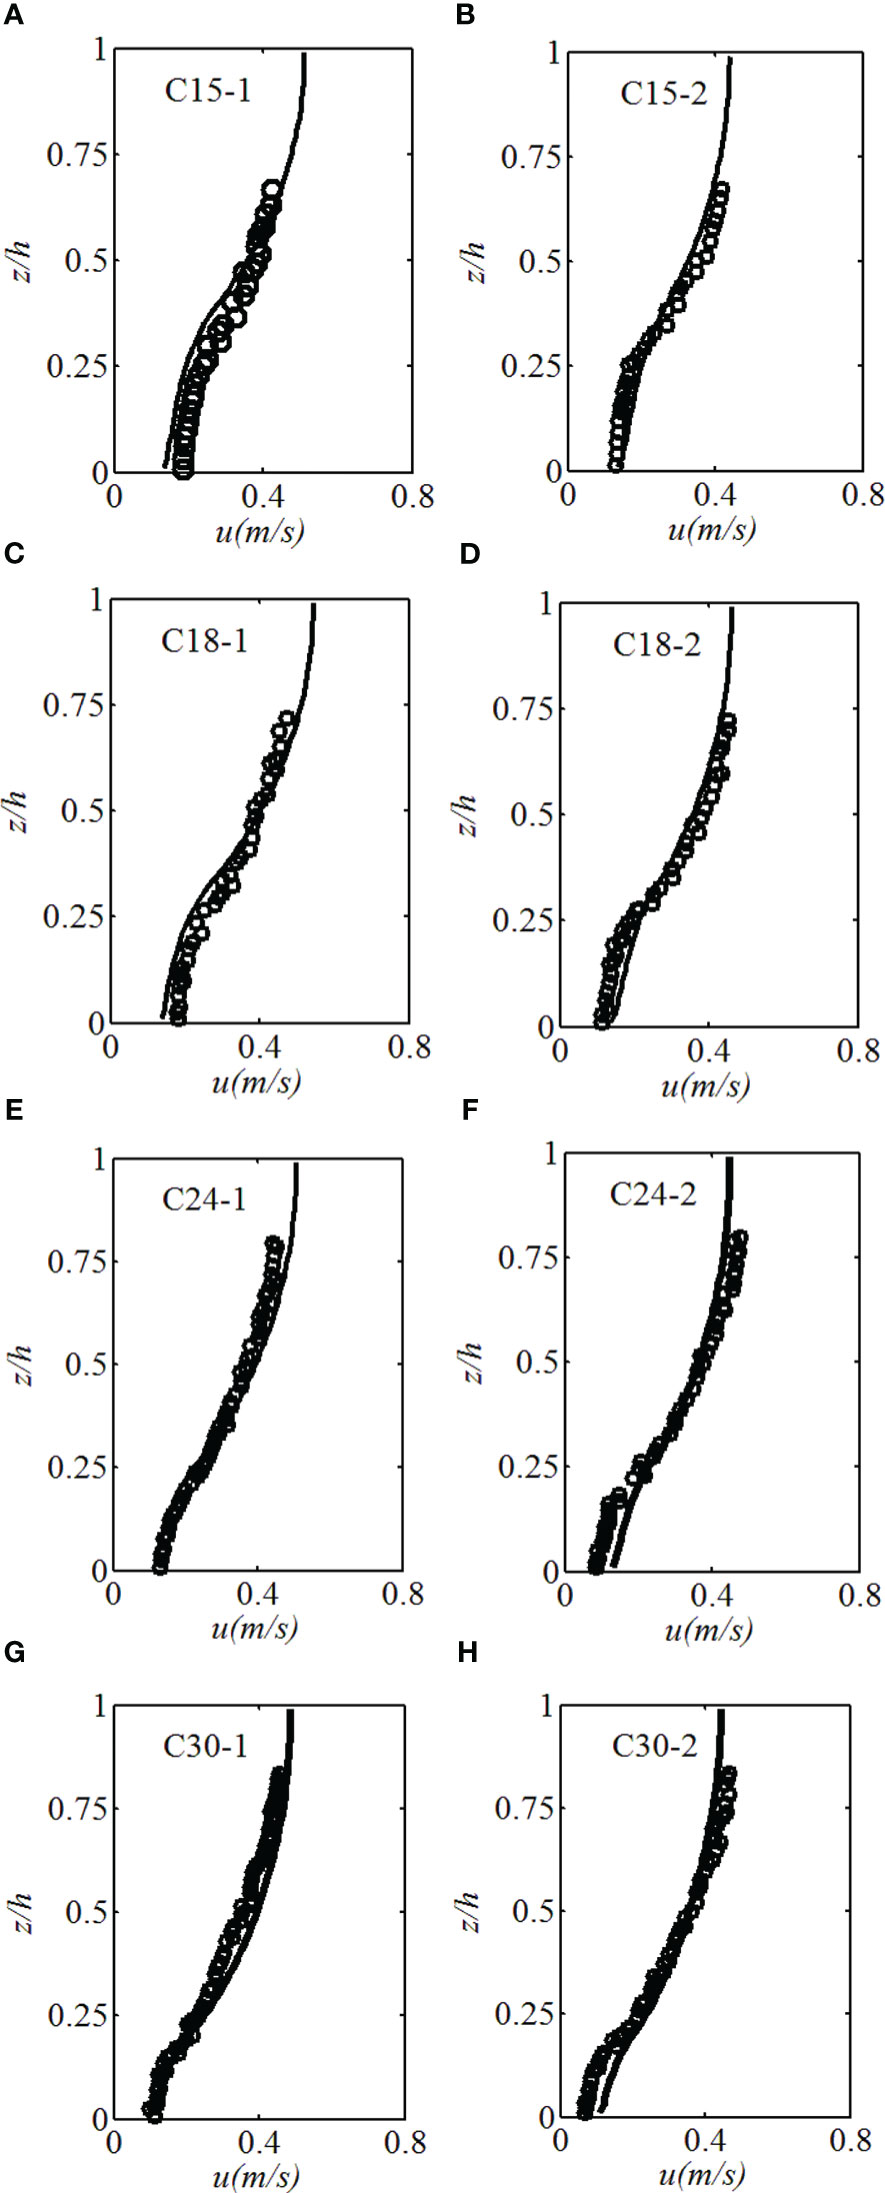
Figure 8 Comparisons of measured and simulated mean velocities in tests carried out by Lu (2008): (A) C15-1, (B) C15-2, (C) C18-1, (D) C18-2, (E) C24-1, (F) C24-2, (G) C30-1, (H) C30-2.
Figure 9 presents the comparisons of measured and simulated sediment concentrations normalized by the concentration at the cylinder height (Ch). The simulated results matched with the measured data in tests C15-1, C15-2, C18-1 and C18-2 with the averaged model skill and R2 value of 0.96 and 0.94. Relatively larger deviations occurred in tests C24-1 (model skill of 0.95) and C30-1 (model skill of 0.91), while obvious disagreements were found in C24-2 (model skill of 0.88) and C30-2 (model skill of 0.68). The simulated concentration was greater than the measured data especially near the bottom, which was greatly affect by the sediment suspension processes. In tests C24-1, C24-2, C30-1 and C30-2, the cylinder density was relatively low. The cylinder densities (ϕ) in tests C24-2 and C30-2 were both less than 0.01 (0.006 and 0.007, respectively). It was found that the proposed sediment transport model was less accurate in cases with small cylinder density (ϕ<0.01).
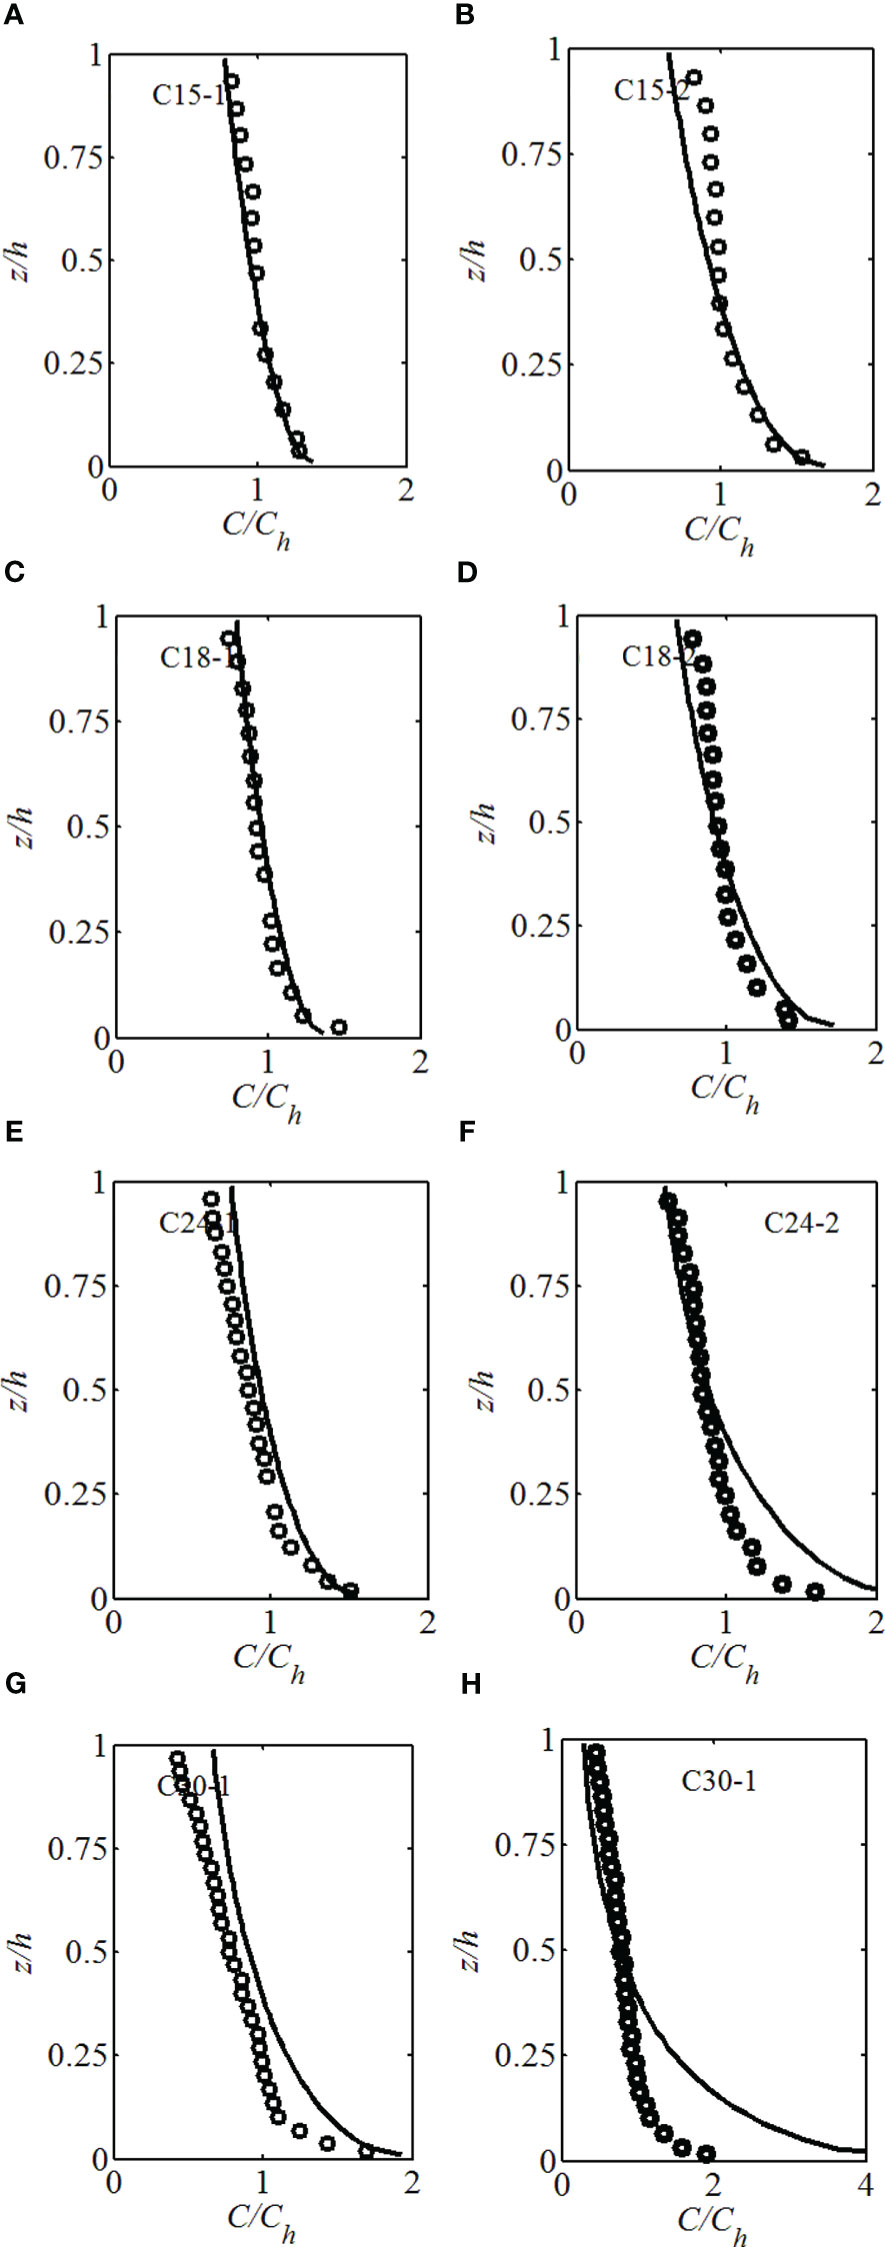
Figure 9 Comparisons of measured and simulated sediment concentrations normalized by the concentrations at cylinder top (Ch) in tests carried out by Lu (2008): (A) C15-1, (B) C15-2, (C) C18-1, (D) C18-2, (E) C24-1, (F) C24-2, (G) C30-1, (H) C30-2.
4 Rationale and limitations of the proposed model
The traditional sediment transport model for bare bed (Eq. 14) without the consideration of cylinders was modified to reproduce the processes of sediment suspension affected by cylinders. Sediment flux near bed was calculated based on a modified critical Shields number due to the presence of cylinders in the improved model (Eqs. 15 and 16). This improvement allowed to capture the strong influence of cylinders on sediment suspension due to the cylinder induced turbulence. This proposed model can be simply used to simulate sediment suspension affected by cylinders in both unidirectional and the combined wave-current flows under similar conditions as the Eqs. 15 and 16 deduced. However, it was found from the model verifications that better agreements between simulations and measurements were observed in cases with uniform density cylinders. Sediment suspension affected by vertically varying density cylinders should be further studied considering the combined influences of shear and stem-scale wake turbulent kinetic energies.
5 Conclusions
Numerical simulations on sediment suspension affected by cylinders under unidirectional and combined wave–current flows were presented. A sediment transport model with a modified critical Shields number considering cylinder density (solid volume fraction ϕ) proposed by Tinoco and Coco (2016) was employed to simulate sediment suspension in the flows with cylinders. Results demonstrated that the improved model could reasonably reproduce sediment suspension in the flows with cylinders, while the sediment transport model with the traditional critical Shields number failed to capture sediment suspension in the cylinder canopy. Numerical simulations showed that denser cylinders and larger wave heights resulted in stronger sediment suspensions. The stem-scale turbulence induced by cylinders and enhanced bed shear stress by waves greatly promoted sediment suspension. Flow–cylinder–sediment interactions are complex and require more investigations, and the proposed sediment transport model should be further validated using field observations.
Data availability statement
The raw data supporting the conclusions of this article will be made available by the authors, without undue reservation.
Author contributions
SL: Conceptualization, Methodology, Writing – original draft, Funding acquisition. XC: Conceptualization, Methodology, Data analysis. SZ: Conceptualization, Methodology, Editing and analysis. GM: Writing – review and editing. SLi: Conceptualization, Project administration. LR: Formula derivation and theoretical analysis. EN: Formula derivation and theoretical analysis, Formal analysis. IF: Conceptualization, Writing – review and editing. All authors contributed to the article and approved the submitted version.
Funding
This work was sponsored by the National Natural Science Foundation of China (42072281), Shanghai Science and Technology Innovation Action Plan (20230742500, 22ZR1464200, 22230712900), the Fundamental Research Funds for the Central Universities (22120210576), and Top Discipline Plan of Shanghai Universities-Class I (2022-3-YB-03).
Conflict of interest
The authors declare that the research was conducted in the absence of any commercial or financial relationships that could be construed as a potential conflict of interest.
Publisher’s note
All claims expressed in this article are solely those of the authors and do not necessarily represent those of their affiliated organizations, or those of the publisher, the editors and the reviewers. Any product that may be evaluated in this article, or claim that may be made by its manufacturer, is not guaranteed or endorsed by the publisher.
References
Augustin L. N., Irish J. L., Lynett P. (2009). Laboratory and numerical studies of wave damping by emergent and near-emergent wetland vegetation. Coast. Eng. 56 (3), 332–340. doi: 10.1016/j.coastaleng.2008.09.004
Balke T., Klaassen P. C., Garbutt A., van der Wal D., Herman P. M. J., Bouma T. J. (2012). Conditional outcome of ecosystem engineering: A case study on tussocks of the salt marsh pioneer spartina anglica. Geomorphology 153, 232–238. doi: 10.1016/j.geomorph.2012.03.002
Chen M., Lou S., Liu S. G., Ma G. F., Liu H. Z., Zhong G. H., et al. (2020). Velocity and turbulence affected by submerged rigid vegetation under waves, currents and combined wave-current flows. Coast. Eng. 159, 103727. doi: 10.1016/j.coastaleng.2020.103727
Gao T., Wang Y., Pang Y., Chen Q., Tang Y. (2018). A time-efficient CFD approach for hydrodynamic coefficient determination and model simplification of submarine. Ocean Eng. 154, 16–26. doi: 10.1016/j.oceaneng.2018.02.003
Ghisalberti M., Nepf H. M. (2002). Mixing layers and coherent structures in vegetated aquatic flows. J. Geophysical Research-Oceans 107 (C2), 3–1–3–11. doi: 10.1029/2001JC000871
Ghisalberti M., Nepf H. M. (2004). The limited growth of vegetated shear layers. Water Resour. Res. 40, (7), 3-1-3-11. doi: 10.1029/2003WR002776
Guo J. K. (2002). Hunter rouse and shields diagram. Adv. Hydraulic Water Eng. 1-2, 1096–1098. doi: 10.1142/9789812776969_0200
He Z., Wu T., Weng H., Hu P., Wu G. (2017). Numerical simulation of dam-break flow and bed change considering the vegetation effects. Int. J. Sediment Res. 32 (1), 105–120. doi: 10.1016/j.ijsrc.2015.04.004
Horppila J., Nurminen L. (2003). Effects of submerged macrophytes on sediment resuspension and internal phosphorus loading in lake hiidenvesi (southern Finland). Water Res. 37 (18), 4468–4474. doi: 10.1016/S0043-1354(03)00405-6
Hu K., Chen Q., Wang H., Hartig E. K., Orton P. M. (2018). Numerical modeling of salt marsh morphological change induced by hurricane sandy. Coast. Eng. 132, 63–81. doi: 10.1016/j.coastaleng.2017.11.001
Liu C., Shen Y. M. (2008). Flow structure and sediment transport with impacts of aquatic vegetation. J. Hydrodynamics 20 (4), 461–468. doi: 10.1016/S1001-6058(08)60081-5
Li D., Yang Z., Zhu Z., Guo M., Gao W., Sun Z. (2020). Estimating the distribution of suspended sediment concentration in submerged vegetation flow based on gravitational theory. J. Hydrology 587, 124921. doi: 10.1016/j.jhydrol.2020.124921
Lopez F., Garcia M. (1998). Open-channel flow through simulated vegetation: Suspended sediment transport modeling. Water Resour. Res. 34 (9), 2341–2352. doi: 10.1029/98WR01922
Lou S., Chen M., Ma G., Liu S., Wang H. (2022). Sediment suspension affected by submerged rigid vegetation under waves, currents and combined wave–current flows. Coast. Eng. 173, 104082. doi: 10.1016/j.coastaleng.2022.104082
Lou S., Chen M., Ma G., Liu S., Zhong G. (2018). Laboratory study of the effect of vertically varying vegetation density on waves, currents and wave-current interactions. Appl. Ocean Res. 79, 74–87. doi: 10.1016/j.apor.2018.07.012
Lou S., Chen M., Ma G., Liu S., Zhong G. (2021). Modelling of stem-scale turbulence and sediment suspension in vegetated flow. J. Hydraulic Res. 59, 355–377 doi: 10.1080/00221686.2020.1780491
Lu S. (2008). Experimental study on distribution law of suspended sediment in water flow of rigid plants (in Chinese) (China: Hohai University). doi: 10.7666/d.y1268411
Ma G., Han Y., Niroomandi A., Lou S., Liu S. (2015). Numerical study of sediment transport on a tidal flat with a patch of vegetation. Ocean Dynamics 65 (2), 203–222. doi: 10.1007/s10236-014-0804-8
Ma G., Kirby J. T., Su S., Figlus J., Shi F. (2013). Numerical study of turbulence and wave damping induced by vegetation canopies. Coast. Eng. 80, 68–78. doi: 10.1016/j.coastaleng.2013.05.007
Ma G., Shi F., Kirby J. T. (2012). Shock-capturing non-hydrostatic model for fully dispersive surface wave processes. Ocean Model. 43-44, 22–35. doi: 10.1016/j.ocemod.2011.12.002
Mendez F. J., Losada I. J. (2004). An empirical model to estimate the propagation of random breaking and nonbreaking waves over vegetation fields. Coast. Eng. 51 (2), 103–118. doi: 10.1016/j.coastaleng.2003.11.003
Moller I., Spencer T., French J. R., Leggett D. J., Dixon M. (1999). Wave transformation over salt marshes: A field and numerical modelling study from north Norfolk, England. Estuar. Coast. Shelf Sci. 49 (3), 411–426. doi: 10.1006/ecss.1999.0509
Nepf H. M. (1999). Drag, turbulence, and diffusion in flow through emergent vegetation. Water Resour. Res. 35 (2), 479–489. doi: 10.1029/1998WR900069
Nepf H. M. (2012). Flow and transport in regions with aquatic vegetation. Annu. Rev. Fluid Mechanics 44, 123–142. doi: 10.1146/annurev-fluid-120710-101048
Nepf H. M., Vivoni E. R. (2000). Flow structure in depth-limited, vegetated flow. J. Geophysical Research-Oceans 105 (C12), 28547–28557. doi: 10.1029/2000JC900145
Neumeier U. (2007). Velocity and turbulence variations at the edge of saltmarshes. Continental Shelf Res. 27 (8), 1046–1059. doi: 10.1016/j.csr.2005.07.009
Ni Y. (2014). Laboratory investigations on the drag coefficient of cylinder subjected to wave motion (The Netherlands: Master thesis from Delft University of Technology). 10.2001.
Rodi W. (1987). Examples of calculation methods for flow and mixing in stratified fluids. J. Geophysical Research-Oceans 92 (C5), 5305–5328. doi: 10.1029/JC092iC05p05305
Ros A., Colomer J., Serra T., Pujol D., Soler M., Casamitjana X. (2014). Experimental observations on sediment resuspension within submerged model canopies under oscillatory flow. Continental Shelf Res. 91, 220–231. doi: 10.1016/j.csr.2014.10.004
Sheng Y. P., Lapetina A., Ma G. (2012). The reduction of storm surge by vegetation canopies: Three-dimensional simulations. Geophysical Res. Lett. 39, L20601. doi: 10.1029/2012GL053577
Snyder P. J., Hsu T. J. (2011). A numerical investigation of convective sedimentation. J. Geophysical Research-Oceans 116, C09024. doi: 10.1029/2010JC006792
Sonnenwald F., Stovin V., Guymer I. (2019). Estimating drag coefficient for arrays of rigid cylinders representing emergent vegetation. J. Hydraulic Res. 57 (4), 591–597. doi: 10.1080/00221686.2018.1494050
Soulsby R. L. (1995). Bed shear-stresses due to combined waves and currents, section 4.5 in advances in coastal, morphodynamics. Ed. Stive M. J. F. (Delft: Delft Hydraulics).
Soulsby R. L. (1997). Dynamics of marine sands (Thomas Telford, London: A manual for practical applications).
Tang C., Lei J., Nepf H. M. (2019). Impact of vegetation-generated turbulence on the critical, near-bed, wave-velocity for sediment resuspension. Water Resour. Res. 55 (7), 5904–5917. doi: 10.1029/2018WR024335
Tang H., Wang H., Liang D. F., Lv S. Q., Yan J. (2013). Incipient motion of sediment in the presence of emergent rigid vegetation. J. Hydro-environment Res. 7, 202–208. doi: 10.1016/j.jher.2012.11.002
Tanino Y., Nepf H. M. (2008). Laboratory investigation of mean drag in a random array of rigid, emergent cylinders. J. Hydraulic Eng. 134 (1), 34–41. doi: 10.1061/(ASCE)0733-9429(2008)134:1(34)
Tinoco R. O., Coco G. (2016). A laboratory study on sediment resuspension within arrays of rigid cylinders. Adv. Water Resour. 92, 1–9. doi: 10.1016/j.advwatres.2016.04.003
Tinoco R. O., Coco G. (2018). Turbulence as the main driver of resuspension in oscillatory flow through vegetation. J. Geophysical Research-Earth Surface 123 (5), 891–904. doi: 10.1002/2017JF004504
Tinoco R. O., Cowen E. A. (2013). The direct and indirect measurement of boundary stress and drag on individual and complex arrays of elements. Experiments fluids 54 (4), 1509–1522. doi: 10.1007/s00348-013-1509-3
Van Hoften J. D. A., Karaki S. (1976). Interaction of waves and a turbulent current. Proc. Int. Conf. Coast. Eng. Proceedings of the 15th International Conference on Coastal Engineering ASCE New York, 404–422. doi: 10.9753/icce.v15.22
Van Rijn L. C. (1984). Sediment transport, part II: Suspended load transport. J. Hydraulic Engineering-ASCE 110 (11), 1613–1641. doi: 10.1061/(ASCE)0733-9429(1984)110:11(1613)
Van Rijn L. C. (1993). Principles of sediment transport in rivers, estuaries, and coastal seas (The Netherlands: Aqua Publications).
Wilmott C. J. (1981). On the validation of models. Phys. Geogr. 2 (2), 184–194. doi: 10.1080/02723646.1981.10642213
Wu W., Ma G., Cox D. T. (2016). Modeling wave attenuation induced by the vertical density variations of vegetation. Coast. Eng. 112, 17–27. doi: 10.1016/j.coastaleng.2016.02.004
Wu W., Wang S. S. Y. (2007). One-dimensional modeling of dam-break flow over movable beds. J. Hydraulic Eng. 133 (1), 48–58. doi: 10.1061/(ASCE)0733-9429(2007)133:1(48)
Yang J. Q., Chung H., Nepf H. M. (2016). The onset of sediment transport in vegetated channels predicted by turbulent kinetic energy. Geophys. Res. Lett. 43, 11,261–11,268. doi: 10.1002/2016GL071092
Yang J. Q., Nepf H. M. (2019). Impact of vegetation on bed load transport rate and bedform characteristics. Water Resour. Res. 55 (7), 6109–6124. doi: 10.1029/2018WR024404
Zhang Y., Nepf H. (2019). Wave-driven sediment resuspension within a model eelgrass meadow. J. Geophysical Research: Earth Surface 124, 1035–1053. doi: 10.1029/2018JF004984
Keywords: sediment suspension, modified critical Shields number, cylinder, unidirectional flows, combined wave–current flows
Citation: Lou S, Chen X, Zhou S, Ma G, Liu S, Radnaeva LD, Nikitina E and Fedorova IV (2023) Numerical study of sediment suspension affected by rigid cylinders under unidirectional and combined wave–current flows. Front. Mar. Sci. 10:1105112. doi: 10.3389/fmars.2023.1105112
Received: 22 November 2022; Accepted: 24 January 2023;
Published: 06 February 2023.
Edited by:
Wei-Bo Chen, National Science and Technology Center for Disaster Reduction(NCDR), TaiwanReviewed by:
Peter M.J. Herman, Delft University of Technology, NetherlandsPankaj Raushan, Indian Institute of Engineering Science and Technology, Shibpur, India
Copyright © 2023 Lou, Chen, Zhou, Ma, Liu, Radnaeva, Nikitina and Fedorova. This is an open-access article distributed under the terms of the Creative Commons Attribution License (CC BY). The use, distribution or reproduction in other forums is permitted, provided the original author(s) and the copyright owner(s) are credited and that the original publication in this journal is cited, in accordance with accepted academic practice. No use, distribution or reproduction is permitted which does not comply with these terms.
*Correspondence: Sha Lou, bG91c2hhQHRvbmdqaS5lZHUuY24=