 Qingpeng Han
 Xiujuan Shan
 Xianshi Jin
 Harry Gorfine
- 1Key Laboratory of Sustainable Development of Marine Fisheries, Ministry of Agriculture and Rural Affairs, Shandong Provincial Key Laboratory of Fishery Resources and Ecological Environment, Yellow Sea Fisheries Research Institute, Chinese Academy of Fishery Sciences, Qingdao, China
- 2Shandong Changdao Fishery Resources National Field Observation and Research Station, Yantai, China
- 3School of Biosciences, The University of Melbourne, Parkville, VIC, Australia
Sustainable utilization of exploited fish stocks generally relies on characterizing key aspects of their population dynamics using mathematical models to evaluate their stock status. In this study, the Anchovy population (Engraulis japonicus) in the Yellow Sea large marine ecosystem (YSLME) was evaluated by using the ‘Just Another Bayesian Biomass Assessment’ (JABBA) model. Catch and the anchovy scientific survey biomass index data from 1989 to 2021 in its nominal or raw form, plus three adjusted CPUE trends using data acquired from the China Fishery Statistical Yearbook were each used to fit JABBA to explore the performance of reconfigured CPUE for setting a total allowable catch (TAC) quota to sustain the YSLME commercial anchovy fishery. Results showed contrasting trends in estimated biomass from the fishery independent surveys, and nominal and reconfigured commercial fishery CPUE, with the latter producing the most plausible results. The JABBA output based on the scientific survey biomass index indicated a 56.7% probability that the anchovy stock is currently healthy with 1.04 B2021/BMSY and 0.51 F2021/FMSY ratios, whereas JABBA estimates based on the nominal commercial CPUE-based were overly optimistic (100% probability stock was healthy). JABBA outputs based on the first two reconfigured CPUEs (Facpuey and FECcpuey) countered this overoptimism, with the survey biomass index-based assessment results lying between the extremes. This improvement in the modelled assessment was achieved because the reconfigured CPUE time series accommodated technological progress in fishing vessels and gear performance. Therefore, in instances where survey biomass index data are unavailable, we recommend using the two improved fishery CPUEs and combining the results of the two assessments to guide fishery management. Management reference points, however, should preferably be based on the more conservative of the two reconfigured CPUEs as a precautionary approach for setting a total allowable catch (TAC) whilst concomitantly considering the role of anchovy as prey for other economically important fish in the system.We encourage researchers to extensively review and improve the quality and availability of fisheries statistical data worldwide in the shared endeavour towards obtaining more realistic stock assessments.
1 Introduction
Anchovy (Engraulis japonicus) is the most abundant fish in the Yellow Sea large marine ecosystem (YSLME) and is also one of the most prevalent and commercially valuable (for fishmeal production; Du, 2016) pelagic fish species in the western North Pacific (Itoh et al., 2009). This leads to a huge demand for anchovy that is unaffected by commercial demand for other pelagic species. Anchovy plays a pivotal role in the YSLME, being both a prey species for dozens of fish species and an important planktivore (Tang and Ye, 1990; Zhu and Iversen, 1990; Zhao et al., 2003). As a key prey species, over the past 2.5 decades anchovy has had the greatest influence on fish community dispersal capacity, exerting strong upward trophic pressure thereby controlling community predator abundance as well as influencing spatial patterns during all seasons (Su et al., 2021a; Su et al., 2021b; Su et al., 2022). Changes in its biomass can cause biomass shifts among multiple predators throughout the food web, resulting in ecosystem perturbations which compromise the sustainability of fisheries (Pauly et al., 2002). Therefore, maintaining the sustainability of anchovy resources is of considerable ecological importance.
Anchovy of the YSLME spawn in nearshore coastal waters and then gather to overwinter in the Yellow Sea wintering grounds (Figure 1; Liu et al., 1990). This concentration of spawning stock results in the central and southern regions of the Yellow Sea yielding the best catches during December and the following January respectively (Lin and Wang, 1992). China’s anchovy fishery exploration began in the late 1980s, and in 1992 anchovy fishing surveys and fishing technology research won the first prize of China’s National Science and Technology Progress Award, after which the catch increased exponentially, reaching a sub-peak (1037,682 tons) in 1997 in the YSLME, before falling precipitously after 2003 (Figure 2). Since the 1990s, pelagic pair trawling has been the main commercial fishing method in the YSLME as the anchovy fishery developed following depletion of traditional demersal fish species such as yellow croaker and hairtail. The shift from demersal to pelagic fishing has resulted in anchovy becoming the main target of the YSLME fishing industry (Jin et al., 2005; Jin et al., 2015; You et al., 2017).
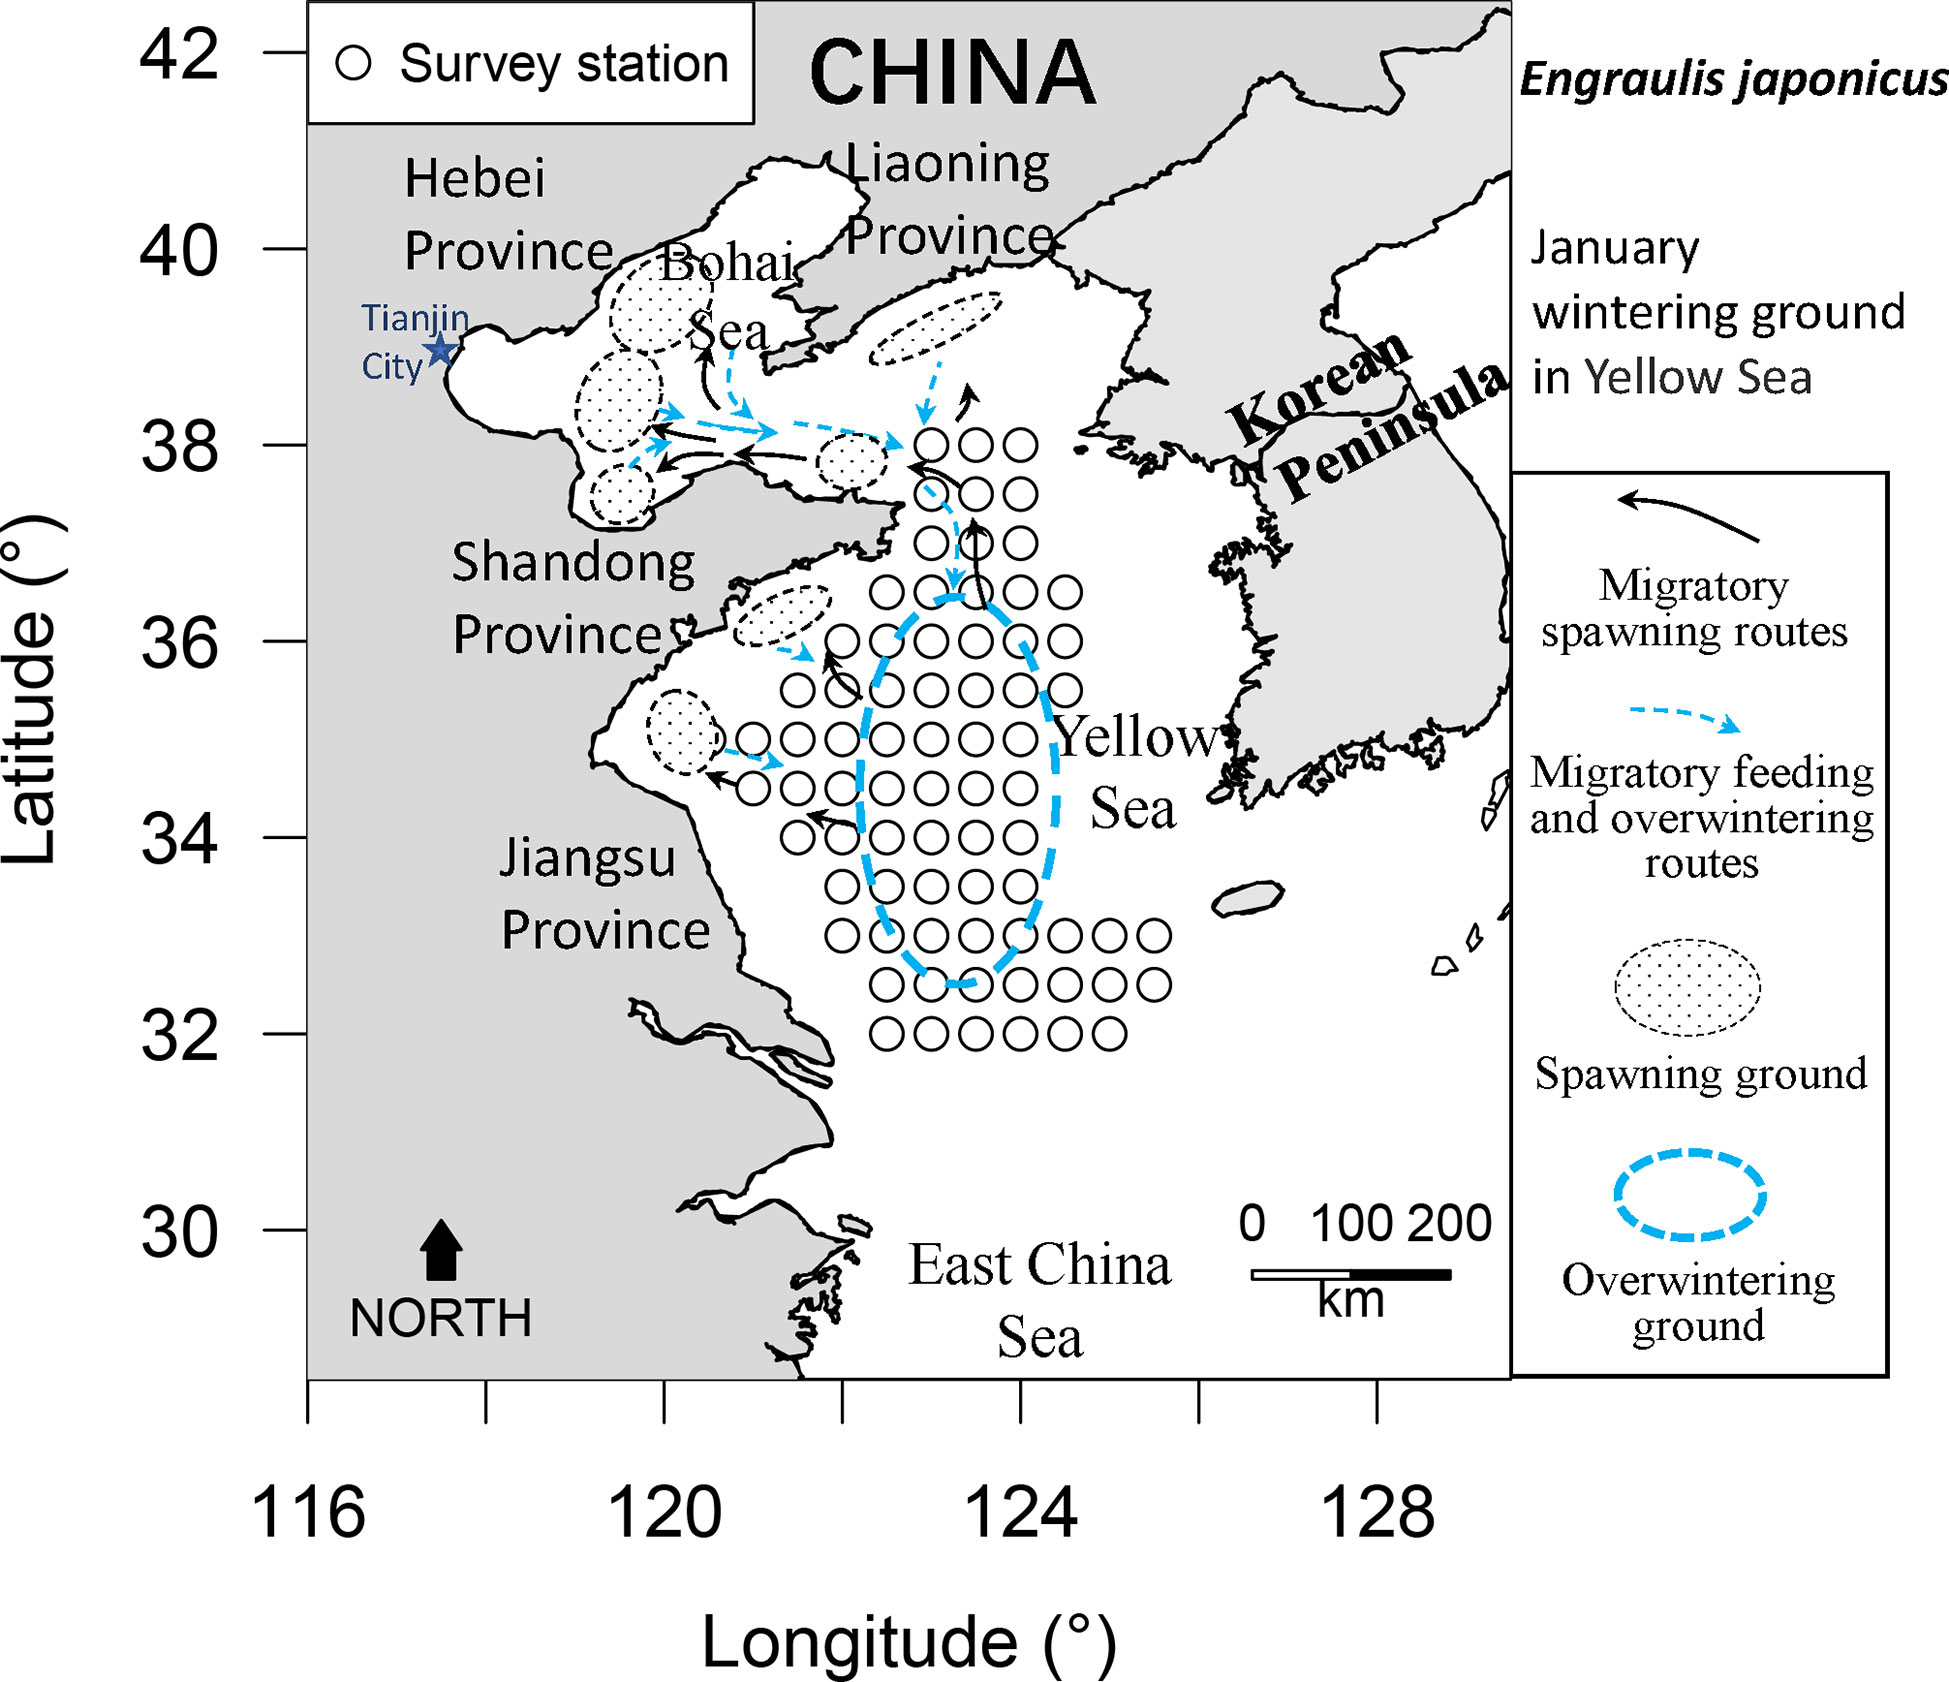
Figure 1 Survey Station and migration distribution of Japanese anchovy in the Yellow Sea Large Marine Ecosystem.
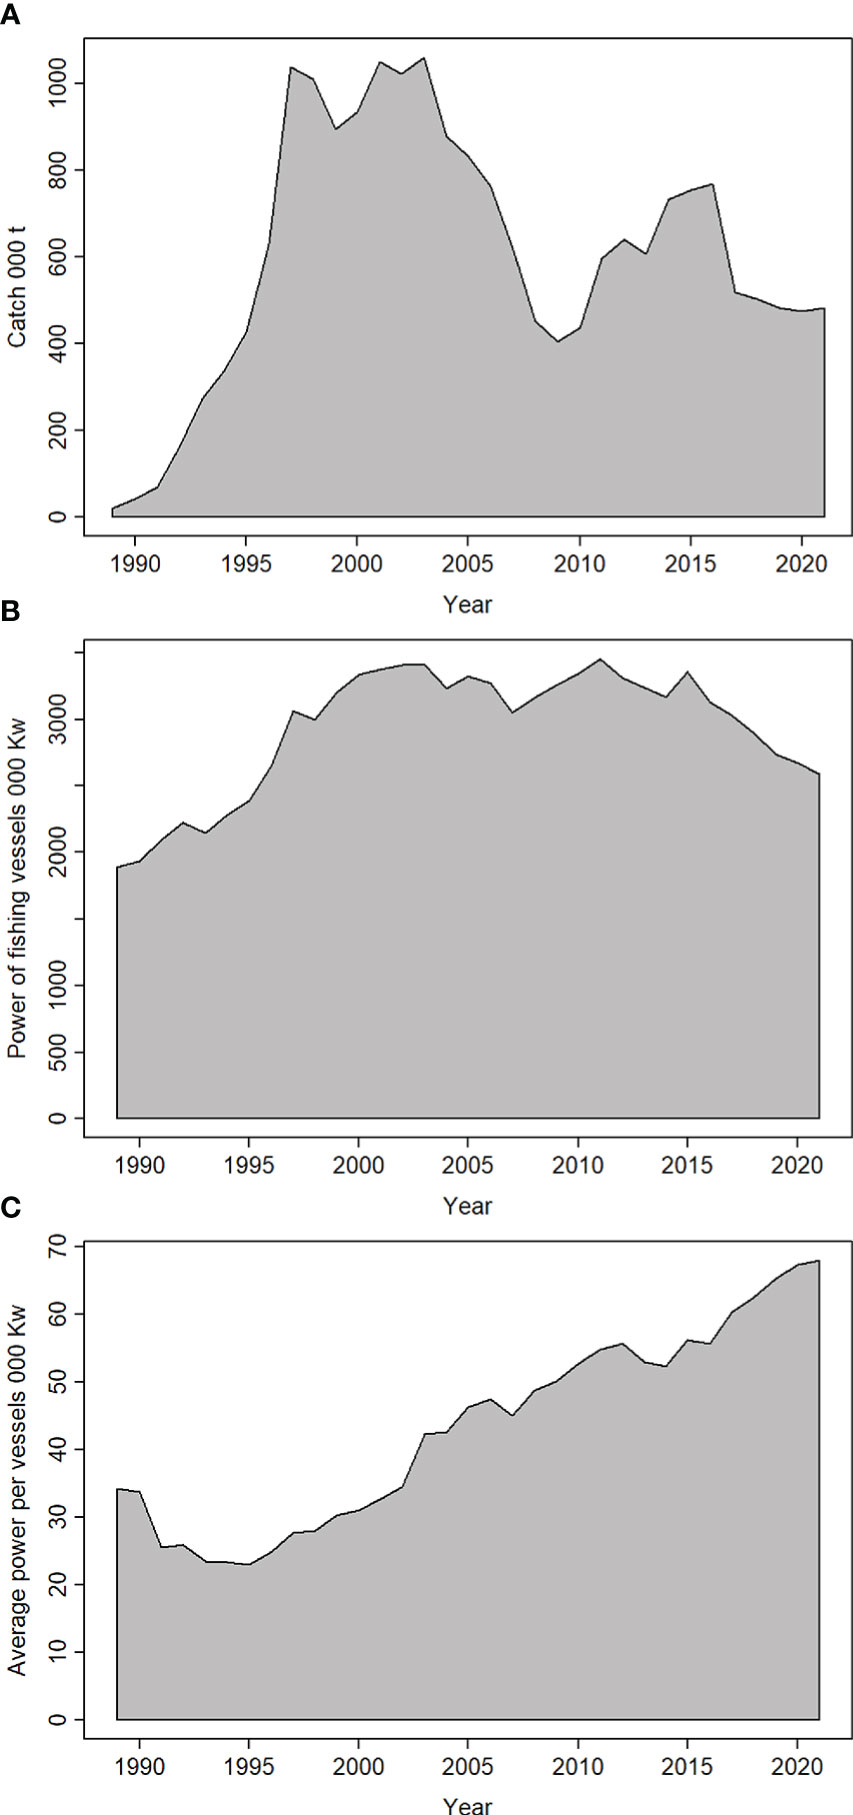
Figure 2 (A) Japanese anchovy catch, (B) power of fishing vessels and (C) average power per vessel from China in the Yellow Sea Large Marine Ecosystem.
Acoustic surveys had indicated that anchovy resources were in a rapid decline since 1996 (Jin et al., 2001; Zhao et al., 2003). In the winter of 2001−2002, the acoustically estimated biomass of the anchovy population in the YSLME was less than 10% of its original level (Zhao et al., 2003). Catch limits have been considered since then, and Jin et al. (2001) conducted a study on the quota management of anchovy based on acoustic and trawl survey data from 1986−2001 using virtual population analysis (VPA), recommending a total allowable catch (TAC) of no more than 100,000 tons. However, catches in subsequent years far exceeded this TAC recommendation by a factor of 48−100 (Figure 2). Su et al. (2021b) suggested that the removal of anchovy from the fish community in the YSLME had the greatest impact on the dispersion of the community structure. With more than 60% of fish in the YSLME predating upon anchovy as their primary food source (Tang and Ye, 1990), the significantly sharp decline in anchovy biomass caused noticeable shifts in the YSLME food web structure (Zhao, 2006). This had serious implications for the food supply to other commercially important populations in this ecosystem (Jin et al., 2001; Zhao et al., 2003), such as causing poor growth of Scomberomorus niphonius (Jin, 2001). Therefore, scientific management of anchovy is essential and urgent to maintain the sustainability of many important fisheries in the YSLME.
The basis for evidence-based management of fisheries to achieve sustainability is accurate stock assessment. Effective marine fisheries management is dependent upon information about stock status estimated by stock assessment models (Maunder and Punt, 2013). Time series proportional to stock biomass (biomass indices, e.g., catch-per-unit- effort, CPUE) are often the most critical among the integrated data required by assessment models (Francis, 2011), with their accuracy ultimately affecting the performance of fisheries management strategies. Therefore, biomass indices are often considered as fundamental for empirical assessments of stock status in managing landings worldwide (Thorson et al., 2015).
The survey biomass index produced by statistical processing of data extracted from fishery-independent scientific surveys, was intended to be the proxy for population abundance (Maunder and Punt, 2004; Thorson et al., 2015). The reason for this is that scientific surveys provide good spatial coverage of fish population distributions and have survey protocols (including survey timing and survey norms) that are consistent over time. Moreover, there is a preponderance of research on effective practices for standardizing treatments when estimating CPUE from survey data to improve their biomass representation (Thorson and Barnett, 2017).
Unfortunately, many exploited fish populations are not monitored through fishery-independent surveys due to their high cost and time consuming requirements (Grüss et al., 2019). For most developing countries, survey biomass index is difficult to promote, while nominal fishery CPUE is more accessible. For example, in China, nominal CPUE from the YSLME commercial anchovy fishery can be calculated by dividing the catch by the total power of the vessels, and these two types of data are recorded in the China Fishery Statistical Yearbook (Fisheries Bureau of the Ministry of Agriculture and Rural Affairs, 2022). But nominal CPUE does not necessarily track changes in biomass under all circumstances. Commercial fishers tend to fish in areas with high fish densities, and with increasing experience, advanced instrumentation, and greater efficiency in fishing operations, catch rates can increase or be maintained despite declining stock biomass until the fishery eventually collapses (Harley et al., 2001). This was the case for the Gadus morhua fishery in eastern Canadian waters (Walters and Maguire, 1996). In China, the representativeness of nominal CPUE as a proxy for stock biomass has also been doubtful. This is because total vessel power does not account for technological advances, and so has proven to be a poor indicator of fishing mortality (Han et al., 2021; Han et al., 2022). For the YSLME anchovy fishery, total vessel power existed as a measure of effort long before the present technology was developed and matured, and so does not reflect the true changes in fishing effort and efficiency due to the time course of technology diffusion and adoption of further advances in fishing operations.
Given that scientific surveys are expensive, highly vulnerable to budget cuts, and may be subject to unforeseen events e.g. vessel and instrument failures that make it difficult to obtain consistent long time series, this study attempts to adjust CPUE to reconfigure it to provide a more reliable proxy for biomass, in lieu of a reliable scientific survey biomass index as the main input data for stock assessment modeling. In this study, we used the existing survey biomass index of YSLME anchovy as a reference series to explore this issue by comparing Surplus production model (SPMs) estimates based on survey biomass index with raw commercial CPUE and adjusted CPUE as biomass index inputs. This will help promote the sustainable use of anchovy in China and will assist in assessments of other fisheries around the world that are without access to a reliable survey biomass index.
2 Material and methods
2.1 Survey and fishery data, and fishery CPUE reconfiguration
An index of survey biomass was obtained from acoustic/trawl surveys of anchovy overwintering grounds in the south-central Yellow Sea conducted by the Beidou Project, a collaboration between the Yellow Sea Fisheries Research Institute (YSFRI) and the Institute of Marine Research (IMR, Bergen), during the winter of 1989−1996 and conducted by the YSFRI during the winter of 1997−2021 (Figure 1). Survey vessels were mostly consistent, with the R/V “Bei Dou” used during 1989−2019 and the R/V “Lan Hai 101” in 2020−2021. Survey biomass index consists of two components: an acoustic biomass index and a trawl biomass index. The acoustic biomass index series were from 1989 to 2005 and are publicly available in Jin et al. (2001); Zhao et al. (2003) and Hamre et al. (2005). The acoustic data were acquired with a calibrated SIMRAD EK500/38 kHz split-beam echosounder in the R/V “Bei Dou” (Zhao, 2001). Echo integration was applied to water column signals from 5 m below the transducer to 0.5 m above the detected bottom. The mean acoustic density values for successive 10 m layers as well as those for the entire water column were logged for each Elementary Distance Sampling Unit of 5 nautical miles. Detailed methods for calculating the acoustic biomass index are available in previous publications by Zhu and Iversen (1990), and 2006; Zhao (2001). The period of the trawl biomass index series was from 2001 to 2021. The same gear (a standard bottom trawl with a 24 mm cod-end mesh size and a mouth circumference of 167.2 m) and survey protocols were used throughout the survey (Han et al., 2021). The distribution of stations is shown in Figure 1. Sampling at each station involved trawling for 1h at a speed of 3 knots. The height of the net mouth (net vertical opening) slightly higher (7 m) allows to significantly catch species less related to the bottoms like small pelagics. The abundance, biomass and biological information for anchovy and other species captured were recorded immediately after trawling at each station. The data obtained by trawl were standardized by the method introduced in Han et al. (2020) to generate the trawl biomass index (in kg/km2). The study area encompassed the spatial extent of the anchovy overwintering grounds during January (Figure 1). Thus, the present survey data allow good tracking of the anchovy population biomass. These assessment results of the surplus production models based on the surveys conducted independently of the fishery can be considered as a control for testing the performance of each fishery CPUE (nominal fishery CPUE and adjusted fishery CPUE).
The nominal fishery CPUE (FNcpuey) was derived from the yield (Figure 2A) and the total power of fishing vessels (Figure 2B):
Where Catchy is the landings of anchovy in the YSLME in year y; Powery is the total vessel power in year y. Catch and fishing vessel power for the YSLME consist of data from Jiangsu, Shandong, Liaoning, and Hebei provinces and Tianjin city recorded in the China Fishery Statistical Yearbook (Fisheries Bureau of the Ministry of Agriculture and Rural Affairs, 1989-2022) from the Bureau of Fisheries and Fishery Administration of Ministry of Agriculture and Rural Affairs. The time series are shown in Figure 2. Fishing vessel power data provides the only long time series effort data available in China and is widely used or considered in Chinese fisheries research (e.g., Liu et al., 1990; Lin et al., 2016; Liu et al., 2017; Han et al., 2021; Han et al., 2022). However, these data do not capture advances in the development of fishing technology, vessels and gear. Applying the nominal fishery CPUE obtained from this data directly as a proxy for biomass would be problematic.
We hypothesize that alternative forms of CPUE that should be better as biomass proxies, can be obtained by adjusting or reconfiguring nominal CPUE to take into account the advances in fishing efficiency resulting from technological developments in the fishery. Here, we consider three configurations of CPUE as candidate proxies:
(1) The power of individual fishing vessels has increased rapidly since 1995 and continued to increase until 2021 (Figure 2C). The importance of vessel power in standardizing CPUE in commercial fishery production has long been recognized (Marchal et al., 2001). The increase in power of each vessel is often accompanied by improvements in vessel performance, including the installation of advanced instruments, increased cruising capability and sailing speed, improved fishing design. These improvements eventually led to an increase in fishing efficiency over time, i.e., more fish were caught per unit of fishing effort than were previously caught at the same stock level. The same situation has been previously documented for Chinese fishing vessels (Tang and Ye, 1990). Taking into account the strong link between growth in size of individual vessels and their fishing efficiency (Tang and Ye, 1990), an alternative CPUE (FAcpuey) trend can be obtained (Figure 3) by multiplying the nominal CPUE values by the average power per vessel:
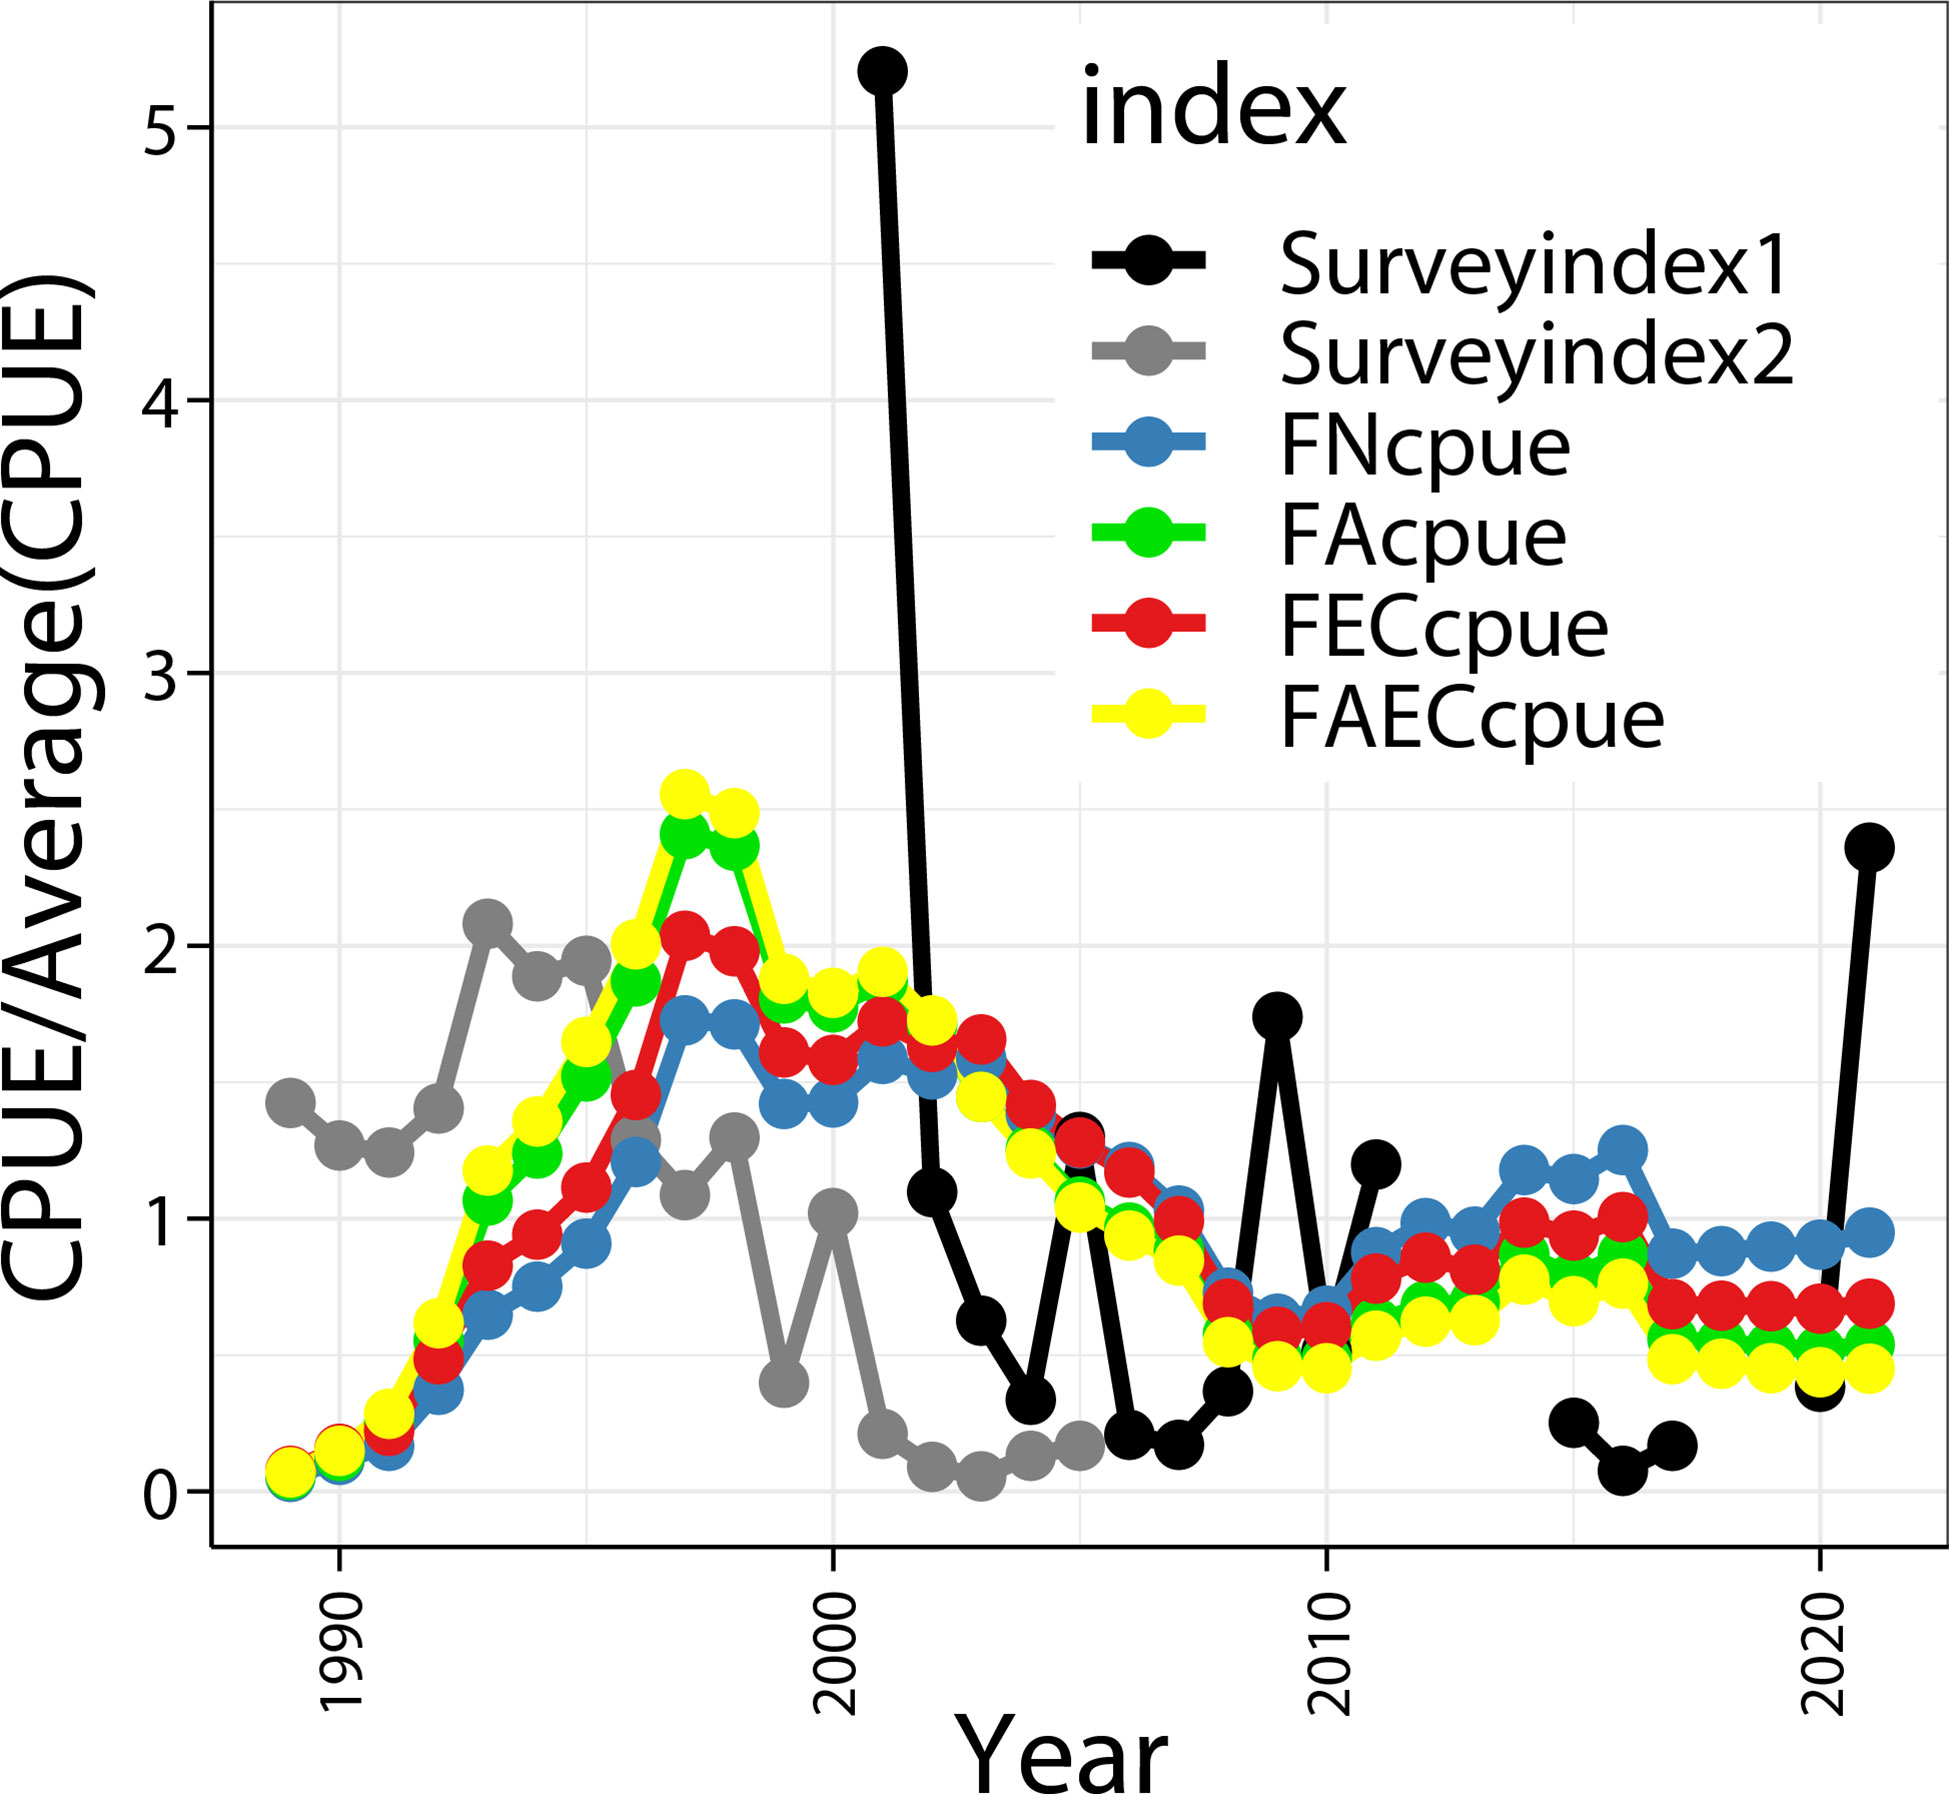
Figure 3 Comparison of trends in two scientific survey biomass indexes and four forms of fishery CPUE. The trend values here are provided in the form of CPUE/Average(CPUE). Surveyindex1 was obtained from the 2001-2021 trawl survey. surveyindex2 was obtained from the 1989-2005 acoustic survey. FNcpue is the nominal commercial fishery CPUE. FAcpue is the commercial fishery CPUE accounting for average power per vessel. FECcpue is the commercial fishery CPUE accounting for effort-creep. FAECcpue is combination of both FAcpue and FECcpue.
Where vessel numbery is number of fishing vessels; is average power per vessel (Figure 2C).
(2) When CPUE is derived from fishery dependent catch and effort, instead if independent surveys, many scholars believe that an effort-creep correction for CPUE is necessary as this renders CPUE more responsive to changes in stock biomass by allowing for an increase in fishing efficiency over time (Palomares and Pauly, 2019; Froese et al., 2020). Therefore, fishery CPUE accounting for effort-creep (FECcpuey) can be expressed as:
Where FNcpuey is the Fishery nominal CPUE; y1is the first year in the time series. Based on studies of increase in vessel fishing power, Palomares and Pauly (2019) recommended that the average percentage increase in fishing efficiency p should be set at 2% for fisheries where reliable estimates of p are unavailable. Therefore, we set p equal to 0.02 for our analysis.
(3) A third alternative CPUE (FAECcpuey) configuration is a combination of both FAcpue and FECcpue by considering both (1) and (2) adjustment methods. It can be expressed as:
Where now p1 set equal to 0.01 is also considered to compensate for possible correlation between FAcpuey and FECcpuey.
MacKinson et al. (1997) suggested that both schooling habit and advances in fishing techniques have led to an increase in the catchability of many small pelagic fish. There is currently no evidence that YSLME anchovy aggregated to its preferred habitat during periods of population decline. Even if such a situation existed, it would have a similar effect to the improvement of fishing technology, that is, it would lead to an increase in the catchability of anchovy. To some extent, this does not affect the objective of this study: to test which adjustment is closer to the true population abundance by reconfiguring commercial fishery CPUE.
2.2 JABBA assessment modeling
Surplus production models (SPMs) are important quantitative tools suitable for estimating the stock status of data-limited populations (Worm et al., 2009; Branch et al., 2011), which can provide more objective estimates than catch-only methods (Branch et al., 2011). Therefore, SPM is an indispensable stock assessment tool for fisheries resource management and biological conservation in a large number of developing countries with limited and moderate data (Punt and Szuwalski, 2012; Dichmont et al., 2016). JABBA (Just Another Bayesian Biomass Assessment) is a flexible and user-friendly third-party tool for implementing SPMs that has greatly facilitated and promoted the use of SPMs, such as for billfish assessment (Mourato et al., 2018; Winker et al., 2018).
The surplus production (SP) function of JABBA is given by:
where r is the intrinsic growth rate; Bt is the population biomass in year t; K is the environmental carrying capacity; if the shape parameter m=2, the functional type of SPM is of the Schaefer form; if m approaches one, the functional type of SPM is the Fox form; and if m is any other value, the functional type of SPM is the Pella-Tomlinson form.
The biomass level BMSY at the maximum sustainable yield (MSY), the corresponding fishing mortality FMSYat MSY, and the fishing mortality rate F can be expressed respectively:
where C is the annual catch.
JABBA is built on a Bayesian state space estimation framework (Winker et al., 2018), and can accommodate multiple biomass index series i. The process equation is expressed as:
where Py=By/K. φ is the initial depletion; ηy is the process error, with ηy ∼ N (0, ); Cf,y is the catch in year y by fishery f.
The observation equation is expressed as:
where qi is catchability; ϵy, i is the observation error, with ; is the observation variance.
The JABBA package (Winker et al., 2018) in the R environment was used to implement the SPM assessment based on the survey biomass index, nominal commercial fishery CPUE, and its adjusted indices, to evaluate the performance of the reconfigured alternatives. Based on the available indices, the following seven scenarios were selected for the present study.
Scenario #1 “Survey biomass index”: Using the time block option in JABBA, both the 1989−2005 acoustic biomass index series and the 2001−2021 trawl biomass index were used as model input data. This was because the two indices are obtained with different catchability. In this scenario, three functional types of SPMs (Schaefer, Fox and Pella-Tomlinson) were used to fit the data and the optimal model was selected based on the deviance information criterion (DIC).
Scenario #2 “Nominal Fishery CPUE starting in 1989”: The most common fishery CPUE format in China mentioned in Section 2.1, with available records for anchovy beginning in 1989. For comparative purposes, the selected model type for Scenario #2 is the optimal functional type of SPM identified in Scenario #1.
Scenario #3 ‘Fishery CPUE accounting for average power per vessel starting in 1989’: The data used were adjusted by considering the growth in power of individual fishing vessels described in Section 2.1, and again, the type was the optimal SPM selected in Scenario #1.
Scenario #4 ‘Fishery CPUE accounting for effort-creep (corrected by 2%•y-1) starting in 1989’: The data starting in 1989 were fishery CPUE corrected according to the method of Palomares and Pauly (2019) mentioned in section 2.1, and the type is the optimal SPM selected in Scenario #1.
Scenario #5 ‘Fishery CPUE accounting for both average power per vessel and effort-creep (corrected by 1%•y-1) starting in 1989’: The data starting in 1989 were CPUE corrected according to the combination of considering the growth in power of individual fishing vessels described in Section 2.1, and effort-creep mentioned in section 2.1, and the type is the optimal SPM selected in Scenario #1.
1900Scenario #6 “Nominal Fishery CPUE starting in 1993”: Considering the diffusion of fishing techniques and fisheries for anchovy and in combination with the comparison of trends in Figure 3, the year of the beginning of the series was chosen as 1993 instead of 1989, when records began. The other settings are the same as in scenario #2.
Scenario #7 ‘Fishery CPUE accounting for average power per vessel starting in 1993’: This scenario is identical to Scenario #3 except that the time series starts in 1993.
Scenario #8 ‘Fishery CPUE accounting for effort-creep (corrected by 2%•y-1) starting in 1993’: This scenario is identical to Scenario #4 except that the time series starts in 1993.
Scenario #9 ‘Fishery CPUE accounting for both average power per vessel and effort-creep (corrected by 1%•y-1) starting in 1993’: This scenario is identical to Scenario #5 except that the time series starts in 1993.
For all scenarios, the intrinsic growth rate r was assumed to follow a log-normal prior (mean=log(1.05), sd=0.122), based on the population growth information for Anchovy (Engraulis japonicus) on Fishbase (Froese et al., 2016). The a priori range of the environmental carrying capacity K was obtained according to the calculation rules of Froese et al. (2016) and is entered in log-normal form (Winker et al., 2018), assuming a mean value of 3889.185 t, CV = 0.37.
Given that the anchovy fishery commenced during the late 1980s to early 1990s (Jin et al., 2005), qualitative stock biomass information can be converted to an a priori range of the ratio of biomass to environmental carrying capacity B/K according to Froese et al. (2020) and Froese (2019). The initial depletion prior (φ=B1989/K or φ=B1993/K) was applied as a log-normal distribution with a mean value of 0.875 and CV=0.1 in 1989/1993. From the late 1980s to 1993, the anchovy catch was very low (Figure 2A), which we believe represented a technological adoption phase in the development of the anchovy fishery. Therefore, we set the same initial depletion prior for 1989 and 1993.
All other settings follow the default settings recommended by JABBA (Winker et al., 2018, https://github.com/jabbamodel/JABBA). For example, the priors for the observation estimate variance and the process error were set to ∼1/gamma(0.001, 0.001) and ∼1/gamma(4, 0.01) (Meyer and Millar, 1999; Millar and Meyer, 2000), respectively; catchability priors were set to qi∼1/dgamma (0.001,0.001). JABBA and the rest of the data analysis and plotting in this paper are performed in the R language environment (R Development Core Team, https://www.r-project.org/). We used retrospective analysis to check the robustness of the condition estimates (Mohn, 1999; Hurtado-Ferro et al., 2015). Model projections of biomass for future years were used to explore the total allowable catch (TAC) for sustainable use of the fishery.
3 Results
The biomass index from fishery independent surveys during 1989−1992 had high values, whereas the fishery dependent CPUEs were in a trough (Figure 3). The survey biomass index during 1996−2003 implied a collapse of anchovy resources, where the fishery dependent CPUEs showed high biomass values and a relatively slow rate of decline. Reconfiguration of the fishery CPUEs significantly improved this situation i.e. reduced the difference between fishery independent survey and dependent CPUE trends, relative to the difference from the nominal fishery CPUEs.
The Pearson correlation coefficients of the four forms of fishery CPUE (nominal and adjusted) ranged from 0.78 to 0.99, among which the correlation between FAECcpue and FNcpue was relatively weak. The overlap of the two survey indices (trawl index and acoustic index) had similar trend (Figure 3) and relatively high correlation (0.77). The correlation coefficients between trawl index and four forms of fishery CPUE (FNcpue, FAcpue, FECcpue and FAECcpue) were 0.28, 0.45, 0.34 and 0.46, respectively. The correlation coefficients between acoustic index and four forms of fishery CPUE were -0.57, -0.24, -0.48 and -0.18, respectively. In general, the trend change in fishery CPUE was delayed by about 3 years compared to that of the survey index (Figure 3).
In the present study, two MCMC chains were used for scenario. Each model was run for 30,000 iterations, sampled with a burn-in period of 5,000 for each chain and a thinning rate of five iterations. All scenarios based on these biomass indices satisfied the diagnostic tests of Geweke (1992); Gelman and Rubin (1992) and Heidelberger and Welch (1992) and the visual evaluation of the stationary behavior of MCMC chains, with the model converging in each instance (Supplementary Figures 1, 2).
3.1 Status estimates based on survey biomass index
The most parsimonious (optimal) SPM model based on DIC-selection for scenario #1 was the Fox model (Table 1), for which the JABBA plots showed that the hypothetical prior and estimated posterior distributions of the anchovy parameters had no evidence of serious prior misspecification (Figure 4). The predicted relative biomass trend (Figure 5A) revealed a dramatic decline in the anchovy resource from 1992 to 2008, followed by a recovery trend. Retrospective examination suggested a moderate retrospective pattern (average Mohn’s ρ = 1.54) for the most the most recent 7 years (Figure 5B).
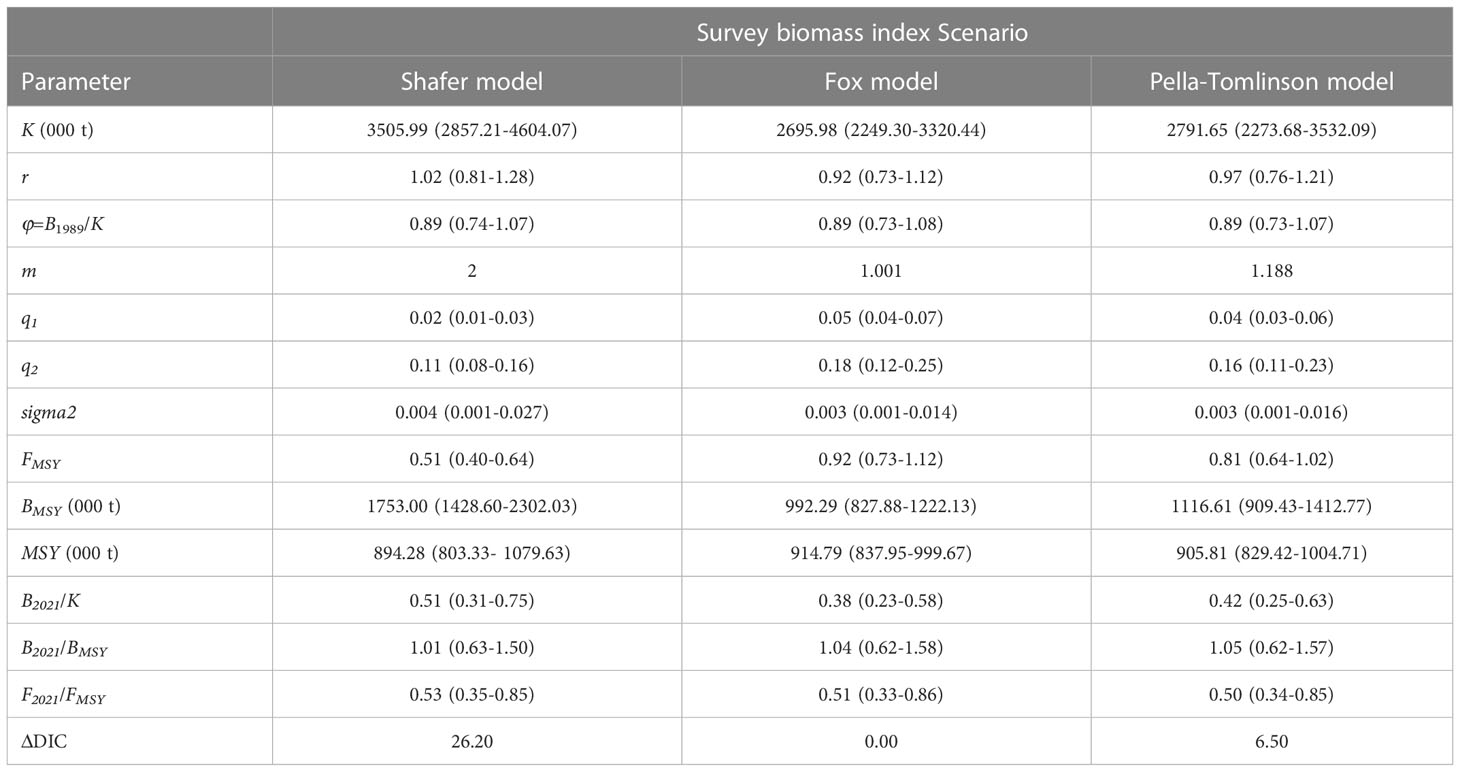
Table 1 Summary of parameter estimates and 95% Bayesian credible intervals (showed in parentheses) from the JABBA scenario based on the Small yellow croaker scientific survey index.
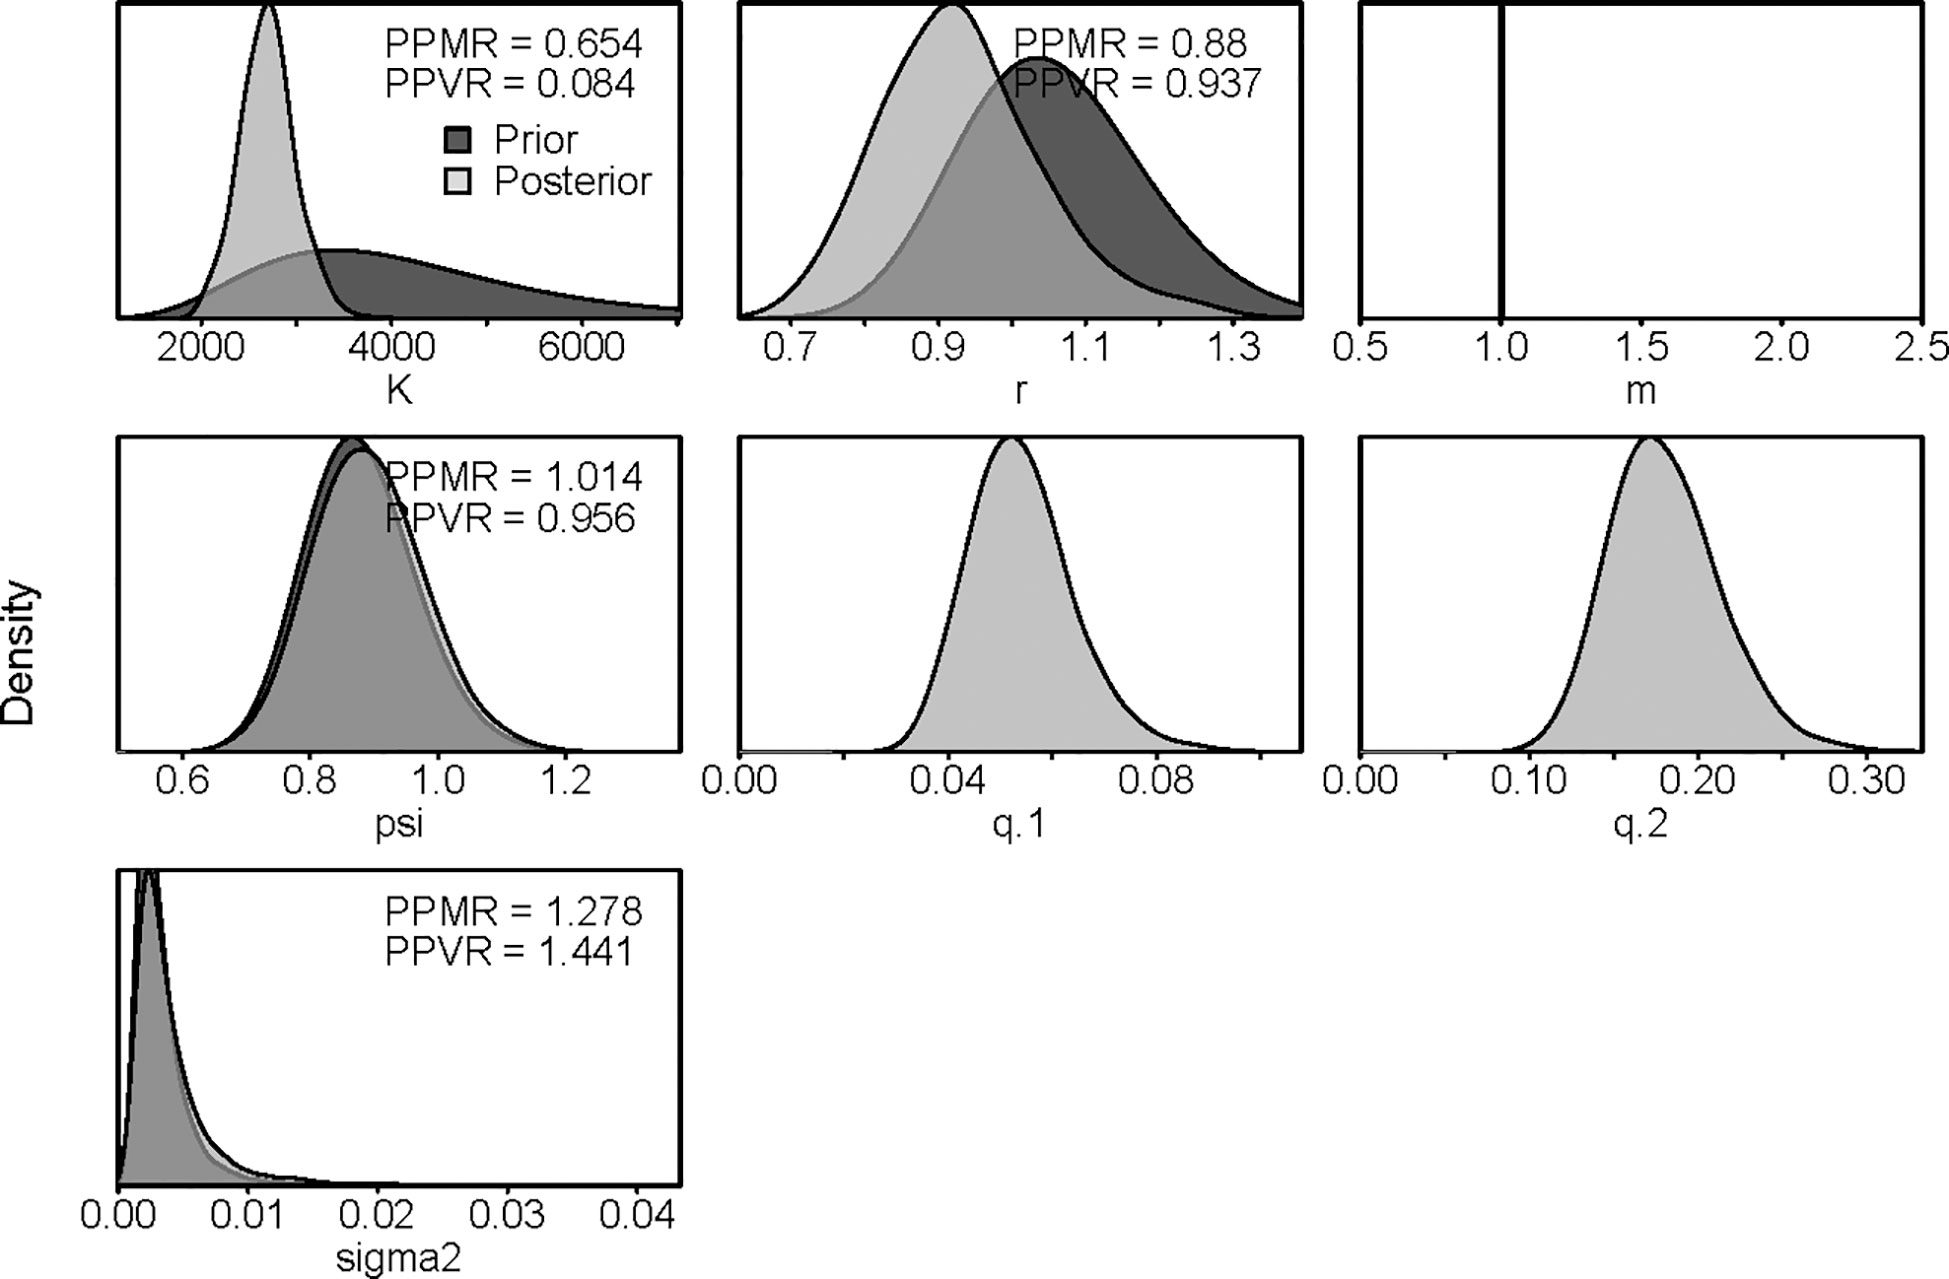
Figure 4 The prior and posterior distributions of key JABBA (Fox scenario) model parameters for Japanese anchovy based on the survey biomass index. PPMR: Posterior -Prior Mean Ratio; PPVR: Posterior-Prior Variance Ratio.
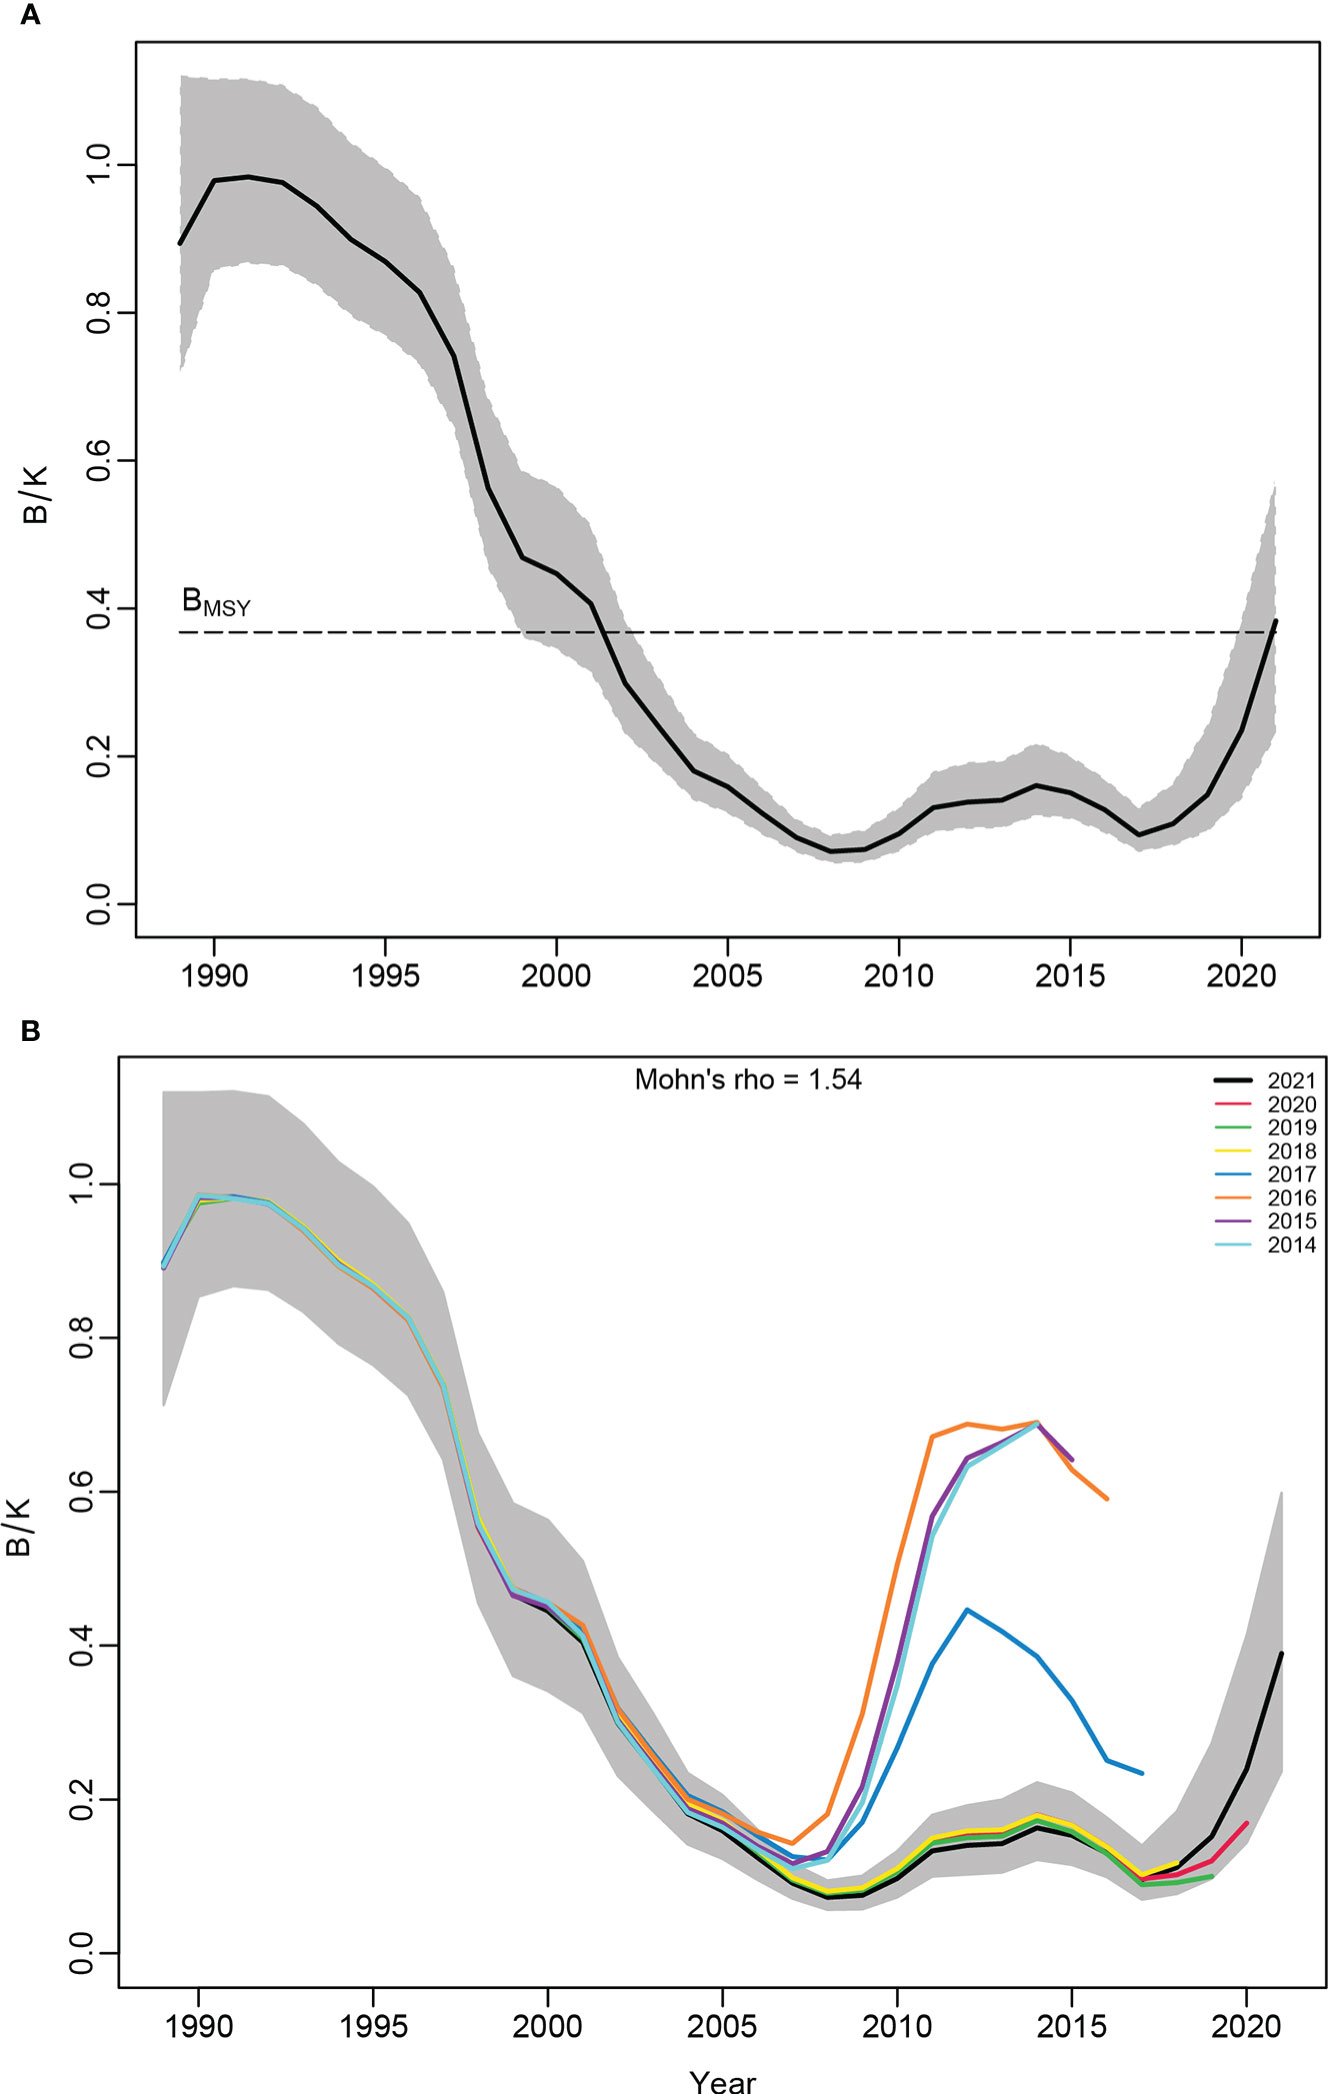
Figure 5 (A) Biomass trajectories with 95% confidence intervals and (B) retrospective trajectories (year label and the mean Mohn’s ρ is 1.54) for the Japanese anchovy Fox-model based on survey biomass index.
Scenario #1 using the survey biomass index as the biomass measure indicated that the resource (Figure 6A) was in a depleted state (relative biomass level B/BMSY < 1) from 2002 to 2020; and was being overfished (relative fishery mortality level F/FMSY > 1) from 2001 to 2019, as defined by Palomares et al. (2018). The current biomass (B2021) was 4% higher than BMSY when the catch was at the maximum sustainable yield MSY and the fishing mortality (F2021) was 49% lower than FMSY when the catch reached MSY (Table 1). The estimated final year results indicated a healthy stock level according to the definition of Froese et al. (2020). In addition, the Kobe plot showed that the credible intervals for the resource status in 2021 were distributed only within the yellow and green sectors, i.e., the areas representing recovered and healthy status (Figure 6A). The cumulative probabilities of the two areas indicated that the population was currently had a 42.4% probability of being in recovery with a 56.7% probability of a healthy status. If the yield remains at the 2018−2021 production level (i.e., 480,000t−510,000t), then the biomass would be expected to continue to increase because the surplus production (SP) was substantially higher than recent catch levels (Figure 6B).
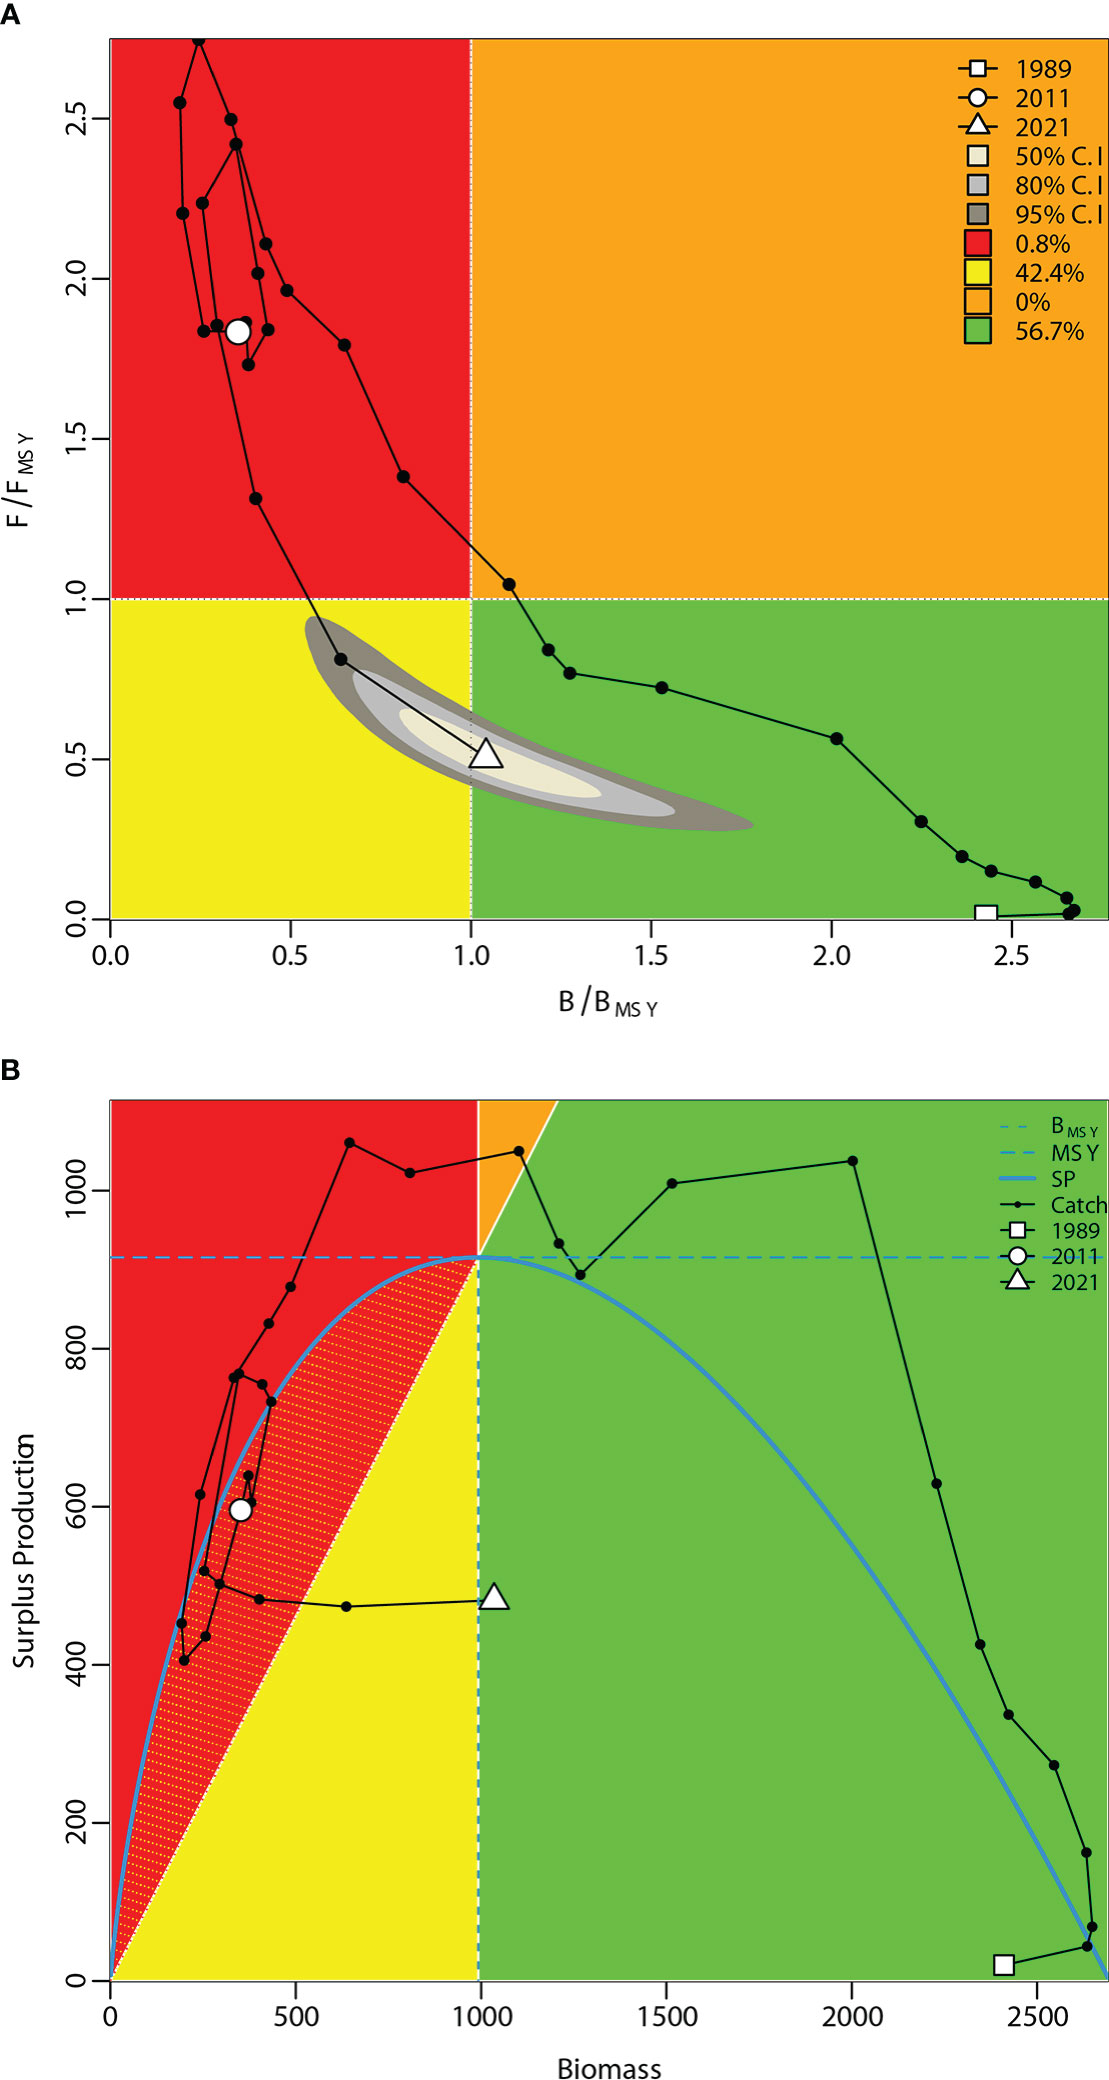
Figure 6 Kobe phase plot (A) and SP-phase plot (B) for the Japanese anchovy JABBA Fox-model based on survey biomass index.
3.2 Status estimates based on fishery dependent CPUE
As with Scenario #1, retrospective examination of relative biomass trends in scenarios #2, #3, #4, #5, #6, #7, #8 and #9 also showed a low or moderate retrospective pattern for the last seven years (Supplementary Figures 3, 4), with mean Mohn’s ρ ranging from -0.01 to 0.11.
The estimated MSY, B2021/BMSY for scenarios #2, #4, #6 and #8 were higher than the estimates from Scenario #1 (Table 2); and the estimated MSY and B2021/BMSY for scenarios #3, #5, #7 and #9 were lower than the results from scenario #1. Among them, the estimated values of scenarios #3 and #8 were closest to the results (MSY and B2021/BMSY) of Scenario #1 (6.55%, 7.69% and -4.27%, 13.46% difference, respectively). The estimated current fishing mortality F2021/FMSY for scenarios #2, #4, #6, and #8 were all lower than the outputs for Scenario #1; and the estimated F2021/FMSY for scenarios #3, #5, #7 and #9 were higher than that of Scenario #1. Among them, the estimated values of scenario #3 and #8 were most similar to the F2021/FMSY outputs of Scenario #1 (-15.69% and 15.69% difference, respectively).
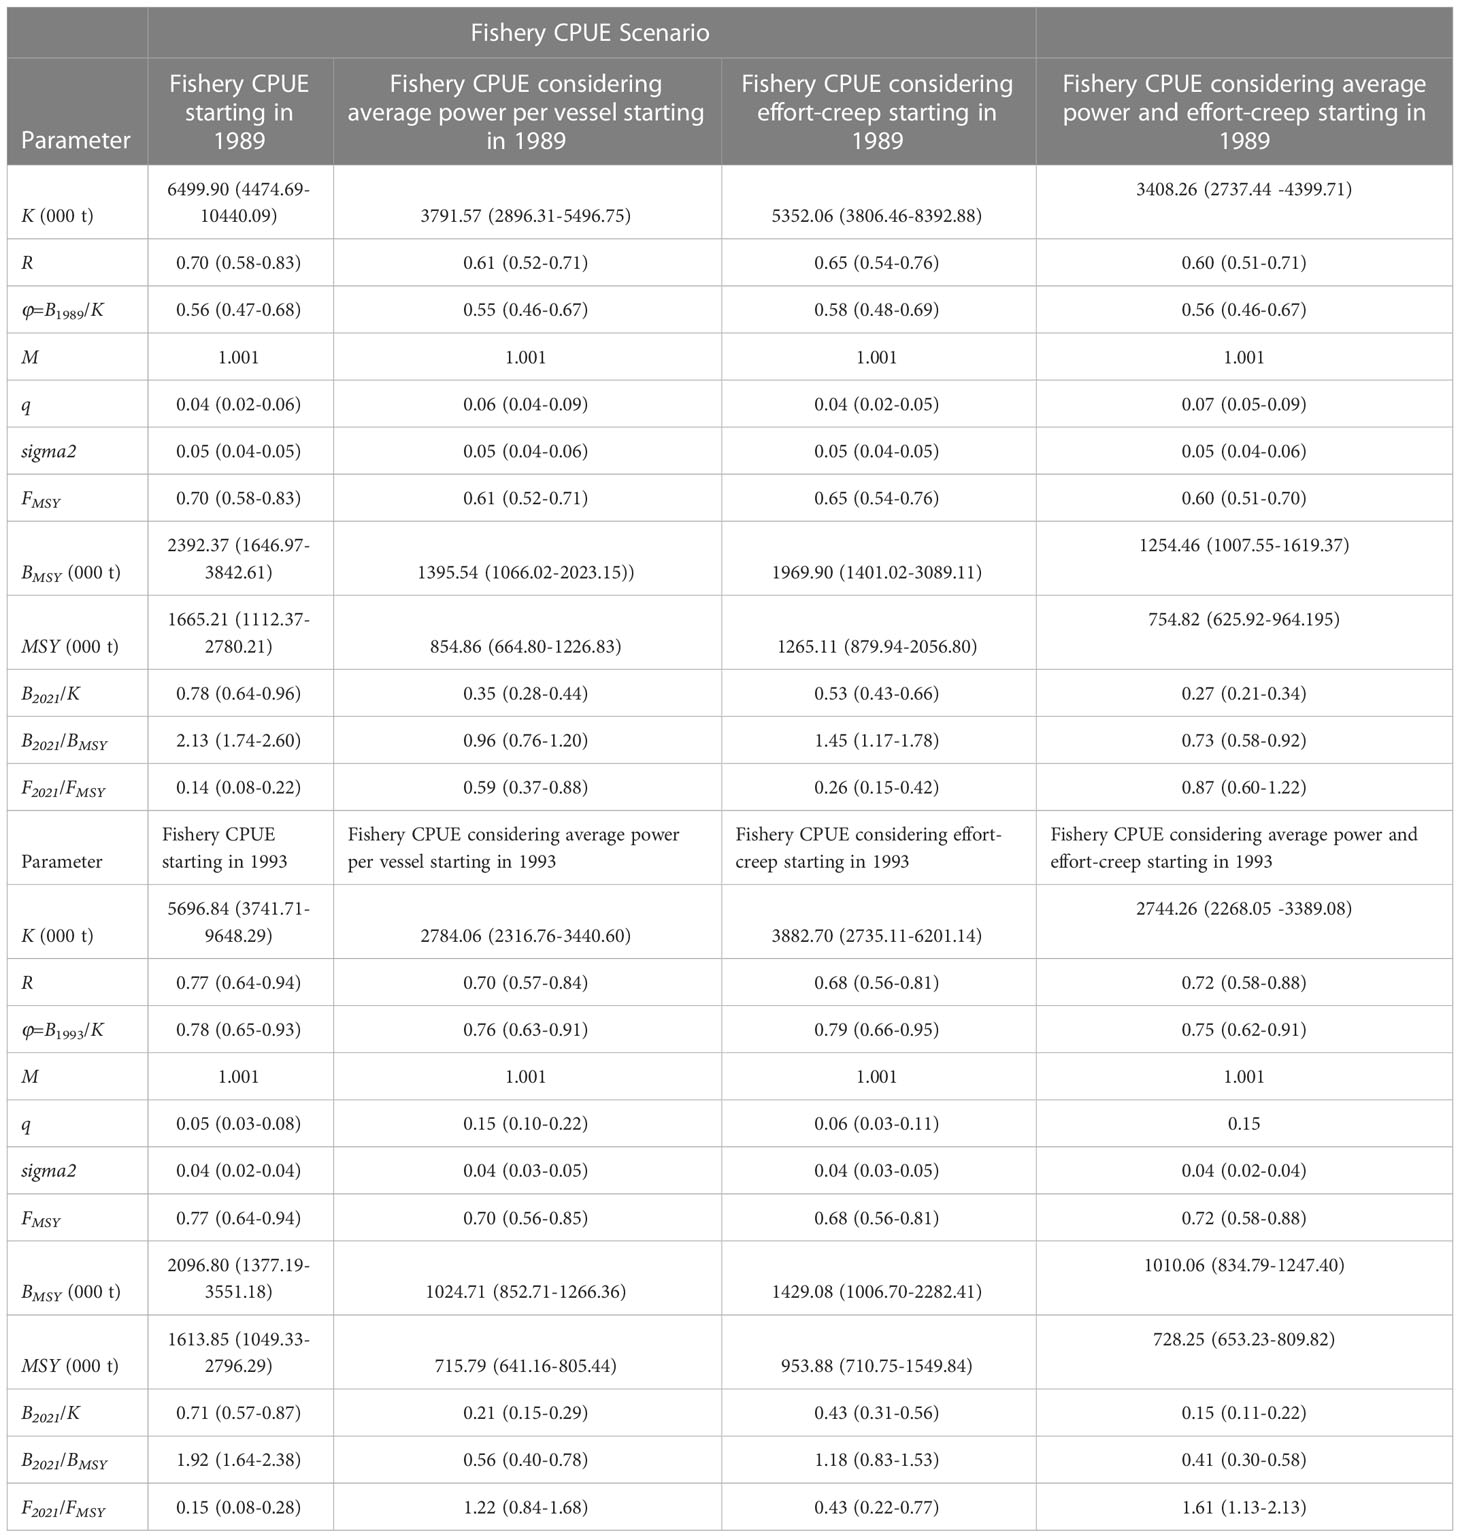
Table 2 Summary of parameter estimates and 95% Bayesian credible intervals (showed in parentheses) from the JABBA scenario based on the Small yellow croaker fishery CPUE index and Schaefer model.
Scenarios #2, #3, #4, #5, #6, #7, #8 and #9 estimated that the posterior stock status in 2021 was healthy (100% probability, Supplementary Figure 5A), recovering (62.8% probability, Supplementary Figure 5C), healthy (100% probability, Supplementary Figure 5E), recovering (78.1% probability, Supplementary Figure 5G), healthy (100% probability, Supplementary Figure 5B), overfished (85.8% probability, Supplementary Figure 5D), health (77.1% probability, Supplementary Figure 5F), and overfished states (99.3% probability, Supplementary Figure 5H), respectively. The SP phase diagram (Supplementary Figure 6) indicated that by maintaining current catch levels, all fisheries CPUE scenarios forecasted that the biomass should increase. The most conservative scenario in this study (Scenario #9) predicted that a total allowable catch (TAC) of no more than 600,000 t could maintain a relatively constant level of biomass (Supplementary Figure 8D). Scenarios #3 (with Supplementary Figure 7B), #5 (with Supplementary Figure 7D), #7 (with Supplementary Figure 8B) and #8 (with Supplementary Figure 8C) also supported similarly conservative TACs. The JABBA model showed robustness in model sensitivity runs with diverse initial depletion priors (increase/decrease the prior value by 5%), producing almost similar results under the same scenarios (Supplementary Table 1; Supplementary Figures 9, 10).
In summary, JABBA outputs of stock status and fishery reference points (Supplementary Figure 5) based on the CPUE time series beginning in 1993 (scenarios #6, #7, #8 and #9) were more conservative than those for scenarios #2, #3, #4 and #5 with time series beginning at 1989 when fishery had just commenced its development. The JABBA scenarios based on the nominal CPUE and the CPUE adjusted for effort-creep, FECcpuey, were more optimistic than scenarios based on the survey biomass index, whereas scenarios with CPUE adjusted for average power per vessel, Facpuey and CPUE adjusted for both average power per vessel and effort-creep, FAECcpuey, were more conservative. Outputs based on the adjusted CPUE, were closer to the JABBA results based on the survey biomass index than were those for the nominal CPUE, indicating that the three adjusted CPUEs (especially the first two configurations, FAcpuey and FECcpuey), were clearly effective in improving the reliability of the time series. The final year’s stock status results from the survey-based JABBA output lay between the JABBA estimates of the first two adjusted CPUEs (FAcpuey and FECcpuey). Therefore, in the absence of a fishery independent survey biomass index, a combination (average) of the two improved fishery CPUEs (i.e., FAcpuey and FECcpuey) should provide the best assessment to guide fishery management.
4 Discussion
The inputs to the surplus production models (SPMs) require only observations of commercial landings and a biomass proxy, such as commercial catch-per-unit- effort (CPUE) or indices educed from scientific surveys (Polacheck et al., 1993). Moreover, since their initial development there have been tremendous advances in SPMs to enhance the accuracy of model estimates, such as, the application of stochastic process and observation errors (Punt, 2003; Thorson and Minto, 2015), techniques for Bayesian state space modeling (Meyer and Millar, 1999; Thorson et al., 2014), and time blocks that allow for significant changes in catchability over time (Carvalho et al., 2014). These factors have allowed SPMs to remain, to date, the primary means for scientific assessing stock status when only limited or moderate data are available.
Conservation management of fisheries based on scientific assessments helps to maintain the stability of ‘blue food’ exports and has promoted the recovery of some depleted stocks (Hilborn, 2007; Worm et al., 2009). Conservation effectiveness largely depends on the quality of fishery reference point values obtained from model assessments. The availability and quality of data largely determine the quality of assessments (Parker et al., 2018), and the suspicion of quality assessment that has led to a debate about the basis of the management of many fisheries throughout the world (Beddington et al., 2007; Hilborn, 2007). The accuracy of the results from SPMs, as widely used empirical models, is strongly influenced by data quality, such as the reliability of the input CPUE data (Parker et al., 2018). Therefore, the SPM JABBA was used as a means of testing the improvement in quality of fishery dependent input rendered by adjustment of the nominal fishery CPUE, using the gap between assessments based on adjusted (reconstructed) fishery dependent CPUE and scientific CPUE. Selection of improved fishery dependent CPUE enables better tracking biomass change trends, thereby improving its reliability in setting reference points for fisheries management decisions.
In this study, we explored this approach to improving fisheries management guidance via the YSLME anchovy fishery, because it has been the most productive fish species in China, occupying an important position in the marine fisheries economy of China. Since 1996, following commencement of the summer fishing suspension system (moratorium), the winter fishing grounds in the central and southern Yellow Sea have become the main fishing grounds for anchovy each year (Jin et al., 2005). Therefore, the CPUE from the winter grounds surveys is the most representative of actual biomass.
The CPUE from the overwintering grounds survey and the SPMs based on this index revealed that the anchovy population had experienced a sharp decline since 1996 and was at its lowest biomass level at the beginning of the 21st century. This change had also been observed by many scholars (e.g., Jin et al., 2001; Zhao et al., 2003; Wang et al., 2006). The anchovy, as a pivotal fish of the YSLME, is a key link in the food web (Zhang, 2018), and this decline subsequently caused a significant negative ecological response. The proportion of anchovy consumed by numerous predatory fish species had drastically reduced and shifted to other prey species (Shan et al., 2011). For example, the dominant food of blue-spotted mackerel Scomberomorus niphonius, a traditionally targeted large commercial fish in the YSLME, shifted from anchovy to other species (Mou et al., 2018), negatively affecting its growth (Jin, 2001). This shift led to a decrease in the overall nutrient level of the YSLME (Zhang and Tang, 2004; Zhang et al., 2007) and a weakening/erosion of the pelagic food chain (Zhang, 2018), which adversely affected marine carbon sequestration, along with material and energy flows within the food web, thereby reducing ecosystem productivity (Zhang et al., 2015). In other words, it is thus clear that the decline of anchovy population had serious impacts on the sustainable use of other commercially important populations in the ecosystem. Rapidly capturing changes in anchovy resource status using stock assessment models and taking timely management actions are important to avoid/lighten negative ecological impacts. However, scenarios #2, #4, #5 and #6 in this study did not reflect the decline in anchovy biomass and failed to guide timely management policy adjustments. Scenarios #3, #7, #8, and #9 significantly improved this situation, with Scenario #7 and #9 tracking stock size decline more effectively. Our reconstruction/adjustment of fishery CPUE has a good effect in redressing the main problem.
In addition, we propose to use the improved fishery CPUE series starting from 1993 or later, because both the fishery CPUE series before 1993 and its improvements differ significantly from the survey biomass index and the theoretical true biomass index and are highly unrealistic. The JABBA scenarios for the fishery dependent CPUE series starting in 1989 (nominal and improved) also portrayed a very low stock size followed a rapidly recovering phase prior to 1993, which is uncharacteristic for a fishery in its nascent exploitation phase. The JABBA scenarios based on the improved fisheries CPUE series starting in 1993 and survey biomass index also detected that anchovy population had been recovering in recent years, but the results were cautiously rather than overly optimistic and more consistent with other SPMS based on fisheries CPUE (Zhai et al., 2020). The result of the JABBA stock assessment based on survey biomass index lay between the estimates for the first two improved fishery dependent CPUEs (FAcpuey and FECcpuey), and in the absence of survey biomass index, we recommend combining the assessment results (average) from these two alternatives to guide the anchovy resource management. However, the third adjusted CPUE (FAECcpuey) was overestimating the biomass status and overestimating the fishing mortality in recent years. This is due to the fact that this third reconfiguration is a combination of the first two adjustment methods. The first two adjustment methods were both able to account for the improvement in fishing efficiency, and the combination of the two yielded more conservative results. Therefore, the third adjusted index is not recommended.
The trends in the survey, nominal and both types of adjusted fishery CPUEs strongly support the above conclusions. Throughout most of the period analyzed, the trends of the two types of adjusted CPUE (FAcpuey and FECcpuey), relative to the nominal fishery CPUE, were closer to that from the fishery independent survey. As Palomares and Pauly (2019) put it: “…a trawler plowing the sea in the 21st century looks like a trawler at the beginning of the 20th century.” The reason for this is that the nominal fishery CPUE, which ignores the progress of technology, does not fully reflect the changes in biomass. The new technology affects the environment and ecology much more efficiently and strongly than the previous vessels and equipment. Therefore, if we don’t account for progress in fishing technology, vessel construction, and instrument performance, our understanding about exploitation levels and protection of the anchovy, then stocks will fall into the dilemma of managing based on outdated information.
The anchovy has a short life cycle and a wide range of adaptations to differing environmental conditions, so the resource can be highly resilient to changing circumstances (Tang and Ye, 1990; Jin et al., 2005). Jin et al. (2005) concluded that there is no fish species that poses a threat to the anchovy through interspecific competition in the YSLME, and the cycle of change in status of anchovy populations is quite long in terms of environmental changes. The decline of anchovy resources was mainly caused by fishing pressure (Jin et al., 2001; Zhao, 2006). Therefore, scientific evidence-based adaptive management strategies are essential for the recovery and future sustainable use of anchovy resources. The proportion of older mature fish in the YSLME population has declined in recent years and the nearshore spawning biomass has decreased. 2005; Jin et al. (2001) suggested the introduction of quotas and restrictions on vessels to control the rampant increase in fishing mortality.
A total allowable catch (TAC), as an output control, is an important widely applied method of management among current international fisheries resource management (OECD, 2020). The Fisheries Law of the People’s Republic of China mandated the requirement to implement a universal quota fishing system, but it was not until 2017 that the Ministry of Agriculture and Rural Affairs of the People’s Republic of China (2017) issued the Notice on Further Strengthening the Control of Domestic Fishing Vessels and Implementation of Total Allowable Catch Management in the Ocean, which set clear control objectives and provided for the implementation of vessel and catch limits in the form of a national marine TAC schedule. Anchovy catch was significantly controlled, which has facilitated the stock recovery since 2018.
Scientific estimation of sustainable TAC is a necessary condition for the implementation of any catch quota system. The most conservative scenario in this study (Scenario #9) predicted that a TAC of no more than 600,000 t. Another study recommended a precautionary TAC control of 500,000 t (Iversen et al., 2001), and considering the availability of food for other economically important fish in this ecosystem (Zhao et al., 2003) and the aforementioned negative ecological effects of anchovy decline, as well as the severe fluctuations common to pelagic fish populations, plus the delayed response to management intervention, we preferred conservative estimates and recommend that a precautionary TAC of 500,000 t should be set. The current catch level is within this precautionary TAC.
At present, to promote accurate assessments of fish resources worldwide, collection new data and the rational use of existing data are far more important than the development of new models (Ovando et al., 2021). Our research has clearly demonstrated this conclusion. Improving existing data by adding new information can improve the accuracy and objectivity of stock assessments and sustainable utilization. We strongly encourage researchers to extensively review and improve existing fisheries statistical datasets to produce more reliable stock assessments (Rousseau et, 2019; Choi et al., 2021). This will promote the implementation of the United Nations (UN) Sustainable Development Goal 14 (SDG14) in the scientific understanding of exploited populations and fisheries (Hilborn et al., 2020; Ovando et al., 2021).
Data availability statement
The original contributions presented in the study are included in the article/Supplementary Material. Further inquiries can be directed to the corresponding author.
Ethics statement
The animal study was reviewed and approved by Animal Ethics Committee of Yellow Sea Fisheries Research Institute.
Author contributions
QH and XS conceived this study. QH conducted to methodology, software, analysis, writing – original draft, visualization. XJ made substantial contribution to data curation, writing – review & editing. HG made substantial contribution to conceptualization, writing – review & editing. All authors contributed to the article and approved the submitted version.
Funding
This work was supported in part by the National Natural Science Foundation of China [42176151]; the Special Fund of Taishan Scholar, and the David and Lucile Packard Foundation; the Natural Science Foundation of Shandong Province [ZR2020QD104], Innovation team of fishery resources and ecology in Yellow and Bohai Seas [2021TD01].
Acknowledgments
We thank the members of the Division of Fishery Resources and Ecosystem of Yellow Sea Fisheries Research Institute, Chinese Academy of Fishery Sciences.
Conflict of interest
The authors declare that the research was conducted in the absence of any commercial or financial relationships that could be construed as a potential conflict of interest.
Publisher’s note
All claims expressed in this article are solely those of the authors and do not necessarily represent those of their affiliated organizations, or those of the publisher, the editors and the reviewers. Any product that may be evaluated in this article, or claim that may be made by its manufacturer, is not guaranteed or endorsed by the publisher.
Supplementary material
The Supplementary Material for this article can be found online at: https://www.frontiersin.org/articles/10.3389/fmars.2023.1102292/full#supplementary-material
References
Beddington J. R., Agnew D. J., Clark C. W. (2007). Current problems in the management of marine fisheries. Science 316, 1713–1716. doi: 10.1126/science.1137362
Branch T. A., Jensen O. P., Ricard D., Ye Y., Hilborn R. A. Y. (2011). Contrasting global trends in marine fishery status obtained from catches and from stock assessments. Conserv. Biol. 25 (4), 777–786. doi: 10.1111/j.1523-1739.2011.01687.x
Carvalho F., Ahrens R., Murie D., Ponciano J. M., Aires-da-silva A., Maunder M. N., et al. (2014). Incorporating specific change points in catchability in fisheries stock assessment models: an alternative approach applied to the blue shark (Prionace glauca) stock in the south Atlantic ocean. Fish. Res. 154, 135–146. doi: 10.1016/j.fishres.2014.01.022
Choi J. H., Lee J. B., Yoon S. C., Kim D. H. (2021). A bioeconomic analysis of the sandfish (Arctoscopus japonicus) management policies of the Eastern Sea Danish fishery in Korea. Sustainability 13, 7868. doi: 10.3390/su13147868
Dichmont C. M., Deng R. A., Punt A. E., Brodziak J., Chang Y. J., Cope J. M., et al. (2016). A review of stock assessment packages in the united states. Fish. Res. 183, 447–460. doi: 10.1016/j.fishres.2016.07.001
Du Y. W. (2016). Study on supply and demand in Chinese fishmeal market (Shanghai, China: Shanghai Ocean University). Available at: https://kns.cnki.net/KCMS/detail/detail.aspx?dbname=CMFD201701&filename=1016912787.nh.
Fisheries Bureau of the Ministry of Agriculture and Rural Affairs (2022). China Fishery statistical yearbook 19892022 (Beijing: China Agricultural Press).
Francis R. I. C. C. (2011). Data weighting in statistical fisheries stock assessment models. Can. J. Fish. Aquat. Sci. 68, 1124–1138. doi: 10.1139/f2011-025
Froese R. (2019) Preliminary user guide for AMSY: Estimating MSY-related fisheries reference points from abundance and resilience. Available at: http://oceanrep.geomar.de/47135/.
Froese R., Demirel N., Coro G., Kleisner K. M., Winker H. (2016). Estimating fisheries reference points from catch and resilience. Fish. Fish. 18, 506–526. doi: 10.1111/faf.12190
Froese R., Winker H., Coro G., Demirel N., Tsikliras A. C., Dimarchopoulou D., et al. (2020). Estimating stock status from relative abundance and resilience. ICES J. Mar. Sci. 77 (2), 527–538. doi: 10.1093/icesjms/fsz230
Gelman A., Rubin D. B. (1992). Lnference from iterative simulation using multiple sequences. Stat. Sci. 7, 457–472. doi: 10.2307/2246093
Geweke J. (1992). “Evaluating the accuracy of sampling-based approaches to the calculation of posterior moments,” in Bayesian Statistics 4: Proceedings of the fourth Valencia international meeting. Eds. Berger J. O., Bernardo J. M., Dawid A. P., Smith A. F. M. (Oxford: Clarendon Press), 169–193.
Grüss A., Walter III J. F., Babcock E. A., Forrestal F. C., Thorson J. T., Lauretta M. V., et al. (2019). Evaluation of the impacts of different treatments of spatio-temporal variation in catch-per-unit-effort standardization models. Fish. Res. 213, 75–93. doi: 10.1016/j.fishres.2019.01.008
Hamre J., Zhao X., Li X. (2005). Report on assessment and management advice for 2005 of the anchovy fishery in the yellow Sea (Bergen, Norway: Institute of Marie Research).
Han Q. P., Grüss A., Shan X. J., Jin X. S., Thorson J. T. (2021). Understanding patterns of distribution shifts and range expansion/contraction for small yellow croaker (Larimichthys polyactis) in the yellow Sea. Fish. Oceanogr. 30, 69–84. doi: 10.1111/fog.12503
Han Q. P., Shan X. J., Jin X. S., Gorfine H., Chen Y. L., Su C. (2022). Changes in distribution patterns for larimichthys polyactis in response to multiple pressures in the bohai Sea over the past four decades. Front. Mar. Sci. 9. doi: 10.3389/fmars.2022.941045
Harley S. J., Myers R. A., Dunn A. (2001). Is catch-per-unit-effort proportional to abundance? J. Fish. Aquat. Sci. 58, 1760–1772. doi: 10.1139/cjfas-58-9-1760
Heidelberger P., Welch P. D. (1992). Simulation run length control in the presence of an initial transient. Oper. Res. 31, 1109–1144. doi: 10.1287/opre.31.6.1109
Hilborn R. (2007). Reinterpreting the state of fisheries and their management. Ecosystems 10, 1362–1369. doi: 10.1007/s10021-007-9100-5
Hilborn R., Amoroso R. O., Anderson C. M., Baum J. K., Branch T. A., Costello C., et al. (2020). Effective fisheries management instrumental in improving fish stock status. Proc. Natl. Acad. Sci. U.S.A. 117 (4), 2218–2224. doi: 10.1073/pnas.1909726116
Hurtado-Ferro F., Szuwalski C. S., Valero J. L., Anderson S. C., Cunningham C. J., Johnson K. F., et al. (2015). Looking in the rear-view mirror: bias and retrospective patterns in integrated, age-structured stock assessment models. ICES J. Mar. Sci. 72 (1), 99–110. doi: 10.1093/icesjms/fsu198
Itoh S., Yasuda I., Nishikawa H., Sasaki H., Sasai Y. (2009). Transport and environmental temperature variability of eggs and larvae of the Japanese anchovy (Engraulis japonicus) and Japanese sardine (Sardinops melanostictus) in the western north pacific estimated via numerical particle-tracking experiments. Fish. Oceanogr. 18 (2), 118–133. doi: 10.1111/j.1365-2419.2009.00501.x
Iversen S. A., Johannessen A., Jin X. S., Li X. S., Zhao X. Y. (2001). Development of stock size, fishery and biological aspects of anchovy based on R/V “Bei Dou”1984–1999 surveys. Mar. Fish. Res. 22 (4), 33–39. doi: CNKI:SUN:HYSC.0.2001-04-006
Jin X. S. (2001). The dynamics of major fishery resources in the bohai Sea. J. Fish. Sci. China 7 (4), 22–26. doi: 10.3321/j.issn:1005-8737.2000.04.006
Jin X. S., Dou S. Z., Shan X. J., Wang Z. Y., Wan R. J., Bian X. D. (2015). Hot spots of frontiers in the research of sustainable yield of Chinese inshore fishery. Prog. Fish. Sci. 36, 124‐131. doi: 10.11758/yykxjz.20150119
Jin X., Hamre J., Zhao X., Li F. (2001). Study on the quota management of anchovy (Engraulis japonicus) in the yellow Sea. J. Fish. Sci. China 8 (3), 27–30.
Jin X. S., Zhao X. Y., Meng T. X., Cui Y. (2005). Biological resource and habitation environment of the bohai and yellow Sea (Beijing, China: Science Press).
Lin D. F., Wang M. C. (1992). Aimed-fishing overwintering anchovy by using pelagic trawl of pair-boat in the southern yellow sea. J. Fish. China 04), 378–382.
Lin Q., Wang J., Yuan W., Fan Z. H., Jin X. S. (2016). Effect of fishing and environmental change on the ecosystem of the bohai Sea. J. Fish. Sci. China 23 (3), 619–629. doi:–10.3724/SP.J.1118.2016.15317
Liu X. X., Wang J., Xu B. D., Xue Y., Ren Y. P. (2017). Impacts of fishing pressure and climate change on catches of small yellow croaker in the yellow Sea and the bohai Sea. Periodical Ocean Univ. China 47 (8), 58–64. doi: 10.16441/j.cnki.hdxb.20160263
Liu X. S., Wu J. N., Han G. Z., Lin J. Q., Lin F. S., Yao Y. M. (1990). Fishery resources investigation and regionalization district in the bohai Sea and the yellow Sea (Beijing, China: China Ocean Press).
Mackinson S., Sumaila U. R., Pitcher T. J. (1997). Bioeconomics and catchability: Fish and fishers behaviour during stock collapse. Fish. Res 31 (1–2), 11–17. doi: 10.1016/S0165-7836(97)00020-9
Marchal P., Nielsen J. R., Hovgård H., Lassen H. (2001). Time changes in fishing power in the Danish cod fisheries of the Baltic Sea. ICES J. Mar. Sci. 58, 298–310. doi: 10.1006/jmsc.2000.1011
Maunder M. N., Punt A. E. (2004). Standardizing catch and effort data: a review of recent approaches. Fish. Res. 70, 141–159. doi: 10.1016/j.fishres.2004.08.002
Maunder M. N., Punt A. E. (2013). A review of integrated analysis in fisheries stock assessment. Fish. Res. 142, 61–74. doi: 10.1016/j.fishres.2012.07.025
Meyer R., Millar R. B. (1999). BUGS in Bayesian stock assessments. Can. J. Fish. Aquat. Sci. 56, 1078–1086. doi: 10.1139/f99-043
Millar R. B., Meyer R. (2000). Non-linear state space modelling of fisheries biomass dynamics by using metropolis-Hastings within-Gibbs sampling. J. R. Stat. Soc C Appl. 49, 327–342. doi: 10.1111/1467-9876.00195
Mohn R. (1999). The retrospective problem in sequential population analysis: an investigation using cod fishery and simulated data. ICES J. Mar. Sci. 56, 473–488. doi: 10.1006/jmsc.1999.0481
Mourato B. L., Winker H., Carvalho F. C., Ortiz M. (2018). Stock assessment of Atlantic blue marlin (Makaira nigricans) using a Bayesian state-space surplus production model JABBA. Collect. Vol. Sci. Pap. ICCAT 75 (5), 1003–1025. Available at: https://www.iccat.int/Documents/CVSP/CV075_2018/n_5/CV075051003.pdf (accessed January 27, 2023)
Mou X. X., Zhang. C., Zhang. C. L., Xu B. D., Xue Y., Tian Y. J., et al. (2018). The fisheries biology of the spawning stock of Scomberomorus niphonius in the bohai and yellow ses. J. Fish. Sci. China 25 (6), 161–169. doi: 10.3724/SP.J.1118.2018.17346
Ovando D., Hilborn R., Monnahan C., Rudd M., Sharma R., Thorson J. T., et al. (2021). Improving estimates of the state of global fisheries depends on better data. Fish. Fish. 00, 1–15. doi: 10.1111/faf.12593
Palomares M. L. D., Froese R., Derrick B., Nöel S.-L., Tsui G., Woroniak J., et al. (2018). A preliminary global assessment of the status of exploited marine fish and invertebrate populations (Vancouver, BC: The University of British Columbia). A Report Prepared by the Sea Around Us for OCEANA.
Palomares M. L. D., Pauly D. (2019). On the creeping increase of vessels’ fishing power. Ecol. Soc 24, 31. doi: 10.2307/26796991
Parker D., Winker H., da Silva C., Kerwath S. (2018). Bayesian State-Space Surplus Production Model JABBA Assessment of Indian Ocean Striped Marlin (Tetrapturus audax), IOTC-2018-WPB16-16_-_MLS_JABBA_Final. Avilable at: https://iotc.org/documents/WPB/16/16-MLS_JABBA (Accessed August 27, 2018).
Pauly D., Christensen V., Guénette S., Pitcher T. J., Sumaila U. R., Walters C. J., et al. (2002). Towards sustainability in world fisheries. Nature 418 (6898), 689–695. doi: 10.1038/nature01017
Polacheck T., Hilborn R., Punt A. E. (1993). Fitting surplus production models: comparing methods and measuring uncertainty. Can. J. Fish. Aquat. Sci. 50, 2597–2607. doi: 10.1139/f93-284
Punt A. E. (2003). Extending production models to include process error in the population dynamics. Can. J. Fish. Aquat. Sci. 60, 1217–1228. doi: 10.1139/f03-105
Punt A. E., Szuwalski C. (2012). How well can FMSY and BMSY be estimated using empirical measures of surplus production? Fish. Res. 134–136, 113–124. doi: 10.1016/j.fishres.2012.08.014
Rousseau Y., Watson R. A., Blanchard J. L., Fulton E. A. (2019). Evolution of global marine fishing fleets and the response of fished resources. Proc. Natl. Acad. Sci. U.S.A. 116 (25), 12238–12243. doi: 10.1073/pnas.1820344116
Shan X. J., Li Z. L., Dai F. Q., Jin X. S., et al. (2011). Seasonal and annual variation in biological characteristics of small yellow croaker Larimichthys polyactis in the central and southern yellow Sea. Prog. Fish. Sci. 32 (6), 7–16. doi: 10.3969/j.issn.1000-7075.2011.06.002
Su C. C., Han Q. P., Zhang Q., Shan X. J., Li F. (2022). Structure and health of the fishery community in the northern Shandong peninsula sea area. Prog. Fish. Sci. 43, 1–10. doi: 10.19663/j.issn2095-9869.20220211001
Su C. C., Shan X. J., Yang T. (2021a). Interannual changes of fish community structure and keystone species in the waters off southern Shandong peninsula from 2016 to 2018. J. Fish. Sci. China 45 (12), 1983–1992. doi: 10.11964/jfc.20200812386
Su C. C., Shan X. J., Yang T., Han Q. P. (2021b). Interdecadal changes in keystone species of fish community during autumn in the yellow Sea. Prog. Fish. Sci. 42 (6), 01–14. doi: 10.19663/j.issn2095-9869.20200525001
Tang Q. S., Ye M. Z. (1990). Development and protection of Shandong offshore fishery resources (Beijing: Agricultural Press), 1–166.
Thorson J. T., Barnett L. A. K. (2017). Comparing estimates of abundance trends and distribution shifts using single- and multispecies models of fishes and biogenic habitat. ICES J. Mar. 74, 1311–1321. doi: 10.1093/icesjms/fsw193
Thorson J. T., Minto C. C. (2015). Mixed effects: a unifying framework for statistical modelling in fisheries biology. ICES J. Mar. Sci. 72, 1245–1256. doi: 10.1093/icesjms/fsu213
Thorson J. T., Ono K., Munch S. B. (2014). A Bayesian approach to identifying and compensating for model misspecification in population models. Ecology 95, 329–341. doi: 10.1890/13-0187.1
Thorson J. T., Shelton A. O., Ward E. J., Skaug H. J. (2015). Geostatistical delta-generalized linear mixed models improve precision for estimated abundance indices for West coast groundfishes. ICES J. Mar. 72 (5), 1297–1310. doi: 10.1093/icesjms/fsu243
Walters C., Maguire J. J. (1996). Lessons for stock assessment from the northern cod collapse. Rev. Fish Biol. Fish 6, 125–137. doi: 10.1007/BF00182340
Wang Y. J., Liu Q., Ye Z. J. (2006). A Bayesian analysis on the anchovy stock (Engraulis japonicus) in the yellow Sea. Fish. Res. 82, 87–94. doi: 10.1016/j.fishres.2006.08.007
Winker H., Carvalho F., Kapur M. (2018). JABBA: just another Bayesian biomass assessment. Fish. Res. 204, 275–288. doi: 10.1016/j.fishres.2018.03.010
Worm B., Hilborn R., Baum J. K., Branch T. A., Collie J. S., Costello C., et al. (2009). Rebuilding global fisheries. Science 325 (5940), 578–585. doi: 10.1126/science.1173146
You Z. B., Zhao X. Y., Li X. S., Sun S., Zhu J. C., Jiang Z. W., et al. (2017). Fan selectivity of codend mesh of pair-trawlers in the yellow Sea. Fish.Sci. 36(4), 436–442.doi: 10.16378/j.enki.1003-1111
Zhai L., Liang C., Pauly D. (2020). Assessments of 16 exploited fish stocks in Chinese waters using the CMSY and BSM methods. Front. Mar. Sci. 7. doi: 10.3389/fmars.2020.483993
Zhang B. (2018). Feeding ecology of fishes in the bohai Sea. Prog. Fish. Sci. 39 (3), 11–22. doi: 10.19663/j.issn2095-9869.20171103001
Zhang B., Tang Q. S. (2004). Study on trophic level of important resources species at high trophic levels in the bohai Sea, yellow Sea and East China Sea. Adv. Mar. Sc. 22 (4), 393–404.
Zhang B., Tang Q., Jin X. (2007). Decadal-scale variations of trophic levels at high trophic levels in the yellow Sea and bohai Sea ecosystem. J. Mar. Syst. 67 (3–4), 304–311. doi: 10.1016/j.jmarsys.2006.04.015
Zhang B., Wu Q., Jin X. S. (2015). Interannual variation in the food web of commercially harvested species in laizhou bay from 1959 to 2011. J. Fish. Sci. China 22 (2), 1–10. doi: 10.3724/SP.J.1118.2015.14299
Zhao X. (2001). The acoustic survey of anchovy in the yellow Sea in February 1999, with emphasis on the estimation of the size structure of the anchovy population. Mar. Fish. Res. China 22 (4), 40–44.
Zhao X. Y. (2006). Population dynamic characteristics and sustainable utilization of the anchovy stock in the yellow Sea. Doctoral Dissertation Ocean Univ. China 2006, 55–114.
Zhao X., Hamer J., Li F., Jin X., Tang Q. (2003). Recruitment, sustainable yield and possible ecological consequences of the sharp decline of the anchovy (Engraulis japonicus) stock in the yellow Sea in the 1990s. Fish. Oceanogr. 12 (4), 495–501. doi: 10.1046/j.1365-2419.2003.00262.x
Keywords: Surplus production model, survey biomass index, fishery sustainability, adjusted fishery CPUE, stock assessment, TAC
Citation: Han Q, Shan X, Jin X and Gorfine H (2023) Exploring reconfiguration of trends in CPUE to model sustainable TAC options for the pivotal YSLME anchovy fishery. Front. Mar. Sci. 10:1102292. doi: 10.3389/fmars.2023.1102292
Received: 18 November 2022; Accepted: 24 January 2023;
Published: 03 February 2023.
Edited by:
Francois Bastardie, Technical University of Denmark, DenmarkReviewed by:
Leire Ibaibarriaga Contreras, Technology Center Expert in Marine and Food Innovation (AZTI), SpainJohn R. Wallace, National Oceanic and Atmospheric Administration (NOAA), United States
Copyright © 2023 Han, Shan, Jin and Gorfine. This is an open-access article distributed under the terms of the Creative Commons Attribution License (CC BY). The use, distribution or reproduction in other forums is permitted, provided the original author(s) and the copyright owner(s) are credited and that the original publication in this journal is cited, in accordance with accepted academic practice. No use, distribution or reproduction is permitted which does not comply with these terms.
*Correspondence: Xiujuan Shan, c2hhbnhqQHlzZnJpLmFjLmNu