 Yi Pan
 Weihan Li1
 Yongping Chen
- 1College of Harbor, Coastal and Offshore Engineering, Hohai University, Nanjing, Jiangsu, China
- 2Zhejiang Institute of Hydraulics and Estuary, Hangzhou, Zhejiang, China
- 3National Marine Hazard Mitigation Service, Ministry of Natural Resources of the People‘s Republic of China, Beijing, China
This paper investigates the impact of increasing maximum wind speed of tropical cyclones on the return periods of water levels in the sea area of the Yangtze River Delta. To conduct this study, a series of numerical experiments are performed using historical tropical cyclones that impacted the Yangtze River Delta from 1949 to 2019. The aim is to analyze the effects of global climate change on extreme water levels and the corresponding return periods. To obtain the historical water levels in the sea areas of the Yangtze River Delta, a storm surge model is driven by the selected tropical cyclones. The simulated astronomical tidal levels during the same period are also used. The extreme water levels of different return periods are then calculated. The maximum wind speeds of the selected tropical cyclones are increased by 11% according to the expected amount of increase under global climate change. The extreme water levels of different return periods under this scenario are calculated with the same procedure. The results of the study show that the impact of increasing maximum wind speed of tropical cyclones on the increases of extreme water levels and the decrease of return periods is more significant in the inner area of the estuaries than in the outer areas. Moreover, the responses of the extreme water levels and the corresponding return periods in the Yangtze River Estuary and the Hangzhou Bay show different characteristics. The results of this study provide significant reference value for the management of future coastal disaster prevention and mitigation in the Yangtze River Delta. Furthermore, the methodology used in this study can be applied in other estuaries to investigate the potential impacts of changes in climate and hydrology factors on extreme water levels and the corresponding return periods.
1 Introduction
Under the background of global climate change, the maximum wind speed of tropical cyclones and extreme high tide level in coastal areas are likely to increase (IPCC, 2012), which pose a great threat to coastal and estuary areas (e.g., Pan et al., 2013; Pan et al., 2020; Li et al., 2022) and also impact the present return period system based on historical hydrological data. Although some soft shore protection technologies can be used to resist the coastal disasters to some degree (e.g., Temmerman et al., 2013; Pan et al., 2022a), it is necessary to understand the impacts of global climate change on the return period system for the purpose of future coastal disaster prevention and mitigation.
The Yangtze River Delta (YRD) is formed by two estuaries, the Yangtze River Estuary and the Hangzhou Bay (i.e., the Qiantangjiang River Estuary), as seen in Figure 1. It is one of the economic centers of China with dense population and developed commodity economy, and it is often affected by storm surges induced by tropical cyclones. Studies are conducted on the impacts of global climate change on the storm surge induced by tropical cyclones in the Yangtze River Delta (e.g., Wang et al., 2012; Zhao et al., 2014; Feng et al., 2018; Pan and Liu, 2019; Shen et al., 2019) and other estuaries (e.g., Karim and Mimura, 2008; Robins et al., 2016; Yin et al., 2017; Li et al., 2020; Yuan et al., 2022; Zhou et al., 2022). Most of these studies focus on the impacts of climate change on the distribution of extreme storm surge levels in the estuaries. With these studies, a portray of the changes in distribution of extreme storm surge level under climate change can be gained. However, the sea dike risk due to climate change is determined by both the changes in extreme storm surge levels and the original sea dike crest levels, which are determined by historical data and different alone the coast of the estuaries. Therefore, it is necessary to investigate the changes in return periods of water levels due to climate change, to provide reference for future planning of coastal and offshore projects such as sea levees (Pan et al., 2015a; Pan et al., 2015b), harbours (Gao et al., 2020; Wang et al., 2020; Gao et al., 2021), offshore wind power fields (Guan et al., 2019; He et al., 2019), artificial beaches (Pan et al., 2017; Pan et al., 2018; Li et al., 2021; Li et al., 2022), etc.
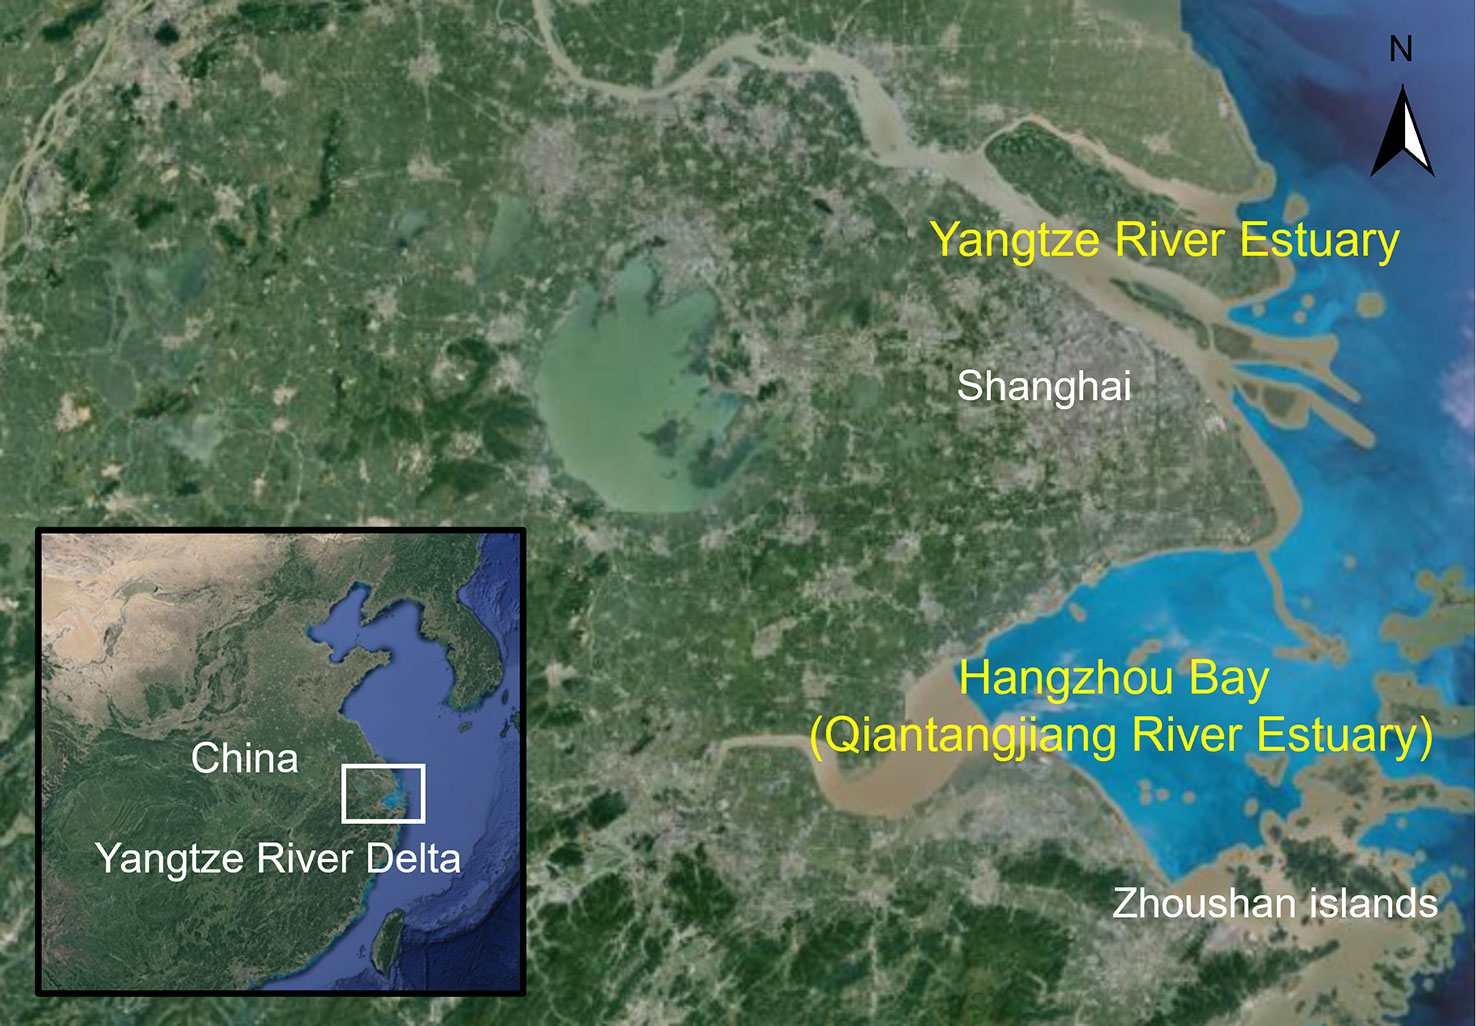
Figure 1 The study area: the Yangtze River Delta.
In this paper, the effects of increasing maximum wind speed of tropical cyclones on the return periods of water levels in the sea area of the Yangtze River Delta are investigated via a serious of numerical experiments. Although global climate change comes with a serious of effects, e.g., sea level rise, increasing maximum wind speed of tropical cyclones, and changes in the tracks of tropical cyclones, this study only focus on the effects of increasing maximum wind speed of tropical cyclones. Under a hypothesis that the river run-off, astronomical tide, mean sea level, and tracks of tropical cyclones are unchanged, while the maximum wind speeds of tropical cyclones increase in a possible scenario (IPCC, 2012), the effects of increasing maximum wind speed of tropical cyclones on the return periods of water levels in the sea area of the Yangtze River Delta are investigated via a numerical model. Based on numerical simulations under different scenarios, the distributions of increase of water levels and decreases of return periods are analyzed and discussed.
2 Methodology
A storm surge model of the Yangtze River Estuary is set up based on the ADCIRC model (e.g., Dietrich et al., 2011) and verified via a comparison between the simulated and measured data. With the storm surge model, a two-step numerical study scheme is designed to investigate the possible impact of increasing maximum wind speed of tropical cyclones on the return periods of water levels in the sea area of the Yangtze River Delta. The numerical study scheme is designed based on the hypothesis that the river run-off, astronomical tide, mean sea level, and tracks of tropical cyclones are unchanged, while the maximum wind speeds of tropical cyclones increase in a possible scenario. In the first step, all the tropical cyclones that impact the Yangtze River Delta during 1949 to 2019 are picked out and used to drive the storm surge model. The astronomical tides during 1949 to 2019 are also simulated to provide the maximum annual astronomical tidal levels. With the simulated annual tidal levels (may from either storm surges or astronomical tides), the water levels of different return period are calculated in the sea area of the Yangtze River Delta. In the second step, all the processes in step 1 are repeated except that the tropical cyclones are strengthened according to IPCC (2012), and the water levels of different return periods are calculated accordingly. The new-calculated water levels of different return periods are then compared to the old ones and the impacts of increasing maximum wind speed of tropical cyclones on the spatial distribution of return periods of water levels in the sea area of the Yangtze River Delta are discussed.
2.1 Storm surge model
The storm surge model is set up with ADCIRC model. The ADCIRC model is a shallow-water circulation model that solves for water levels and currents at a range of scales (e.g., Westerink et al., 2008; Dietrich et al., 2011). The ADCIRC model has been widely used in the numerical studies on storm surge processes around the world (e.g., Parker et al., 2019; Zhang et al., 2020; Shankar and Behera, 2021; Li et al., 2022; Pan et al., 2022b; Wang et al., 2022).
The computational grid and stations used in model verification and data analysis are given in Figure 2. The computational grid covers the sea area of the East China Sea, part of south China sea, and a small part of Pacific Ocean. The total number of computational nodes and elements are 60338 and 112455, respectively. The ocean boundary conditions are provided by the TPXO 7.2 database. In the verification cases, the upper boundary of the Yangtze River is adapted from the measurement at Datong (DT) station, while in the cases for numerical experiments the monthly-averaged run-off discharges are used. Because the runoff of the Qiantang River has little influence on the flow field in Hangzhou Bay, the monthly-averaged runoff of Qiantang River is used for the upper boundary of the Qiantang River in both verification cases and the cases for numerical experiments. A modified Holland model (Holland, 1980; Mattocks and Forbes, 2008; Pan et al., 2016) is used to generate the wind fields according to tropical cyclone tracks. The equation of the wind speed is given as
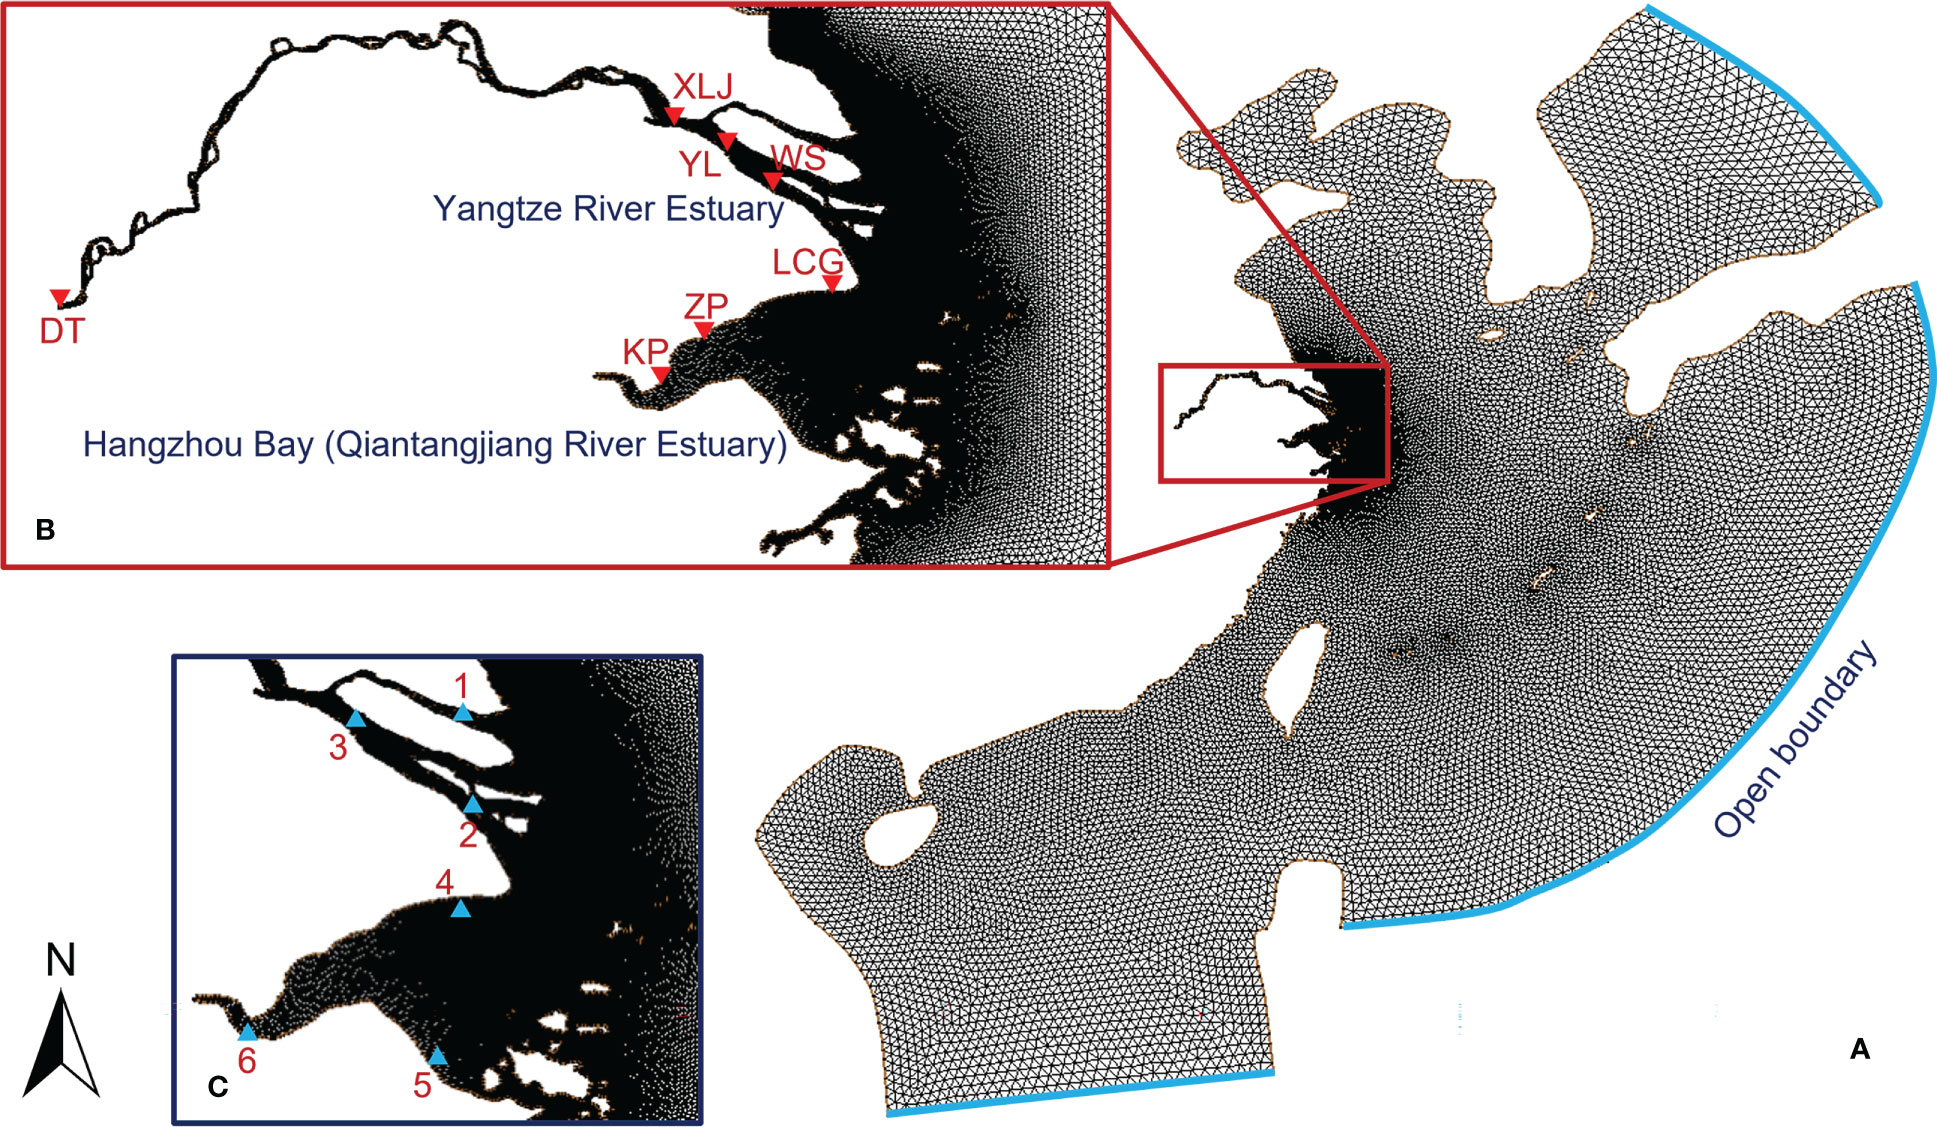
Figure 2 Computational grid and stations: (A) the computational grid, (B) local refinement and stations for model verification and (C) stations for data analysis.
where vrot is the velocity of the rotating storm; Pn is the background surface pressure; Pc is the central surface pressure; ρa is the density of air; f is the Coriolis force; B is the hurricane shape parameter, which controls the eye diameter and steepness of the tangential velocity gradient; vr is the maximum wind speed; vmc is the moving speed of the storm; WPBL is a wind reduction factor, defined at the gradient wind flow level above the influence of the planetary boundary layer (Powell et al., 2003).
The storm surge model is verified by simulating three storm surges that impact the sea area of the Yangtze River Delta significantly. The three simulated storm surges are induced by the tropical cyclones Winnie (9711), Fung-wong (1416) and Lekima (1909) whose tracks are illustrated in Figure 3. Comparisons of simulated and measured water levels at different stations during the three storm surges are plotted in Figure 4. As seen, good agreements can be found between model simulations and observations of water level, indicating that the storm surge model provides satisfactory descriptions of the water levels.
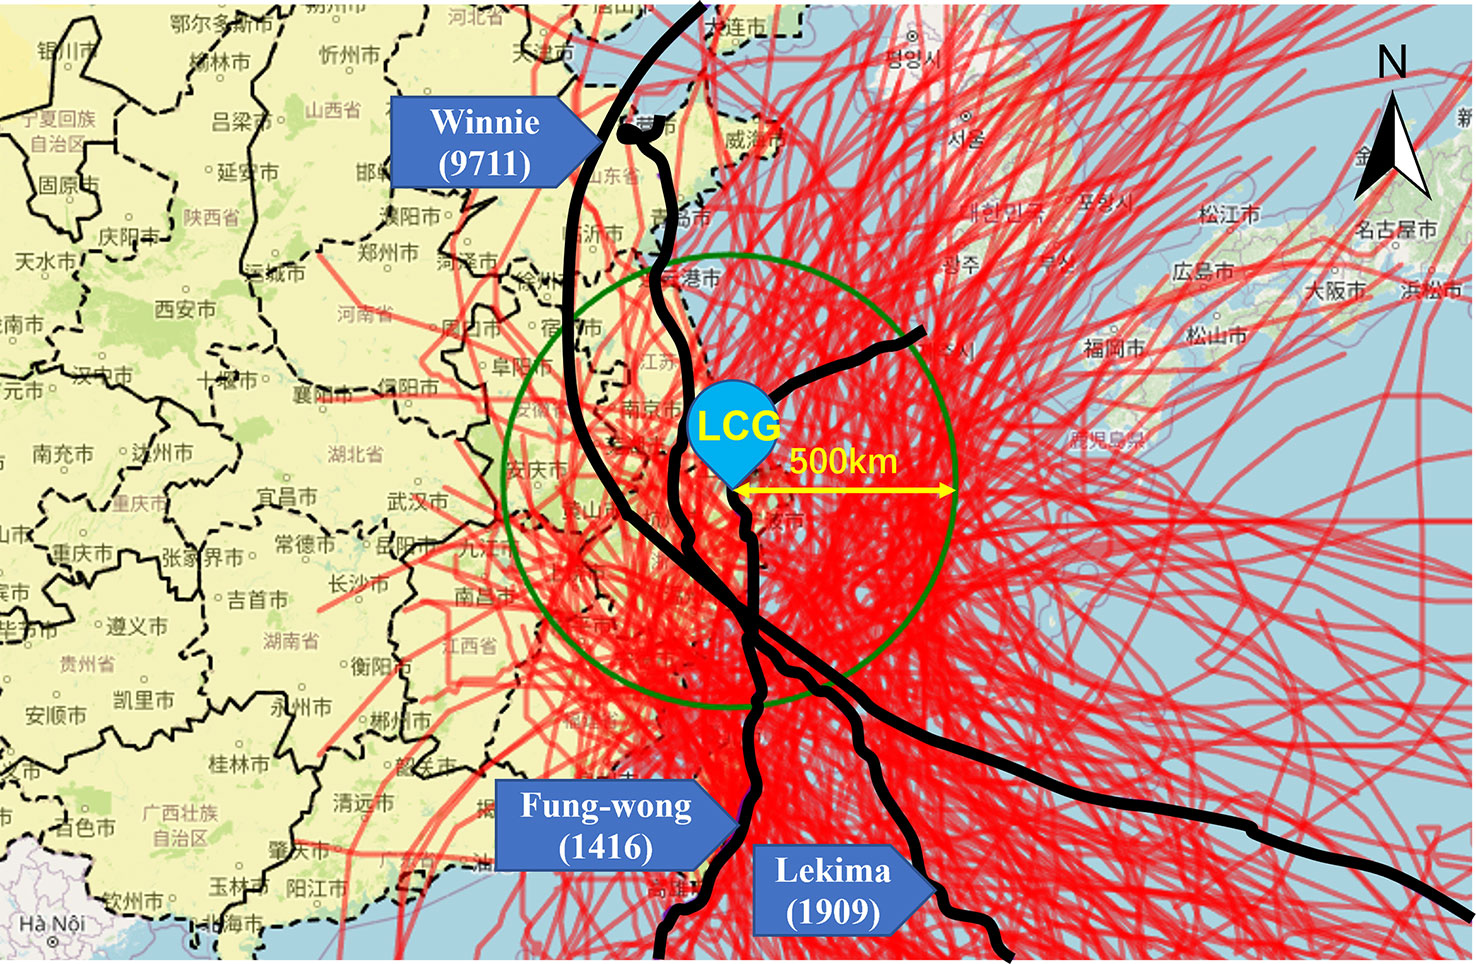
Figure 3 The tracks of all selected tropical cyclones that impact the sea area of the Yangtze River Delta and the three tropical cyclones used for model verification.
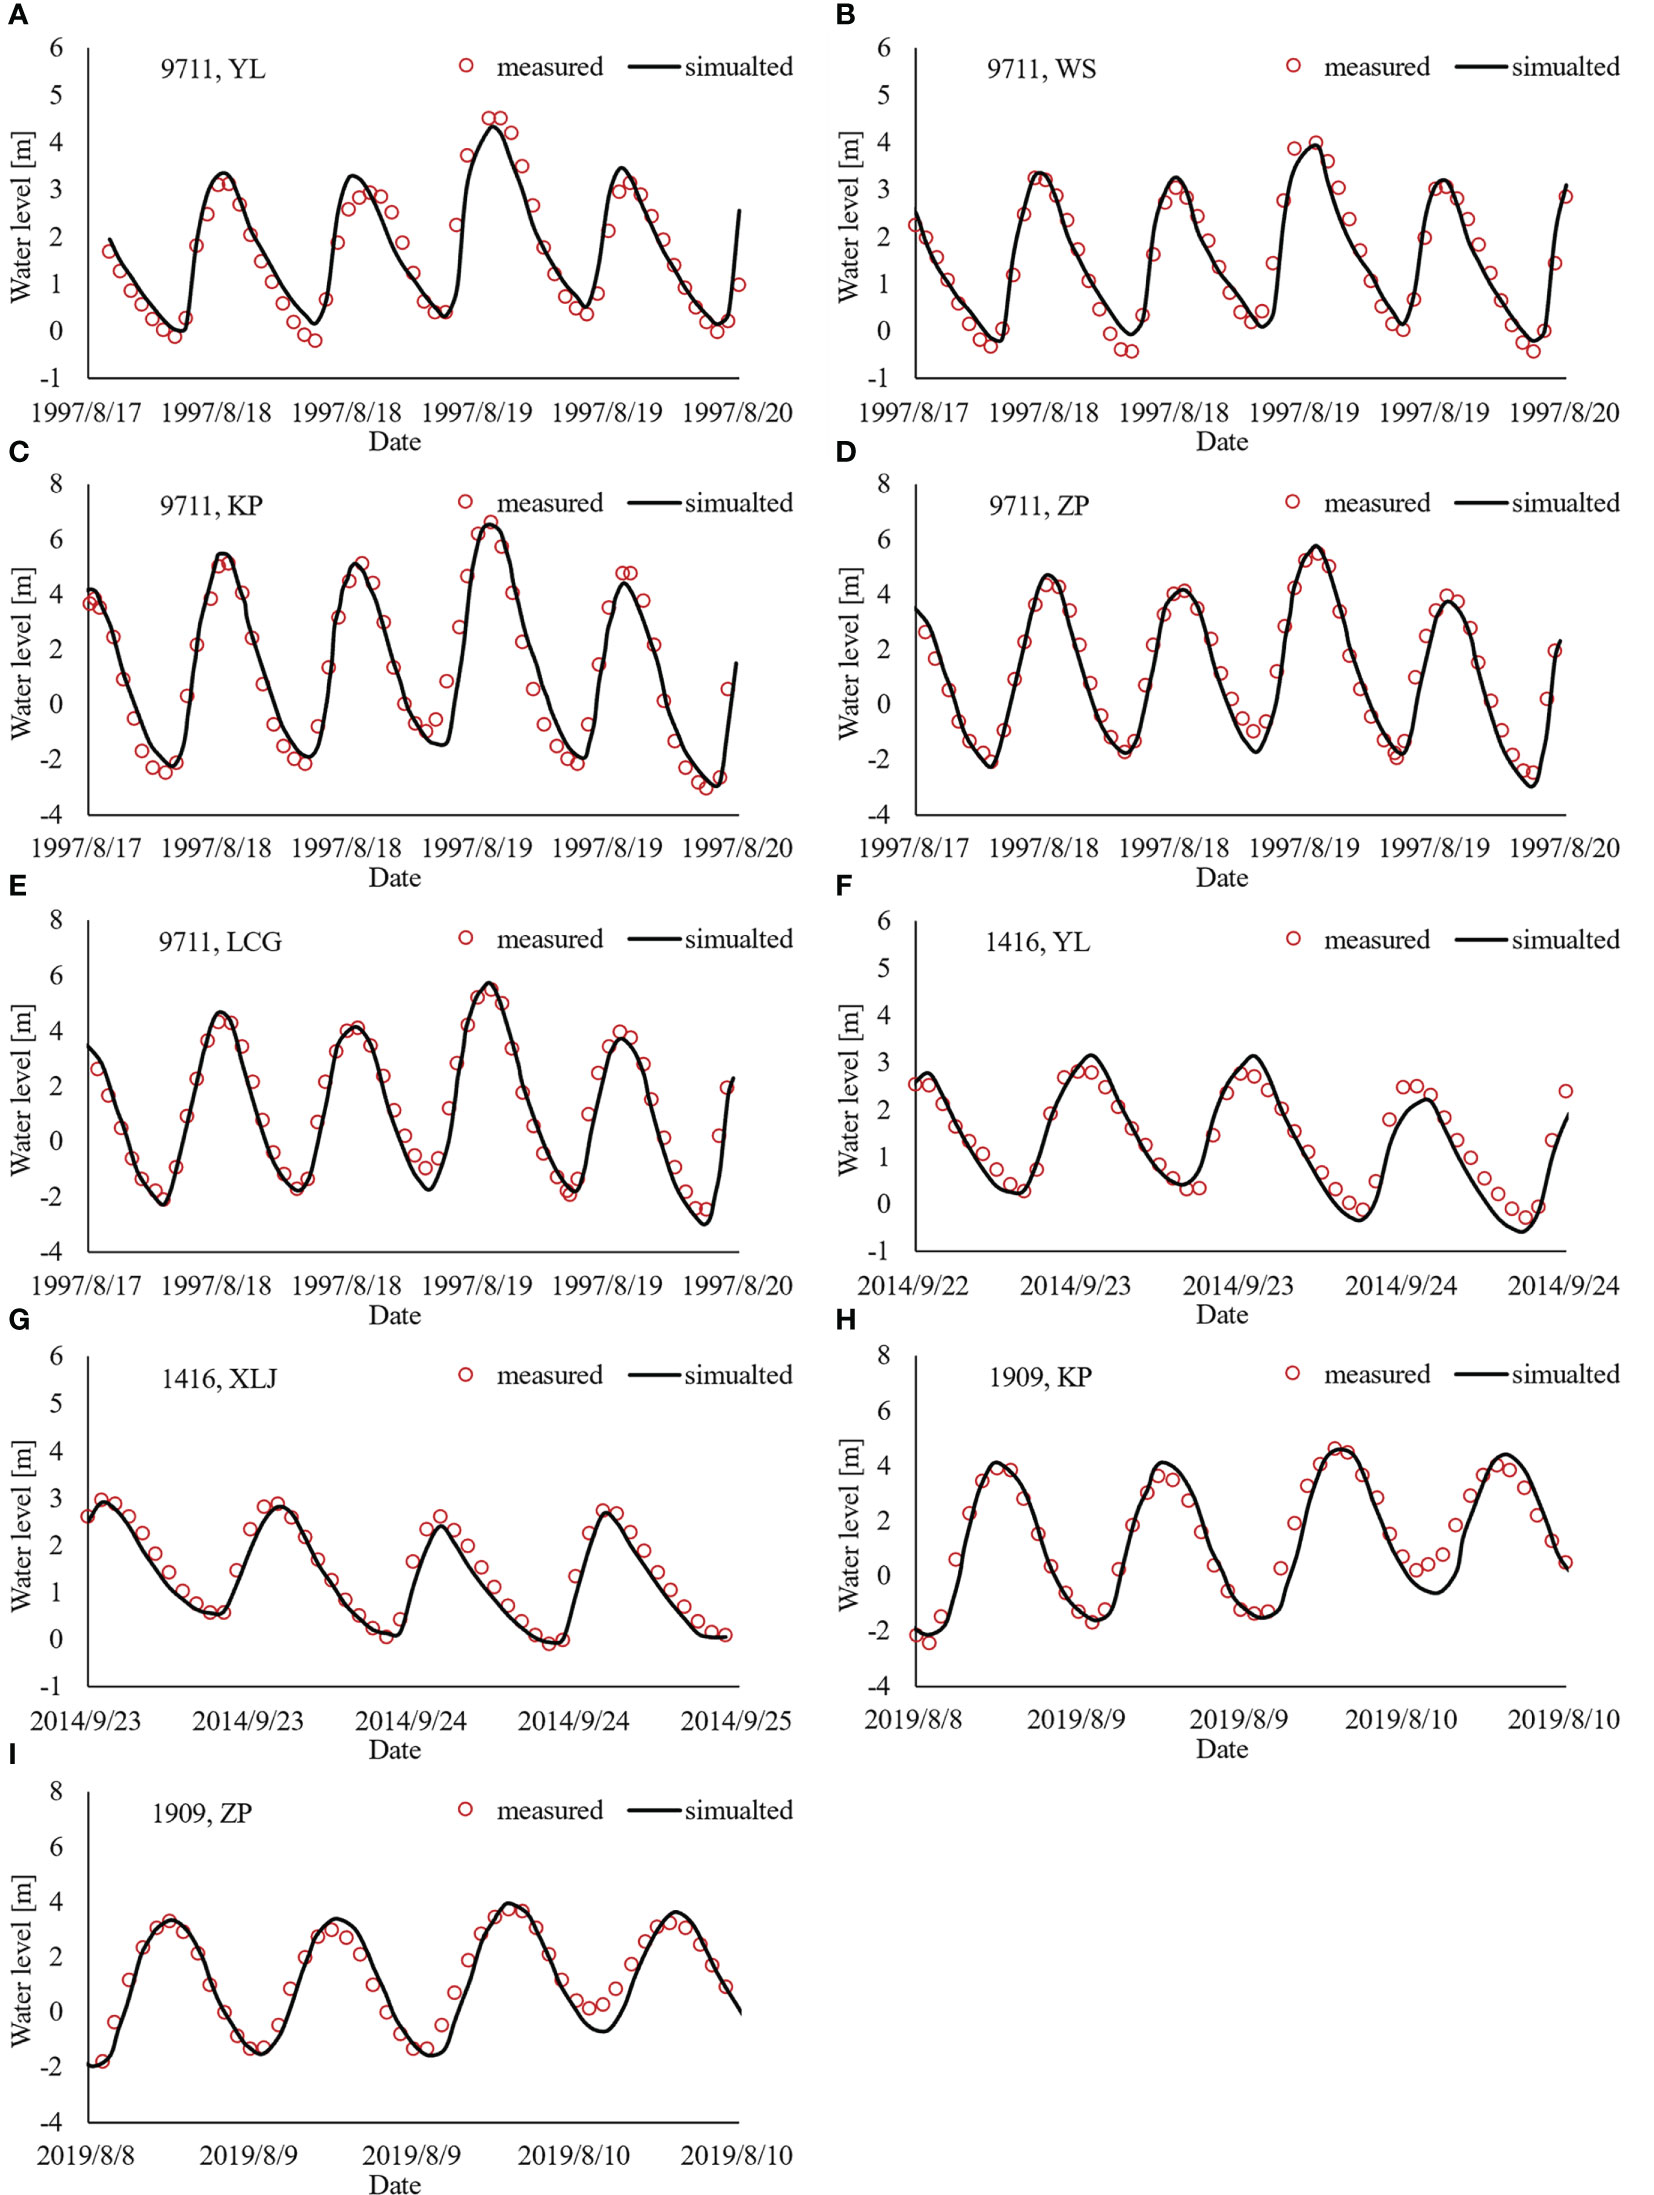
Figure 4 Comparisons of simulated and measured water levels at different stations during the tropical cyclones Winnie (9711), Fung-wong (1416) and Lekima (1909). The (A–F) respectively correspond to the water levels at YL, WS, ZP, KP and LCG during tropical cyclone Winnie (9711). The (F) and (G) respectively correspond to the water levels at YL and XLJ during tropical cyclone Fung-wong (1416). The (H) and (I) respectively correspond to the water levels at KP and ZP during tropical cyclone Lekima (1909). Note: because the measured data are from different sources, different stations are verified in the three storm surge processes.
2.2 Numerical study scheme
The tropical cyclones that impact the sea area of the Yangtze River Delta from 1949 to 2019 are firstly picked out. To do this, a circle is made with the center located LCG and the radius of 500 km. All tropical cyclones that moved in this circle area during 1949 to 2019 are considered to have significant impact on the sea area of the Yangtze River Delta and a total of 154 tropical cyclones are selected, as seen in Figure 3. The tropical cyclone track data are from the CMA (China Meteorological Administration) Tropical Cyclone Best Track Dataset (Ying et al., 2014; Lu et al., 2021; data available in tcdata.typhoon.org.cn). All the selected tropical cyclones are used to drive the storm surge model to get the water level distributions under the effects of historical tropical cyclones (the cases are referred to as historical cases hereinafter). In addition, the astronomical tides from 1949 to 2019 are also simulated to provide the maximum annual astronomical tidal levels, in case of the annual maximum tidal levels of some years are induced by the highest astronomical tide rather than storm surge (the cases are referred to as astronomical cases hereinafter).
Then the tropical cyclones are enhanced with increased maximum wind speeds and decreased central pressures. According to the special report of IPCC (2012) on extreme events and disasters, the mean maximum wind speed of tropical cyclones may increase 2% to 11% by the end of the 21st century. Based on this, the maximum wind speeds of all selected tropical cyclones are increased according to the upper limit (11%), and the central pressures are deceased accordingly with the empirical relationship
where Vc is the maximum wind speed, m/s; Pc is the central pressure of a tropical cyclone, hPa. The empirical relationship is extracted according to the relationships between the maximum wind speed and the central pressure of the selected 154 tropical cyclones. It can be seen that the units on the two sides of Equation (1) are not the same. However, because the central pressure of a tropical cyclone has much less influence on the storm surge than the maximum wind speed (usually it is considered that the pressure-induced surge accounts for about 5% of the storm surge), the errors in the center pressure have little influence on the simulated results and a generally reasonable decrease of the central pressure meets the requirement of the numerical study scheme.
The enhanced tropical cyclones are then used to drive the storm surge model to get the water level distributions under the effects of increased maximum wind speed of tropical cyclones (the cases are referred to as enhanced cases hereinafter). The annual maximum tidal levels obtained based on the results of historical cases + the astronomical cases (namely historical scenario) can be labeled as Historical Annual Maximum Tidal Levels (HAMTL), while annual maximum tidal levels obtained based on the results of enhanced cases + the astronomical cases (namely enhance scenario) can be labeled as Enhanced Annual Maximum Tidal Levels (EAMTL).
The two set of annual maximum tidal levels can be used to extract return period information. A theoretical distribution should be chosen firstly. For two reasons, 1) this study focuses on the effects of enhanced tropical cyclones, and 2) the analysis is on all spatial points in the sea area of the Yangtze River Delta for the purpose of spatial comparison, the theoretical distribution needs to meet two requirements: 1) the theoretical distribution can be fitted by only part of the data (in this study the upper part is used to reflect more feature of the extreme high water levels), and 2) the curve-fitting need to be straightforward without manual adjustment. According to the two requirements, the two-parameter Weibull distribution is chosen rather than the Gumbel Probability Distribution (which cannot be fitted by part of the data) and Pearson III Probability Distribution (which has tuning parameters that need manual adjustment). The probability distribution function of two-parameter Weibull distribution is given by
where P is the probability of the studied variable X being less than or equal to x, a is the scale factor, and b is the shape factor. Because the two-parameter Weibull distribution starts with zero, the X is the difference between the annual maximum tidal levels and the minimum value of the annual maximum tidal levels at each spatial point.
Some samples of the Weibull curve-fitting are given in Figure 5. The curves are fitted with the upper 25% of the annual maximum tidal levels to have a better reflection of the distribution of largest water levels. Using a different theoretical distribution or portion of data might yields different results in detailed values, but the general spatial patterns should be similar. As seen, the Weibull distribution fits well with both the HAMTL and EAMTL, and significant differences can be found between the best fit curves of HAMTL and EAMTL. It can be noticed that in Figure 5D) (station 4) the curve-fitting is moderate, with the middle and lower part of the data have a deviation from the curve. A possible explanation is that the station 4 is close to open sea area and it also influenced little by the Zhoushan islands compared to station 5, so the middle and lower part of the data are more induced by the astronomical tide rather than the storm surge. For all the spatial points in the sea area of the Yangtze River Delta, the Weibull fit is conducted to both the HAMTL and EAMTL. With the best fit curves, the water levels of different return periods under historical and enhanced scenarios can be obtained as the data base for further analysis.
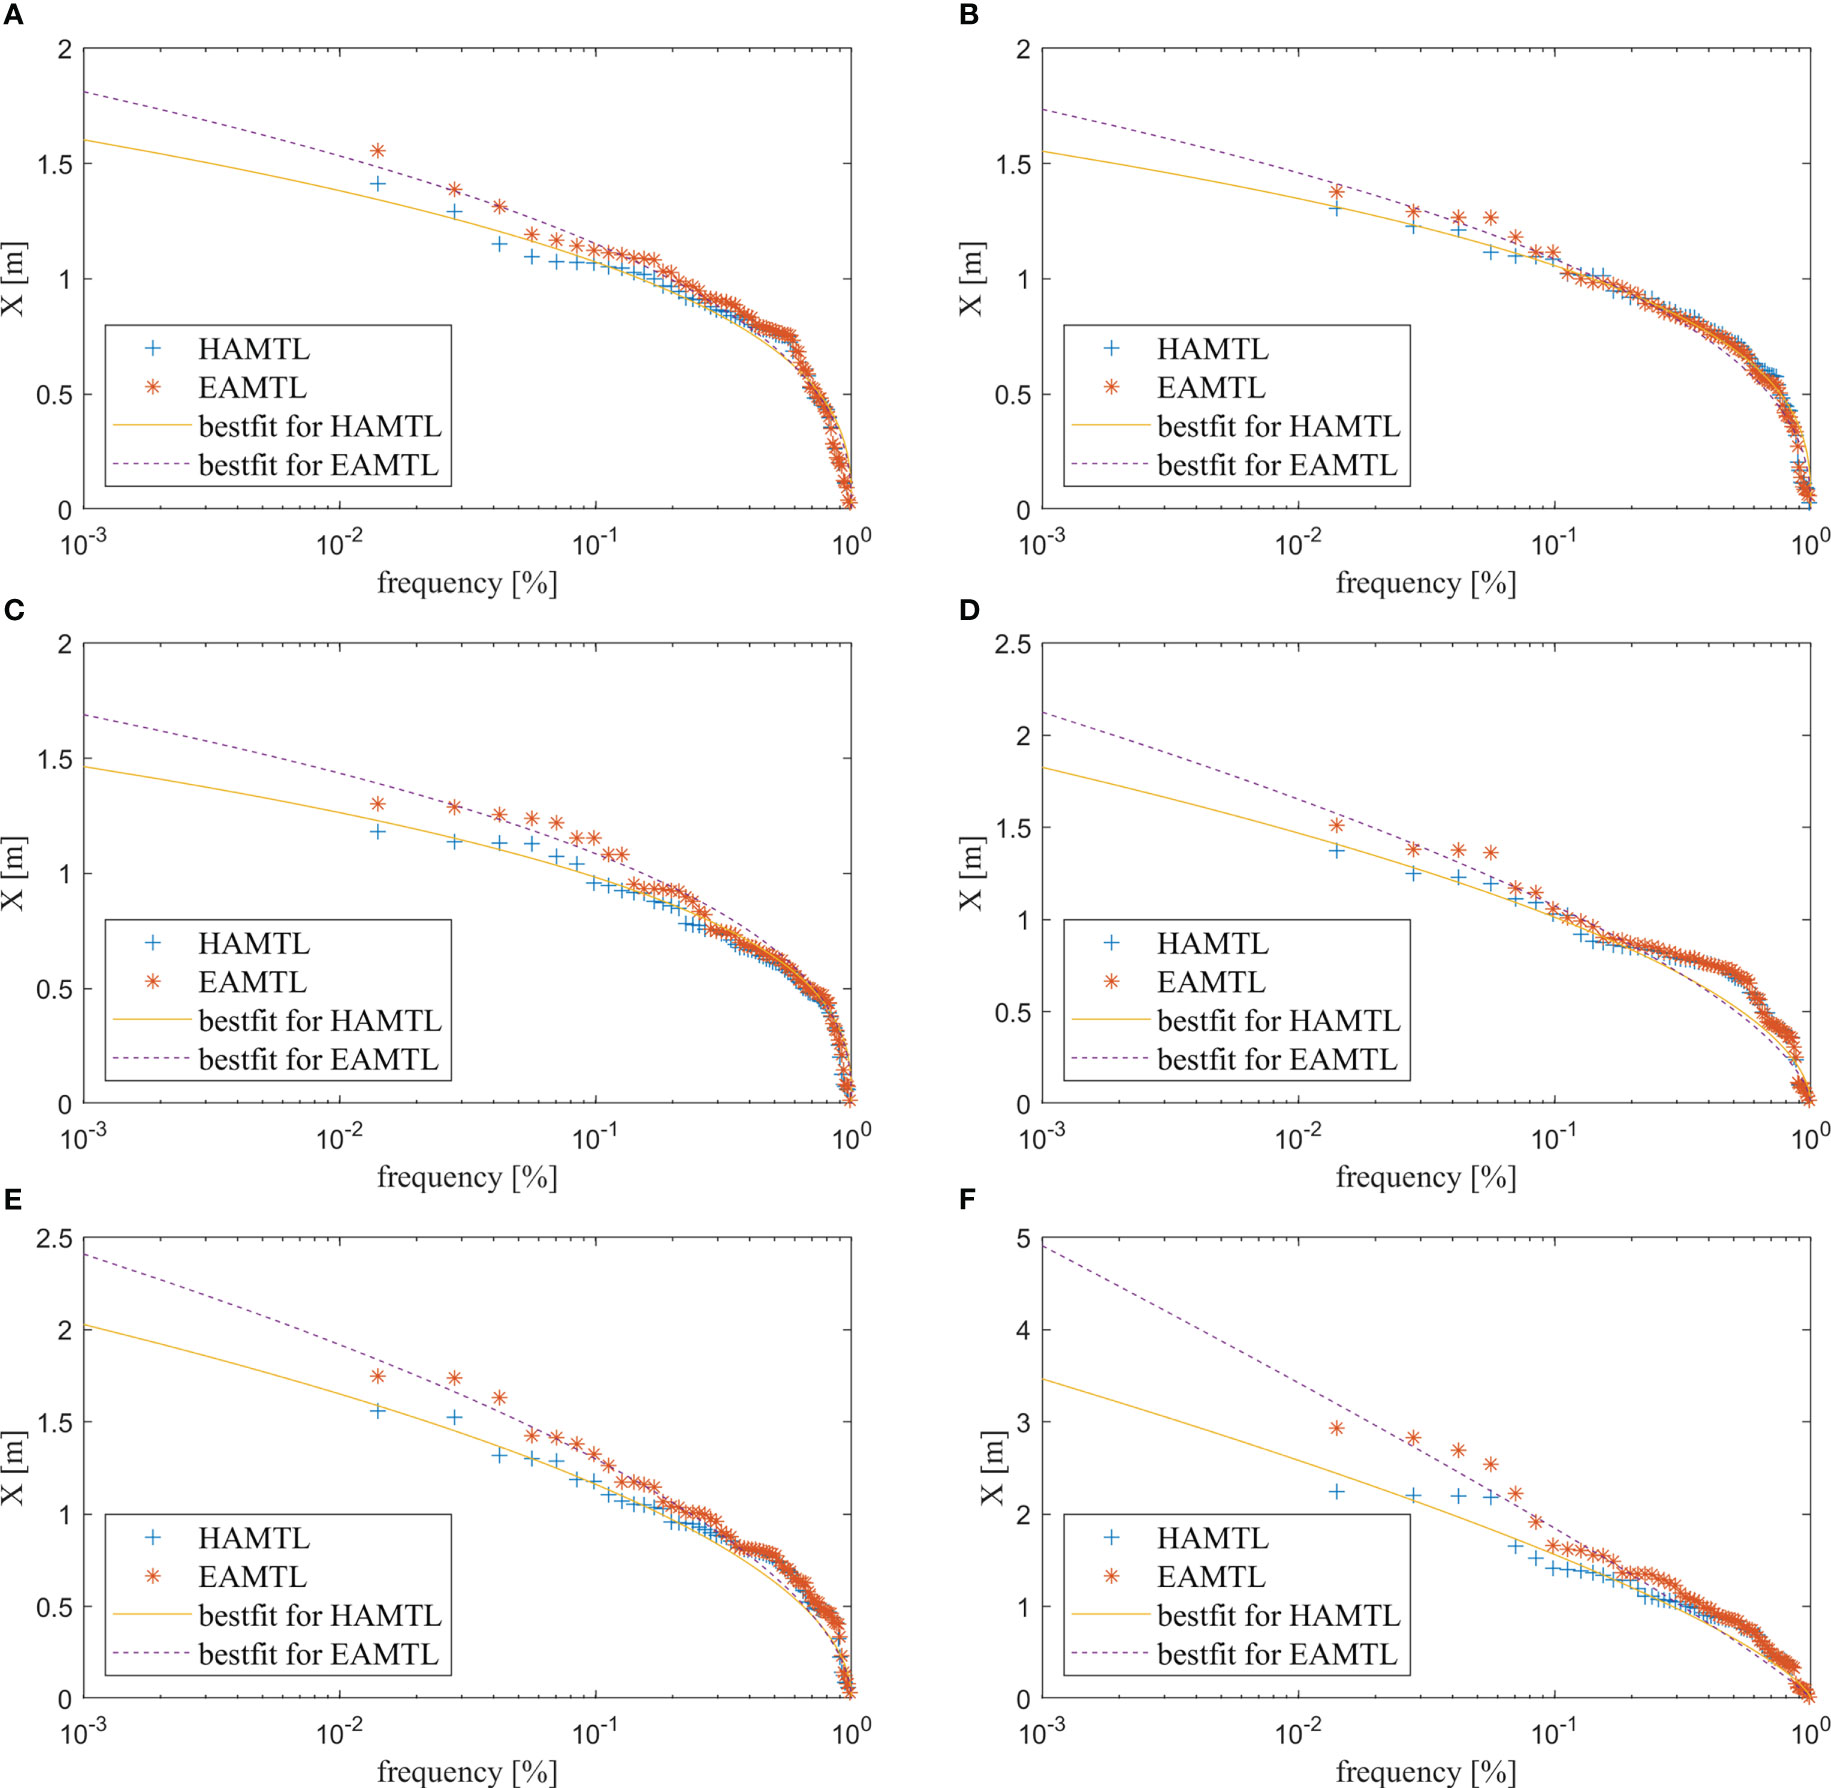
Figure 5 Samples of the curve-fitting with HAMTL and EAMTL. The (A–F) correspond to the station 1 to station 6 illustrated in Figure 2C.
3 Results and discussion
The differences in extreme water levels (50-year, 100-year, and 200-year return period) between historical and enhanced scenarios are calculated by subtracting the values from the historical scenarios from those from the enhanced scenarios. In this way, the impacts of the increasing maximum wind speed of tropical cyclones on the extreme water levels can be reflected straightforwardly. The distribution of the difference in extreme water levels are illustrated in Figure 6. As seen, under the impact of increased maximum wind speed, the increase patterns of extreme water levels are majorly controlled by the estuary topography. Generally, the extreme water levels increase more significantly in the inner area than the outer area of the estuary. The increases of the extreme water levels of different return periods increase along the estuary from out sea to the upstream, which applies to both the Yangtze River Estuary and the Hangzhou Bay. A comparison between the two estuaries indicates that the extreme water levels of the Hangzhou Bay are more sensitive to the increase of maximum wind speed of tropical cyclones. At the upstream end of the Yangtze River Estuary (i.e. near the XLJ station in Figure 2) the increase of 200-year water level is about 0.15 m, while at the upstream end of the Hangzhou Bay (i.e. near the station 6 in Figure 2) the value is about 0.4 m. The reason might be the squeezing effect of the horn-shape of the Hangzhou Bay to the storm surge. Noticing that the hypothesis of the numerical study scheme is that the river run-off, astronomical tide, mean sea level, and tracks of tropical cyclones are unchanged, while the maximum wind speeds of tropical cyclones are increased, strictly speaking the changes in extreme water levels are due to the maximum wind speeds of tropical cyclones rather than the climate change. However, the patterns of spatial distributions are of reference significance to the management of future coastal disaster prevention and mitigation.
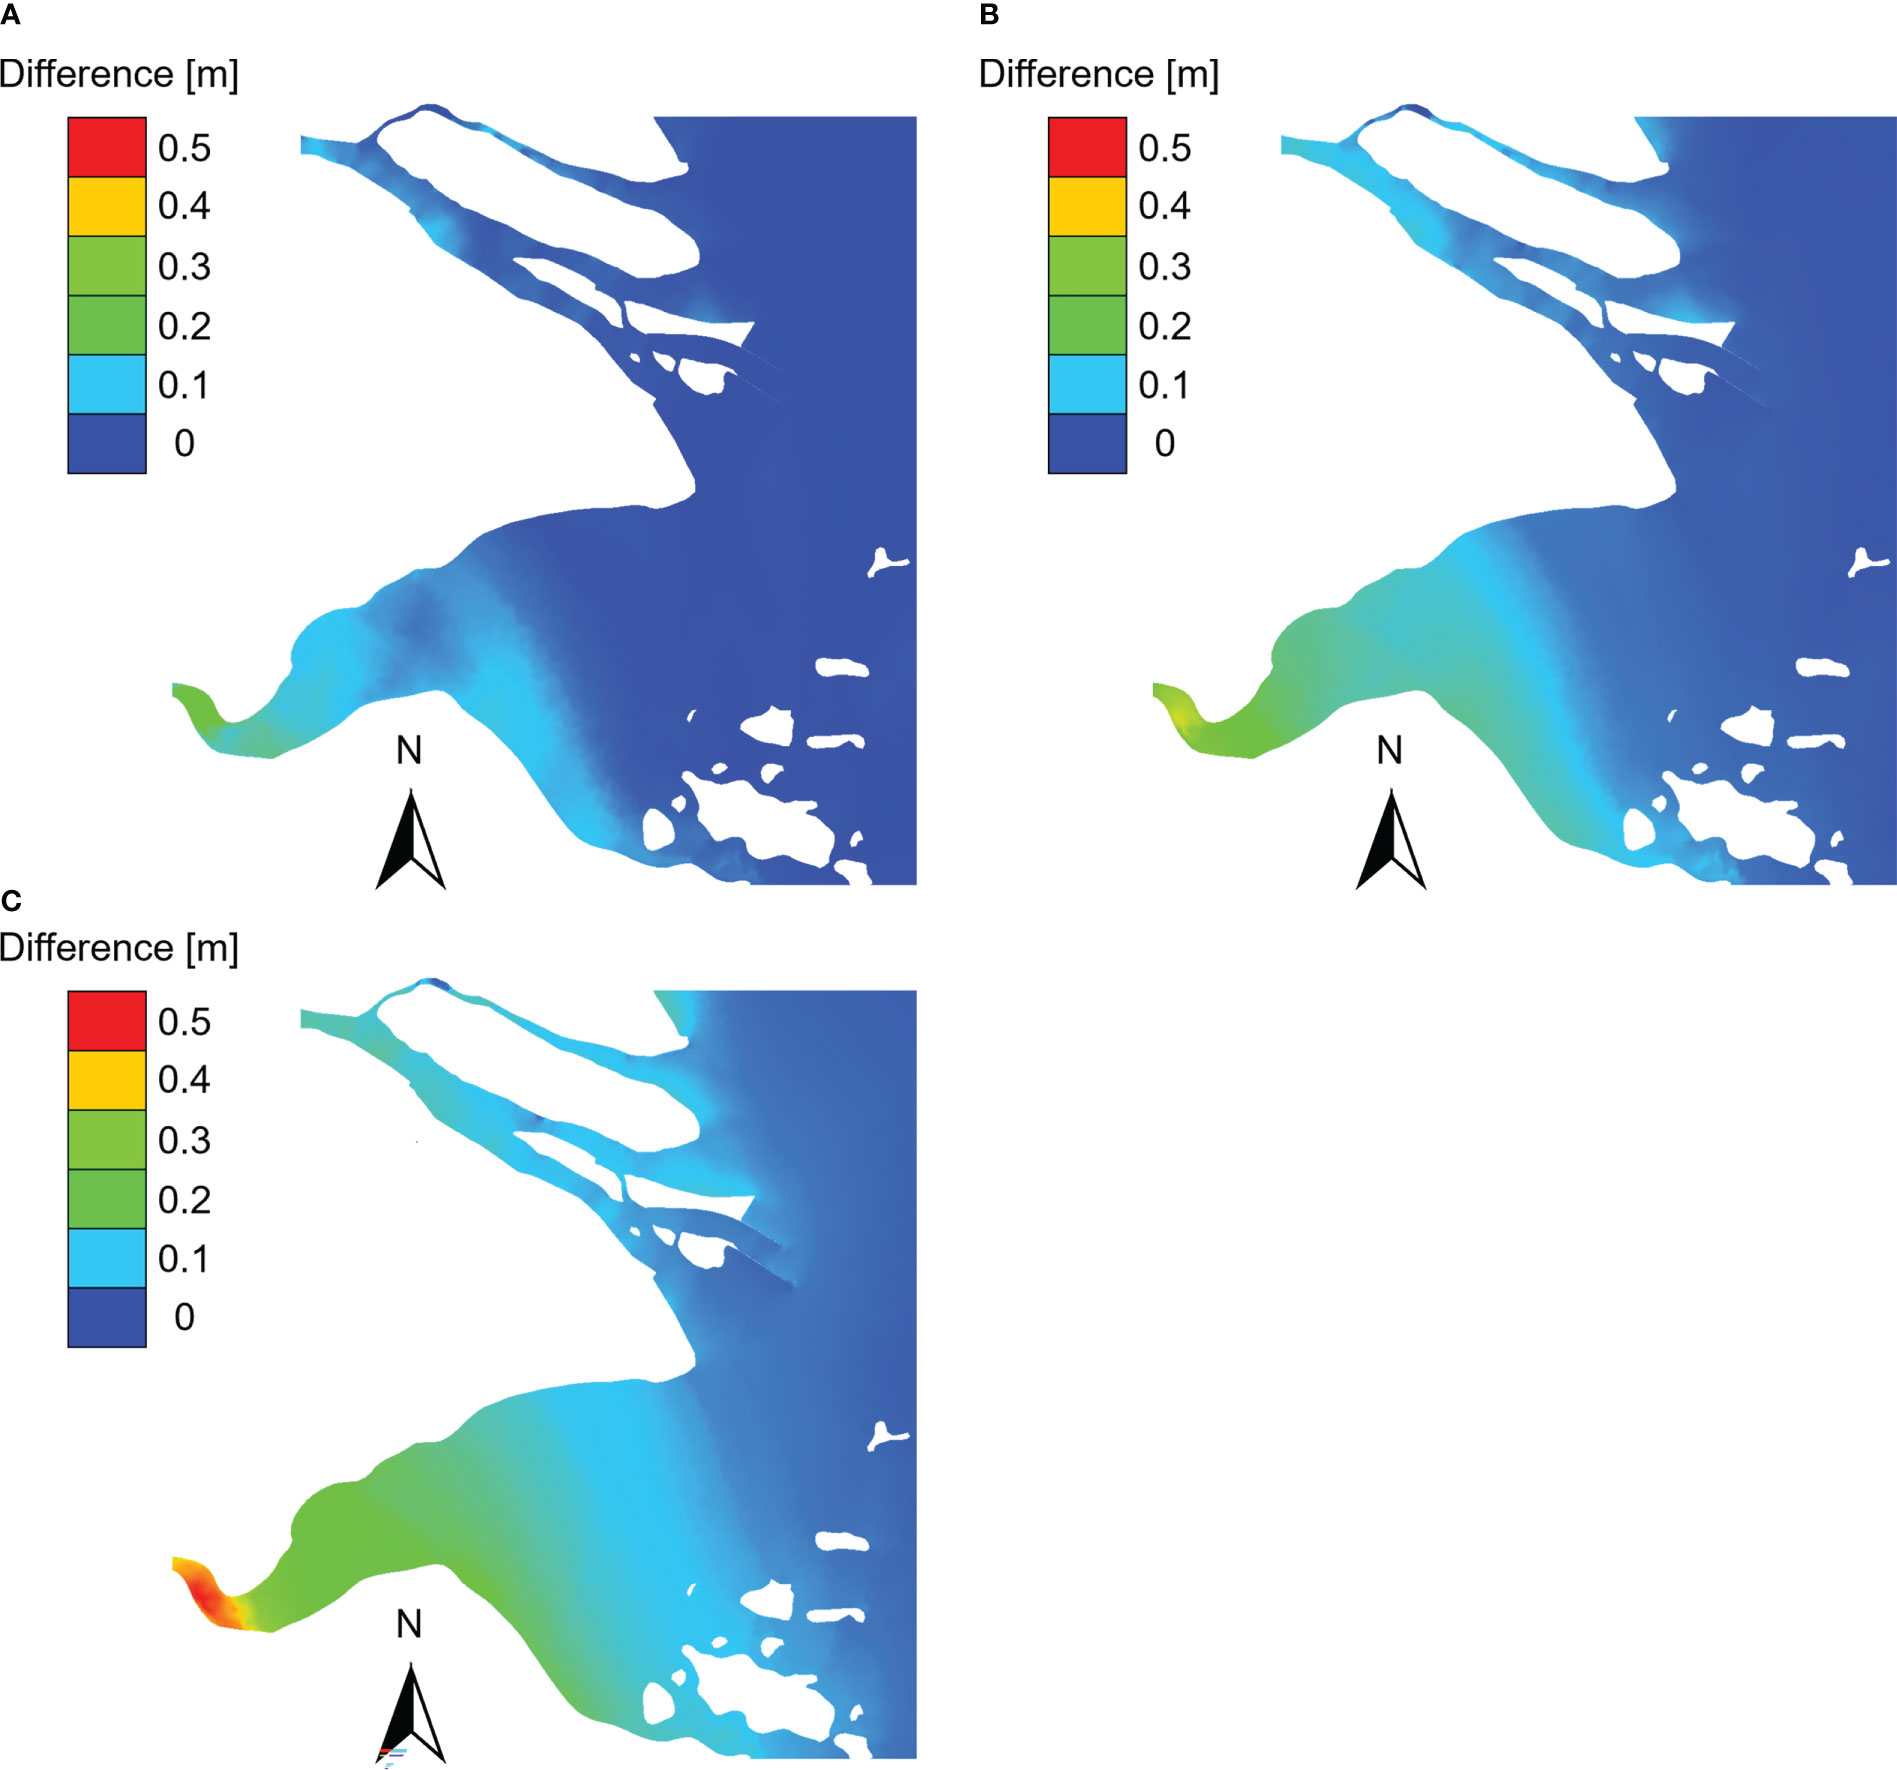
Figure 6 The differences in extreme water levels between historical and enhanced scenarios: (A) 50-year return period, (B) 100-year return period, (C) 200-year return period.
Except for the increases of the extreme water levels, the decrease of return periods of extreme water levels due to increasing maximum wind speed is also a concerned issue and of great importance to the management of future coastal disaster prevention and mitigation. To calculate the decreases of return periods, the extreme water levels of certain return periods (i.e., 50, 100 and 200 years) are calculated firstly, and then the corresponding return periods of the extreme water levels of certain return periods are calculated based on the simulated results of the enhanced scenarios. The decreases of return periods are then calculated by subtracting the new-calculated return periods (based on the enhanced scenarios) from the given ones (based on the historical scenarios) and plotted in Figure 7. It can be seen that the decrease of return periods and increase patterns of extreme water levels have generally similar distributions and some differences in the two estuaries. Under increased maximum wind speed, the return periods decrease more rapidly in the upstream of the estuaries generally. In the sea area out of the estuaries the return periods decrease about 50% (e.g., 25 years for 50-year return period case, 50 years for 100-year return period case, 110 years for 200-year return period case), while in the upper stream ends of the estuaries the return periods decrease about 80% (e.g., 35 years for 50-year return period case, 80 years for 100-year return period case, 170 years for 200-year return period case). A comparison between the two estuaries indicates that, on the contrary of the increase of extreme water levels, the decrease of return periods in the Yangtze River Estuary is more sensitive to increasing maximum wind speed than those of the Hangzhou Bay, the reason of which might be that the extreme water levels are higher in the Hangzhou Bay than those in the Yangtze River Estuary under the same return period. As discussed in preceding paragraph, due to the hypothesis of the study, the changes in extreme water levels are due to the maximum wind speeds of tropical cyclones rather than the climate change. but the patterns of spatial distributions are of reference significance to the management of future coastal disaster prevention and mitigation.
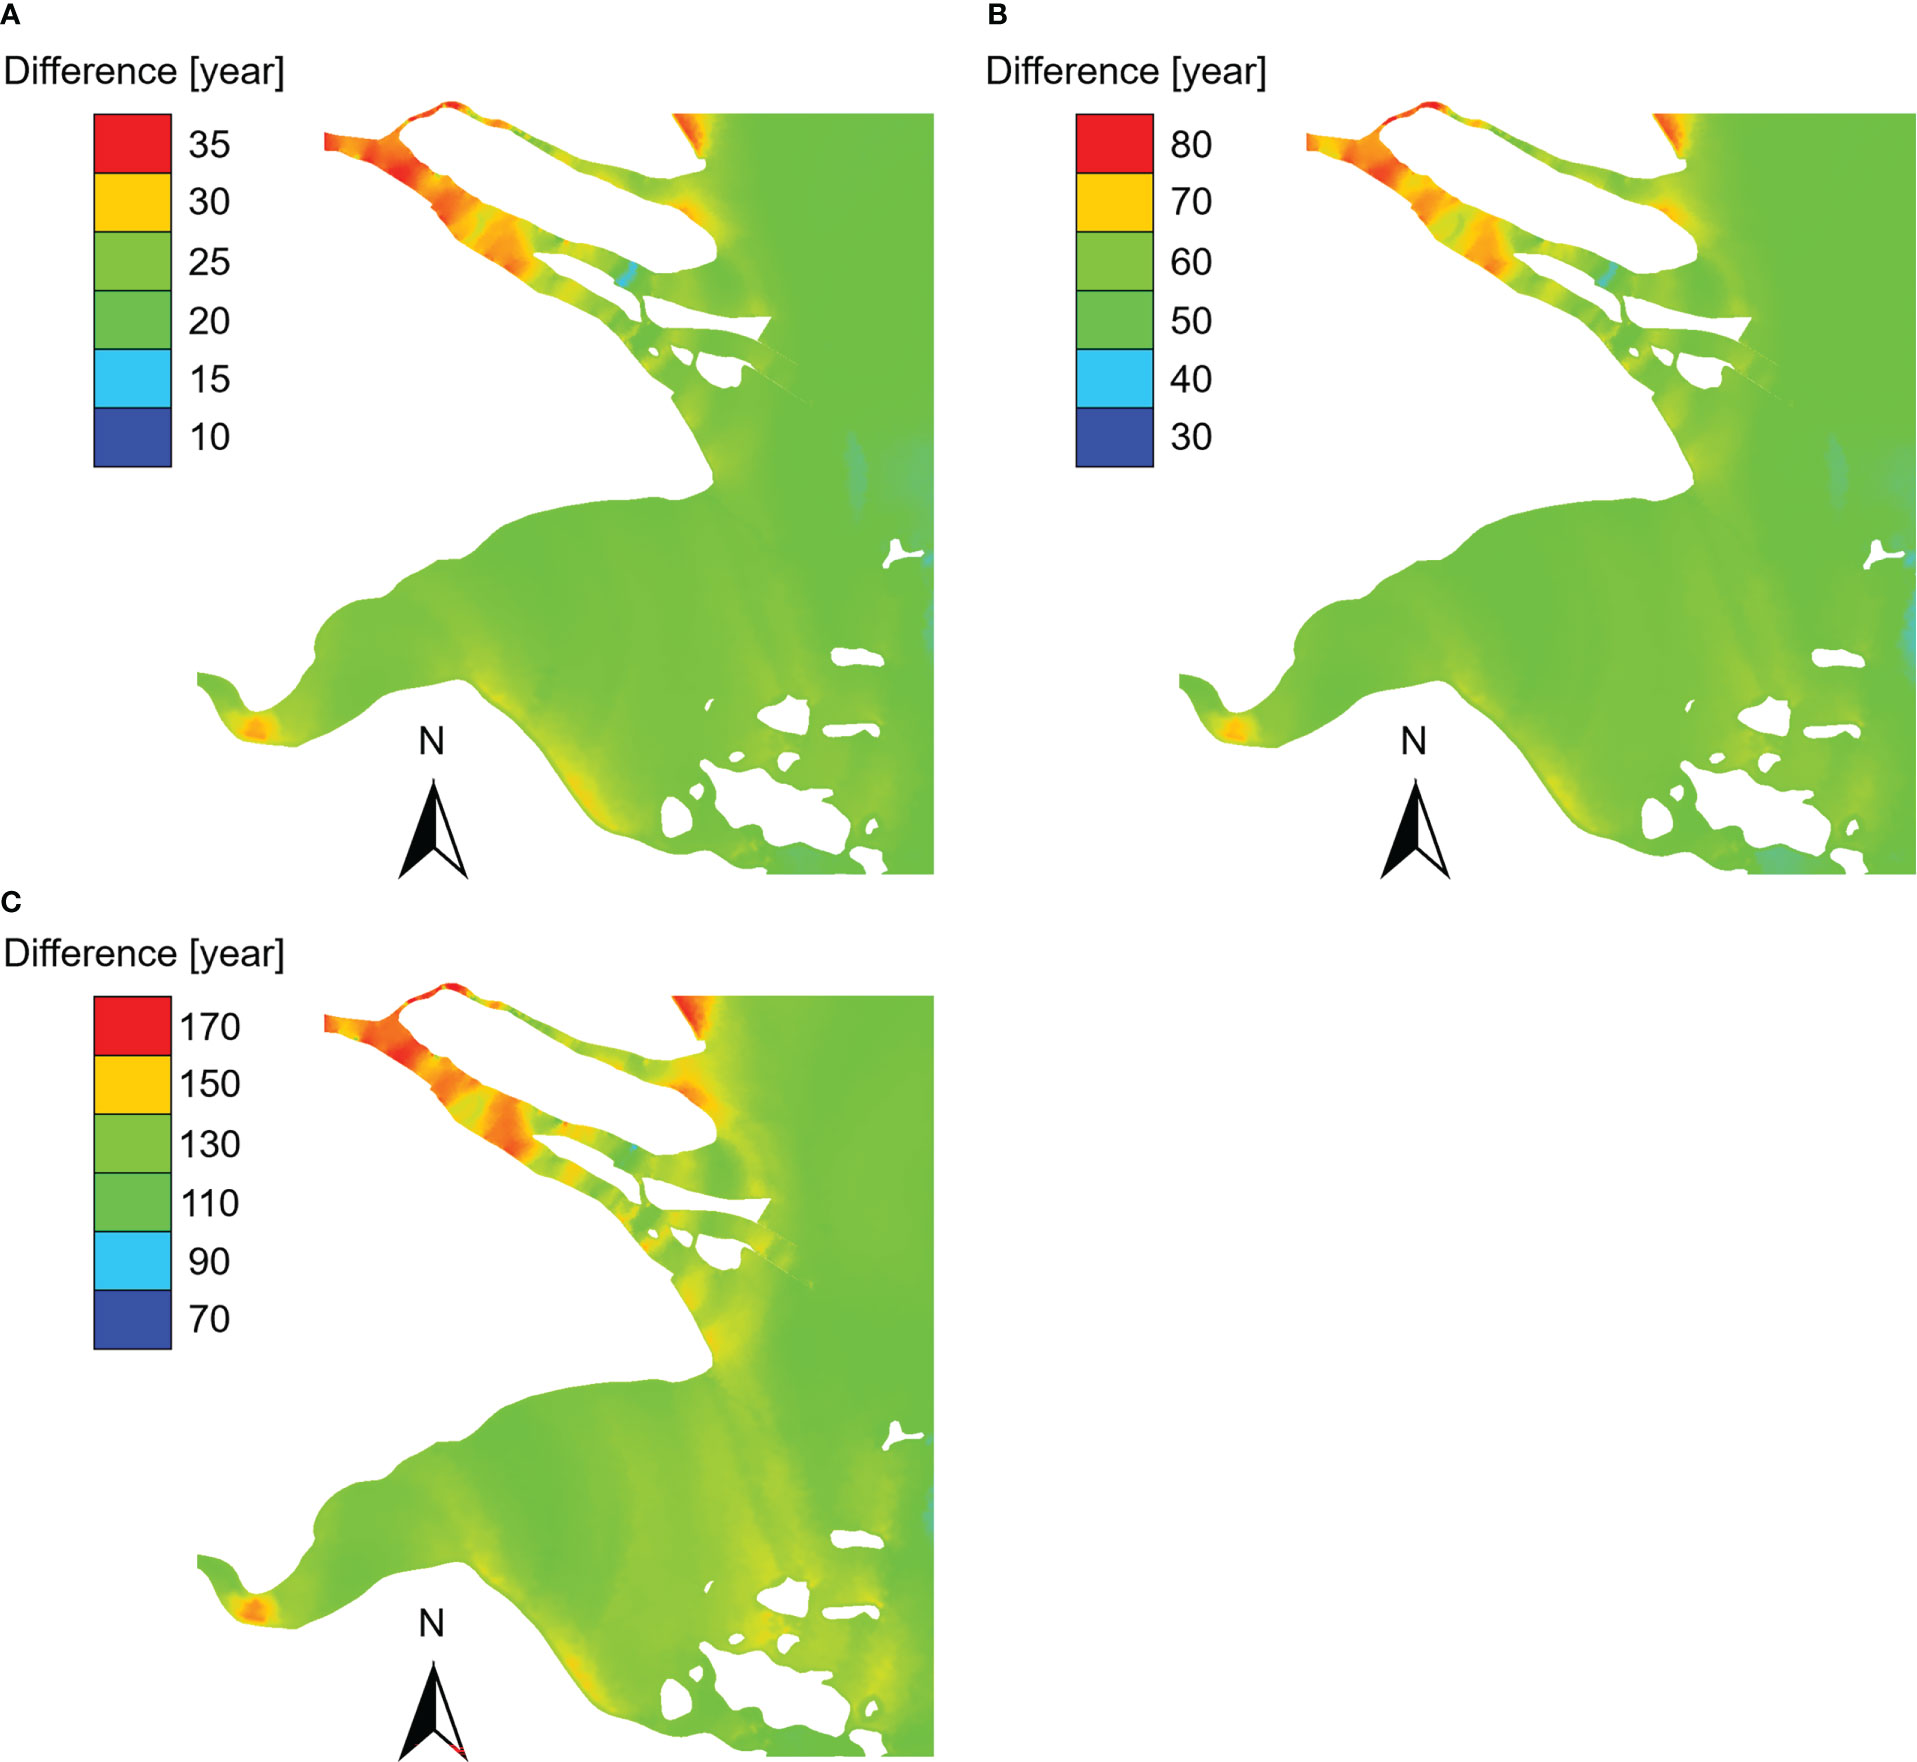
Figure 7 The decrease of return periods of extreme water levels of the enhanced scenarios compared to the historical scenarios: (A) 50-year return period, (B) 100-year return period, (C) 200-year return period.
It should also be noticed that all the 154 historical tropical cyclones are strengthened according to the upper limit (11%) of the IPCC (2012) estimation, so the quantitative values of the increases of extreme water levels and the decrease of return periods might be overestimated, but the patterns of spatial distributions are of reference significance.
From the points of view of the changes in both extreme water levels and return periods, the inner areas of the estuaries will be under greater pressures from storm surges compared to the open sea areas, which applies to both the Yangtze River Estuary (river-tide dominated) and the Hangzhou Bay (tide dominated). Hence attentions show be paid on the disaster prevention of the inner areas of the estuaries under the background of increasing tropical cyclones.
4 Conclusions
Under the hypothesis that the river run-off, astronomical tide, mean sea level, and tracks of tropical cyclones that affect the Yangtze River Delta are unchanged, while the maximum wind speeds of tropical cyclones increase 11%, the impacts of increasing maximum wind speeds of tropical cyclones on the return periods of water levels in the sea area of the Yangtze River Delta are investigated via a series of numerical experiments. The following conclusions can be drawn:
(1) Under the scenario of increased maximum wind speeds of tropical cyclones, the extreme water levels under certain return periods (i.e., 50, 100 and 200 years) increase more significantly in the inner area than the outer area of the estuary. The maximum increases of extreme water level under 50, 100 and 200 years return period are about 0.3, 0.4 and 0.5 m, which appear at the upstream end of the Hangzhou Bay. The extreme water levels in the Hangzhou Bay seems more sensitive to the increase of maximum wind speeds of tropical cyclones, which might be due to the squeezing effect of the horn-shape of the Hangzhou Bay.
(2) Under the scenario of increased maximum wind speeds of tropical cyclones, the decrease of return periods ranges about 10 to 35 years for 50-year return period, 30 to 80 years for 100-year return period, and 70 to 170 years for 200-year return period in the Yangtze River Delta and the sea area out of it. The general patten of the decrease of return periods is similar to that of the increase pattern of extreme water levels, i.e., the changes in the inner areas of the estuaries are more significant than those in the sea areas out of the estuaries. However, the decrease of return periods is less significant in the Hangzhou Bay than that in the Yangtze River Estuaries, which might be due to that the extreme water levels are higher in the Hangzhou Bay themselves.
It should be mentioned that the historical tropical cyclones are strengthened according to the upper limit (11%) of the IPCC (2012) estimation, so the quantitative values of the increases of extreme water levels and the decrease of return periods might be overestimated, but the patterns of spatial distributions are of reference significance to the management of future coastal disaster prevention and mitigation. The methodology can also be used in other estuaries to investigate the potential impacts of changes in climate and hydrology factors on extreme water levels and the corresponding return periods.
Data availability statement
The raw data supporting the conclusions of this article will be made available by the authors, without undue reservation.
Author contributions
Conceptualization and research plan: YP, XC. Numerical Experiments: WL, JT, PY. Data analysis and writing: JT, PY, YC. Review and editing: YP, XC. All authors contributed to the article and approved the submitted version.
Funding
We sincerely thank the supports from the National Natural Science Foundation of China (51979098), the Major Scientific and Technological Project of the Ministry of Water Resources (SKS-2022025) and the Natural Science Foundation of Zhejiang Province (LZ22E090003).
Conflict of interest
The authors declare that the research was conducted in the absence of any commercial or financial relationships that could be construed as a potential conflict of interest.
Publisher’s note
All claims expressed in this article are solely those of the authors and do not necessarily represent those of their affiliated organizations, or those of the publisher, the editors and the reviewers. Any product that may be evaluated in this article, or claim that may be made by its manufacturer, is not guaranteed or endorsed by the publisher.
References
Dietrich J. C., Zijlema M., Westerink J. J., Holthuijsen L. H., Dawson C., Luettich R. A. Jr., et al. (2011). Modeling hurricane waves and storm surge using integrally-coupled, scalable computations. Coast. Eng. 58 (1), 45–65. doi: 10.1016/j.coastaleng.2010.08.001
Feng J. L., Li W. S., Wang H., Zhang J. L., Dong J. X. (2018). Evaluation of sea level rise and associated responses in hangzhou bay from 1978 to 2017. Adv. Clim. Change Res. 9 (4), 227–233. doi: 10.1016/j.accre.2019.01.002
Gao J., Ma X., Dong G., Chen H., Liu Q., Zang J. (2021). Investigation on the effects of Bragg reflection on harbor oscillations. Coast. Eng. 170, 103977. doi: 10.1016/j.coastaleng.2021.103977
Gao J., Ma X., Zang J., Dong G., Ma X., Zhu Y., et al. (2020). Numerical investigation of harbor oscillations induced by focused transient wave groups. Coast. Eng. 158, 103670. doi: 10.1016/j.coastaleng.2020.103670
Guan D., Chiew Y. M., Melville B. W., Zheng J. (2019). Current-induced scour at monopile foundations subjected to lateral vibrations. Coast. Eng. 144, 15–21. doi: 10.1016/j.coastaleng.2018.10.011
He R., Kaynia A. M., Zhang J., Chen W., Guo Z. (2019). Influence of vertical shear stresses due to pile-soil interaction on lateral dynamic responses for offshore monopiles. Mar. Struct. 64, 341–359. doi: 10.1016/j.marstruc.2018.11.012
Holland G. J. (1980). An analytic model of the wind and pressure profiles in hurricanes. Month. Weather Rev. 108 (8), 1212–1218. doi: 10.1175/1520-0493(1980)108<1212:AAMOTW>2.0.CO;2
IPCC (2012). Managing the risks of extreme events and disasters to advance climate change adaptation. a special report of working groups I and II of the intergovernmental panel on climate change (Cambridge, UK, and New York, NY, USA: Cambridge University Press), 582.
Karim M. F., Mimura N. (2008). Impacts of climate change and sea-level rise on cyclonic storm surge floods in Bangladesh. Global Environ. Change 18 (3), 490–500. doi: 10.1016/j.gloenvcha.2008.05.002
Li Z., Li S., Hu P., Mo D., Li J., Du M., et al. (2022). Numerical study of storm surge-induced coastal inundation in laizhou bay, China. Front. Mar. Sci. 9, 952406. doi: 10.3389/fmars.2022.952406
Li M., Zhang F., Barnes S., Wang X. (2020). Assessing storm surge impacts on coastal inundation due to climate change: Case studies of Baltimore and Dorchester county in Maryland. Nat. Hazards 103 (2), 2561–2588. doi: 10.1007/s11069-020-04096-4
Li Y., Zhang C., Chen S., Sui T., Chen D., Qi H. (2022). Influence of artificial sandbar on nonlinear wave transformation: Experimental investigation and parameterizations. Ocean Eng. 257, 111540. doi: 10.1016/j.oceaneng.2022.111540
Li Y., Zhang C., Chen D., Zheng J., Sun J., Wang P. (2021). Barred beach profile equilibrium investigated with a process-based numerical model. Cont. Shelf Res. 222, 104432. doi: 10.1016/j.csr.2021.104432
Lu X., Yu H., Ying M., Zhao B., Zhang S., Lin L., et al. (2021). Western North pacific tropical cyclone database created by the China meteorological administration. Adv. Atmos. Sci. 38 (4), 690–699. doi: 10.1007/s00376-020-0211-7
Mattocks C., Forbes C. (2008). A real-time, event-triggered storm surge forecasting system for the state of north Carolina. Ocean Model. 25 (3-4), 95–119. doi: 10.1016/j.ocemod.2008.06.008
Pan Y., Chen Y. P., Li J. X., Ding X. L. (2016). Improvement of wind field hindcasts for tropical cyclones. Water Sci. Eng. 9 (1), 58–66. doi: 10.1016/j.wse.2016.02.002
Pan Y., Kuang C. P., Chen Y. P., Yin S., Yang Y. B., Yang Y. X., et al. (2018). A comparison of the performance of submerged and detached artificial headlands in a beach nourishment project. Ocean Eng. 159, 295–304. doi: 10.1016/j.oceaneng.2018.04.038
Pan Y., Kuang C. P., Li L., Amini F. (2015a). Full-scale laboratory study on distribution of individual wave overtopping volumes over a levee under negative freeboard. Coast. Eng. 97, 11–20. doi: 10.1016/j.coastaleng.2014.12.007
Pan Y., Kuang C. P., Zhang J. B., Chen Y. P., Mao X. D., Ma Y., et al. (2017). Postnourishment evolution of beach profiles in a low-energy sandy beach with a shoreface nourishment. J. Waterw. Port Coast. Ocean Eng. ASCE 143 (4), 05017001. doi: 10.1061/(ASCE)WW.1943-5460.0000384
Pan Y., Li L., Amini F., Kuang C. P. (2013). Full scale HPTRM strengthened levee testing under combined wave and surge overtopping conditions: Overtopping hydraulics, shear stress and erosion analysis. J. Coast. Res. 29 (1), 182–200. doi: 10.2112/JCOASTRES-D-12-00010.1
Pan Y., Li L., Amini F., Kuang C. P. (2015b). Overtopping erosion and failure mechanism of earthen levee strengthened by vegetated HPTRM system. Ocean Eng. 96, 139–148. doi: 10.1016/j.oceaneng.2014.12.012
Pan Z. H., Liu H. (2019). Extreme storm surge induced coastal inundation in Yangtze estuary regions. J. Hydrodyn. 31 (6), 1127–1138. doi: 10.1007/s42241-019-0086-1
Pan Y., Liu Y., Chen Y. P., Xu Z. S., Xu C. Y. (2022b). Probability forecast of storm surge levels in the changjiang estuary induced by tropical cyclones based on the error-estimation ensemble method. Ocean Eng. 245, 110524. doi: 10.1016/j.oceaneng.2022.110524
Pan Y., Yin S., Chen Y. P., Yang Y. B., Xu C. Y., Xu Z. S. (2022a). An experimental study on the evolution of a submerged berm under the effects of regular waves in low-energy conditions. Coast. Eng. 176, 104169. doi: 10.1016/j.coastaleng.2022.104169
Pan Y., Zhou Z. J., Chen Y. P. (2020). An analysis of the downward-flushing flow on the crest of a levee under combined wave and surge overtopping. Coast. Eng. 158, 103701. doi: 10.1016/j.coastaleng.2020.103701
Parker K., Ruggiero P., Serafin K. A., Hill D. F. (2019). Emulation as an approach for rapid estuarine modeling. Coast. Eng. 150, 79–93. doi: 10.1016/j.coastaleng.2019.03.004
Powell M. D., Vickery P. J., Reinhold T. A. (2003). Reduced drag coefficient for high wind speeds in tropical cyclones. Nature 422, 279–283. doi: 10.1038/nature01481
Robins P. E., Skov M. W., Lewis M. J., Giménez L., Davies A. G., Malham S. K., et al. (2016). Impact of climate change on UK estuaries: A review of past trends and potential projections. Estuar. Coast. Shelf S. 169, 119–135. doi: 10.1016/j.ecss.2015.12.016
Shankar C. G., Behera M. R. (2021). Numerical analysis on the effect of wave boundary condition in storm wave and surge modeling for a tropical cyclonic condition. Ocean Eng. 220, 108371. doi: 10.1016/j.oceaneng.2020.108371
Shen Y., Deng G., Xu Z., Tang J. (2019). Effects of sea level rise on storm surge and waves within the Yangtze river estuary. Front. Earth. Sci. 13 (2), 303–316. doi: 10.1007/s11707-018-0746-4
Temmerman S., Meire P., Bouma T., Herman P. M. J., Ysebaert T., de Vriend H. J. (2013). Ecosystem-based coastal defence in the face of global change. Nature 504, 79–83. doi: 10.1038/nature12859
Wang J., Gao W., Xu S., Yu L. (2012). Evaluation of the combined risk of sea level rise, land subsidence, and storm surges on the coastal areas of shanghai, China. Climatic Change 115 (3), 537–558. doi: 10.1007/s10584-012-0468-7
Wang S., Mu L., Qin H., Wang L., Yao Z., Zhao E. (2022). The utilization of physically based models and GIS techniques for comprehensive risk assessment of storm surge: A case study of huizhou. Front. Mar. Sci. Coast. Ocean Processes 9, 939380. doi: 10.3389/fmars.2022.939380
Wang G., Stanis Z. E. O. G., Fu D., Zheng J., Gao J. (2020). An analytical investigation of oscillations within a circular harbor over a conical island. Ocean Eng. 195, 106711. doi: 10.1016/j.oceaneng.2019.106711
Westerink J. J., Luettich R. A., Feyen J. C., Atkinson J. H., Dawson C., Roberts H. J., et al. (2008). A basin to channel scale unstructured grid hurricane storm surge model applied to southern Louisiana. Mon. Weather Rev. 136 (3), 833–864. doi: 10.1175/2007MWR1946.1
Yin K., Xu S., Huang W., Xie Y. (2017). Effects of sea level rise and typhoon intensity on storm surge and waves in pearl river estuary. Ocean Eng. 136, 80–93. doi: 10.1016/j.oceaneng.2017.03.016
Ying M., Zhang W., Yu H., Lu X., Feng J., Fan Y., et al. (2014). An overview of the China meteorological administration tropical cyclone database. J. Atmos. Oceanic Technol. 31 (2), 287–301. doi: 10.1175/JTECH-D-12-00119.1
Yuan S. Y., Xu L., Tang H. W., Xiao Y., Gualtieri C. (2022). The dynamics of river confluences and their effects on the ecology of aquatic environment: A review. J. Hydrodyn. 34, 1–14. doi: 10.1007/s42241-022-0001-z
Zhang Z., Pan Y., Yu P. B., Chen Y. P., Yang Y. Z. (2020). Characteristic of wave-induced setup in the changjiang estuary during typhoon processes. J. Coast. Res. SI 95), 1563–1568. doi: 10.2112/SI95-301.1
Zhao C., Ge J., Ding P. (2014). Impact of sea level rise on storm surges around the changjiang estuary. J. Coast. Res. 68, 27–34. doi: 10.2112/SI68-004.1
Keywords: return period, extreme water levels, Yangtze River Delta, tropical cyclone, maximum wind speed
Citation: Pan Y, Li W, Tan J, Yu P, Chen X and Chen Y (2023) An investigation on the effects of increasing maximum wind speed of tropical cyclones on the return periods of water levels in the sea area of the Yangtze River Delta. Front. Mar. Sci. 10:1101640. doi: 10.3389/fmars.2023.1101640
Received: 18 November 2022; Accepted: 16 March 2023;
Published: 27 March 2023.
Edited by:
Juan Jose Munoz-Perez, University of Cádiz, SpainReviewed by:
Feng Liu, Sun Yat-sen University, ChinaKezhao Fang, Dalian University of Technology, China
Copyright © 2023 Pan, Li, Tan, Yu, Chen and Chen. This is an open-access article distributed under the terms of the Creative Commons Attribution License (CC BY). The use, distribution or reproduction in other forums is permitted, provided the original author(s) and the copyright owner(s) are credited and that the original publication in this journal is cited, in accordance with accepted academic practice. No use, distribution or reproduction is permitted which does not comply with these terms.
*Correspondence: Yi Pan, cGFueWlAaGh1LmVkdS5jbg==