 Qi Lou
 Xueqing Zhang
 Xusheng Xiang
 Fan Yu1,3
 Ying Xiong
 Zhengyan Li
- 1College of Environmental Science and Engineering, Ocean University of China, Qingdao, China
- 2Key Laboratory of Marine Environment and Ecology, Ministry of Education of China, Ocean University of China, Qingdao, China
- 3State Key Laboratory of Nuclear Power Safety Monitoring Technology and Equipment, Shenzhen, China
- 4Marine and Fisheries Research Institute in Jiangsu Province, Nantong, China
The outbreak of nuclear power cooling water system (NPCS) disaster-causing organisms has become more frequent, causing huge economic losses. Therefore, it is necessary to understand the aggregation mechanism of disaster-causing organisms for the risk prevention and control of NPCS. Hence, this study applied the Lagrangian flow network (LFN) to analyze the aggregation mechanism of Acetes near NPCS, as such a complex network can describe the interconnections between massive nodes and has already been used for modeling complex nonlinear systems, revealing how the mechanisms of such novel processes emerge. In this study, the degree and probability paths in the network were used to reveal the transport pathway and aggregation area of Acetes. The experimental results highlighted that the sea area of the nuclear power plant is the key node with a large in-degree of the LFN, where the material easily accumulated. The Acetes near the NPCS mainly originated from the east along two critical paths. Overall, this study demonstrates that the LFN is a feasible approach to predicting the transport and the accumulation of the NPCS disaster-causing plankton.
1 Introduction
According to the 2022 world nuclear industry status report, in 2021, the world’s nuclear power plants generated 2,653 billion kilowatt-hours of electricity, constituting 9.8% of the total electricity generated (Schneider et al., 2016). Most nuclear power plants are located in coastal areas to utilize seawater as the cooling water source, imposing challenges to the safe operation of seawater intake. In recent years, marine biological outbreaks have blocked the cold source seawater intake of nuclear power plants, affecting the safe and stable operation of such power plants from time to time (Azila and Chong, 2010; Barath Kumar et al., 2017). Blockage of the cold source seawater intake of coastal nuclear power plants mainly involves algae, jellyfish, Acetes, seagrass, sand, ice, and crude oil, among others, of which these marine organisms are the main causes, accounting for 84% of the blocking events (An et al., 2021). In China, the nuclear power plants at Hongyanhe, Ningde, Fangchenggang, and Yangjiang have been shut down several times due to the blockage of the cooling water intakes caused by blooms of jellyfish, sea cucumbers, algae, and Acetes, respectively (Zeng et al., 2019; An et al., 2021; Wang et al., 2021). Specifically, due to their high biological density, short growth period, fast growth rate, and small size, Acetes are the most challenging disaster-causing organisms that should be controlled. Thus, this study focused on the Acetes near a nuclear power cooling water system (NPCS) and analyzed their transport, aggregation, and outbreak mechanisms.
Studies on the transport and mechanism of Acetes have received more attention in recent years. One of the research approaches is ocean investigation, such as the trawl method, underwater visual census techniques (Edgar et al., 2004; Tessier et al., 2013), acoustic method (Zeng et al., 2019), and the vessel monitoring system (VMS) (Fonseca et al., 2008; Li et al., 2022). An alternative research approach is employing a statistical model in which a species distribution model (SDM), such as BIOCLIM (bioclimatic modeling), DOMAIN (domain environmental envelope), GARP (genetic algorithm for rule-set production), CLIMEX (climate change experiment), and MaxEnt (maximum entropy) (He et al., 2021), utilizes the known species distribution data and relevant environmental variables to determine the spatial niche of species. However, this statistical model cannot reveal the dynamic mechanisms. Therefore, the particle tracking model (Hufnagl et al., 2017) or the individual-based model (IBM) (El Saadi and Bah, 2006; Falcini et al., 2020) is often applied to study the transport of biological particles, but describing the transport pathway and the connectivity between regions from complex particle trajectories is quite difficult.
This work utilized the Lagrangian flow network (LFN) theory to study the transport of Acetes. The LFN describes the fluid flow or material exchange among different locations, which is defined as a flow network or transport network. In the LFN, small regions in the fluid domain are interpreted as vertices, and the mass transfer from one of these regions to another defines the weighted links among them (Ser-Giacomi et al., 2015a). Based on the network, the material transport convert to the characteristics of the complex networks. Hence, a lot of powerful tools from the graph theory are available for analysis of the material transport processes. Over the past decade, the LFN theory has been successfully applied to analyze turbulent mixing (Iacobello et al., 2019), ocean transport in the Mediterranean (Ser-Giacomi et al., 2015b), and ocean surface connectivity in the Arctic (Reijnders et al., 2021), etc.
In this study, the prognostic, unstructured grid, finite-volume, free-surface, three-dimensional primitive equation coastal ocean circulation model (FVCOM) was used to obtain the current field of the study area, and the LFN approach was applied to detect the structures of the material transport, including the degrees, betweenness, and connectivity.
This paper is organized as follows. Section 1 introduces the background of the NPCS disaster-causing organisms. Section 2 introduces the hydrodynamic model and the LFN approach. Section 3 shows the results of the distribution, the pathway, and the source of the Acetes particles. Section 4 includes the discussion and conclusion.
2 Materials and methods
The LFN framework requires the calculation of the material transport process in the whole domain and then uses a number of mathematical methods to map the material transport process into the edges of the network. The first step in calculating the material transport process is to obtain the hydrodynamic field with a high spatial and temporal resolution, which can only be derived from the ocean circulation model. Therefore, the FVCOM was introduced in this study.
2.1 Hydrodynamic model
FVCOM was applied to obtain the hydrodynamic field in this study. The hydrodynamic equations were numerically resolved on unstructured grids using the finite-volume method. Because of the advantage of the body-fitted grid, FVCOM is widely used in estuarine and coastal areas. In addition, the finite-volume algorithm guarantees volume and mass conservation of the momentum fluxes. The reader is referred to Chen et al. (2003) for further details on the governing equations.
In this study, the model area is located 111.86°–112.97° E, 21.45°–22.02° N (Figure 1), which comprised 4,505 nodes and 8,172 triangles (elements) with 200 m minimum horizontal grid resolution and five uniform σ layers. Horizontal diffusion was parameterized based on Smagorinsky’s formation, and vertical turbulent mixing was calculated with the 2.5-level Mellor and Yamada turbulence model. The tide level data on the boundary were taken from the TMD toolbox (Tidal Model Driver) (Padman, 2005) with the TPXO7 global tide model, which included eight tidal constituents (M2, S2, K1, O1, P1, Q1, N2, and K2). The sea surface wind data were extracted from the ERA5 (European Centre for Medium-Range Weather Forecasts) reanalysis dataset. The drainage water of the NPCS was also included in the model, with the flux set as 350 m3/s (Chen et al., 2013) at a temperature of 8°C higher than natural environment seawater.
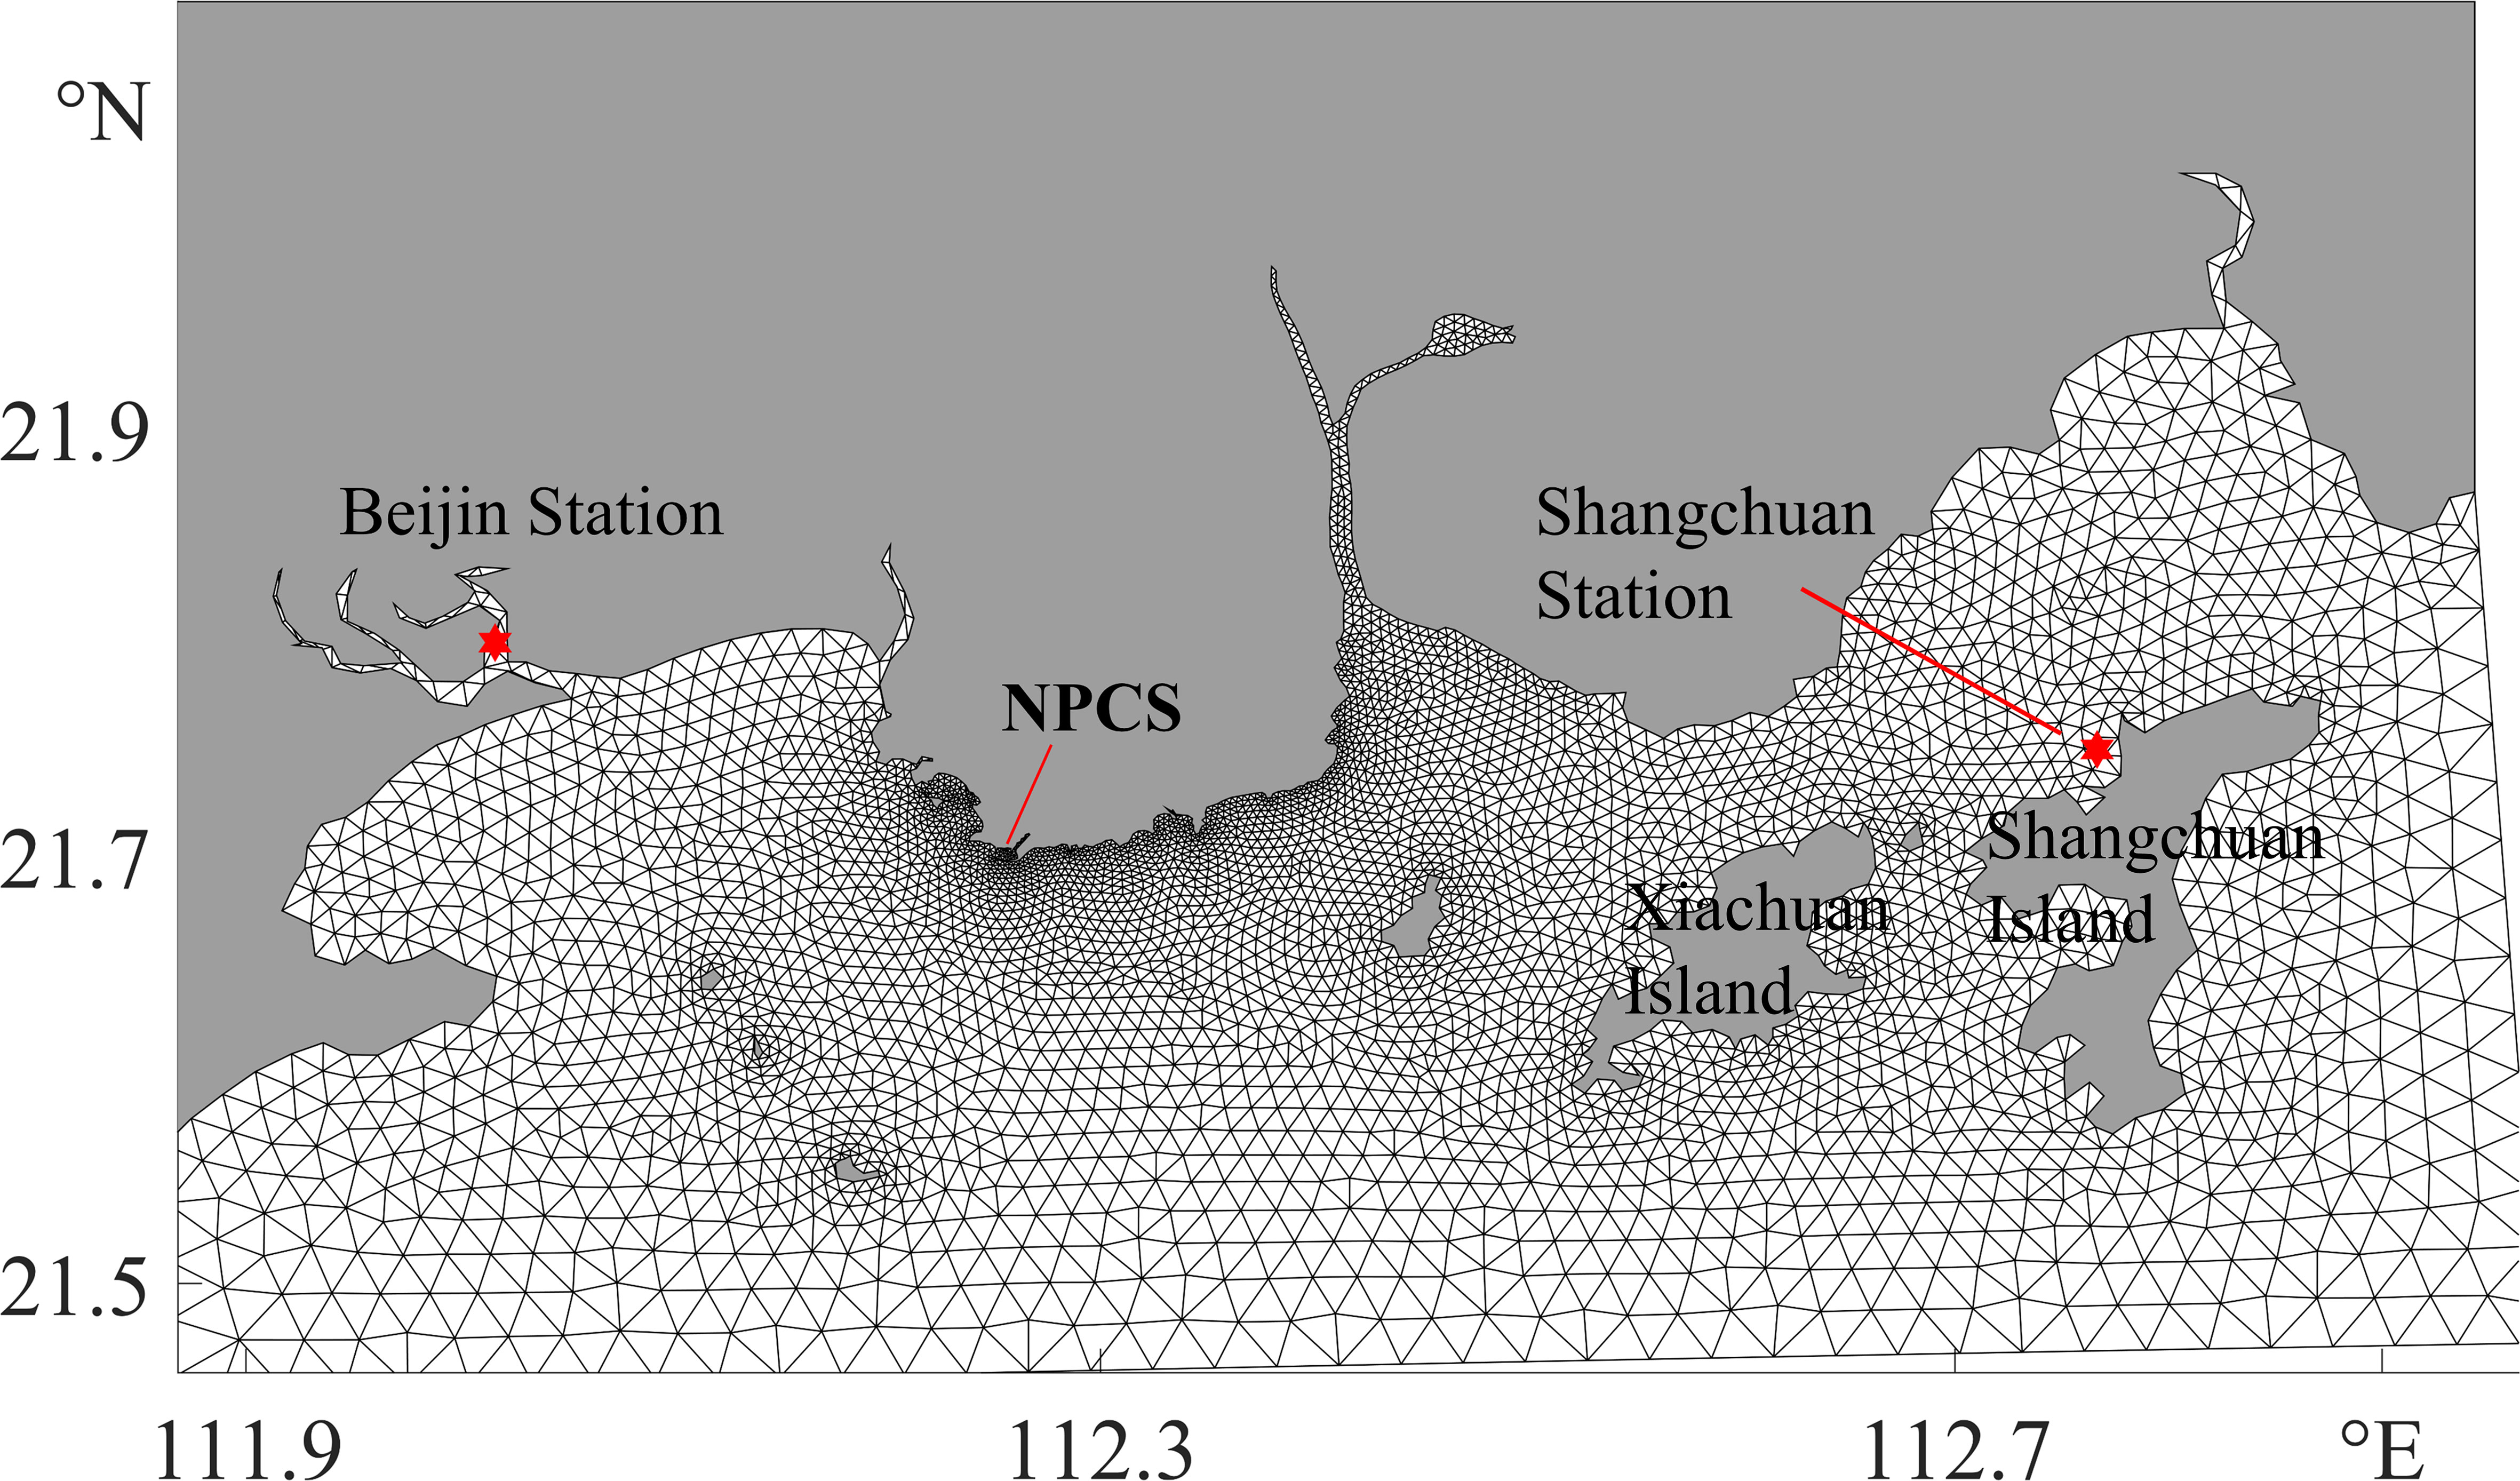
Figure 1 Model grid in the study area.
FVCOM produced a three-dimensional hydrodynamic field hourly. Subsequently, the surface current field was extracted and interpolated to drive a particle tracking model to simulate the drifting process of Acetes, which was then used in the construction of the LFN.
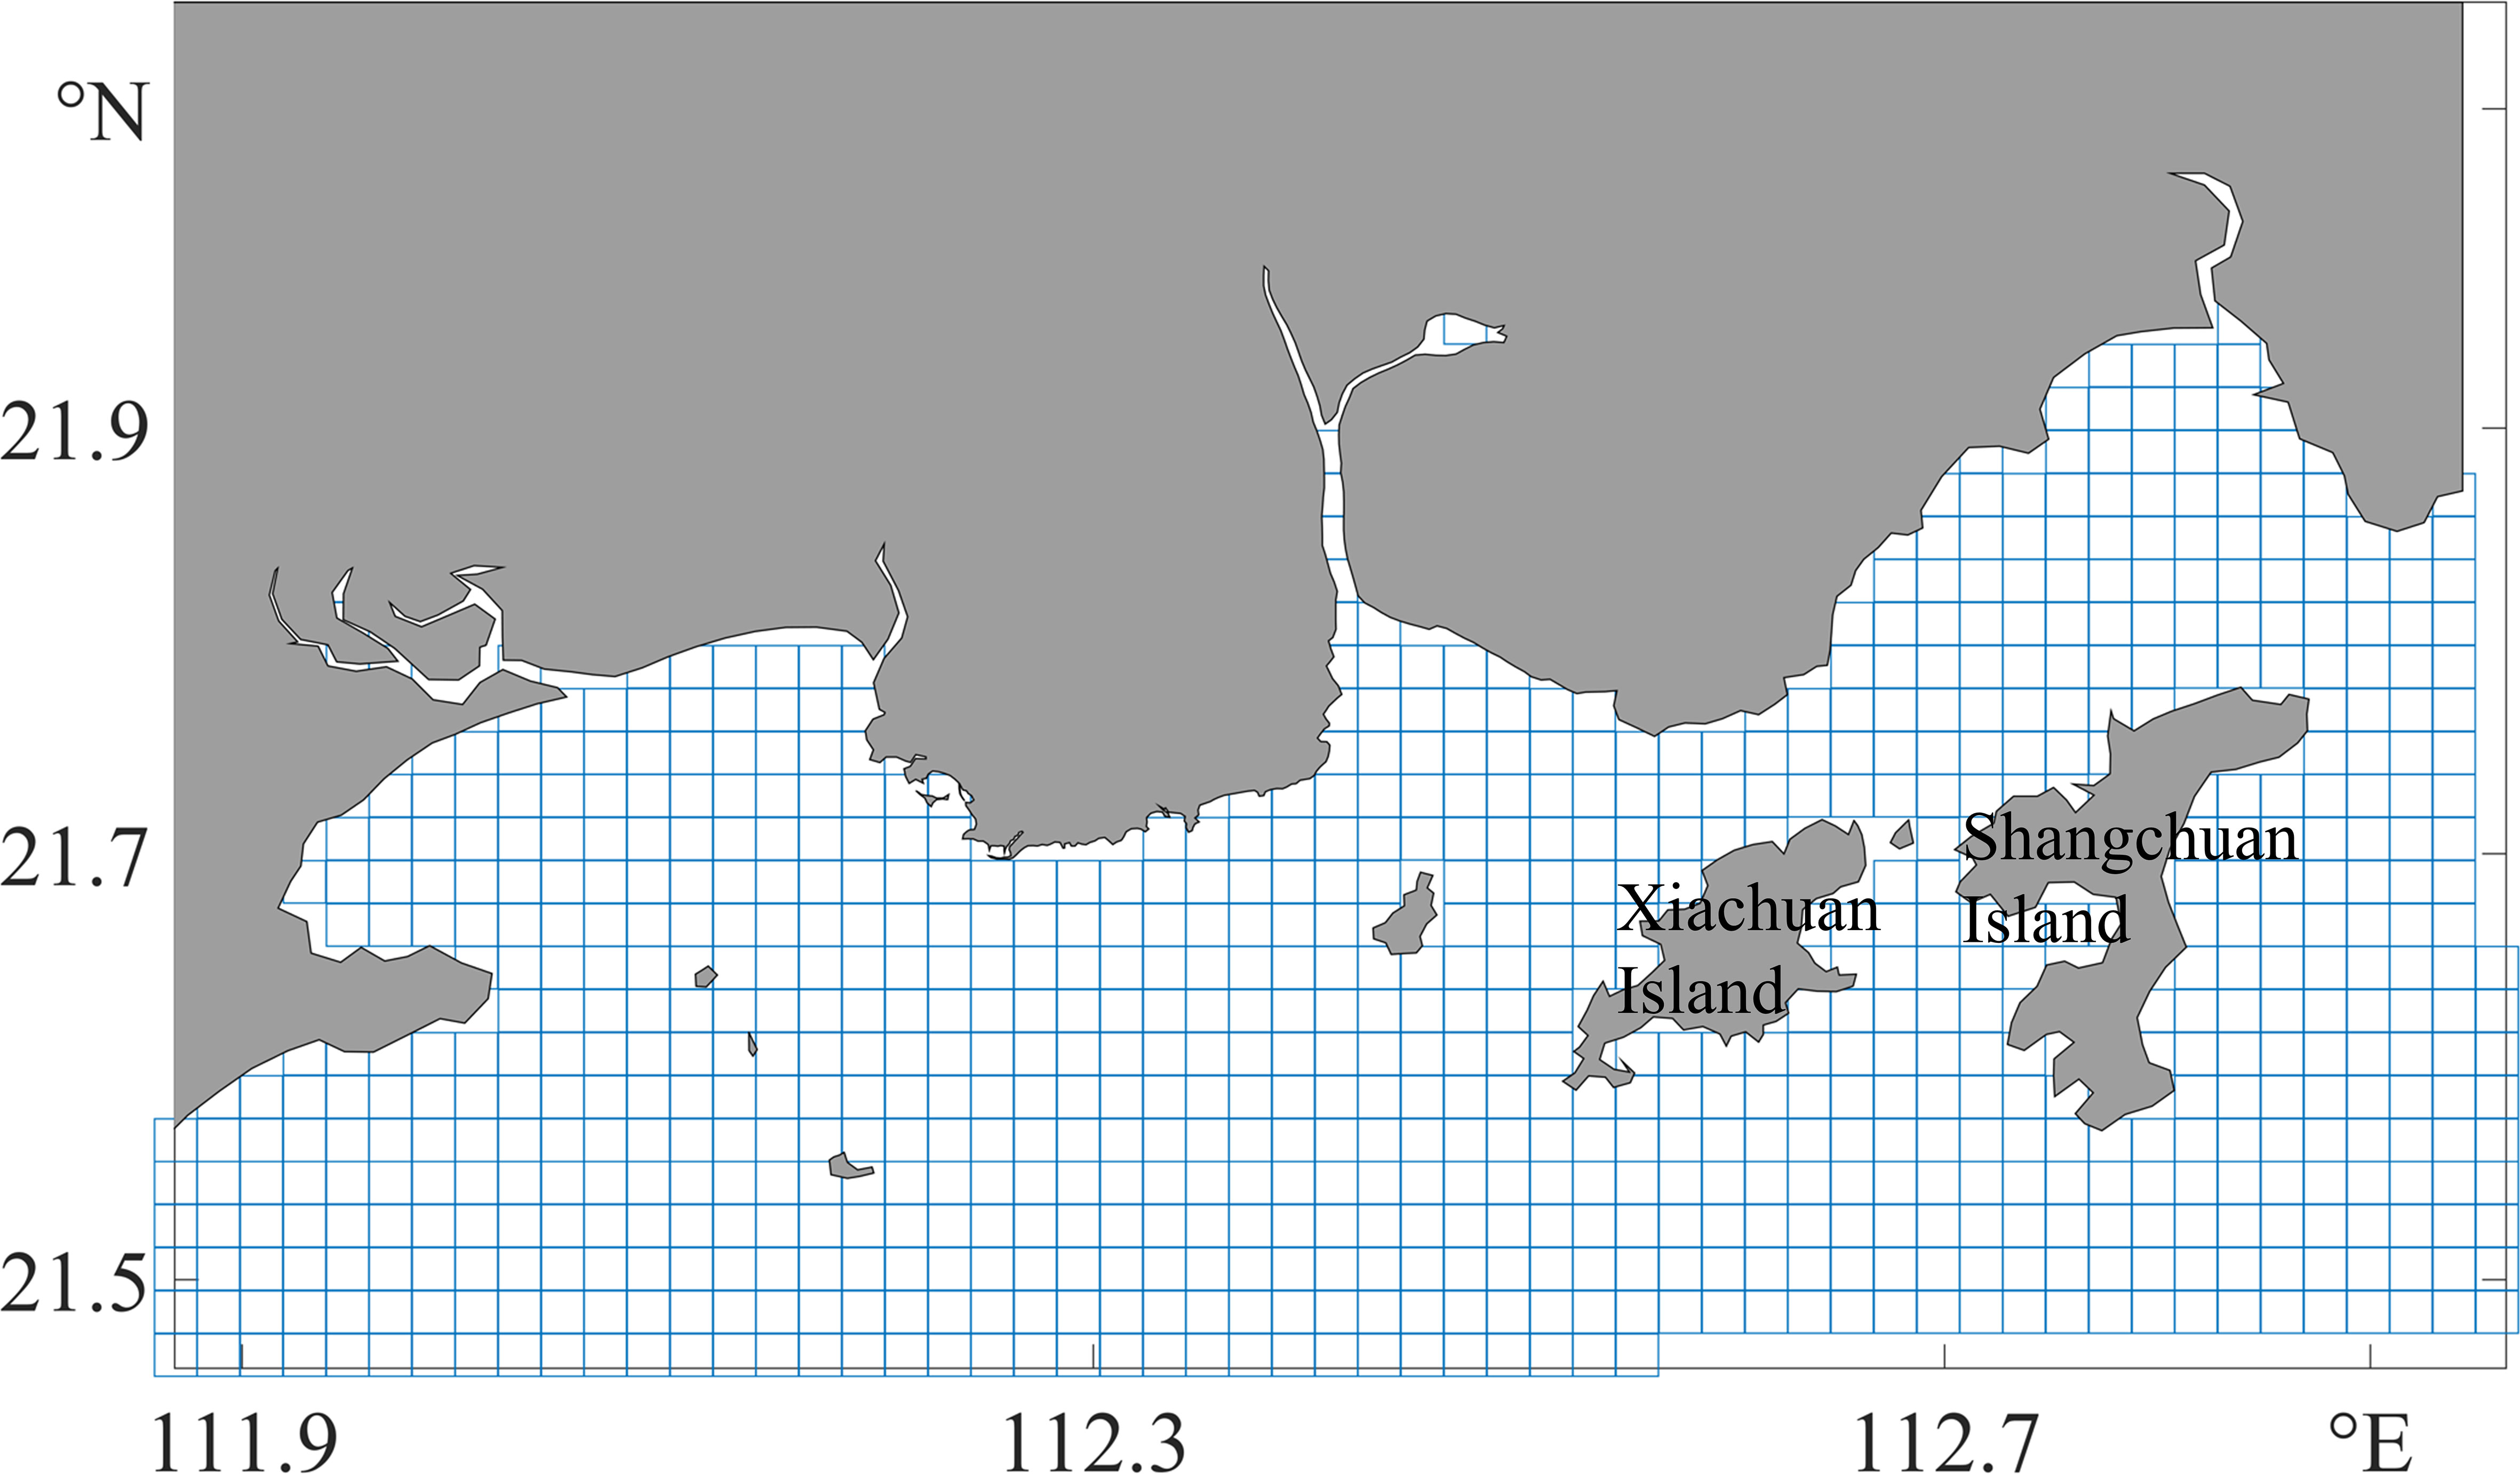
Figure 2 Vertices of the Lagrangian flow network (LFN) in the study area.
2.2 Construction of the Lagrangian flow network
The network, also called the graph in mathematics, is a set of points joined together in pairs by lines. The points are referred to as vertices or nodes and the lines referred to as edges or links. Many objects of interest in the physical, biological, and social sciences can be considered as networks (Newman, 2010). The adjacency matrix is the most common representation of a network. The adjacency matrix A is the matrix with elements Aij:
The network constructed by Aij is unweighted. Similarly, the weight matrix representing the strength of the connection between vertices i and j is denoted as Wij:
In the ocean, one way to establish the network is to base it on the particle transport dynamics, in which the nodes correspond to discretized domains and the links are defined by the connectivity between the regions (Ser-Giacomi et al., 2015a). The research domain was divided into 831 sub-regions (Figure 2) with an area of 4 km2. A total of 250,000 particles were seeded in the domain, and all particles were tracked from time t0 March 1) to time t (March 30). The swimming speed of Acetes was far less than the flow velocity, so that they are considered as being passively advected by the sea current:
where is the displacement vector of the particles at time t and the derivative of the displacement vector to time t. The is the velocity of the particle coming from the FVCOM output.
For any particle that moves from Vi to Vj, the connection from Vi to Vj is established defining the edge Eij (Aij = 1). However, it should be emphasized that the link in the network is directed, which means that the link from Vi to Vj is not the same as that from Vj to Vi. Moreover, the weight of the links is defined by the transport probability of particles from vertex Vi to Vj:
where Nij is the number of particles from Vi to Vj and Ni is the initial number of particles in Vi. Pij(t0,τ) is regarded as the weight of the link from node Vi to node Vj. Subsequently, the network described by a transport matrix P(t0,τ) as constructed.
3 Results
3.1 Model validation
3.1.1 Water level validation
Tide is the most prominent driving factor of the current field offshore. Therefore, we verified the model based on the tidal level. The tide observation data, covering the period from December 20 to December 30, 2019, were obtained from the National Marine Data Center. Figure 1 illustrates the tide stations, while Figure 3 compares the simulation and the observation results, highlighting that the results of the model fitted well with the observations. The mean Pearson’s correlation coefficient for the two-site data was 0.9616, and the root mean square error (RMSE) values were 0.18 and 0.10 m for the Beijin and Shangchuan stations, respectively.
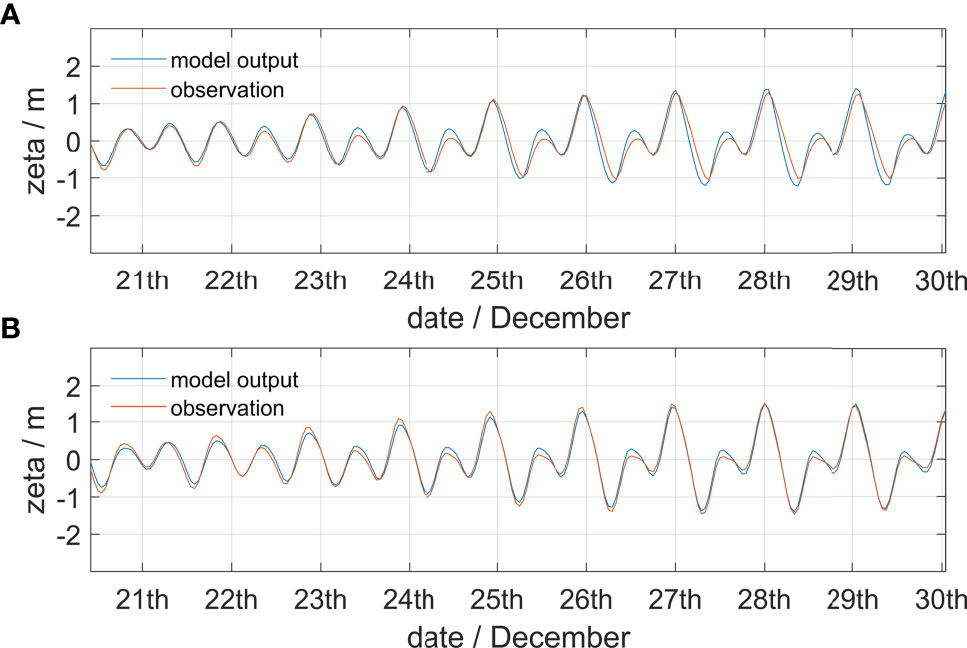
Figure 3 Tidal level validation at Beijin station (A) and Shangchuan Island station (B).
3.1.2 Tidal current validation
The M2 and K1 tide components dominated the current in the investigated research domain. We calculated the tide current ellipse of these tide components based on the output of the FVCOM, and the observation data were derived from an environmental impact assessment report conducted near the nuclear power plant (Zhang, 2021). The in situ investigation started on June 21 and ended on June 23, 2020. The parameters including the major axis length, the minor axis length, and the orientation of the tidal ellipses based on the observation data were provided in this report. The tidal ellipses at three observation stations were calculated from the model output as well for comparison.
As seen in Figure 4, the M2 tidal current component with a speed of about 20 cm/s contributed the majority of the tidal current, and the average speed of the K1 tide ellipses was about 10 cm/s. The tide ellipse orientations of the model and the observation were similar, which were both parallel to the coastline, and the difference of the ellipse axis length between the simulated and measured values was not obvious, confirming the validity of the FVCOM from the other side. Quantitatively, for M2 and K1, the RMSE values of the tide ellipse major axis length were 3.09 and 2.40 cm/s, respectively, while those of the tide ellipse orientation were 15.26° and 3.72°, respectively. In conclusion, the hydrodynamic model can provide reliable hydrodynamic fields for subsequent analysis.
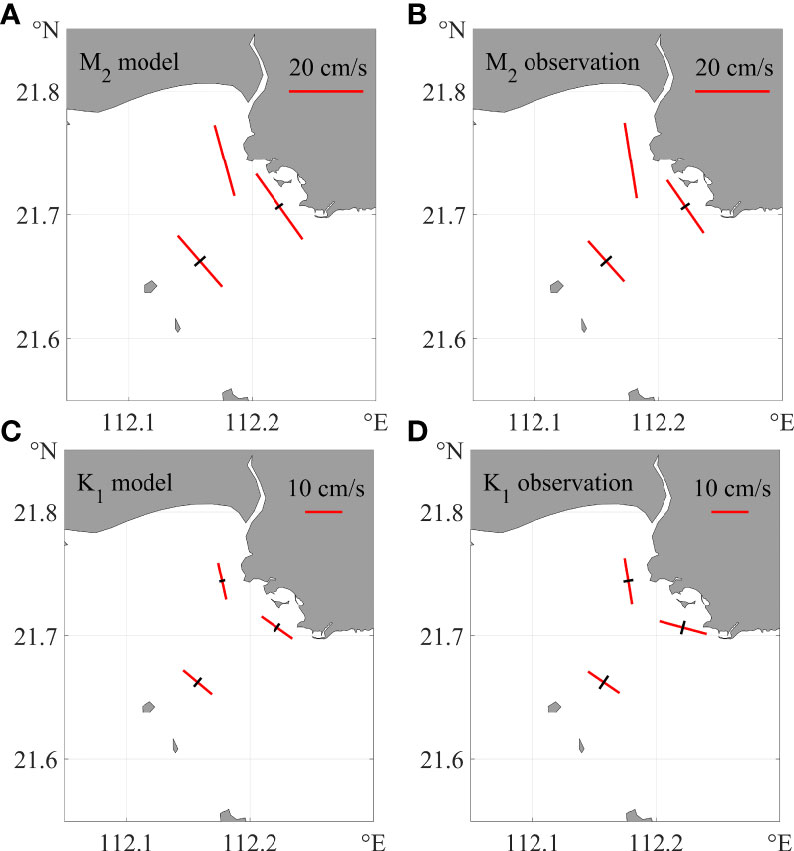
Figure 4 Tidal current ellipses obtained through both model simulation and observation. (A) Model output of the M2 tide ellipse. (B) Observation of the M2 tide ellipse. (C) Model output of the K1 tide ellipse. (D) Observation of K1.
3.2 Tidal current field
Figure 5 depicts the flow field distribution at ebb time and flood time during the spring tide in the simulated area. At flood time, the current flowed from the southeast to northwest, and at ebb time, the flow direction is in reverse. During flood time, the flow velocity in the whole field was mostly at 0–0.4 m/s, which can reach 0.4–0.8 m/s in the area around the NPCS and Xiachuan Island due to the influence of topography. The velocity during the ebb time was lower than that during flood time.
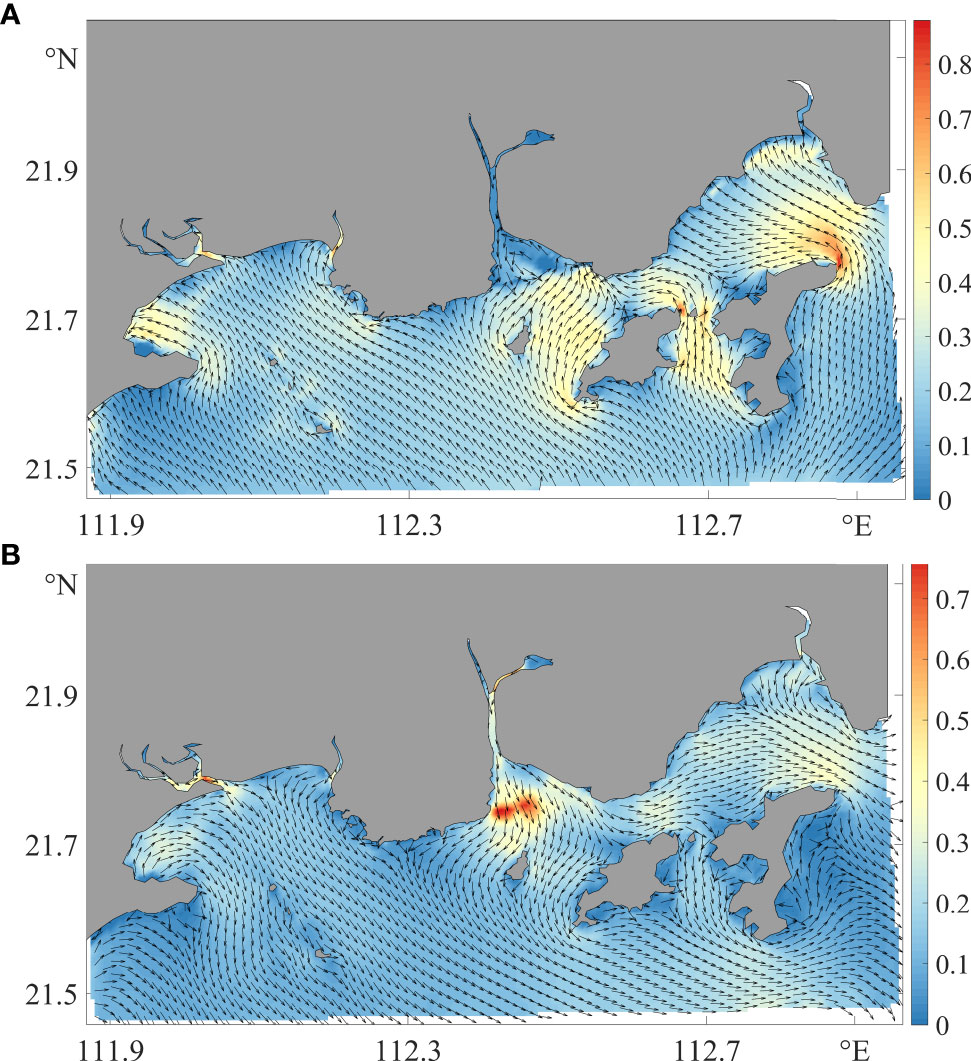
Figure 5 Current distribution at flood time (A) and ebb time (B).
3.3 Transport of virtual Acetes particles
To clearly describe the transport and distribution of Acetes near the nuclear power plant, this study utilized a Lagrangian particle tracking model using passive particles to represent the Acetes. The particles were seeded in a uniform distance of 200 m and ran for 30 days, with March 1, 2020, as the initial release moment. Figure 6 shows the distribution of the particles for 3, 7, 15, and 30 days after releasing the particles.
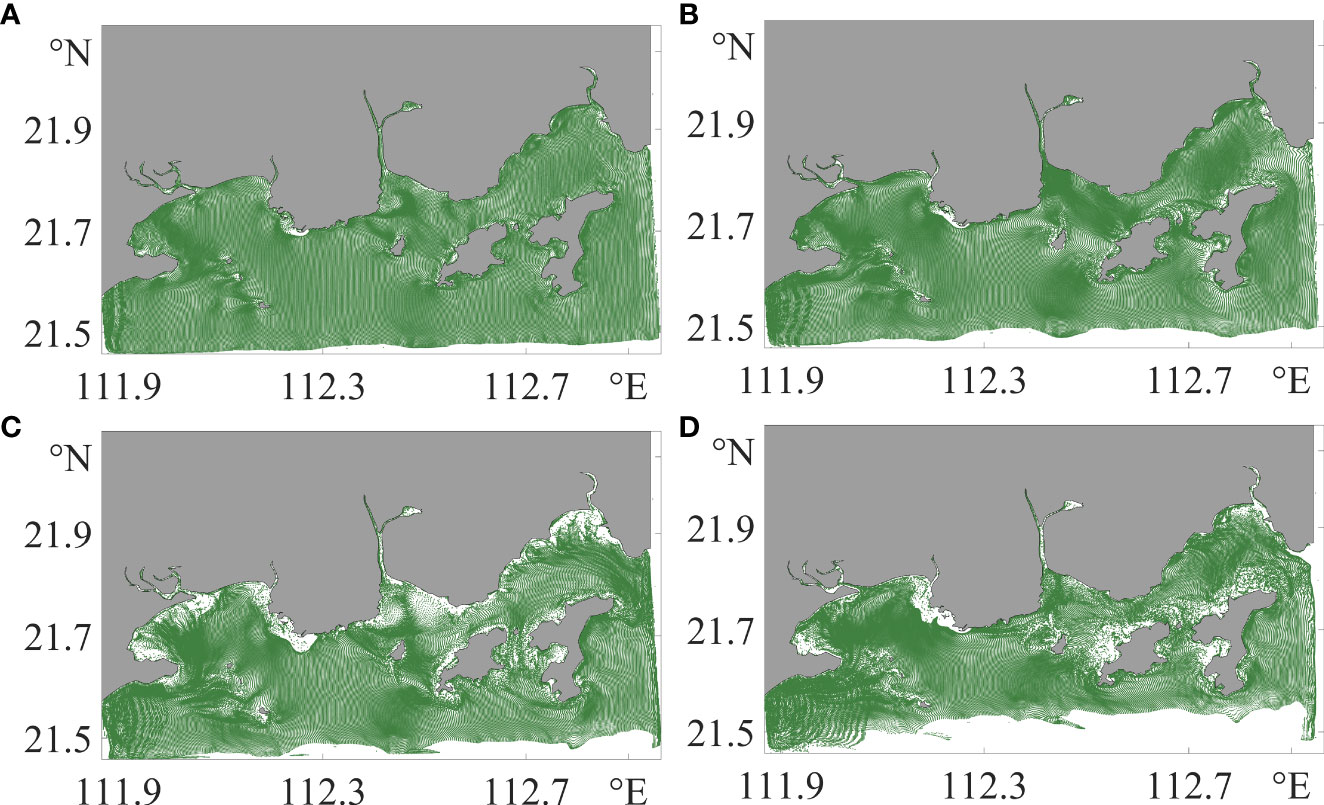
Figure 6 Distribution of the virtual Acetes particles for integration times of 3 days (A), 7 days (B), 15 days (C), and 30 days (D) since March 1, 2020.
The particles were mainly transported offshore for 3 days in the study area. After 7 days, the particles started showing a spatial dispersion near the coast, with some striped distribution structures. Figures 6C, D indicate obvious strips of structures where the aggregation of the particles occurred near the sea entry of three rivers. In contrast, the particles at the estuary spread rapidly, and the number of remaining particles was very small. The particles were mostly in patched aggregates near several islands on the eastern side of the study area. Since Acetes are poor swimmers and can be considered as plankton whose transport and distribution are controlled by currents, the particle tracking results can represent their trajectories in this region.
3.4 Out-degree and in-degree
The degree of a vertex in a graph is the number of edges connected to it. In a directed network, the connectivity of each vertex is described by both the in-degree and the out-degree. The in-degree of vertex i is the number of edges arriving at i while the out-degree of vertex i is the number of outgoing edges from i. In terms of the adjacency matrix Aji the in-degree and out-degree can be written as:
The degree of a vertex has an immediate interpretation considering centrality, quantifying how well an element is connected to the other elements in the graph (Barrat et al.). Regarding the LFN that corresponds to the aggregation and diffusion of materials in the ocean, the vertex with a large in-degree implies that the material easily accumulates there, which is generally considered as a “sink” in the description of ocean material transport; in contrast, a large out-degree indicates that the vertex can be considered as a “source”.
Figure 7 illustrates the distribution of the in-degree and out-degree within 30 days. The degrees were mostly less than 10, and vertices with a large degree are likely to be near the coast. Figure 7 also highlights that the in-degree and out-degree were higher at offshore areas, i.e., sea areas where the cooling system is located that act both as a “sink” and as a “source” of the materials around them. From a network’s perspective, it is the hub vertex in the material transport process. If any environmental variations influence the nearby material transport, for instance, reducing the diffusion process, the materials will be continuously convected inwards because of the large in-degree, but not outwards due to the limited diffusion process. The NPCS is in an unstable equilibrium condition, and this material transport pattern brings with it a high risk of natural outbreak of these organisms.
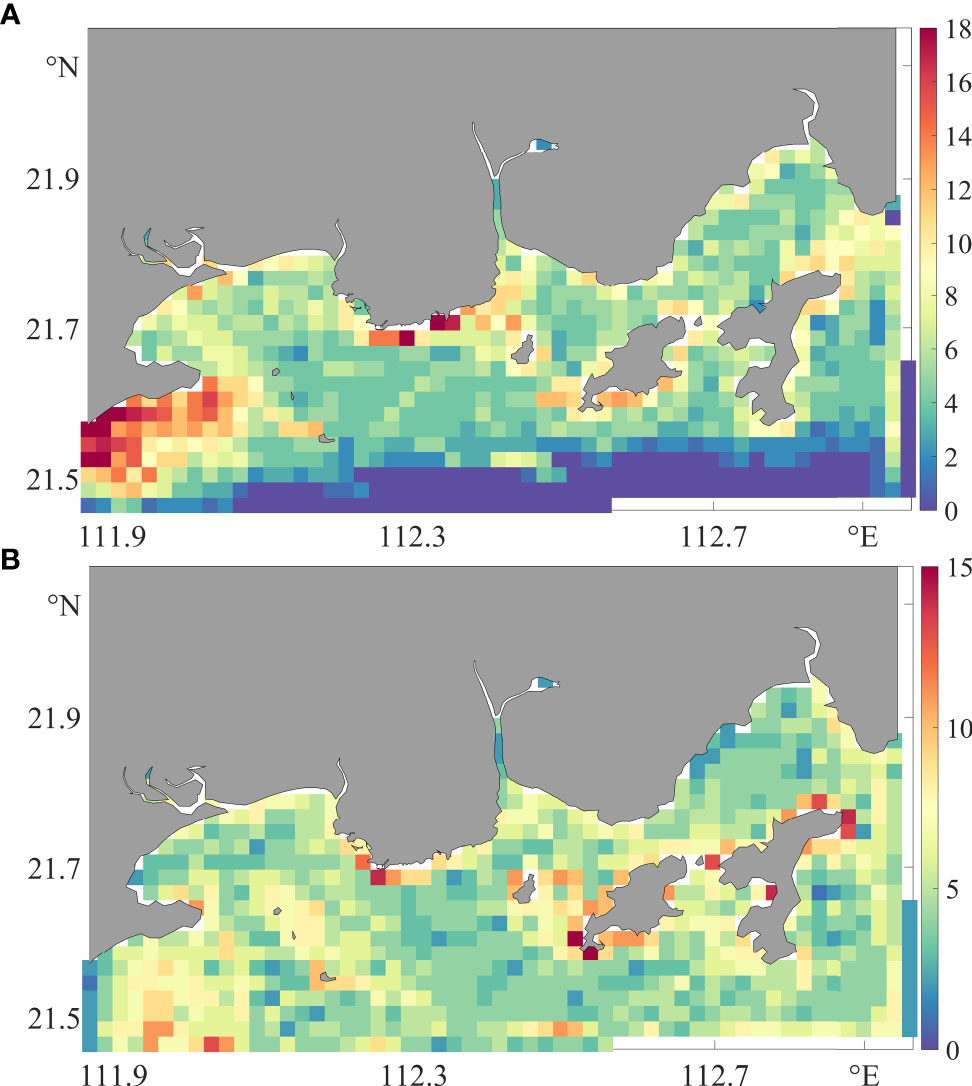
Figure 7 Distribution of in-degree (A) and out-degree (B).
3.5 The path and source of Acetes
A path in a network is any sequence of vertices so that every consecutive pair of vertices in the sequence is connected by an edge in the network (Newman, 2010). The path is often used to analyze the connectivity among vertices, and the path concept depends on the distances among vertices. In the ocean, the distance is not limited to the Euclidean distance, as the shortest time to the fastest path or the most probable path (MPP) is more meaningful in practice. This study applied the MPP to determine the optimum path.
When all paths connected to the location of the nuclear power plant were found, we collected their starting points and labeled them as the source of Acetes (red dots in Figure 8). Obviously, the results depend on the integration time. Considering the results within 30 and 90 days, the potential source area was located east of the nuclear power plant, which covered an area of about 120 km2, and within 90 days, the area was about 475 km2.
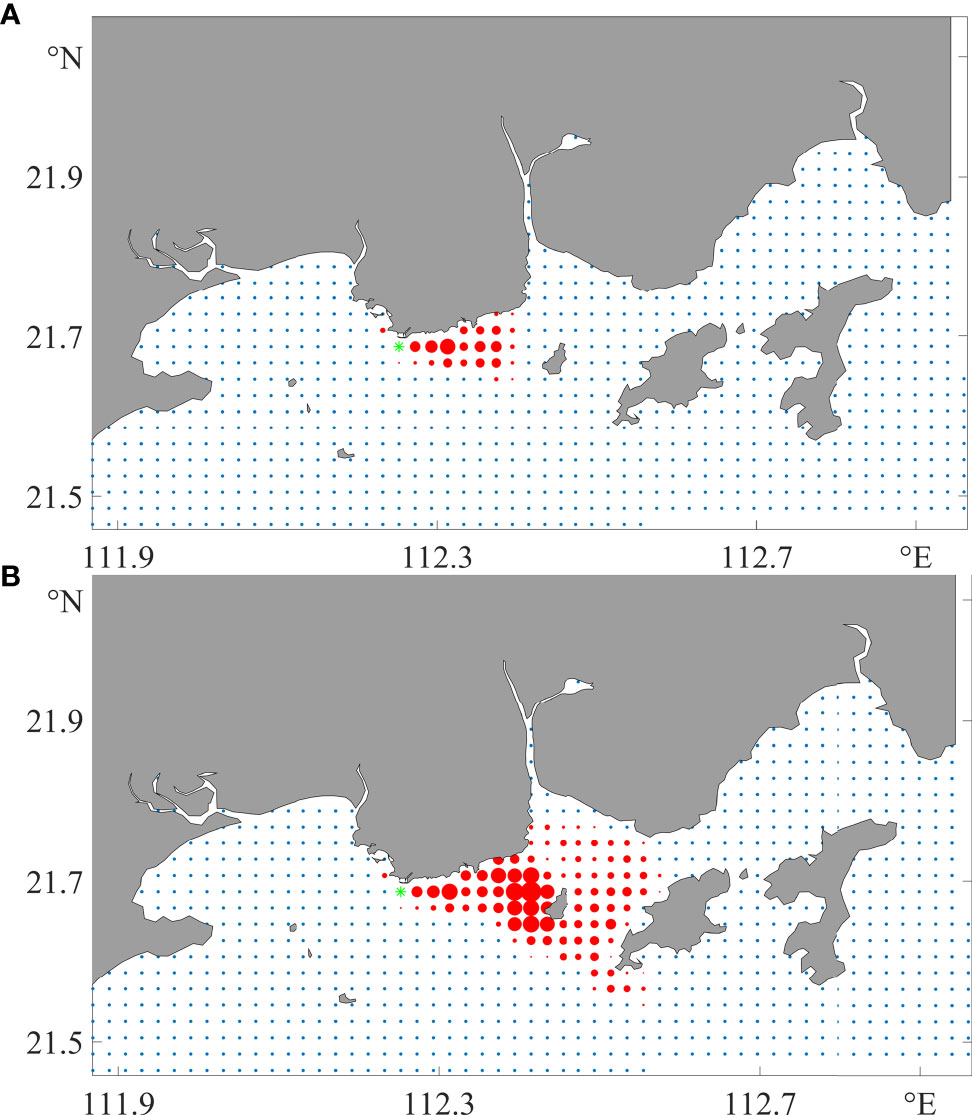
Figure 8 Potential source of Acetes near the nuclear power plant. (A, B) Results within 30 days (A) and 90 days (B).
In order to determine the path, we introduced another network metric, the betweenness centrality. Betweenness measures the extent to which a vertex lies on the key paths between other vertices. Mathematically, if Njl s the total number of the MPPs (Ser-Giacomi et al., 2015b) from Vj o Vl and Njl(i) is the number of these MPPs that pass through the Vi the betweenness of Vi is defined as:
Vertices with high betweenness pose a greater influence within a network. On the other hand, in terms of the ocean, betweenness is a measure of the hidden bottlenecks of the material transport system, and aligned high-betweenness vertices indicate the major material transport pathways (Ser-Giacomi et al., 2021). Hence, the betweenness is critical in the analysis of material transport and in the determination of the ocean’s flow structure.
As mentioned above, the Acetes near the nuclear power plant originated from the east with a large probability. The betweenness results showed that the organisms were not uniformly or randomly transported to the nuclear power plant’s sea area. Instead, two clear transport pathways (Figure 9) passed through the sea area of the nuclear plant. The first pathway goes along the coast that extends to the eastern boundary of the research domain, while the other bypasses the southern edges of Xiachuan Island and merges with the first pathway just near the NPCS. The two pathways formed a “-<“-shaped transport structure, and the intersection of two major material transport pathways was only about 10 km from the NPCS. Most of the time, this “-<“-shaped pathway carries materials westward and works in balance. However, when any environmental interruptions such as coast-pointing winds occur, this fragile system falls into unbalance and the material flow is cut off, which might result in an organism aggregation or even in a harmful outbreak. The effect of wind direction will be discussed in the next section.
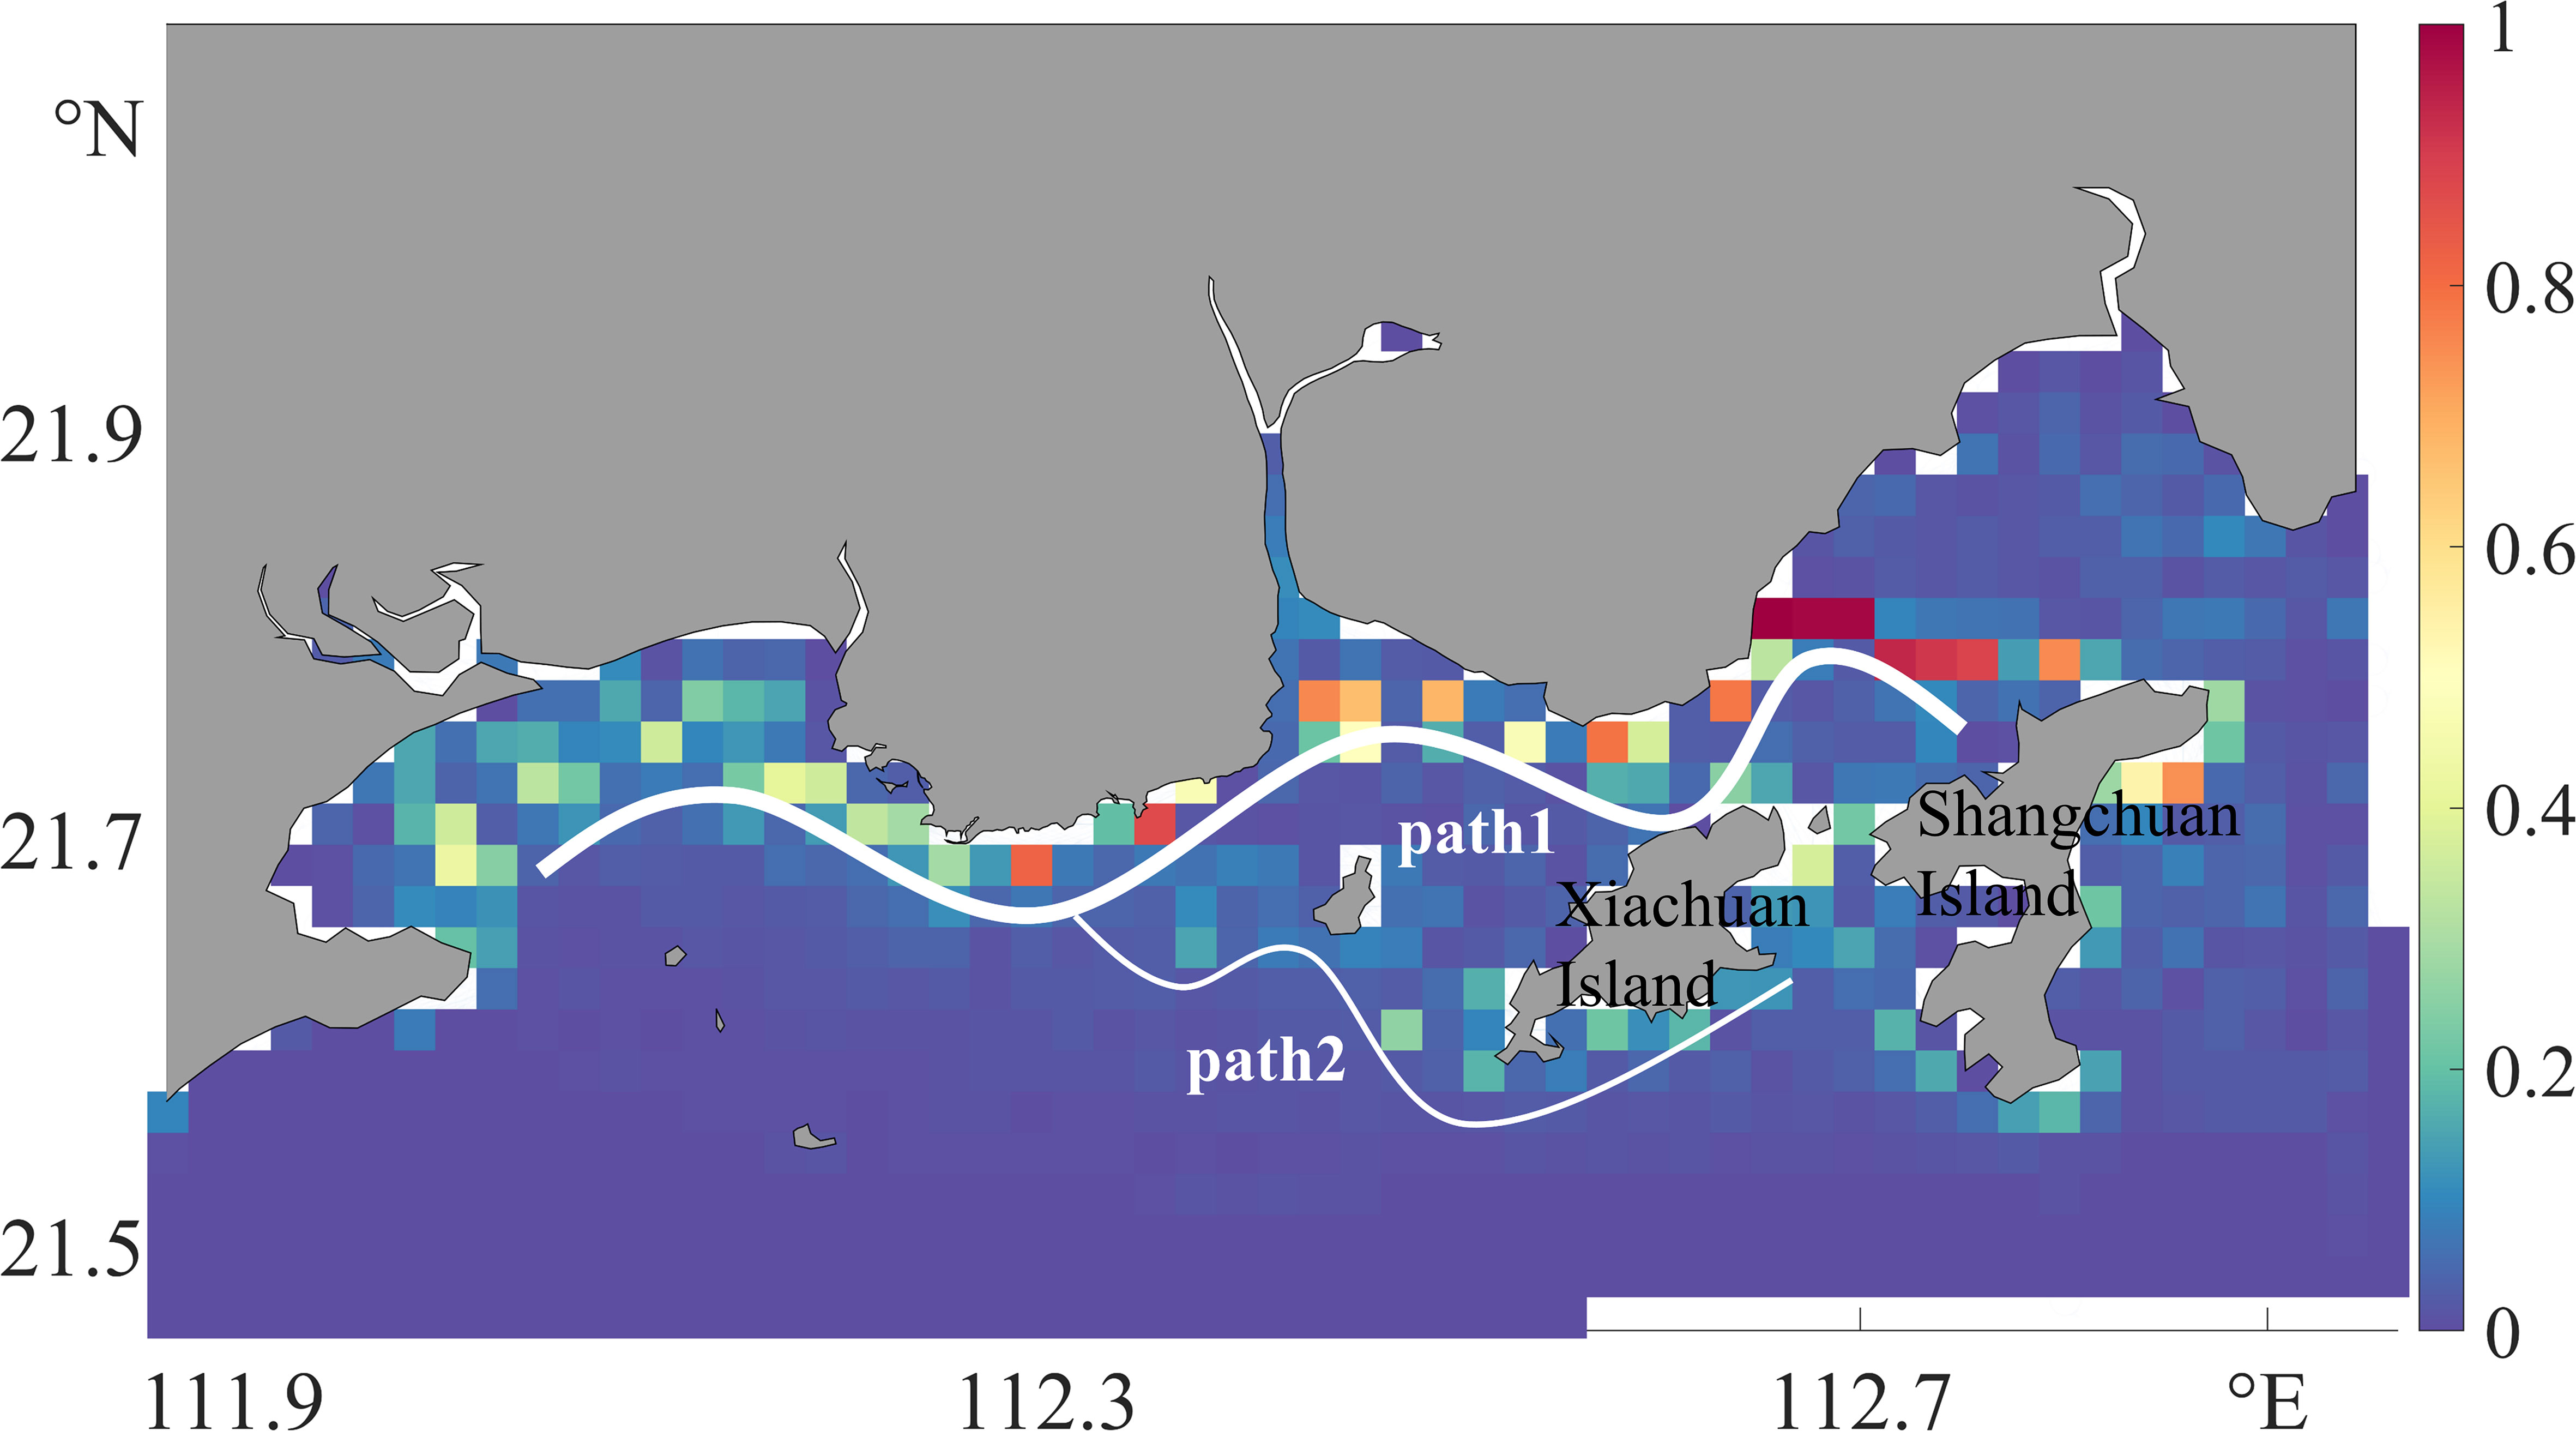
Figure 9 Distribution of the betweenness of the vertices.
3.6 Discussion
The distribution of Acetes is affected by biological, chemical, and physical factors, with their outbreak mechanism still being poorly understood. In this study, we focused on the dynamic factors. Figure 10 reveals the relationship between wind and the daily catch of Acetes from 2020 to 2021. The Acetes catch data were provided by the State Key Laboratory of Nuclear Power Safety Monitoring Technology and Equipment, and the wind data around the NPCS were extracted from the ERA5 reanalysis data. An Acetes outbreak is most likely to happen in late winter or in early spring, so we aimed to analyze and determine what happens during these periods. We hypothesized that the temperature and the material transport pattern are the intrinsic causes, and wind is an acceleration factor. Intriguingly, the outbreak of Acetes showed a strong relationship with the time when the winds are turning from northeast to southwest. Wind stress turning from offshore to onshore influenced the material transport pattern; that is, the two major pathways intersected in the cooling system, thus causing the aggregation of Acetes around it. Afterward, with the reversed wind direction, the old transport pattern was destructed and the seawater temperature also rose too high for Acetes to survive, explaining the reduction in the daily catch of Acetes.
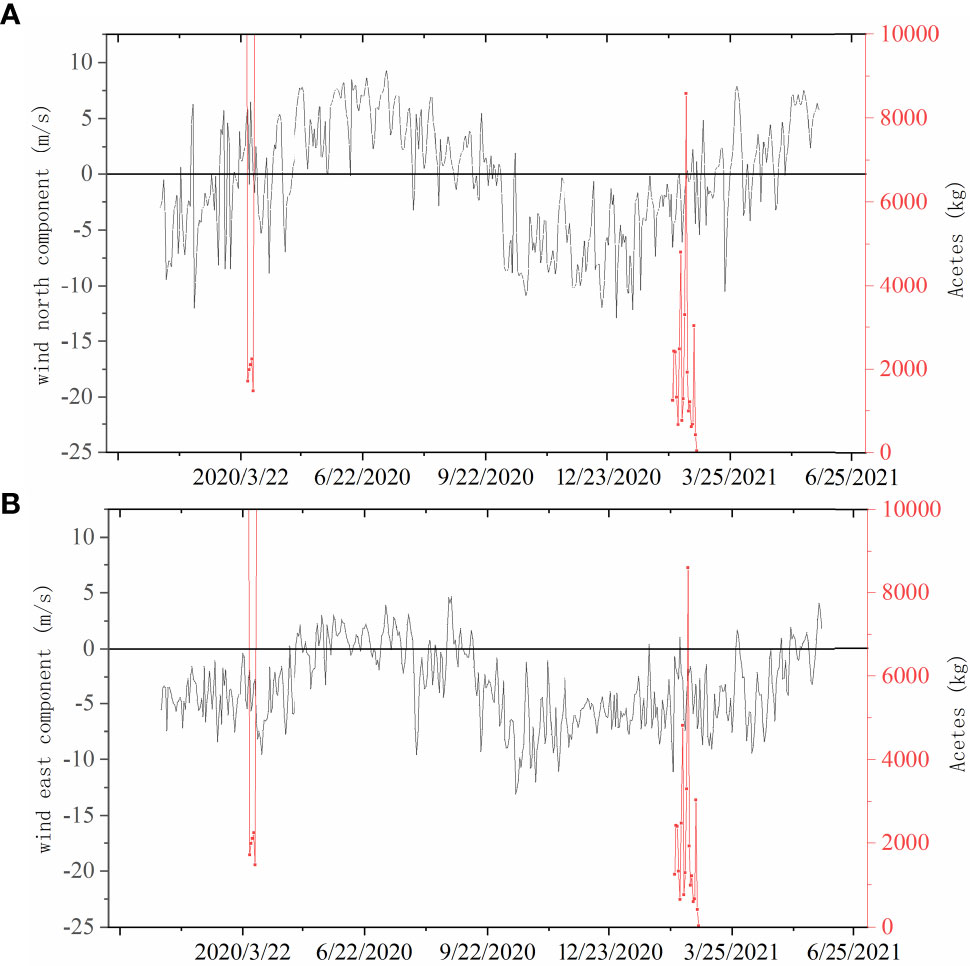
Figure 10 Association between wind and the Acetes catch. (A) The wind north component. (B) The wind east component.
Subsequently, we ran a parallel experiment that removed the surface wind on the ocean to clarify the model’s sensitivity to wind. The configurations of the hydrodynamic model and the network were the same, except for the removal of the surface wind stress. The two experiments were denoted as the “with-wind” case and the “no-wind” case.
On the one hand, Figure 11 depicts the betweenness pathways in the no-wind experiment, where the shape of the pathways was similar to that in the with-wind experiment, which is a two-pathway flow from the east to the west conjunct in the middle; however, the pathways in the no-wind experiment were shifted two or three grids to the south and thus staggered the NPCS. Most materials transported westward will not go through the NPCS, if the wind is weak. Therefore, the Acetes had a small probability of touching the NPCS or even break out without the assistance of the northwestward winds.
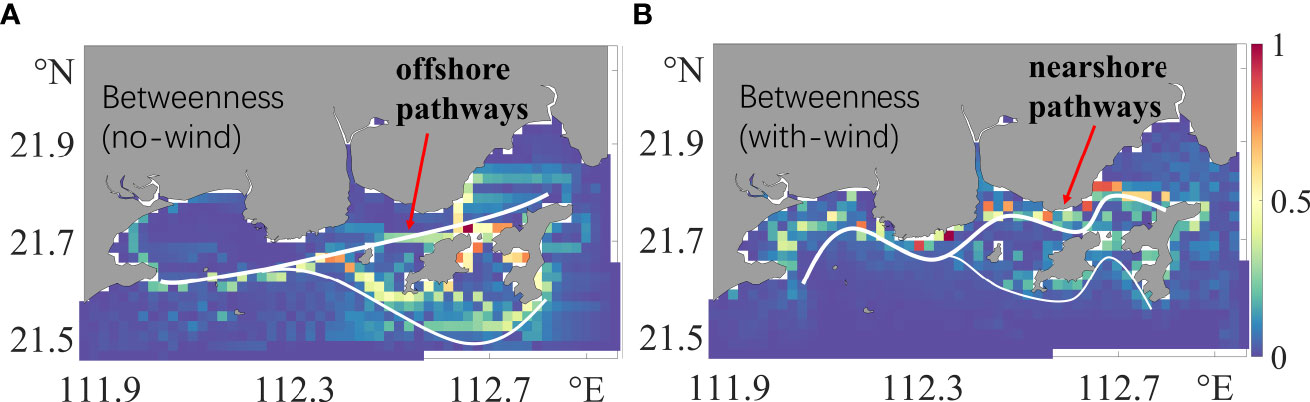
Figure 11 The betweenness pathways with wind in March (B) and without wind (A).
On the other hand, the in-degree and out-degree of the network, which depict the characteristic of the aggregation and diffusion processes of Acetes, also made significant changes under the influence of wind. When wind was added to the model, the in-degree, which represents the sink of a material, increased significantly (Figures 12A, B). However, the out-degree, which represents the source of the material, decreased by about 50% when wind was included (Figures 12C, D). To sum up, the extra northwestward wind increased the extent of the material sink and decreased the extent of the material source near the NPCS.
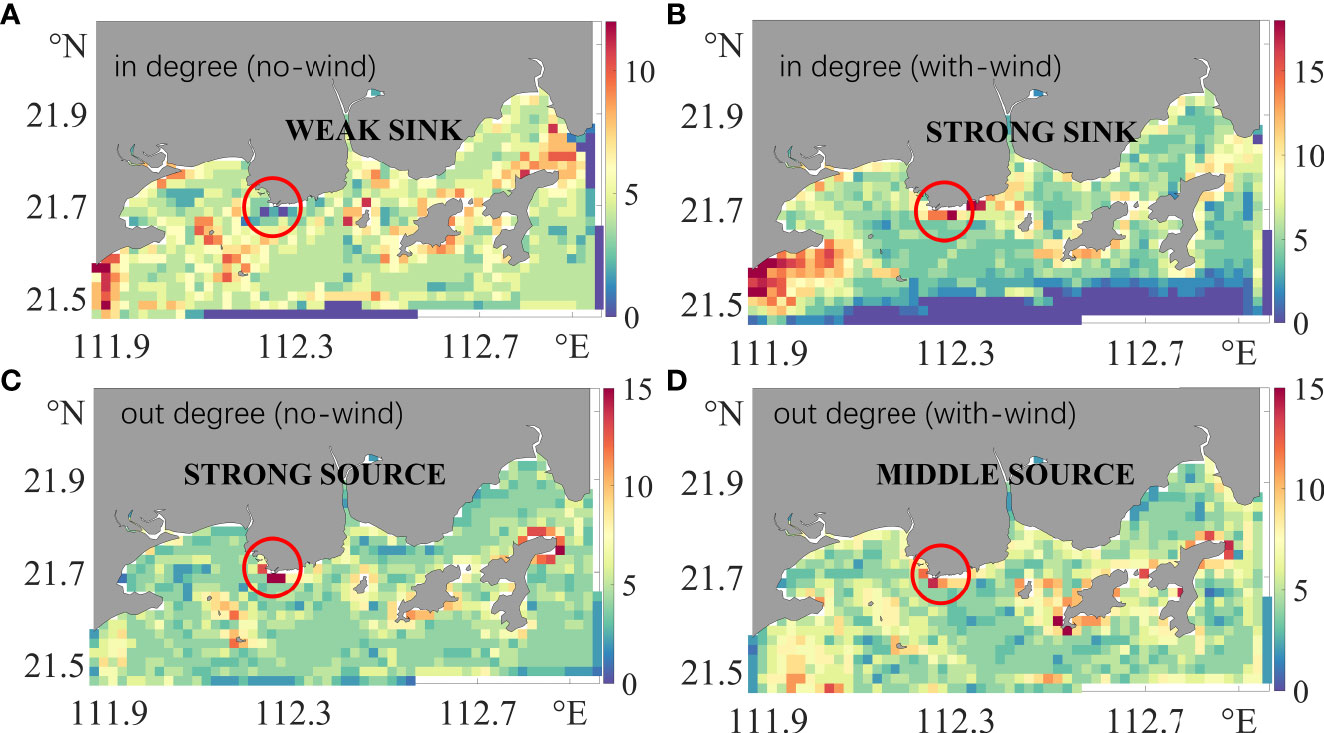
Figure 12 In-degree (A, B) and out-degree (C, D) under the no-wind and with-wind experiments.
4 Conclusion
This paper applied the LFN theory to study the transport and aggregation mechanism of Acetes near a nuclear power plant. The LFN is a feasible and novel method used to predict the spatial and temporal distribution of plankton, such as the pelagic larva and Acetes. Particularly, LFN can detect the material transport path and trace the origin of disaster-causing organisms, which cannot be achieved using circulation or particle tracking methods.
The degree of LFN illustrates the importance of the vertex in the network, which corresponds to the aggregation or the diffusion characteristic. In this study, the cooling water intake of the nuclear power plant comprised just the high in-degree and high out-degree nodes, representing a large material diffusion ability and accumulation probabilities. Hence, any small perturbation destroys the nearby mass balance, and thus a large amount of material might be immediately accumulated near the area.
From the perspective of betweenness, the cooling water intake of the nuclear power plant was located at the junction of the two pathways. The materials were transported from the east to the west and from the south to the north, forming a “-<“-shaped transport structure (see Figure 9) and passing through the sea area of the nuclear power plant. When the external environment changes, e.g., the wind direction suddenly changes from the offshore wind to the onshore wind, the materials transported from the pathway will accumulate near the coast under the effect of wind. This phenomenon has also been confirmed by observation.
Nevertheless, we suppose that the wind direction might be an important factor causing the outbreak of Acetes; that is, at a suitable temperature, the southeast wind will cause the aggregation of Acetes in the study area.
Data availability statement
The raw data supporting the conclusions of this article will be made available by the corresponding author, without undue reservation.
Author contributions
XZ proposed the idea of using the Lagrangian flow network on the Acetes near the nuclear power cooling water system and wrote the manuscript. QL ran the hydrodynamic model and wrote the context in this paper. XX established the LFN model and plotted the figures in this paper. FY recorded and provided precious long-term observation data on Acetes. ZL proposed some valuable suggestions in revising this article. YX provided some important information about the habits of Acetes and helped revise the introduction part. All authors contributed to the article and approved the submitted version.
Funding
This work was supported by the Fisheries Ecology and Resource Monitoring Project of Agricultural Ecological Protection and Resource Utilization in Jiangsu Province (2021-SJ-110-02) and the National Natural Science Foundation of China (no.41974085).
Acknowledgments
We would like to express our gratitude to all the reviewers and editors for their valuable comments.
Conflict of interest
The authors declare that the research was conducted in the absence of any commercial or financial relationships that could be construed as a potential conflict of interest.
Publisher’s note
All claims expressed in this article are solely those of the authors and do not necessarily represent those of their affiliated organizations, or those of the publisher, the editors and the reviewers. Any product that may be evaluated in this article, or claim that may be made by its manufacturer, is not guaranteed or endorsed by the publisher.
References
An L., Wang L., Ou D., Jia C., Li W., Ding Y., et al. (2021). The ecological mechanisms of acetes blooms as a threat to the security of cooling systems in coastal nuclear power plants. J. Coast. Conserv. 25, 55. doi: 10.1007/s11852-021-00845-0
Azila A., Chong V. C. (2010). Multispecies impingement in a tropical power plant, straits of malacca. Mar. Environ. Res. 70, 13–25. doi: 10.1016/j.marenvres.2010.02.004
Barath Kumar S., Mohanty A. K., Das N. P. I., Satpathy K. K., Sarkar S. K. (2017). Impingement of marine organisms in a tropical atomic power plant cooling water system. Mar. pollut. Bull. 124, 555–562. doi: 10.1016/j.marpolbul.2017.07.067
Barrat A., Lemy M. B., Vespignani A. (2008). DYNAMICAL PROCESSES ON COMPLEX NETWORKS Cambridge university press. 367.
Chen C., Liu H., Beardsley R. C. (2003). An unstructured grid, finite-volume, three-dimensional, primitive equations ocean model: Application to coastal ocean and estuaries. J. Atmospheric Ocean. Technol. 20, 159–186. doi: 10.1175/1520-0426(2003)020<0159:AUGFVT>2.0.CO;2
Chen X., Tang S., Ou D. (2013). Assessment report of yangjiang nuclear power plant project on fishery resources and ecology in adjacent waters.
Edgar G. J., Barrett N. S., Morton A. J. (2004). Biases associated with the use of underwater visual census techniques to quantify the density and size-structure of fish populations. J. Exp. Mar. Biol. Ecol. 308, 269–290. doi: 10.1016/j.jembe.2004.03.004
El Saadi N., Bah A. (2006). On phytoplankton aggregation: A view from an IBM approach. C. R. Biol. 329, 669–678. doi: 10.1016/j.crvi.2006.05.004
Falcini F., Corrado R., Torri M., Mangano M. C., Zarrad R., Di Cintio A., et al. (2020). Seascape connectivity of European anchovy in the central Mediterranean Sea revealed by weighted Lagrangian backtracking and bio-energetic modelling. Sci. Rep. 10, 18630. doi: 10.1038/s41598-020-75680-8
Fonseca T., Campos A., Afonso-Dias M., Fonseca P., Pereira J. (2008). Trawling for cephalopods off the Portuguese coast–fleet dynamics and landings composition. Fish. Res. 92, 180–188. doi: 10.1016/j.fishres.2008.01.015
He Y., Liu S., Yuan Y., Jiang K., Wang T., Qin Y., et al. (2021). The potential suitability habitat prediction of acaudina molpadioides based on maxent model. Haiyang Xuebao 43, 65–74.
Hufnagl M., Payne M., Lacroix G., Bolle L. J., Daewel U., Dickey-Collas M., et al. (2017). Variation that can be expected when using particle tracking models in connectivity studies. J. Sea Res. 127, 133–149. doi: 10.1016/j.seares.2017.04.009
Iacobello G., Scarsoglio S., Kuerten J. G. M., Ridolfi L. (2019). Lagrangian Network analysis of turbulent mixing. J. Fluid Mech. 865, 546–562. doi: 10.1017/jfm.2019.79
Li G., Li D., Xiong Y., Zhong X., Tang J., Song D., et al. (2022). Changes in the resource distribution of acetes chinensis and patterns of species replacement in haizhou bay in summer based on BeiDou VMS data. Reg. Stud. Mar. Sci. 56, 102655. doi: 10.1016/j.rsma.2022.102655
Padman L. (2005) Tide model driver (TMD) manual. Available at: https://svn.oss.deltares.nl/repos/openearthtools/trunk/matlab/applications/DelftDashBoard/utils/tmd/Documentation/README_TMD_vs1.2.pdf.
Reijnders D., van Leeuwen E. J., van Sebille E. (2021). Ocean surface connectivity in the Arctic: Capabilities and caveats of community detection in Lagrangian flow networks. J. Geophys. Res. Oceans 126. doi: 10.1029/2020JC016416
Schneider M., Froggatt A., Hosokawa K., Thomas S., Yamaguchi Y., Hazemann J. (2016). The world nuclear industry status report. Mycle Schneider Consult. MSC 12, 124–128.
Ser-Giacomi E., Baudena A., Rossi V., Follows M., Clayton S., Vasile R., et al. (2021). Lagrangian Betweenness as a measure of bottlenecks in dynamical systems with oceanographic examples. Nat. Commun. 12, 1–14. doi: 10.1038/s41467-021-25155-9
Ser-Giacomi E., Rossi V., López C., Hernández-García E. (2015a). Flow networks: A characterization of geophysical fluid transport. Chaos Interdiscip. J. Nonlinear Sci. 25, 036404. doi: 10.1063/1.4908231
Ser-Giacomi E., Vasile R., Hernández-García E., López C. (2015b). Most probable paths in temporal weighted networks: An application to ocean transport. Phys. Rev. E Stat. Nonlin. Soft Matter Phys. 92, 12818. doi: 10.1103/PhysRevE.92.012818
Tessier A., Pastor J., Francour P., Saragoni G., Crec’hriou R., Lenfant P. (2013). Video transects as a complement to underwater visual census to study reserve effect on fish assemblages. Aquat. Biol. 18, 229–241. doi: 10.3354/ab00506
Wang J., Ma C., Zou Q. (2021). Status and suggestions of cold source safety guarantee for nuclear power plants in south China. Nucl. Saf. 20, 65–71. doi: 10.16432/j.cnki.1672-5360.2021.03.012
Zeng L., Chen G., Wang T., Yang B., Yu J., Liao X., et al. (2019). Acoustic detection and analysis of acetes chinensis in the adjacent waters of the daya bay nuclear power plant. J. Fish. Sci. China 26, 1029–1039.
Keywords: complex flow network, Lagrangian particle tracking, Acetes chinensis, nuclear power plant cooling system
Citation: Lou Q, Zhang X, Xiang X, Yu F, Xiong Y and Li Z (2023) Analysis on the dynamic mechanism of Acetes aggregation near a nuclear power cooling water system based on the Lagrangian flow network. Front. Mar. Sci. 10:1100802. doi: 10.3389/fmars.2023.1100802
Received: 17 November 2022; Accepted: 04 January 2023;
Published: 03 February 2023.
Edited by:
Huang Honghui, South China Sea Fisheries Research Institute (CAFS), ChinaReviewed by:
Yun Li, National Marine Environmental Forecasting Center, ChinaQiang Li, Tsinghua University, China
Copyright © 2023 Lou, Zhang, Xiang, Yu, Xiong and Li. This is an open-access article distributed under the terms of the Creative Commons Attribution License (CC BY). The use, distribution or reproduction in other forums is permitted, provided the original author(s) and the copyright owner(s) are credited and that the original publication in this journal is cited, in accordance with accepted academic practice. No use, distribution or reproduction is permitted which does not comply with these terms.
*Correspondence: Xueqing Zhang, enhxQG91Yy5lZHUuY24=