 Shi-Mei Liang1
 Xing Zhai1
 Cheng-Xuan Li1,2*
 Ming Xin1,2Ping Sun1Xuan-Li Liu1
 Lin Liu1,3
 Bao-Dong Wang1,2*
- 1Key Laboratory of Marine Eco-Environmental Science and Technology, The First of Institute of Oceanography, Ministry of Natural Resources, Qingdao, China
- 2Laboratory for Marine Ecology and Environmental Science, Qingdao National Laboratory for Marine Science and Technology, Qingdao, China
- 3Laboratory for Regional Oceanography and Numerical Modeling, Qingdao National Laboratory for Marine Science and Technology, Qingdao, China
New field observation on distribution, turnover, and sea–air flux of three dimethylated sulfur compounds (dimethylsulfide (DMS), dimethylsulfoniopropionate, and dimethylsulfoxide) in the western tropical Indian Ocean (WTIO; 4°N–10°S, 61°–65°E) were conducted under the major Global Change and Air–Sea Interaction Program during the 2021/2022 Northeast Monsoon (December 21, 2021 to January 11, 2022). Significantly high surface concentrations of DMS were identified in the region of the Seychelles–Chagos Thermocline Ridge (SCTR; 5°–10°S). This occurred because the shallow thermocline/nitracline and associated upwelling fueled biological production of DMS in the subsurface, which was brought to the surface through vertical mixing. The calculated sea–air DMS flux was also significantly strong in the SCTR region during the Northeast Monsoon owing to combination of high wind speed and high surface concentration of DMS. This finding is similar to results obtained previously during the Southwest Monsoon, suggesting that the SCTR region is an area of active DMS emission during both the Northeast Monsoon and the Southwest Monsoon. Microbial consumption was the dominant pathway of DMS removal, accounting for 74.4% of the total, whereas the processes of photolysis (17.7%) and ventilation (7.9%) were less important. Future work should be undertaken in the WTIO to establish how DMS emission is linked to aerosol properties and climate change.
1 Introduction
Dimethylsulfide (DMS) is believed to an anti-greenhouse gas in the atmosphere, and able to regulate climatic conditions by directly and indirectly influencing Earth’s radiative budget (Charlson et al., 1987). DMS is quickly oxidized to non-seasalt sulphate and methanesulphonic acid after emission to marine troposphere. These aerosols can directly reflect the solar radiation reaching the Earth’s surface and also indirectly decrease the amount of incoming solar radiation through serving as cloud condensation nuclei to form massive clouds. The DMS concentration at lower levels in the atmosphere is far from equilibrium with surface seawater (Dacey et al., 1984). It is considered that the contribution of the emission of DMS from the ocean to the atmosphere averages 27.1 Tg a−1 globally (Hulswar et al., 2022).
Dimethylsulfoniopropionate (DMSP), as a DMS precursor, is primarily produced by a variety of phytoplankton in the euphotic layer (Simó et al., 1998; Kiene et al., 2000; Bullock et al., 2017). Most DMSP released into seawater is utilized by bacteria through demethylation or demethiolation pathways leading to production of methanethiol, which represents a source of energy, carbon, and reduced sulfur, while the proportion utilized by the bacterial lyase pathway to produce DMS is minor, i.e.,<20% (Kiene et al., 1999; Kiene et al., 2000; Boden and Hutt, 2019). In addition to microbial metabolism, certain algae such as Phaeocystis that have highly active DMSP lyases, can degrade DMSP to DMS, which is released into seawater (Keller et al., 1989; Steinke et al., 2007). DMS-loss processes involve microbial consumption, photochemical oxidation, ventilation to the atmosphere, and vertical export by mixing in the euphotic layer. DMS consumption by bacteria is generally the major loss process, accounting for 50%–80% of the total, whereas release to the atmosphere represents only a small proportion of total DMS removal (Kiene and Linn, 2000; Simó, 2004; Toole et al., 2006; Vila-Costa et al., 2008; Ma et al., 2022). The amount of DMS released to the atmosphere accounts for only 3% of the total DMSP in the ocean (Kiene and Service, 1991).
Depending on their content of intracellular DMSP, algal species can be divided into high-DMSP producers such as dinoflagellates and Phaeocystis, and low-DMSP producers such as diatoms and cyanophyta (Keller et al., 1989; Jean et al., 2005; Bullock et al., 2017). The species-specificity of DMSP is usually considered responsible for the imbalance between DMSP concentration and chlorophyll a (Chl a) concentration in the ocean (Galí and Simó, 2015). Intracellular DMSP supports osmoregulation (Van Bergeijk et al., 2003), antioxidation (Sunda et al., 2002), and cryoprotection (Karsten et al., 1996) and acts as a chemical signal molecule (Seymour et al., 2010). Thus, DMSP production in phytoplankton also depends on ambient environmental conditions (e.g., temperature, salinity, stratification, light, and nutrients) (Vila-Costa et al., 2008; Gwinn et al., 2019; Gao et al., 2021). Microalgae can also release intracellular DMSP into seawater via excretion, senescence, zooplankton grazing, and viral attack, forming the dissolved DMSP (DMSPd) pool (Dacey and Wakeham, 1986; Simó, 2004; Bullock et al., 2017).
Dimethylsulfoxide (DMSO) is an important ubiquitous reservoir of dimethylated sulfur compounds in the marine euphotic zone. The dissolved DMSO (DMSOd) pool has magnitude of the same order or larger than that of DMSPd, and it mainly originates from DMS oxidation via photo-oxidation and from phototrophic or heterotrophic organisms (Lee and Mora, 1999; Schafer et al., 2009). The majority of DMSOd is consumed by bacterial assimilation and dissimilation, while the role of the process of reduction to DMS is comparatively minor (Dixon et al., 2020). However, the intracellular functions of DMSO in algal cells remain unclear, although DMSO can be oxidized by the hydroxyl radical and might be part of an oxidative stress defense mechanism (Sunda et al., 2002; Schafer et al., 2009).
Extensive investigations on dimethylated sulfur compounds have been conducted in many different marine regions, except the Indian Ocean. Hatton et al. (1999) found that DMS, DMSP, and DMSO concentrations in the euphotic layer of the Arabian Sea increased following the Southwest Monsoon (SWM). Some studies conducted off the west coast of India found that DMS and DMSP showed significant seasonal variability, with maxima occurring during the final phase of the SWM and minima occurring during the Northeast Monsoon (NEM), closely associated with phytoplankton biomass, community, and succession (Shenoy and Patil, 2003; Bepari et al., 2019; Naik et al., 2020). Shenoy et al. (2002) believed that physical-driven processes (e.g., mixing depth and wind speed) are fundamental in the biogeochemical cycling of DMS in the central Indian Ocean. Shenoy and Kumar (2007) estimated that DMS emission from the Indian Ocean, contributing 4–6% of the global total, should be noticeable because of the unique situation of regional monsoons and complex currents. On the basis of climatological records from Lana et al. (2011) and their own data, Zavarsky et al. (2018) proposed that the western tropical Indian Ocean (WTIO) is an area of active DMS emission during the SWM, which could affect cloud condensation nuclei and the aerosol optical depth above the WTIO. We report here that a comparable area of active DMS emission was also observed during the NEM in the latitudinal band 5°–10°S in the WTIO. Additionally, DMS removal pathways, which were poorly understood previously, were estimated based on in situ incubation experiments.
2 Materials and methods
2.1 Geographical setting and sampling
During boreal winter (December through February), the NEM winds prevail in the WTIO driving cyclonic and downwelling-favorable circulations (Schott et al., 2009; Hood et al., 2017). The WTIO features the Seychelles–Chagos Thermocline Ridge (SCTR) that lies in the band of 5°–10°S, 55°–75°E (Figure 1; Vinayachandran et al., 2021). The SCTR is an important upwelling region that affects sea surface temperature, nutrients, and primary production (George et al., 2013; Vinayachandran et al., 2021). The South Equatorial Countercurrent and South Equatorial Current flow horizontally around the SCTR (Wiggert et al., 2006; Hood et al., 2017). The eastward-flowing South Equatorial Countercurrent is supplied by the southward-flowing Somali Current and the northward-flowing East African Coastal Current in a confluence zone from 2°–4°S, while the westward-flowing South Equatorial Current is largely supplied by the Indonesian Throughflow (Schott et al., 2009). Additionally, the WTIO is perennially subject to nutrient constraints, particularly nitrogen limitation during the NEM (Wiggert et al., 2006).
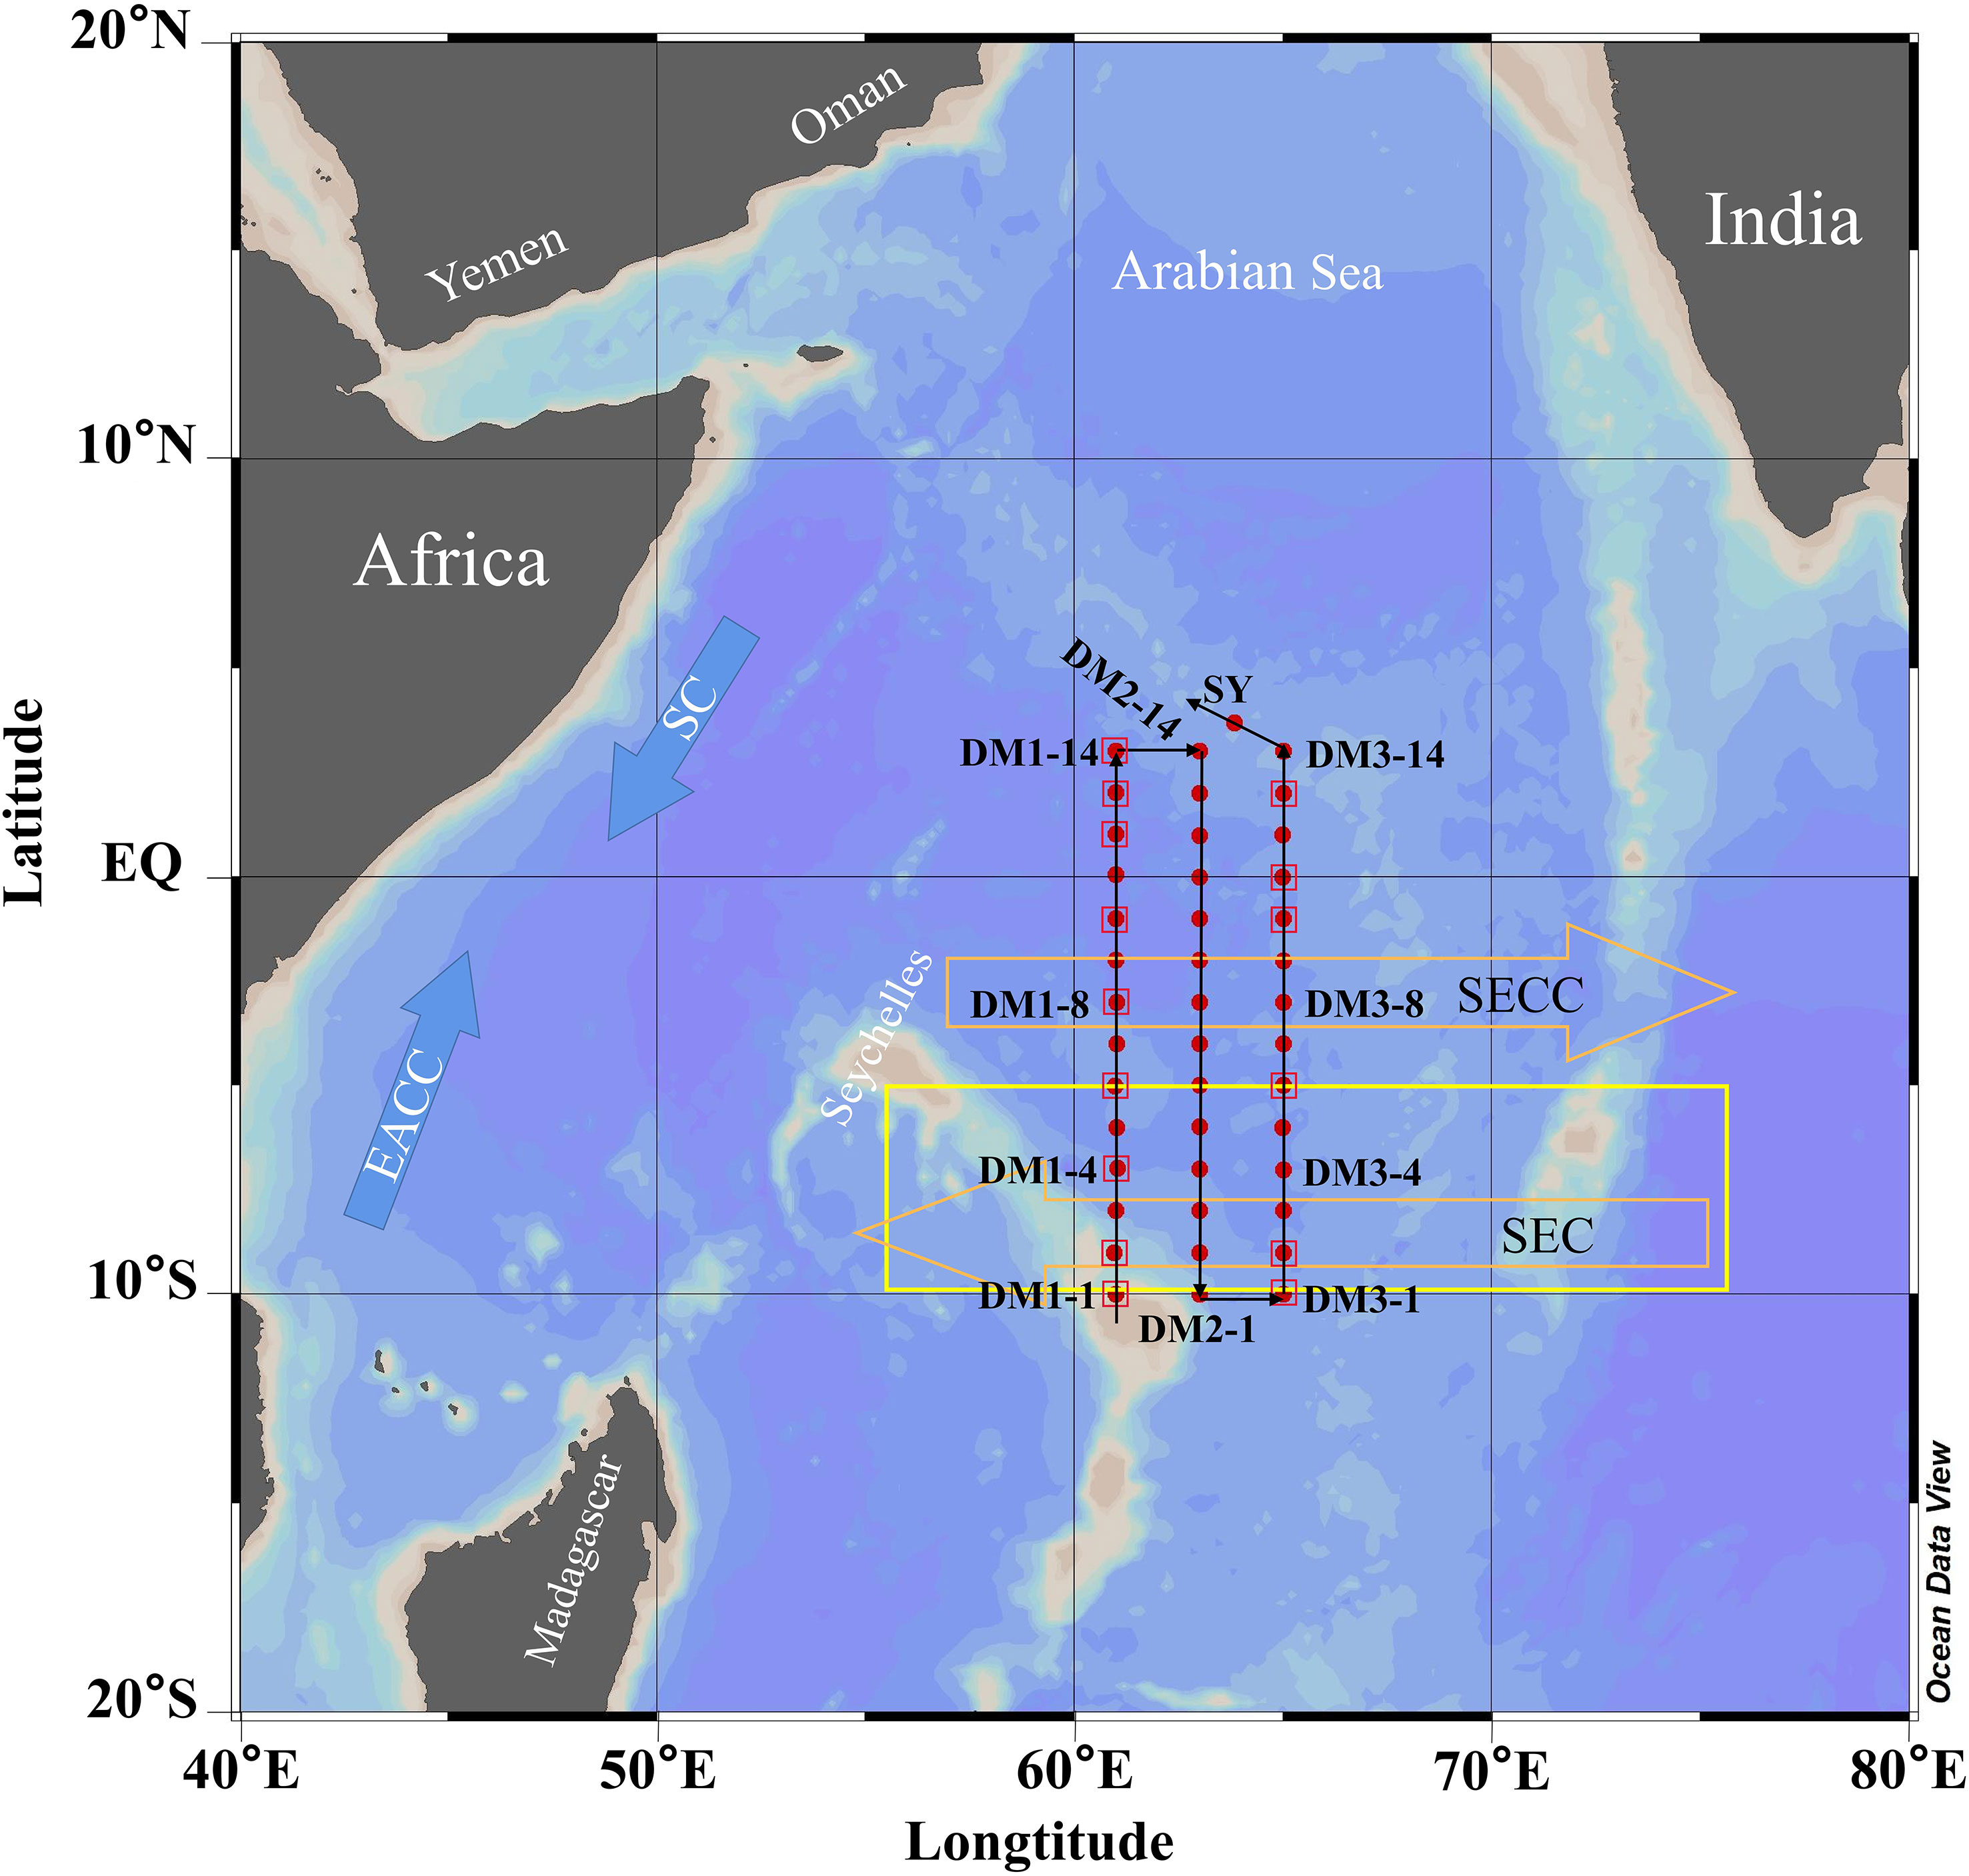
Figure 1 Locations of the sampling stations (red dots and squares) in the WTIO during the 2021/2022 NEM. The orange hollow arrows represent the South Equatorial Countercurrent (SECC) and South Equatorial Current (SEC), and the blue arrows represent the Somali Current (SC) and East African Coastal Current (EACC). The yellow box represents the Seychelles–Chagos Thermocline Ridge (SCTR). The black lines with the arrow represent the sequence of sampling.
The data used in this study were collected under the major Global Change and Air–Sea Interaction Program. The survey of the study area (3°N–10°S, 61°–65°E; Figure 1) was conducted onboard the R/V Xiang Yang Hong NO.01 between December 21, 2021 and January 11, 2022. For dimethylated sulfur compounds, samples from the surface and the depth of subsurface chlorophyll maxima (SCM, 25–75 m) were collected at all stations (43 stations, red dots in Figure 1), and samples from the top 300 m (5, 30, 75, 100, 150, and 300 m) were collected at representative stations (red squares in Figure 1), for a total of 150 samples (for single compound). For nutrients, samples from the top 300 m (including SCM layer) with a total of 255 were collected at 37 stations (not collected at the DM2-2, DM2-4, DM2-6, DM2-8, DM2-10 and DM2-13). For Chl a, samples from the top 200 m (5, 30, 50, 75, 100, 150, and 200 m and SCM layer) were collected at 42 stations (not collected at the DM3-12), and totaled up to 327 samples. Hydrographic variables (including temperature, salinity, and depth) were recorded using a Sea-Bird Scientific CTD sensor. A General Oceanics rosette sampler attached to the CTD sensor and equipped with 10-L Niskin bottles was used for all water sampling.
Water samples for analysis of DMS, DMSP, and DMSO were decanted into 125 mL polyethylene bottles from the Niskin bottles, which were allowed to overflow to prevent bubble entrainment in filling the bottles. In situ DMSPd samples were collected onboard using the nonperturbing small-volume gravity drip filtration procedure (Kiene and Slezak, 2006) and kept in 15 mL centrifuge tubes amended with 120 µL of 50% HCl. For total DMSP (DMSPt), 10 mL of the unfiltered water samples were transferred directly via pipette into 15 mL centrifuge tubes amended with 300 µL of 50% HCl. The difference between DMSPt and DMSPd concentrations was calculated to estimate the particulate DMSP (DMSPp) concentration. Other than for the addition of HCl, dissolved DMSO (DMSOd) was sampled using a procedure similar to that adopted for DMSPd, and then stored at −20°C.
2.2 Analysis of dimethylated sulfur compounds
Seawater concentration of DMS was measured onboard within 2 h of collection, and determined through procedures using purging, cryotrapping, and gas chromatography with a flame photometric detector (Kiene and Service, 1991). A subsample (>2 mL) was withdrawn from each sampling bottle via a Teflon® tube attached to a glass-barreled syringe and filtered by a 25 mm glass fiber filter (Whatman: 0.7 µm). The volume in the syringe was carefully adjusted to 2 or 5 mL and then the sample was introduced via a gray septum into the gas-stripping system. DMSPd and DMSPt in the 2 mL subsamples were converted into DMS using 600 µL of 5 M NaOH (sodium hydroxide) after sparging for endogenous DMS with dry nitrogen. A 2 mL subsample pipetted from the DMSOd samples after sparging was added to 600 µL of 15–20% w/w TiCl3 (titanium trichloride) and then heated at 50°C for 1 h in a water bath, thereby converting to DMS (Kiene and Gerard, 1994).
2.3 Incubation experiments
2.3.1 Estimation of microbial DMS consumption rates
According to Kiene and Bates (1990) and Wolfe and Kiene (1993), chloroform (CHCl3) can effectively inhibit metabolism of C-1 compound and thus it was used to restrain DMS consumption by bacteria in this study. For determination of microbial DMS consumption rates, water from 5-m depth was collected directly into four 250 mL glass bottles and incubated in the dark at in situ surface temperature ±1°C for 10 h. Two unamended bottles were considered as a control group, along with the other two that were amended with ~500 µmol L−1 of CHCl3. DMS concentrations in the bottles were measured every 2 h and the final headspace volume of all bottles was less than one third of the total. Microbial DMS consumption rates were estimated from the difference in DMS accumulation between those bottles with CHCl3 and those without treatment.
2.3.2 Estimation of DMS photochemical consumption rates
The photodegradation rate of DMS under natural light was calculated by measuring the difference in DMS change between that under natural light and that in dark conditions. Surface seawater was filtered using a 0.2 µm membrane to remove biological effect, and the filtrate was transferred to four clean 120 mL quartz flasks and sealed without headspace. Two of flasks were wrapped with multilayer aluminum foil and placed in a black plastic bag as the experimental group, while the control group was untreated. All samples were placed simultaneously in a transparent incubator with circulating surface seawater, which completed continuous cultivation on deck for 10 h. DMS and DMSOd concentrations in the quartz flasks were determined every 2 h.
2.3.3 Estimation of microbial DMSPd consumption rates
Because glycine betaine (GBT) is similar to DMSP in structure, GBT can be a competitive inhibitor to prevent DMSPd consumption from bacteria by substituting to DMSP (Kiene and Gerard, 1995). Two 500 mL brown Teflon® bottles were filled with surface water and added with final concentration ~5 µmol L−1 of GBT, while the other two were untreated. Duplicate subsample collections of DMSPd in these bottles were conducted every 2 h using the small-volume gravity drip filtration method. Less than two-fifths of the headspace volume was set aside in each bottle. DMSPd total production and DMSPd net production were represented by the slope of the linear regression of the DMSPd time series in the GBT-treated group and untreated group, respectively. Microbial DMSPd degradation rates were calculated as the difference between the two slopes.
2.4 Analysis of DMS ventilation
Instantaneous DMS sea–air flux calculation obeys the Henry law, and is the product of the DMS surface concentration and the transfer velocity (kL). The calculation from Nightingale et al. (2000) was chosen, because of its best fit. kL has a relationship with wind speed (U) and the temperature-dependent Schmidt number (Sc) given by Saltzman et al. (1993).
Where T = sea surface temperature (5 m). U (1 min) were obtained from the meteorological observing equipment onboard.
2.5 Ancillary measurements
Chl a collections were determined by filtering seawater through glass fiber filters (Whatman: 0.7 µm). The pigments collected on the filter were extracted with 90% acetone and quantified with a Trilogy fluorimeter. Nutrient analysis was conducted using a QuAAtro continuous flow analyzer for ammonium (), nitrate + nitrite (), silicate (), and phosphate (). The mixed layer depth (MLD) was defined as increase in density of 0.125 kg m−3 with respect to that at surface. A few density data from the CTD were loss at the stations, where MLD was determined by a temperature drop of 0.5 °C (Shenoy et al., 2002).
In this study, surface and vertical profiles were produced using Ocean Data View 4 with the DIVA gridded field data display style selected. Sigma Plot 12.5 was used to complete line/scatter charts and histograms. The Spearman correlation method (IBM SPSS Statistics 26) was used to describe the correlations between DMS, DMSP (DMSPd + DMSPp), DMSOd, and environmental variables.
3 Results
3.1 Surface distributions of dimethylated sulfur compounds and relevant environmental variables
The physical and biochemical characteristics of the water column during the sampling period were typical of boreal winter conditions in the WTIO. Sea surface temperature was high (>29.0°C) in the south but low (<29.0°C) in the north, whereas surface salinity was low (<35.4) in the south but high (>35.4) in the north (Figures 2A, B). The low-salinity region (<35.1) to the south of 5°S was attributable to the inflow of the westward-flowing South Equatorial Current and precipitation (Figure 2B; Schott et al., 2009; Hood et al., 2017). Surface Chl a concentration was low (<0.15 μg L−1) in the central area but high (>0.15 μg L−1) in the four corners (Figure 2C). Surface nitrate concentration was very low (<0.5 µmol L−1) in the studied area except at a very few stations (Figure 2D). Surface DMS concentration in the WTIO ranged from 0.5–9.5 nM (average: 4.1 ± 2.8 nM) during the NEM. Higher DMS concentrations (5.0–9.5 nM) were observed in the SCTR region, but much lower values were observed in other areas (Figure 2E). DMSPd concentrations varied from 0.7–6.3 (average: 1.7 ± 1.1 nM) with patches of high values (>4.0 nM) in the regions of 5°S, 61°E and 1°N, 65°E (Figure 2F). Surface DMSPp concentration ranged from 2.8–22.7 nM with an average of 12.1 ± 4.5 nM, i.e., an order of magnitude higher than that of DMSPd. DMSPp maxima distributed at the northeast of the study area, corresponding to elevated DMS and DMSPd (Figure 2G). DMSOd concentrations ranged from 0.5–3.6 nM (average: 1.4 ± 0.7 nM) at the surface with relatively high values in the SCTR region (Figure 2H).
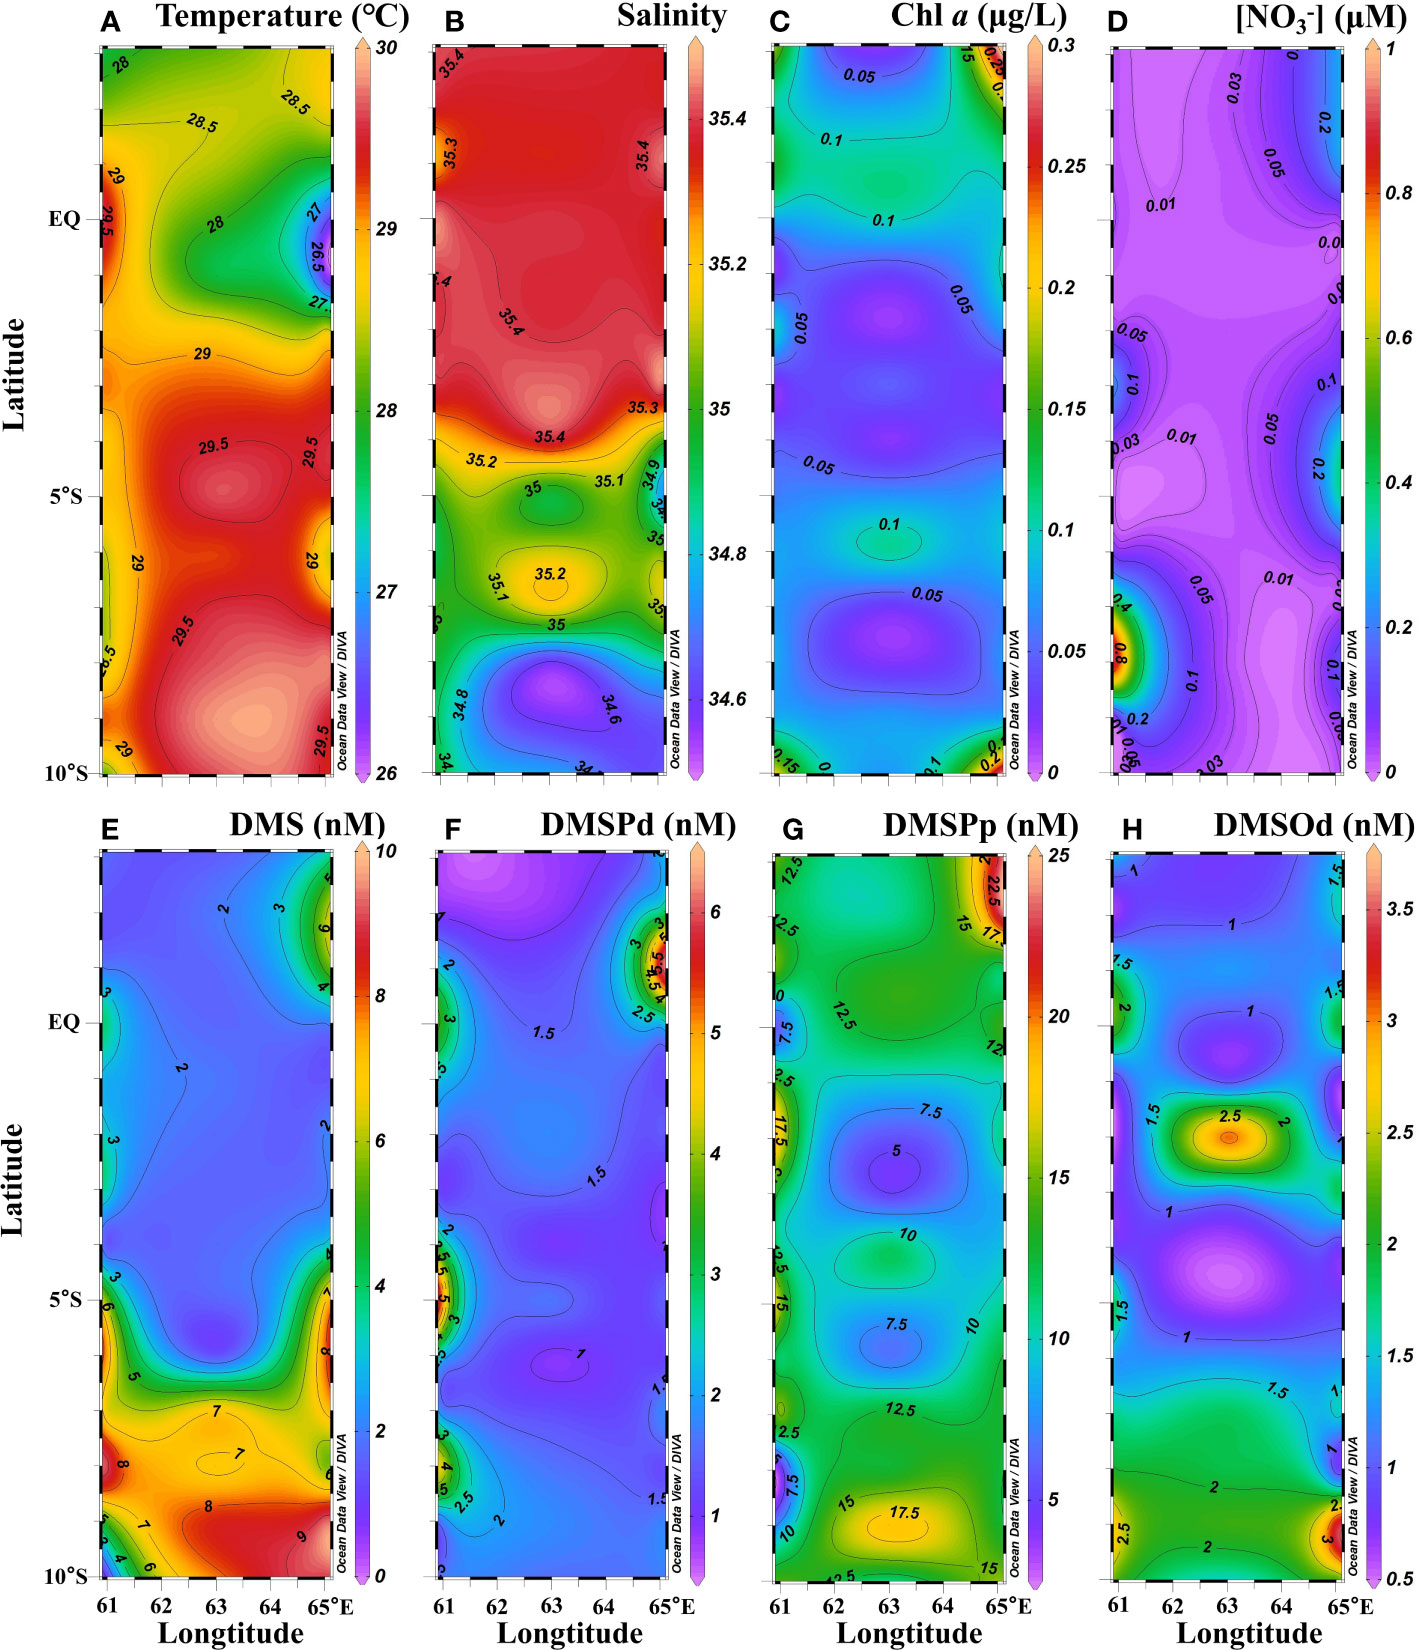
Figure 2 Surface distributions of temperature (A), salinity (B), Chl a (C), (D), DMS (E), DMSPd (F), DMSPp (G) and DMSOd (H) in the WTIO during the 2021/2022 NEM.
3.2 Vertical profiles of dimethylated sulfur compounds and relevant environmental variables
The vertical profiles of temperature, salinity, Chl a, , and dimethylated sulfur compounds along the 65°E transect during the NEM are shown in Figure 3. In the upper 300 m, temperature and salinity ranged from 10.5–32.3°C (average: 16.5 ± 5.3°C) and 34.6–35.6 (average: 35.1 ± 0.1), respectively. The thermocline was comparatively shallow in the SCTR region (5°–10°S) indicating local upwelling (Figure 3A; Schott et al., 2009; Vinayachandran et al., 2021). The low-salinity water mass extended to depth of ~50 m and became weak northward (Figure 3B). In contrast to the area of the SCTR, the region between 2°–4°S showed a weak dowelling current with a deepening thermocline (Figure 3A; Schott et al., 2009). The calculated MLD ranged from 6–58 m with the shallowest value in the SCTR region, corresponding to the shallower thermocline there. The SCM layer occurred at depths of 30–75 m with Chl a concentrations in the range of 0.15–0.99 μg L−1 (Figure 3C). The band of SCM extended vertically to surface at the northernmost and southernmost stations probably due to vertical mixing, leading to increases in surface Chl a (Figures 2C, 3C). Nitrate concentrations were close to or lower than the detectable limit in the upper mixed layer but increased sharply in the thermocline (Figure 3D). DMS concentrations were high in the top 50 m of water but decreased sharply to a value of<1.0 nM below 75 m (Figure 3E). Surface DMS concentrations were >5 nM at most stations except those in the deep thermocline region. Most DMSP occurred as particulates, accounting for 87% of DMSPt, and the DMSPp maxima were nearly 6 times higher than those of DMSPd. Generally, the concentrations of both DMSPd and DMSPp were relatively low in the surface water, reached their highest levels in the subsurface (30–75 m), and then decreased to a level of less than or around the detection limits at depths below 100 m (Figures 3F, G). Similar to DMS, both DMSPd and DMSPp showed higher concentrations in the SCTR than in the downwelling region. Different from DMS and DMSP, high concentrations of DMSOd were observed in the surface (subsurface) water in the south and north (middle) of the transect (Figure 3H). High values of DMSOd were also observed below the depth of 100 m at the southernmost end of the transect.
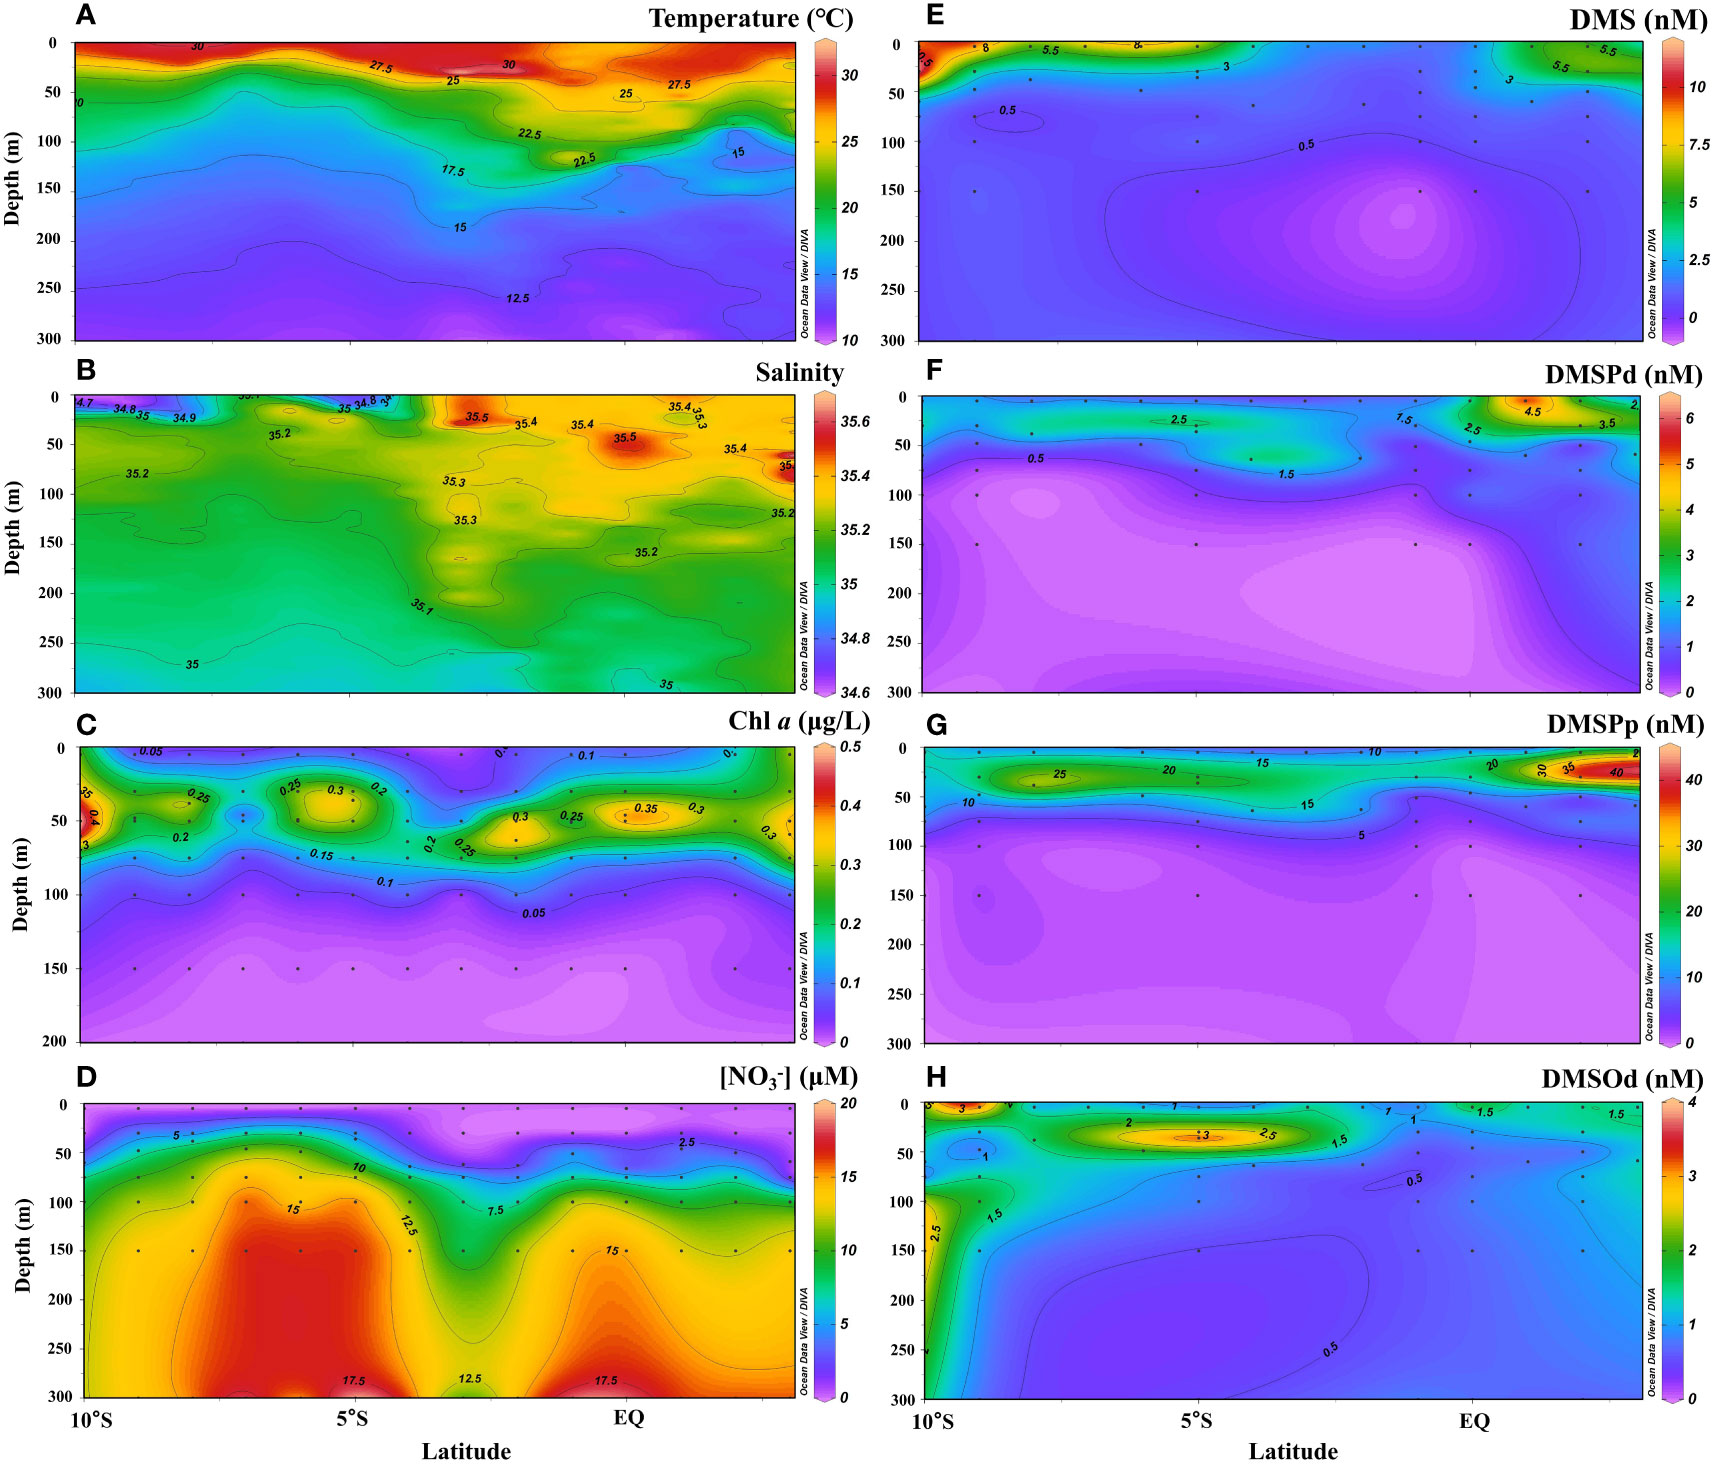
Figure 3 Vertical profiles of temperature (A), salinity (B), Chl a (C), (D), DMS (E), DMSPd (F), DMSPp (G) and DMSOd (H) along the 65°E transect in the WTIO during the 2021/2022 NEM.
3.3 DMS removal pathways
In this study, bacterial and photochemical degradation incubations of DMS were completed at three representative stations: DM3-4 (southernmost), DM3-8 (middle), and DM3-14 (northernmost), which represented the SCTR, the downwelling area (2°–4°S), and region north of the equator, respectively (Figure 1).
The microbial DMS consumption rate (8.7 nmol L−1 d−1) at DM3-14 was 4 times higher than that at the other two stations (3.4 and 1.1 nmol L−1 d−1 at DM3-4 and DM3-8, respectively; Figures 4A–C). The highest photolysis rate at DM3-4 (2.8 nmol L−1 d−1) was much higher than that at both DM3-8 (0.03 nmol L−1 d−1) and DM3-14 (1.5 nmol L−1 d−1) (Figures 4D–F). Measured DMSOd concentrations with time during incubation were not significantly different between the natural light (experimental set) and dark (control set) conditions at DM3-8 and DM3-14, whereas a higher DMSOd production rate (1.9 nmol L−1 d−1) was observed at DM3-4 (Figures 4D–F). The highest ventilation rate at DM3-4 (1.0 nmol L−1 d−1) was twice that at DM3-14 (0.5 nmol L−1 d−1) and 5 times higher than that at DM3-8 (0.2 nmol L−1 d−1).
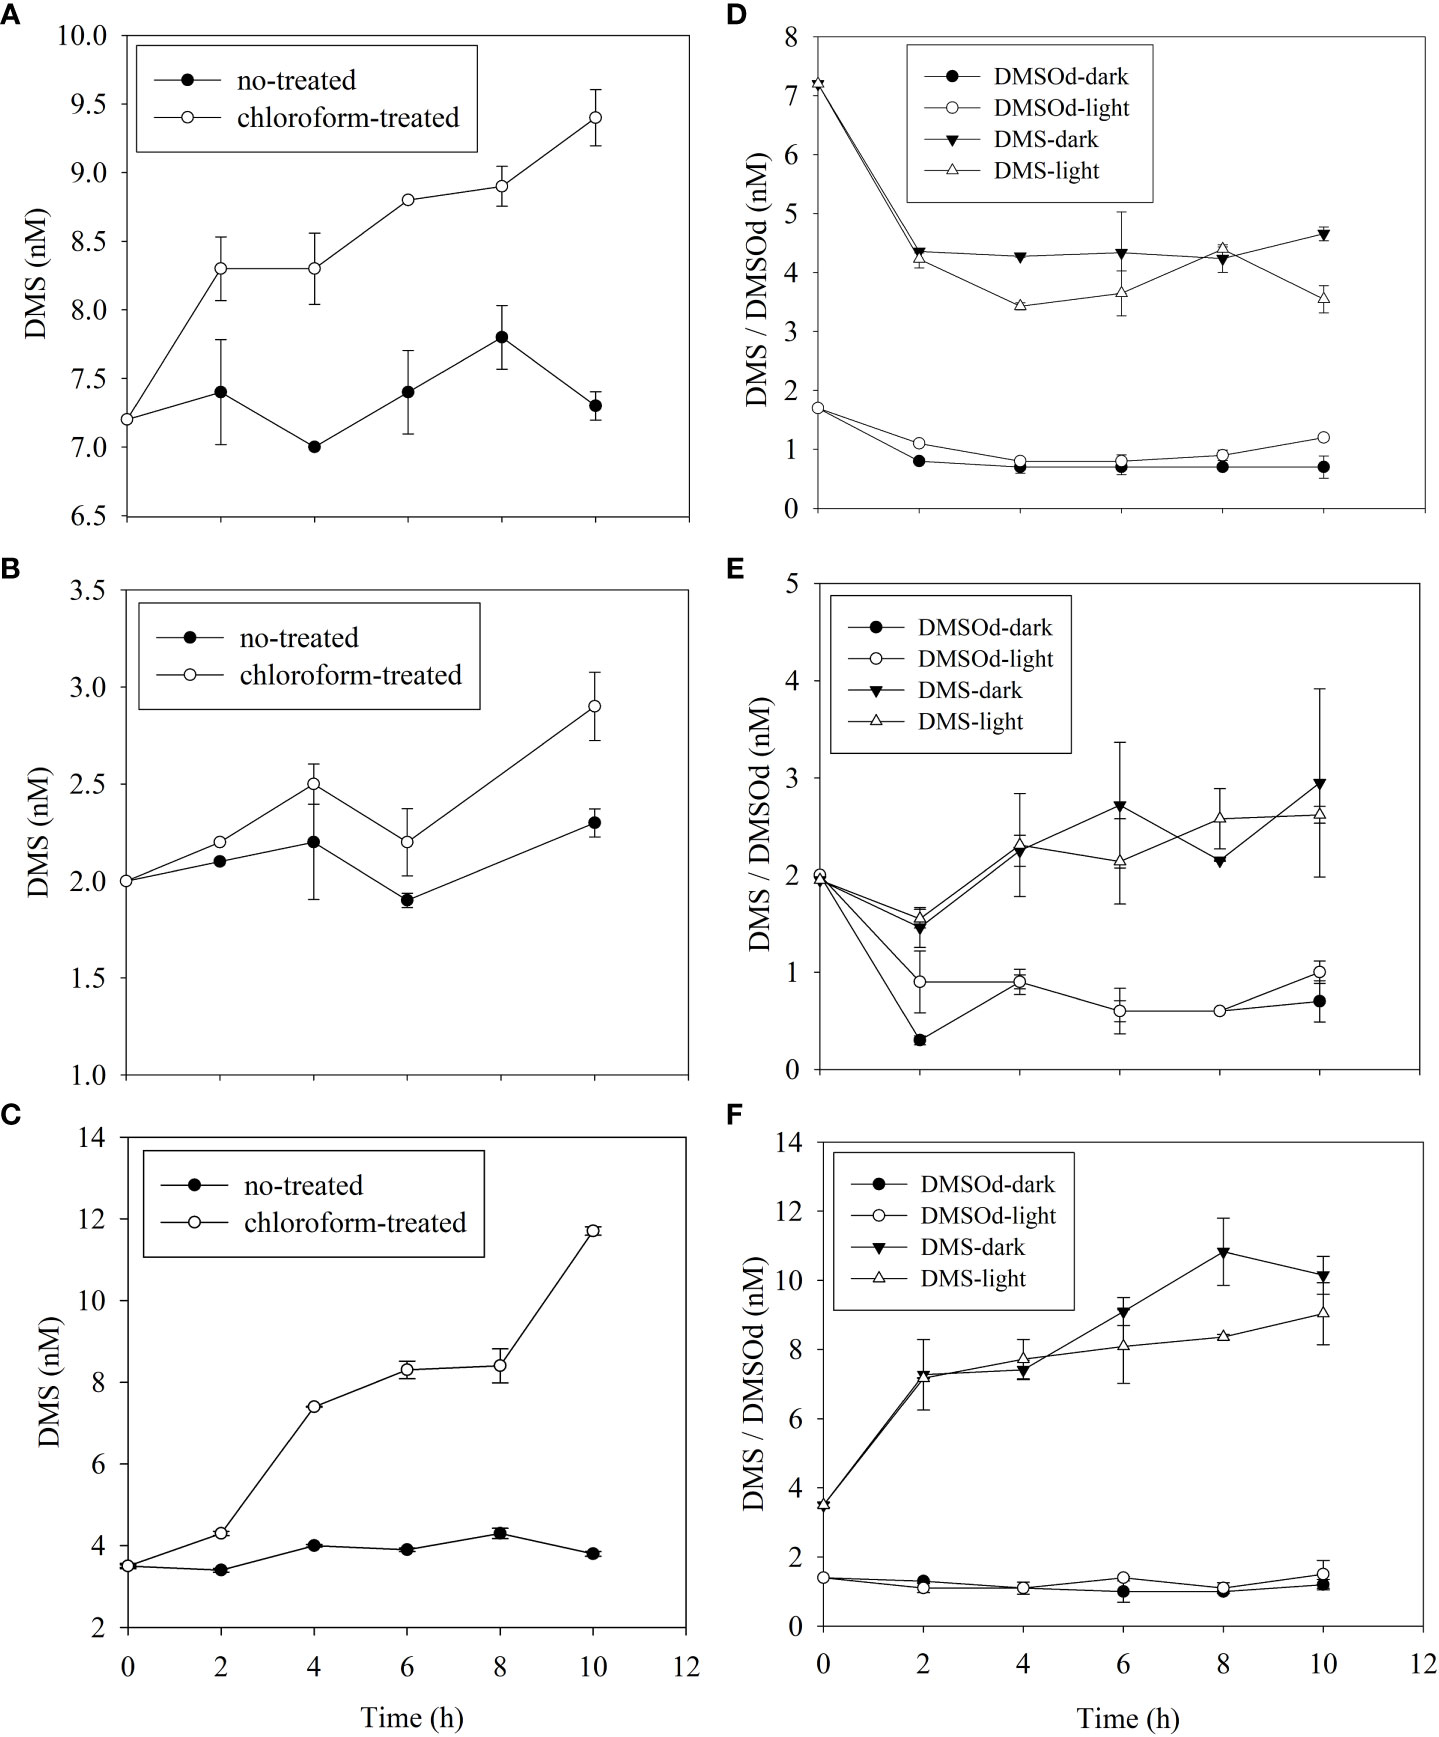
Figure 4 Time series of DMS (and DMSOd) concentrations for DMS microbial consumption (left panel, A–C) and photooxidation (right panel, D–F) incubations during the 2021/2022 NEM at DM3-4 (A, D), DM3-8 (B, E) and DM3-14 (C, F) stations.
The DMS consumption rate constants of the three removal pathways, independent of DMS concentration, are listed in Table 1. The microbial DMS consumption rate constant at DM3-14 was 5 times higher than that at both DM3-4 and DM3-8. The DMS photolysis rate constants were approximately the same at DM3-4 and DM3-14, while DM3-8 had a minor rate constant. A characteristic feature of DMS removal at DM3-4 was that microbial DMS consumption (47.1%) was comparable with photo-oxidation, accounting for 38.7% of the total. The rate constants of ventilation were the same at the three stations with a mean value of 0.1 d−1. Overall, microbial consumption was the dominant pathway of DMS removal, accounting for 74.4% of the total, while photooxidation and ventilation merely contributed 17.7% and 7.9%, respectively.
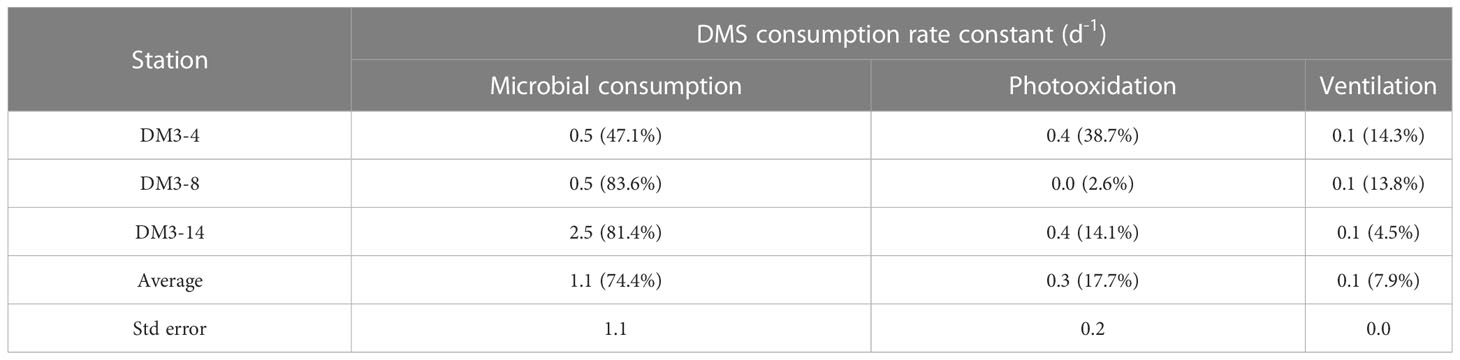
Table 1 DMS consumption rate constant (d−1) and respective percentages (in parentheses) of the three main pathways in surface seawater at three stations in the WTIO during the 2021/2022 NEM.
3.4 Microbial DMSPd consumption
The microbial DMSPd consumption rates determined through measurement of the control and GBT-added groups, for the three representative stations with the same locations as those considered in the incubation of DMS removal, are listed in Table 2. The average DMSPd consumption rate was 3.1 ± 1.1 nmol L−1 d−1 during the NEM. The maximum consumption rate occurred at DM3-4, which was almost twice that at both DM3-8 and DM3-14. Correspondingly, DM3-4 exhibited a moderate initial DMSPd concentration and the highest temperature. The lowest microbial DMSPd degradation rate was found at DM3-8 due to the lowest DMSPd concentration. However, the DMS gross production rates were larger than the rates of DMSPd consumption, especially at DM3-14. This implies that surface DMS might reflect the involvement of sources via other pathways, more than that associated with DMSPd turnover.
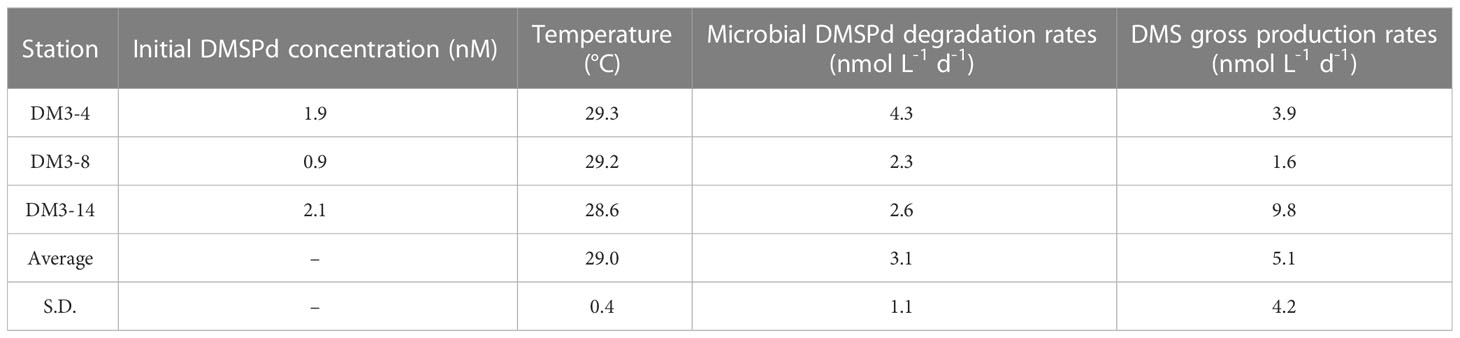
Table 2 DMSPd biological degradation rates (nmol L−1 d−1) and DMS gross production rates (nmol L−1 d−1) in surface seawater in the WTIO during the 2021/2022 NEM.
3.5 DMS sea–air flux
The calculated DMS flux varied from 0.5–34.9 μmol m−2 d−1 (average: 6.4 ± 8.0 μmol m−2 d−1) during sampling. Lower sea-to-air flux of DMS was observed in the north of 5°S, along with lower DMS surface concentration, although the wind speed was comparable to that in the SCTR region with the high average DMS flux (Figure 5). The significantly positive correlation between DMS seawater concentration and sea-air flux (R = 0.557, n = 43, p< 0.01) was found in this study, demonstrating that DMS concentration was an important cause of DMS sea-to-air emission. Despite high DMS concentrations appearing in the SCTR region, DMS fluxes were lower than 8 μmol m−2 d−1 at the stations of DM3-1–DM3-4, where wind speeds were weaker than those at other stations (DM1-3–DM1-5 and DM2-2–DM2-3). Thus, the impact of wind speeds on DMS ventilation from ocean to atmosphere could not be negligible. In the whole study region, DMS sea-air fluxes were positively correlated with wind speeds (R = 0.651, n = 43, p< 0.01), suggesting that wind speed may serve as a primary factor controlling the differences in DMS sea-air exchange. The high values (>29 μmol m−2 d−1) occurring in the SCTR region were due to the coupled high wind speeds (>7 m s-1) and DMS concentrations (>6 nM) (Figure 5). Therefore, the variations of DMS flux in the WTIO were attributed to the combined influence of wind speed and DMS concentration during winter monsoon.
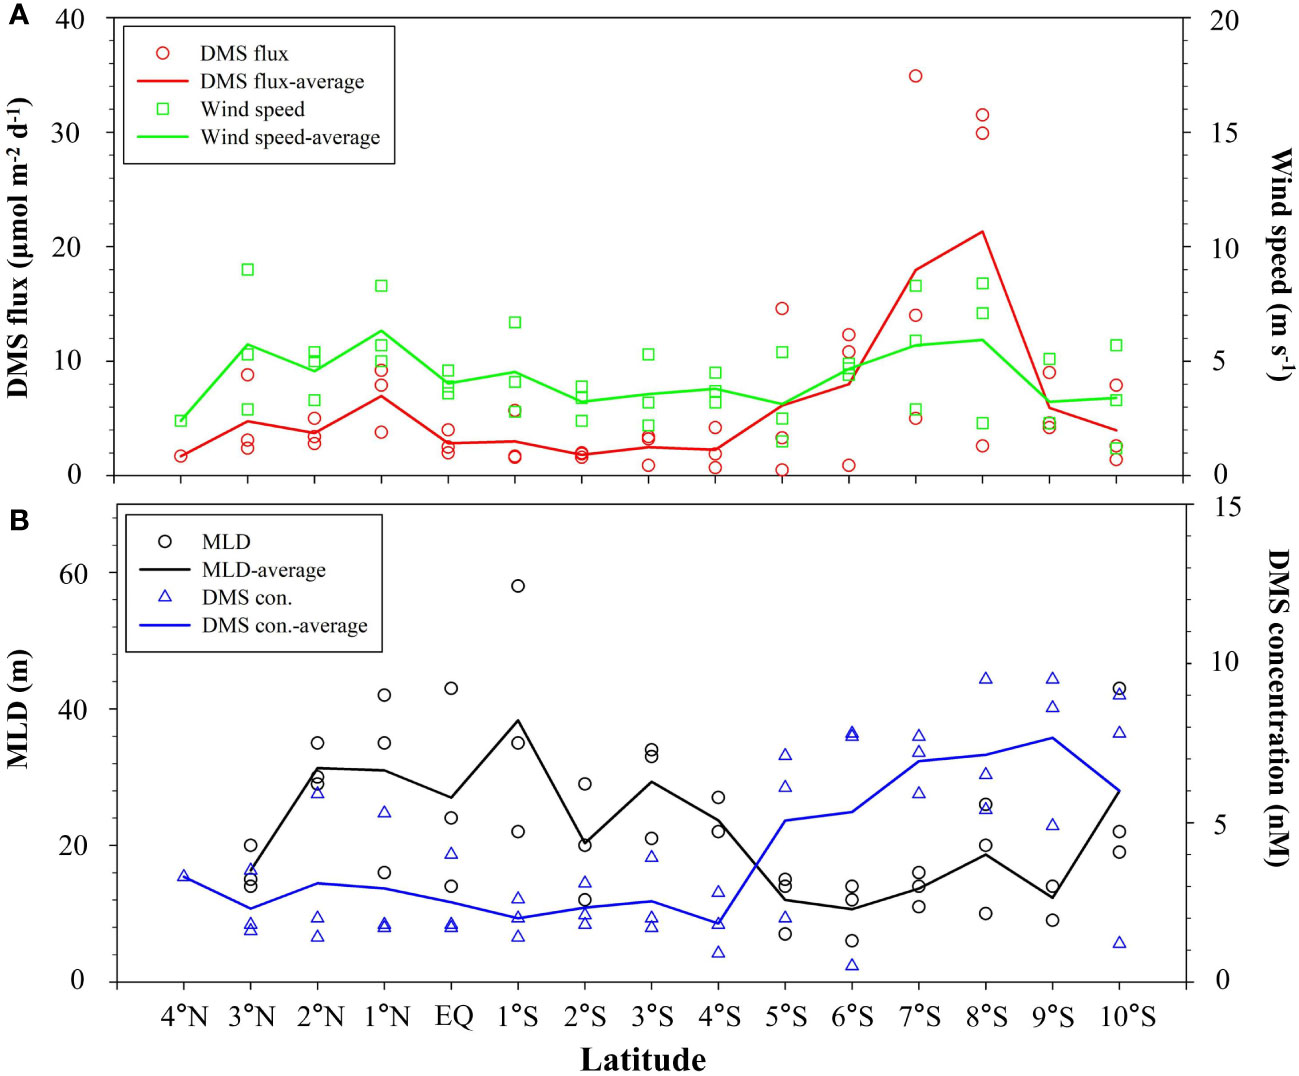
Figure 5 Variations of calculated DMS sea–air flux and wind speed (A), and DMS seawater concentration and MLD (B) in the WTIO during the 2021/2022 NEM.
4 Discussion
4.1 Physical–biological controls of seawater DMS in the WTIO
The WTIO is a highly dynamic region where upwelling, downwelling and perennial equatorial currents coexist, which are influenced by the monsoons and southeasterly trade winds. The upwelling of the SCTR, which is driven by upward Ekman pumping and results in a shallow thermocline and nitracline, is active in both boreal winter and boreal summer (Yokoi et al., 2008; Schott et al., 2009). The low-salinity South Equatorial Current, centered at 10°S, is associated with highly stable stratification of the SCTR during the NEM (George et al., 2013). The properties of water masses might influence the marine chemical and biological processes, with implications for DMS production and emission.
Surface Chl a concentration (<0.1 μg L−1) was low because the depth of the nitracline (14–82 m) was deeper than the MLD (6–24 m) at most stations, including those in the SCTR region, where stratification impeded the supply of nutrients to the surface (George et al., 2013; Lee et al., 2017). Consequently, phytoplankton in the oligotrophic water tended to live near or in the thermocline and nitracline (phytoplankton adaptive strategies; Kaiser et al., 2011; George et al., 2013), where nutrients are sufficient and natural light can penetrate (Figures 3A, C, D). The upwelling in the SCTR region uplifted the thermocline and nitracline, leading to a shallower SCM depth centered at ~45 m, whereas downwelling deepened the SCM band to ~75 m in the region of 2°–4°S (Figure 3C).
Because DMSPp production was derived directly from phytoplankton growth, the variation of the DMSPp maximum band was consistent with that of the SCM depth. The dominance of small (nano- and pico-sized) phytoplankton (55–93%; Tripathy et al., 2020) with high DMSPp/Chl a ratios (average: 175.6 ± 264.1) implied that high DMSP-content prymnesiophytes (Phaeocystis sp.) might be the dominant DMSP-producer in the WTIO (Keller et al., 1989; Herr et al., 2019; Tripathy et al., 2020). Phytoplankton release of intracellular DMSP into seawater through excretion, senescence, zooplankton grazing, and viral attack, formed the DMSPd-maximum bands at the SCM depth (Kiene et al., 2000; Boden and Hutt, 2019).
The upwelling effect was constrained by the fresh water from the eastward-flowing South Equatorial Current (George et al., 2013), and the regions with higher productivity and DMSP concentration were mainly concentrated in the subsurface rather than at the surface. However, the volatile DMS in the seawater was readily brought upward by Ekman pumping. Subsurface DMS produced from DMSP degradation via bacteria and/or algae (Kiene et al., 2000; Simó et al., 2000; Bullock et al., 2017) was moved upward by upwelling into the surface mixed layer (Bailey et al., 2008), and therefore the DMS peaks in the upper 30 m were shallower than those of Chl a and DMSP in the SCTR (Figure 3E). In contrast to the SCTR, downwelling decreased subsurface DMSP and DMS production, leading to the lowest concentration of surface DMS in the region of 2°–4°S. To the north of 1°S, the concentration of surface DMS increased with elevated levels of DMSP where vertical mixing extended the distribution of the SCM band owing to the deepened MLD (29~58 m) (George et al., 2013). There were also other complex factors linked to the uplift of the DMS maximum layer. For instance, intracellular DMSP content differs between phytoplankton species (Jean et al., 2005), and it is regulated by changes in salinity, temperature, and nutrients (Sunda et al., 2002).
The DMS concentration in the surface mixed layer was elevated by promotion of microbial DMSPd consumption in the SCTR (Table 2). Moreover, the thinnest MLD (6 m) was centered at 6°S, where the DMS yield from DMSP was believed to be high (MLD< 10 m; Simó and Pedrós-Alió, 1999). The average DMSPp/DMS ratio (4.3 ± 4.2) was greater than the DMSPd/DMS ratio (0.7 ± 0.7), suggesting that DMS production was contributed not only by DMSPd degradation but also by intracellular DMSPp cleavage within the highly active DMSP-lyase algae in this study (Keller et al., 1989; Simó et al., 2000; Galí and Simó, 2015). In the northeast of the study area (2°–3°N, 65°E), the DMS gross production rate (9.8 nmol L−1 d−1) was approximately 4 times higher than the rate of DMSPd microbial consumption (2.6 nmol L−1 d−1), implying that DMSPp lysis by phytoplankton was a main pathway of DMS production (Galí and Simó, 2015). Meanwhile, high salinity (>35.4) in this region stimulated phytoplankton to produce intracellular DMSP and DMS against environmental stress (Sunda et al., 2002). Additionally, DMSOd reduction was not a significant process for DMS accumulation, as suggested by the undetectable level of DMS at depths below 100 m at 10°S (Dixon et al., 2020).
4.2 DMS removal in the WTIO
Accumulation of DMS in the water column depends on the state of complex dynamic equilibrium between DMS production and consumption (Galí and Simó, 2015). In accord with previous studies (Kiene and Linn, 2000; Vila-Costa et al., 2008; Herr et al., 2019), microbial consumption was found to be the dominant pathway of DMS removal (74.4%) in the WTIO, followed by photodegradation (17.7%), and ventilation (7.9%). This finding demonstrated that photolysis and ventilation were less important and that bacterial degradation was the main sink of surface DMS in the WTIO.
The rates of DMS removal were not distributed uniformly throughout the WTIO. The microbial consumption rate in the area north of the equator was 5 times higher than that in other regions, corresponding with the highest DMS gross production, and indicating that it played a more important role in DMS removal. In the SCTR region, the shallow stratification of the water column led to slower microbial DMS consumption (47.1%) through enhanced inhibition of bacterial activities by ultraviolet radiation, but an increased level of importance of photooxidation (38.7%) owing to the stronger light intensity (Sunda et al., 2002; Simó, 2004; Toole et al., 2006; Vila-Costa et al., 2008). Thus, physical conditions were probably important factors in the spatial differences in the rate of DMS consumption in the WTIO.
In addition to DMS concentration and light intensity, the DMS photolysis process might be associated with secondary photosensitizers such as chromophoric dissolved organic matter and (Brimblecombe and Shooter, 1986; Toole et al., 2004; Bouillon and Miller, 2005). Low DMS photochemical consumption seemed to be attributed to low concentration (0.10 ± 0.18 µmol L−1) at the surface (Toole et al., 2004; Bouillon and Miller, 2005). However, the positive correlation between DMS and (R = 0.444, n = 36, p< 0.01) at the surface indicated that nitrogen deficiency tended to limit the growth of DMSP producers and stimulate the antioxidation of DMSP and DMS (Sunda et al., 2002; Herr et al., 2019). Low concentration and strong solar light could probably act as oxidative stresses to promote DMS accumulation instead of removal through photooxidation (Herr et al., 2019). This low DMS photooxidation with limitation of DMS microbial consumption by intensified light led to the low DMSOd pool at the surface (Del Valle et al., 2007; Del Valle et al., 2007; Schafer et al., 2009).
DMS ventilation (14.3%) in the SCTR was an order of magnitude higher than that in the region to the north of the equator (7.9%), suggesting that more DMS in the SCTR should be released to the atmosphere. However, DMS ventilation was weakened in the area to the north of the equator (Table 1), where DMS microbial consumption increased with increased bacterial activities in the thicker mixed layer (Toole et al., 2006). DMS sea–air flux is closely correlated with wind speed and the DMS concentration in seawater that is affected by MLD (Figure 5; Nightingale et al., 2000; Marandino et al., 2009). The fact that DMS sea–air flux is wind-speed dependent suggests that high DMS concentration in seawater alone cannot result in elevated DMS sea–air flux with weak winds. Hence, owing to the strong wind speed (>6 m s−1), the SCTR can release large amounts of DMS to the atmosphere. The lowest DMS flux near the equator resulted from downwelling and low DMS production.
4.3 Comparison with previous results and other tropical regions
Shenoy et al. (2002) and Zavarsky et al. (2018) also reported surface DMS concentrations and DMS sea–air fluxes in our study area or adjacent regions, as shown in Table 3. In the NEM of 1998, Shenoy et al. (2002) found the lowest DMS concentration in the region of 7°–15°S, whereas in the following winter, the concentration in this region was higher. Compared with our study, their sampling date was one month later and the region was further south. Their calculated DMS sea–air flux in the 1999 was lower than that of our study, although the wind speed in both cases was similar. This is because the kL calculation (linear equation) from Shenoy et al. (2002) decreased the DMS flux, whereas our study employed the kL from Nightingale et al. (2000) for the DMS flux calculation. In a region similar to that of our study, Zavarsky et al. (2018) obtained a similar estimate of DMS sea–air flux via eddy covariance measurements but a lower DMS concentration in seawater during the SWM. However, the sampling sites used by Zavarsky et al. (2018) covered less of the SCTR region than that sampled in our study.
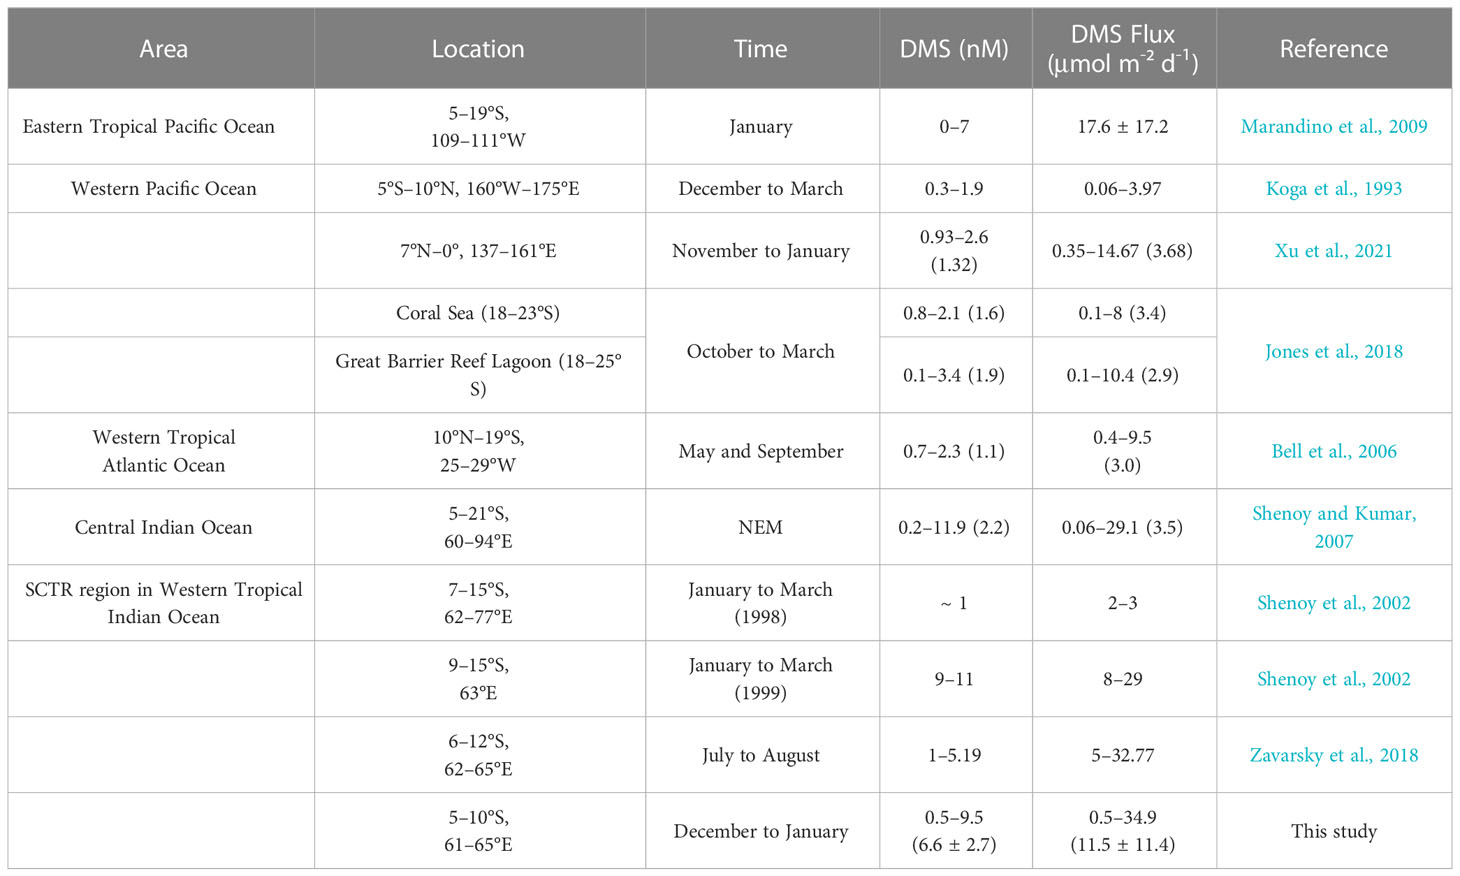
Table 3 Comparison of surface DMS concentration and DMS sea–air flux (averages in parentheses) from the WTIO with those in other oceanic regions.
Averaged DMS concentration and DMS sea–air flux in the SCTR showed high levels in the Indian Ocean during the NEM (Table 3) because of the higher DMSP concentration and stronger winds (Shenoy and Kumar, 2007). Seawater DMS in the SCTR showed an upper-level concentration during boreal winter in the tropics (Belviso et al., 2004). DMS sea–air flux of the SCTR was an order of magnitude higher than that of the western tropical Atlantic Ocean, corresponding to the lower DMS concentration in seawater in May and September (Table 3). The eastern tropical Pacific region also showed upwelling currents in January, where the measured DMS flux was higher than that in the SCTR (Table 3), although the sampling process and calculation method used to obtain the former result differed from those used to derive the result for the SCTR. However, the western Pacific region including coral reefs showed lower DMS flux than that of the SCTR during boreal winter owing to low DMS seawater concentration (Table 3).
By combining previous results with those of our study, and through comparison with other tropical regions, we propose that the SCTR region is an active region for DMS during both the NEM and the SWM. However, additional studies on DMS in the SCTR region should be conducted in spring and fall, i.e., the period of intermonsoonal winds, to elucidate the seasonality of DMS and establish the physical–biological drivers.
5 Conclusions and prospects
In this study, DMS, DMSP (dissolved and particulate), and DMSOd showed high spatial variations in the WTIO during the NEM. Physical forcing and associated biological processes played an important role in DMS production, consumption, and distribution. Elevated DMS in the surface mixed layer was observed in the SCTR region, where the shallow thermocline/nitracline and thin MLD promoted DMS production and constrained DMS microbial consumption. A thicker mixed layer and deeper thermocline caused by weak downwelling decreased biological productivity; hence, the lowest DMS concentration was found in the region of 2°–4°S. To the north of the equator, the highest DMSP with elevated Chl a concentrations contributed to high levels of DMS because of the deepening MLD. Microbial consumption dominated the DMS removal pathways, accounting for 74.4% of the total, while photooxidation and ventilation accounted for lower fractions of DMS turnover. Low DMS photodegradation possibly resulted in low DMSOd concentration in the surface water. High DMS sea–air flux was believed to exist in the SCTR during both the NEM and the SWM, corresponding to high DMS concentration in seawater and strong winds.
Data on biogenic sulfur compounds and their turnover in the WTIO are scarce. This study updated the relevant data to global DMS observations from the ocean to facilitate development of ocean–atmosphere modeling systems and estimation of the importance of oceanic DMS to climate change. Moreover, this study was the first to present information on biological DMS turnover in the WTIO region. Nevertheless, lack of knowledge on phytoplankton community structure restricted assessment of whether taxonomic composition is a main driver of the pattern of DMS distribution in the WTIO. Further studies on DMS biological dynamics and factors affecting this turnover are required to better understand the behavior of DMS compounds in the WTIO. Furthermore, long-term high-frequency observations of DMS and its oxidative products in the marine atmosphere of the WTIO will be needed to establish their roles with regard to cloud condensation nuclei formation.
Data availability statement
The original contributions presented in the study are included in the article/supplementary material. Further inquiries can be directed to the corresponding authors.
Author contributions
S-ML: Sample collections, Methodology, Writing-Original; XZ: Sample collections, Methodology; C-XL: Funding acquisition, Writing-Review and Editing; MX: Sample collections, Methodology; PS: Sample collections, Methodology; X-LL: Sample collections, Methodology; LL: Funding acquisition, Project administration; B-DW: Conceptualization, Writing-Review and Editing. All authors contributed to the article and approved the submitted version.
Funding
This work was financially supported by the Basic Scientific Fund for National Public Research Institutes of China (Grant Nos. 2021S03 and 2021Q06), National Natural Science Foundation of China (Grant Nos. 42076045 and 42006048), Distinguished Young Scholars Program of the Ministry of Natural Resources (Grant No. 12110600000018003928), and Global Change and Air–Sea Interaction Program (GASI-01-WIND-STwin).
Acknowledgments
We appreciate the great help and cooperation from the captain and crew of the R/V Xiang Yang Hong No.01 during the cruise. We thank James Buxton MSc, from Liwen Bianji (Edanz) (www.liwenbianji.cn/), for editing the English text of a draft of this manuscript.
Conflict of interest
The authors declare that the research was conducted in the absence of any commercial or financial relationships that could be construed as a potential conflict of interest.
Publisher’s note
All claims expressed in this article are solely those of the authors and do not necessarily represent those of their affiliated organizations, or those of the publisher, the editors and the reviewers. Any product that may be evaluated in this article, or claim that may be made by its manufacturer, is not guaranteed or endorsed by the publisher.
References
Bailey K. E., Toole D. A., Blomquist B., Najjar R. G., Huebert B., Kieber D. J., et al. (2008). Dimethylsulfide production in Sargasso Sea eddies. Deep Sea Res. Part II: Topical Stud. Oceanography 55 (10-13), 1491–1504. doi: 10.1016/j.dsr2.2008.02.011
Bell T. G., Malin G., McKee C. M., Liss P. S. (2006). A comparison of dimethylsulphide (DMS) data from the Atlantic meridional transect (AMT) programme with proposed algorithms for global surface DMS concentrations. Deep Sea Res. Part II: Topical Stud. Oceanography 53 (14-16), 1720–1735. doi: 10.1016/j.dsr2.2006.05.013
Belviso S., Bopp L., Moulin C., Orr J. C., Anderson T. R., Aumont O., et al. (2004). Comparison of global climatological maps of sea surface dimethyl sulfide. Global Biogeochem. Cycles 18, GB3013. doi: 10.1029/2003GB002193
Bepari K. F., Shenoy D. M., Chandrasekhararao A. V., Kurian S., Gauns M. U., Naik B. R., et al. (2019). Dynamics of dimethylsulphide and associated compounds in the coastal waters of goa, west coast of India. J. Mar. Syst. 207. doi: 10.1016/j.jmarsys.2019.103228
Boden R., Hutt L. P. (2019). Aerobic Bacterial Catabolism of Dimethylsulfoniopropionate. In: Rojo F. (eds) Aerobic Utilization of Hydrocarbons, Oils, and Lipids. Handbook of Hydrocarbon and Lipid Microbiology. (Springer, Cham). doi: 10.1007/978-3-319-50418-6_52
Bouillon R. C., Miller W. L. (2005). Photodegradation of dimethyl sulfide (DMS) in natural waters: laboratory assessment of the nitrate-photolysis-induced DMS oxidation. Environ. Sci. Technol. 39 (24), 9471–9477. doi: 10.1021/es048022z
Brimblecombe P., Shooter D. (1986). Photo-oxidation of dimethylsulfide in aqueous solution. Mar. Chem. 19 (4), 343–353. doi: 10.1016/0304-4203(86)90055-1
Bullock H. A., Luo H., Whitman W. B. (2017). Evolution of dimethylsulfoniopropionate metabolism in marine phytoplankton and bacteria. Front. Microbiol. 8. doi: 10.3389/fmicb.2017.00637
Charlson R. J., Lovelock J. E., Andreae M. O., Warren S. G. (1987). Oceanic phytoplankton, atmospheric sulphur, cloud albedo and climate. Nature 326(6114), 655–661. doi: 10.1038/326655a0
Dacey J. W. H., Wakeham S. G. (1986). Oceanic dimethylsulfide: Production during zooplankton grazing on phytoplankton. Science 233(4770), 1314–1316. doi: 10.1126/science.233.4770.1314
Dacey J. W. H., Wakeham S. G., Howes B. L. (1984). Henry's law constants for dimethylsulfide in freshwater and seawater. Geophysical Res. Lett. 11 (10), 991–994. doi: 10.1029/GL011i010p00991
Del Valle D. A., Kieber D. J., Kiene R. P. (2007). Depth-dependent fate of biologically-consumed dimethylsulfide in the Sargasso Sea. Mar. Chem. 103 (1-2), 197–208. doi: 10.1016/j.marchem.2006.07.005
Dixon J. L., Hopkins F. E., Stephens J. A., Schäfer H. (2020). Seasonal changes in microbial dissolved organic sulfur transformations in coastal waters. Microorganisms 8 (3), 337. doi: 10.3390/microorganisms8030337
Galí M., Simó R. (2015). A meta-analysis of oceanic DMS and DMSP cycling processes: disentangling the summer paradox. Global Biogeochemical Cycles 29 (4), 496–515. doi: 10.1002/2014GB004940
Gao X., Zhang H., Mao S., Yang G. (2021). Responses of biogenic sulfur compound production to dust aerosol enrichment and seawater acidification in the Western pacific ocean. Geophysical Res. Lett. 48, e2021GL095527. doi: 10.1029/2021GL095527
George J. V., Nuncio M., Chacko R., Anilkumar N., Noronha S. B., Patil S. M., et al. (2013). Role of physical processes in chlorophyll distribution in the western tropical Indian ocean. J. Mar. Syst. 113-114, 1–12. doi: 10.1016/j.jmarsys.2012.12.001
Gwinn J. K., Robertson A., Kiene R. P. (2019). Effect of salinity on DMSP production in gambierdiscus belizeanus (Dinophyceae). J. Phycology. 55, 1401–1411. doi: 10.1111/jpy.12923
Hatton A. D., Malin G., Liss P. S. (1999). Distribution of biogenic sulphur compounds during and just after the southwest monsoon in the Arabian Sea. Deep-Sea Res. Part II 46 (3-4), 617–632. doi: 10.1016/S0967-0645(98)00120-9
Herr A. E., Kiene R. P., Dacey J. W. H., Tortell P. D. (2019). Patterns and drivers of dimethylsulfide concentration in the northeast subarctic pacific across multiple spatial and temporal scales. Biogeosciences 16 (8), 1729–1754. doi: 10.5194/bg-16-1729-2019
Hood R. R., Beckley L. E., Wiggert J. D. (2017). Biogeochemical and ecological impacts of boundary currents in the Indian ocean. Prog. Oceanography 156, 290–325. doi: 10.1016/j.pocean.2017.04.011
Hulswar S., Simó R., Galí M., Bell T. G., Lana A., Inamdar S., et al. (2022). Third revision of the global surface seawater dimethyl sulfide climatology (DMS-Rev3). Earth System Sci. Data 14 (7), 2963–2987. doi: 10.5194/ESSD-14-2963-2022
Jean N., Bogé G., Jamet J. L., Richard S., Jamet D. (2005). Annual contribution of different plankton size classes to particulate dimethylsulfoniopropionate in a marine perturbed ecosystem. J. Mar. Syst. 53 (1-4), 235–247. doi: 10.1016/j.jmarsys.2004.06.003
Jones G., Curran M., Deschaseaux E., Omori Y., Tanimoto H., Swan H., et al. (2018). The flux and emission of dimethylsulfide from the great barrier reef region and potential influence on the climate of NE Australia. J. Geophysical Research: Atmospheres. 123, 13835–13856. doi: 10.1029/2018jd029210
Kaiser M. J., Attrill M. J., Jennings S., Thomas D. N., Barnes D. K. A., Hiddink J. G., et al. (2011). Marine Ecology: Processes, Systems and Impacts. (2nd Ed.). (Oxford: Oxford University Press).
Karsten U., Kück K., Vogt C., Kirst G. O. (1996). “Dimethylsulfoniopropionate production in phototrophic organisms and its physiological functions as a cryoprotectant,” in Biological and environmental chemistry of DMSP and related sulfonium compounds. Eds. Kiene R. P., Visscher P. T., Keller M. D., Kirst G. O. (Boston, MA: Springer). doi: 10.1007/978-1-4613-0377-0_13
Keller M. D., Bellow W. K., Guillard R. (1989). Dimethyl Sulfide Production in Marine Phytoplankton. Biogenic Sulfur in the Environment, 167–182. doi: 10.1021/bk-1989-0393.ch011
Kiene R. P., Bates T. S. (1990). Biological removal of dimethyl sulphide from sea water. Nature 345 (6277), 702–705. doi: 10.1038/345702a0
Kiene R. P., Gerard G. (1994). Determination of trace levels of dimethylsulfoxide (DMSO) in seawater and rainwater. Mar. Chem. 47 (1), 1–12. doi: 10.1016/0304-4203(94)90009-4
Kiene R. P., Gerard G. (1995). Evaluation of glycine betaine as an inhibitor of dissolved dimethylsulfoniopropionate degradation in coastal waters. Mar. Ecol. Prog. Ser. 128, 121–131. doi: 10.3354/meps128121
Kiene R. P., Linn L. J. (2000). The fate of dissolved dimethylsulfoniopropionate (DMSP) in seawater: tracer studies using 35S-DMSP. Geochimica Et Cosmochimica Acta 64 (16), 2797–2810. doi: 10.1016/S0016-7037(00)00399-9
Kiene R. P., Linn L. J., Bruton J. A. (2000). New and important roles for DMSP in marine microbial communities. J. Sea Res. 43 (3-4), 209–224. doi: 10.1016/S1385-1101(00)00023-X
Kiene R. P., Linn L. J., González J., Moran M. A., Bruton J. A. (1999). Dimethylsulfoniopropionate and methanethiol are important precursors of methionine and protein-sulfur in marine bacterioplankton. Appl. Environ. Microbiol. 65 (10), 4549–4558. doi: 10.1128/aem.65.10.4549-4558.1999
Kiene R. P., Service S. K. (1991). Decomposition of dissolved DMSP and DMS in estuarine waters: dependence on temperature and substrate concentration. Mar. Ecol. Prog. 76 (1), 1–11. doi: 10.3354/meps076001
Kiene R. P., Slezak D. (2006). Low dissolved DMSP concentrations in seawater revealed by small-volume gravity filtration and dialysis sampling. Limnology Oceanography: Methods 4 (4), 80–95. doi: 10.4319/lom.2006.4.80
Koga S., Tanaka H., Hayashi M. (1993). Dimethylsulfide measured in the Western pacific and the southern Indian ocean. J. Meteorological Soc. Japan. Ser. II 71 (2), 183–194. doi: 10.2151/jmsj1965.71.2_183
Lana A., Bell T. G., Simó R., Vallina S. M., Ballabrera-Poy J., Kettle A. J., et al. (2011). An updated climatology of surface dimethlysulfide concentrations and emission fluxes in the global ocean. Global Biogeochemical Cycles 25 (1), GB1004-1-GB1004-17. doi: 10.1029/2010gb003850
Lee K., Matsuno T., Endoh T., Ishizaka J., Zhu Y., Takeda S., et al. (2017). A role of vertical mixing on nutrient supply into the subsurface chlorophyll maximum in the shelf region of the East China Sea. Continental Shelf Res. 143, 139–150. doi: 10.1016/j.csr.2016.11.001
Lee P. A., Mora S. J. D. (1999). Intracellular dimethylsulfoxide (DMSO) in unicellular marine algae: speculations on its origin and possible biological role. J. Phycology 35 (1), 8–18. doi: 10.1046/j.1529-8817.1999.3510008.x
Ma Q., Xu F., Zhang H., Yang G. (2022). Transformation processes of biogenic dimethylated sulfur compounds in the northwestern pacific continental sea. Limnology Oceanography 67, 903–917. doi: 10.1002/lno.12044
Marandino C. A., De Bruyn W. J., Miller S. D., Saltzman E. S. (2009). Open ocean DMS air/sea fluxes over the eastern south pacific ocean. Atmospheric Chem. Phys. 9 (2), 345–356. doi: 10.5194/acp-9-345-2009
Naik B. R., Gauns M., Bepari K., Uskaikar H., Shenoy D. M. (2020). Variation in phytoplankton community and its implication to dimethylsulphide production at a coastal station off goa, India. Mar. Environ. Res. 157. doi: 10.1016/j.marenvres.2020.104926
Nightingale P. D., Malin G., Law C. S., Watson A. J., Liss P. S., Liddicoat M. I., et al. (2000). In situ evaluation of air-sea gas exchange parameterizations using novel conservative and volatile tracers. Global Biogeochemical Cycles 14 (1), 373–387. doi: 10.1029/1999gb900091
Saltzman E. S., King D. B., Holmen K., Leck C. (1993). Experimental determination of the diffusion coefficient of dimethylsulfide in water. J. Geophysical Research: Oceans 98 (C9), 16481–16486. doi: 10.1029/93jc01858
Schafer H., Myronova N., Boden R. (2009). Microbial degradation of dimethylsulphide and related C1-sulphur compounds: organisms and pathways controlling fluxes of sulphur in the biosphere. J. Exp. Bot. 61 (2), 315–334. doi: 10.1093/jxb/erp355
Schott F. A., Xie S. P., McCreary J. P. (2009). Indian Ocean circulation and climate variability. Rev. Geophysics 47 (1), RG1002-46. doi: 10.1029/2007RG000245
Seymour J. R., Simo R., Ahmed T., Stocker R. (2010). Chemoattraction to dimethylsulfoniopropionate throughout the marine microbial food web. Science 329 (5989), 342–345. doi: 10.1126/science.1188418
Shenoy D. M., Joseph S., Kumar M. D., George M. D. (2002). Control and interannual variability of dimethyl sulfide in the Indian ocean. J. Geophysical Research: Atmospheres 107 (D19), pp. INX2 7-1-INX2 7-9. doi: 10.1029/2001JD000371
Shenoy D. M., Kumar M. D. (2007). Variability in abundance and fluxes of dimethyl sulphide in the Indian ocean. Biogeochemistry 83 (1-3), 277–292. doi: 10.1007/s10533-007-9092-4
Shenoy D. M., Patil J. S. (2003). Temporal variations in dimethylsulphoniopropionate and dimethyl sulphide in the zuari estuary, goa (India). Mar. Environ. Res. 56 (3), 387–402. doi: 10.1016/S0141-1136(02)00337-9
Simó R. (2004). From cells to globe: approaching the dynamics of DMS(P) in the ocean at multiple scales. Can. J. Fisheries Aquat. Sci. 61 (5), 673–684. doi: 10.1139/f04-030
Simó R., Hatton A. D., Malin G., Liss P. S. (1998). Particulate dimethyl sulphoxide in seawater: production by microplankton. Mar. Ecol. Prog. Ser. 167, 291–296. doi: 10.3354/meps167291
Simó R., Pedrós-Alió C. (1999). Role of vertical mixing in controlling the oceanic production of dimethyl sulphide. Nature 402 (6760), 396–399. doi: 10.1038/46516
Simó R., Pedrós-Alió C., Malin G., Grimalt J. O. (2000). Biological turnover of DMS, DMSP and DMSO in contrasting open-sea waters. Mar. Ecol. Prog. Ser. 203 (1438), 1–11. doi: 10.3354/meps203001
Steinke M., Evans C., Lee G. A., Malin G. (2007). Substrate kinetics of DMSP-lyases in axenic cultures and mesocosm populations of emiliania huxleyi. Aquat. Sci. 69 (3), 352–359. doi: 10.1007/s00027-007-0893-2
Sunda W., Kieber D. J., Kiene R. P., Huntsman S. (2002). An antioxidant function for DMSP and DMS in marine algae. Nature 418 (6895), 317–320. doi: 10.1038/nature00851
Toole D. A., Kieber D. J., Kiene R. P., White E. M., Bisgrove J., del Valle D. A., et al. (2004). High dimethylsulfide photolysis rates in nitrate-rich Antarctic waters. Geophysical Res. Lett. 31, (11). doi: 10.1029/2004GL019863
Toole D. A., Slezak D., Kiene R. P., Kieber D. J., Siegel D. A. (2006). Effects of solar radiation on dimethylsulfide cycling in the western Atlantic ocean. Deep Sea Res. Part I: Oceanographic Res. Papers 53 (1), 136–153. doi: 10.1016/j.dsr.2005.09.003
Tripathy S. C., Sabu P., Patra S., Naik R. K., Sarkar A., Venkataramana V., et al. (2020). Biophysical control on variability in phytoplankton production and composition in the south-Western tropical Indian ocean during monsoon 2014. Front. Mar. Sci. 7. doi: 10.3389/fmars.2020.00515
Van Bergeijk S. A., Claar V. D. Z., Stal L. J. (2003). Uptake and excretion of dimethylsulphoniopropionate is driven by salinity changes in the marine benthic diatom cylindrotheca closterium. Eur. J. Phycology 38 (4), 341–349. doi: 10.1080/09670260310001612600
Vila-Costa M., Kiene R. P., Simó R. (2008). Seasonal variability of the dynamics of dimethylated sulfur compounds in a coastal Northwest Mediterranean site. Limnology Oceanography 53 (1), 198–211. doi: 10.4319/lo.2008.53.1.0198
Vinayachandran P., Masumoto Y., Roberts M. J., Huggett J. A., Halo I., Chatterjee A., et al. (2021). Reviews and syntheses: Physical and biogeochemical processes associated with upwelling in the Indian ocean. Biogeosciences 18 (22), 5967–6029. doi: 10.5194/BG-18-5967-2021
Wiggert J. D., Murtugudde R. G., Christian J. R. (2006). Annual ecosystem variability in the tropical Indian ocean: Results of a coupled bio-physical ocean general circulation model. Deep-Sea Res. Part II 53 (5), 644–676. doi: 10.1016/j.dsr2.2006.01.027
Wolfe G. V., Kiene R. P. (1993). Effects of methylated, organic, and inorganic substrates on microbial consumption of dimethyl sulfide in estuarine waters. Appl. Environ. Microbiol. 59 (8), 2723–2726. doi: 10.1128/aem.59.8.2723-2726.1993
Xu F., Yan S., Zhang H., Wu Y., Ma Q., Song Y., et al. (2021). Occurrence and cycle of dimethyl sulfide in the western pacific ocean. Limnology Oceanography 66 (7), 2868–2884. doi: 10.1002/lno.11797
Yokoi T., Tozuka T., Yamagata T. (2008). Seasonal variation of the Seychelles dome. J. Climate 21 (15), 3740–3754. doi: 10.1175/2008jcli1957.1
Keywords: dimethylsulfide (DMS), dimethylated sulfur compounds, DMS removal, DMS sea-air flux, Western Tropical Indian Ocean (WTIO)
Citation: Liang S-M, Zhai X, Li C-X, Xin M, Sun P, Liu X-L, Liu L and Wang B-D (2023) Distribution and physical–biological controls of dimethylsulfide in the western tropical Indian Ocean during winter monsoon. Front. Mar. Sci. 10:1100678. doi: 10.3389/fmars.2023.1100678
Received: 17 November 2022; Accepted: 16 February 2023;
Published: 01 March 2023.
Edited by:
Gui-Peng Yang, Ocean University of China, ChinaReviewed by:
Wu Men, Nanjing University of Information Science and Technology, ChinaGui-Peng Yang, Ocean University of China, China
Copyright © 2023 Liang, Zhai, Li, Xin, Sun, Liu, Liu and Wang. This is an open-access article distributed under the terms of the Creative Commons Attribution License (CC BY). The use, distribution or reproduction in other forums is permitted, provided the original author(s) and the copyright owner(s) are credited and that the original publication in this journal is cited, in accordance with accepted academic practice. No use, distribution or reproduction is permitted which does not comply with these terms.
*Correspondence: Cheng-Xuan Li, Q3hsaUBmaW8ub3JnLmNu; Bao-Dong Wang, d2FuZ2JkQGZpby5vcmcuY24=