 Guanxun Wang
 Jingyu Pan1
 Jing Yu
 Dongqi Gu
95% of researchers rate our articles as excellent or good
Learn more about the work of our research integrity team to safeguard the quality of each article we publish.
Find out more
ORIGINAL RESEARCH article
Front. Mar. Sci. , 16 March 2023
Sec. Marine Ecosystem Ecology
Volume 10 - 2023 | https://doi.org/10.3389/fmars.2023.1100208
This article is part of the Research Topic Restoration of Coastal Marine Ecosystems View all 22 articles
Introduction: Management of coastal wetlands has resulted in extensive conservation of this natural resource; however, changes in carbon storage function are not yet known. There is a direct link between landscape and soil carbon storage. Predicting future changes in the landscape and carbon storage in coastal wetlands is important for developing wetland management policies.
Method: Here, remote sensing and physical methods were used to measure and calculate the landscape and surface soil carbon stocks of the Liaohe River Estuary Wetland (LREW). The changes in the landscape and soil carbon stocks under three scenarios: natural development, strict protection, and culture pond transfer, were then predicted using the PLUS model.
Result: The results indicate that the surface soil organic carbon storage was 2107.97×103 t, while soil organic carbon density decreased from land to sea. Anthropogenic activity was found to be the main driver of the current landscape evolution. However, the impact of sea level rise is increasing. By 2030, considerably more storage will be gained under the culture pond transfer scenario than at present.
Discussion: Our results reveal that some of the methods of ecological restoration may diminish the carbon storage capacity of coastal wetlands. Making full use of areas with high carbon storage potential may be an effective wetland carbon sink management strategy. Governments should consider more comprehensively for a better carbon pool when developing restoration strategies.
Atmospheric carbon dioxide (CO2) concentration, which is gradually increasing, reached 421 ppm in 2021 (Kodaira, 2014; Earth System Research Laboratories, 2022). Coastal wetlands are known to be powerful carbon sinks vital for reducing atmospheric CO2 intensity and mitigating global climate change (Bonan, 2008). Coastal wetlands are the mainstay of blue-carbon ecosystems in coastal zones. Owing to the influence of periodic tidal inundation, the tidal reciprocation of seawater can greatly slow the decomposition of sedimentary organic matter (Mcleod et al., 2011). As a result, the rate of carbon burial per unit area is 15 times higher than that of carbon sequestration in terrestrial ecosystems and 50 times higher than that in marine ecosystems (Wang et al., 2021c). In addition, the presence of large amounts of sulfate ions in seawater effectively inhibits methane (CH4) emissions compared with freshwater wetlands, giving coastal wetlands a considerable advantage over terrestrial ecosystems in terms of carbon sequestration (Bridgham et al., 2006). Thus, coastal wetlands are an important resource for combatting current climate change issues (Mitsch et al., 2013). However, coastal wetlands are fragile ecosystems. Globally, along with climate change and increased anthropogenic activity, many coastal wetlands have been irrevocably exploited and have shrunk in size, resulting in significant loss of carbon storage function (Moomaw et al., 2018; Meng et al., 2019).
Soil organic carbon (SOC) is a key component of carbon capture and storage and plays a crucial role in mitigating the CO2 increase and global greenhouse effect. Most carbon in coastal wetlands is stored in the soil, especially in areas with vegetation cover (Phang et al., 2015). However, the stability of carbon storage in soils is usually poor and is easily lost due to environmental changes. Therefore, it is necessary to analyze the impact of anthropogenic activities on soil carbon stocks in wetlands to identify wetland management approaches to increase carbon sequestration.
The management of coastal wetlands in many countries has entered a phase of conservation and restoration. In China, for example, hundreds of ecological restoration projects have been carried out over the past decades Li et al., 2022). In the stage where protection is the dominant management strategy, promising results have been obtained in protecting biological habitats, improving hydrological conditions, and reducing pollution (Li et al., 2019; Xia et al., 2020). However, research on carbon stock capacity, an important indicator of ecological restoration success (Horsburgh et al., 2022), is limited. Changes in landscape, which is closely related to soil carbon storage, can alter soil structure, stability, and organic carbon inputs, which in turn alters the soil carbon sequestration capacity (Zhao et al., 2017; Sasmito et al., 2019), with implications for the carbon cycle of ecosystems. More studies have used landscape science to estimate soil carbon stocks; (Li et al,. 2005; Wang et al., 2013); however, these are primarily analyses of the present situation (Aitali et al., 2022). The vulnerability of coastal wetlands results in dynamic landscapes and soil carbon stocks, and modeling future changes may provide vital assistance for wetland management (Wang et al., 2014).
The Liaohe River Estuary Wetland (LREW) is the largest reed wetland in Asia. Owing to over-exploitation, large areas of natural wetlands have been transformed into built-up land, culture ponds, and agricultural land. The loss of plant productivity has resulted in severe degradation of carbon storage function (Zhao et al., 2017; Xia et al., 2021). An ecological restoration project was conducted in 2015 to protect the LREW. Approximately 5,500 ha of culture ponds were removed over a 6-year period. This major project represents the official beginning of the conservation and restoration phase of the management of the area. However, the changes in LREW after this project and the possibilities for future development are yet to be evaluated. Therefore, it is necessary to investigate the evolution of the landscape and soil carbon stocks in the area during the ecological restoration phase and estimate how these changes will occur in the future. This study aimed to investigate the changes in the landscape and soil carbon storage in coastal wetlands after entering the restoration and conservation phase, and to identify appropriate management approaches by predicting the development under different scenarios. Remote sensing techniques, landscape prediction models, and field measurements of soil carbon stocks will be utilized in this paper. The findings of this study are expected to provide a scientific basis for management decisions on the landscape pattern and carbon sink function of the LREW in the future.
The LREW, a Ramsar wetland, is located in northeastern China (121°28′E–122°10′E, 40°32′N–41°3′N) (Ramsar, 2022) (Figure 1). It is bound by the Daling River in the west, the confluence of the Liaohe River in the north, and an isobath of seawater –6 m in the south. The area is ~ 1,800 km2. The study area is dominated by wetland vegetation, in which typical communities grow, including reeds, seepweeds, and Asian rice. In addition, many species, including tanager cranes, black-billed gulls, and spotted seals, live and breed in the wetlands or utilize them as resting and feeding areas during migration. The region has a warm temperate continental monsoon climate with an average annual temperature of 10–10.9 °C. The average annual rainfall is 380.3–748.2 mm/year (Zhou and Liu, 2020). Anthropogenic activities include oil extraction, rice cultivation, and aquaculture.
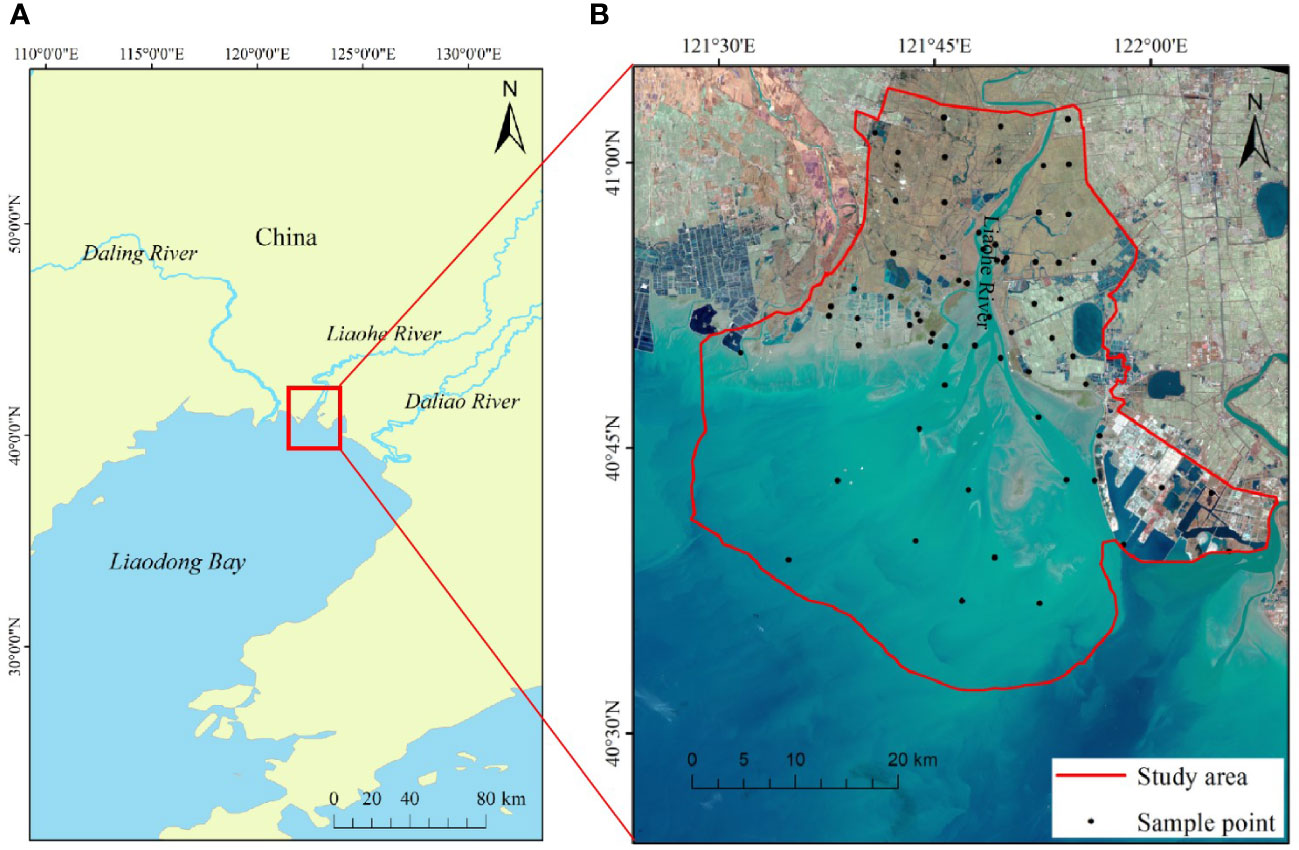
Figure 1 Location of Liaohe River Estuary (A). Study area and locations of sampling sites (B).
We sampled the upper 20-cm soil layer because the SOC in salt marshes is mainly distributed in this layer (Ye et al., 2015; Zhao et al., 2017; Meng et al., 2019). 60 soil samples (0–20 cm deep) were collected at 60 sites in the LREW in July 2022 (Figure 1). The sampling grid in the northern and southeastern wetlands was 4 km × 4 km. In the southern part of the shallow waters and the eastern tidal areas were sampled according to the principles of representativeness and accessibility. Due to the great variability of the landscape in tidal area, the distance between sampling points in different landscapes was controlled to be within 2 km. Soil bulk weight was measured using a cutting ring during collection. The samples were dried at 80 °C, ground with an agate mortar, and passed through a 2-mm sieve. The organic carbon concentration was determined after adding a 2% hydrochloric acid solution to remove inorganic carbon. soil organic carbon density (SOCD) and soil organic carbon storage (SOCS) were calculated using equations (1) and (2), respectively.
where SOCD is soil organic carbon density (kg m-2), SOC is soil organic carbon content (g kg-1), BD is soil bulk weight (g cm-3), and H is the soil layer height (cm).
where SOCS is the soil organic carbon storage (kg), and A is the area of the different landscape types (m2).
The SOCD distribution under different landscape types was obtained by spatial overlay analysis of the field data and remotely sensed interpreted images.
Landsat TM digital images with a ground resolution of 30 m for 2015, 2017, 2019, and 2021 were used to assess landscape changes. All images were corrected for radiometric and atmospheric effects and georeferenced with a root mean square error of fewer than 0.3 pixels. The LREW landscapes were divided into nine types, namely shallow sea, silt and sludge flat, reed, seepweed, river and reservoir, shoal, grassland, paddy, culture pond, abandoned culture pond and build-up land. The landscape classification was performed using a combination of supervised classification and visual interpretation. The 2021 Kappa statistic was 0.903, as verified by the field landscape surveys.
To predict future landscape changes, the PLUS model was conducted in this study using a random forest algorithm to individually mine the factors of each type of land use expansion and drivers. As a result, the development probability of each type of land use and the contribution of the drivers can be obtained. In addition, the model contains a new multiclass seed growth mechanism that can better simulate multiclass land use patch-level changes. Combined with the stochastic seed generation and threshold-decreasing mechanism, the model can simulate the automatic generation of patches with spatiotemporal dynamics under development probability constraints (Liang et al., 2021).
Before simulating and optimizing the future land use, appropriate driving factors, landscape demand area, and landscape conversion feasibility were set according to the change characteristics of the actual land use in the study area. The simulation accuracy under the current parameters is verified by comparing the landscape data of existing years with the model simulation results. Six types of driving factors were selected: elevation, slope, slope direction, distance from the city, distance from the water system and distance from the coastline. These factors are often important in influencing landscape change in coastal wetlands. The kappa coefficients of 0.831 and 0.817 were calculated for the two periods using the PLUS model, which proved that the model parameters were set reasonably.
Natural development is a common means of coastal wetland evolution. Management approaches that impose restrictions on artificial wetlands, such as aquaculture ponds and agricultural fields, are also common (Braswell & Heffernan, 2019; Rivera-Monroy et al., 2019). In addition, coastal zone fisheries, represented by aquaculture, are among the most common services provided by wetlands to the public (Wang et al., 2021b). Appropriate management of culture ponds often has a positive effect on wetland sustainability (Hussenot, 2003; Liu et al., 2014). On the contrary, the removal of culture ponds can be detrimental to farmers. The carbon storage capacity of reed wetlands is typically much higher than that of seablite wetlands (Ji et al., 2020; Li et al., 2022b). The culture ponds in the LREW were mainly concentrated in the reed zone. Transferring them to the seablite region might protect the income of farmers while restoring the soil carbon storage capacity. Therefore, the simulation scenarios for this study were divided into three categories: natural development (ND), strict protection (SP), and culture pond transfer (CPT) to 2030. The specific land demand parameters are listed in Table 1. It is to be noted that the Markov module is part of the PLUS model for forecasting future land demand. Since this module is common in landscape forecasting, it is not described too much in this paper.
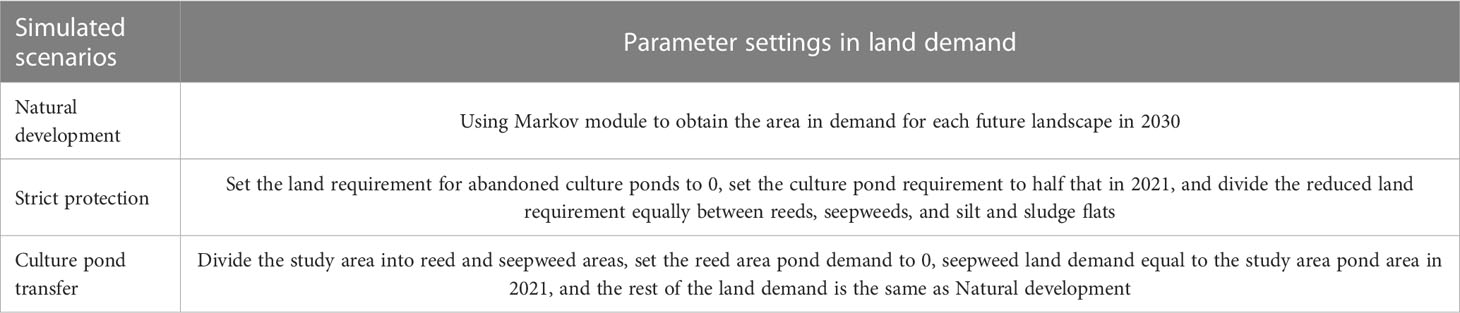
Table 1 Simulation scenarios and corresponding parameter settings in the patch-generating land use simulation (PLUS) model.
The distribution of SOCS in 2021 in different landscapes was generated using the inverse distance weighting interpolation method (Figure 2). The SOCD in the upper 20-cm soil layer ranged from 0.03–4.69 kg m-2; the lowest value (0.03 kg m-2) was observed in shallow sea, and the highest (4.69 kg m-2) in the reed area. Total SOCS in the LREW was 2,107.97×103 t. The distribution gradually decreased from land to sea. The average SOCD was the highest in reed landscapes (2.385 kg m-2), followed by agricultural landscapes (2.364 kg m-2). The lowest SOCD was found in shallow sea (0.605 kg m-2), and soil carbon stocks were usually higher in vegetated areas (Table 2).
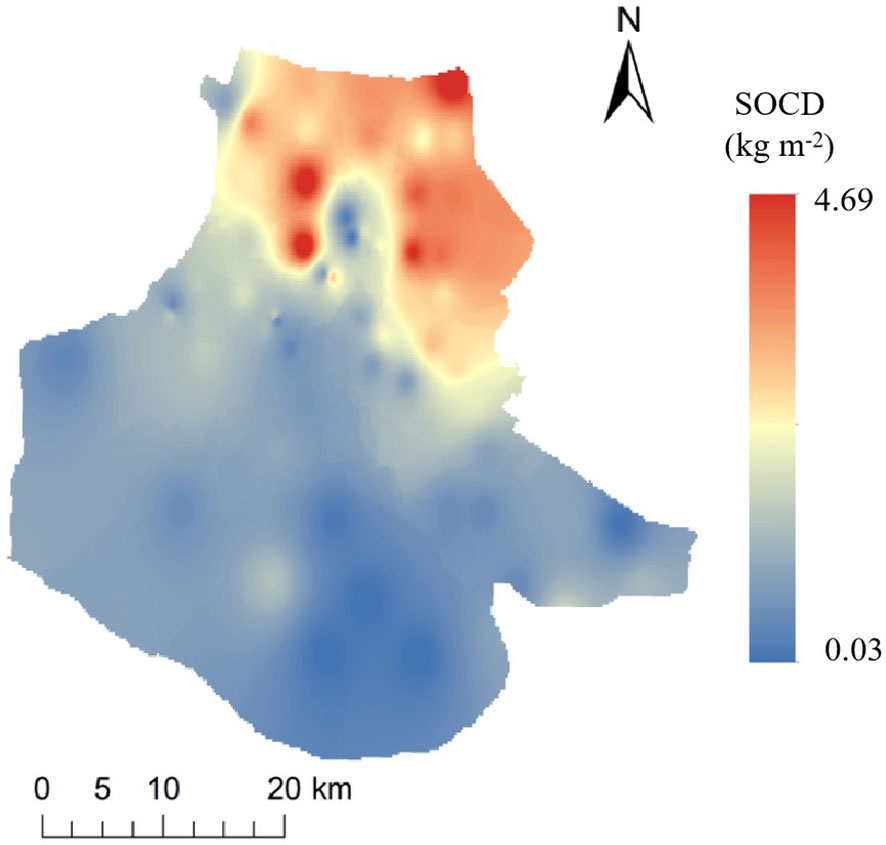
Figure 2 Distribution of the soil organic carbon (SOC) pool of the upper 20-cm soil layer in the LREW in 2021.
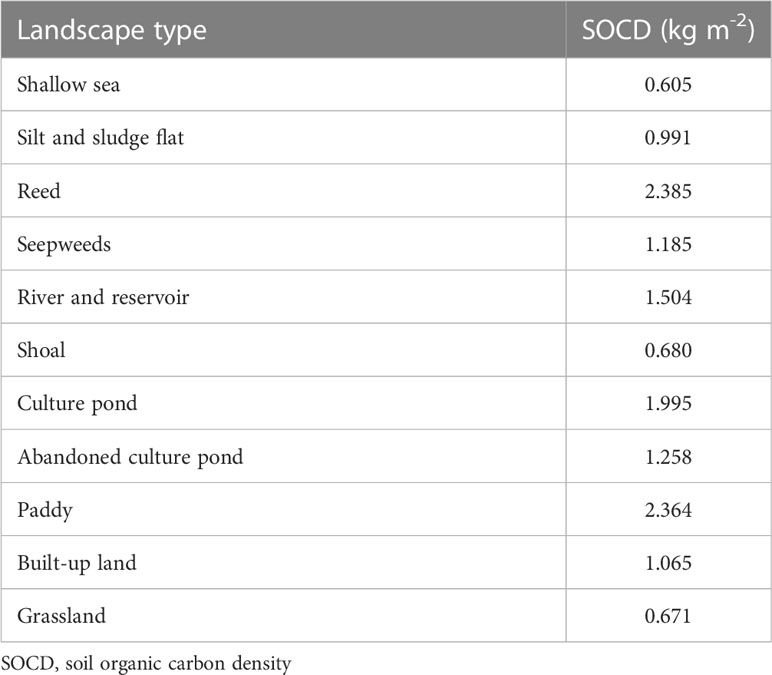
Table 2 Upper soil organic carbon density (SOCD) in different landscape types.
The landscape types of coastal wetlands in the LREW in 2021 comprised mainly shallow waters and reeds (Figure 3). Shallow waters accounted for 46% of the total area, reeds for 19%, and shoals for 12%. The extent of the other landscapes was relatively small. Compared with 2015, the areas of silt and sludge flats, shoals, abandoned culture ponds, and built-up land increased (Figure 3A). The extent of silt flats increased the most, at 75.66 km2 (68.70%). The areas of shallow sea, rivers and reservoirs, aquaculture ponds, and grasslands decreased. The most substantial change in the landscape was in shallow waters, which decreased by 103.21 km2 (Figure 3B). The reed and farmland areas remained almost unchanged (Figure 4A). The extent of shallow sea, reeds, culture ponds, abandoned culture ponds, and grassland is estimated to decrease by 2030 under the ND and SP scenarios (Figures 3C, D). The extent of reeds, ponds and abandoned ponds will decrease more under the SP scenario, reaching 5.45 km2, 6.97 km2, and 17.07 km2, respectively. The extent of the shoals, seepweeds, and built-up land will increase. Under the ND scenario, the extent of the shoals will increase by 42.55 km2, seepweeds by 13.59 km2, and built-up land by 9.07 km2. Under the SP scenario, the extent of shoals will increase by 35.99 km2, seepweeds by 28.31 km2, and the built-up land by 6.51 km2. The extent of the rivers and reservoirs, paddies, and silt and sludge flats will remain mostly unchanged (Table 3).
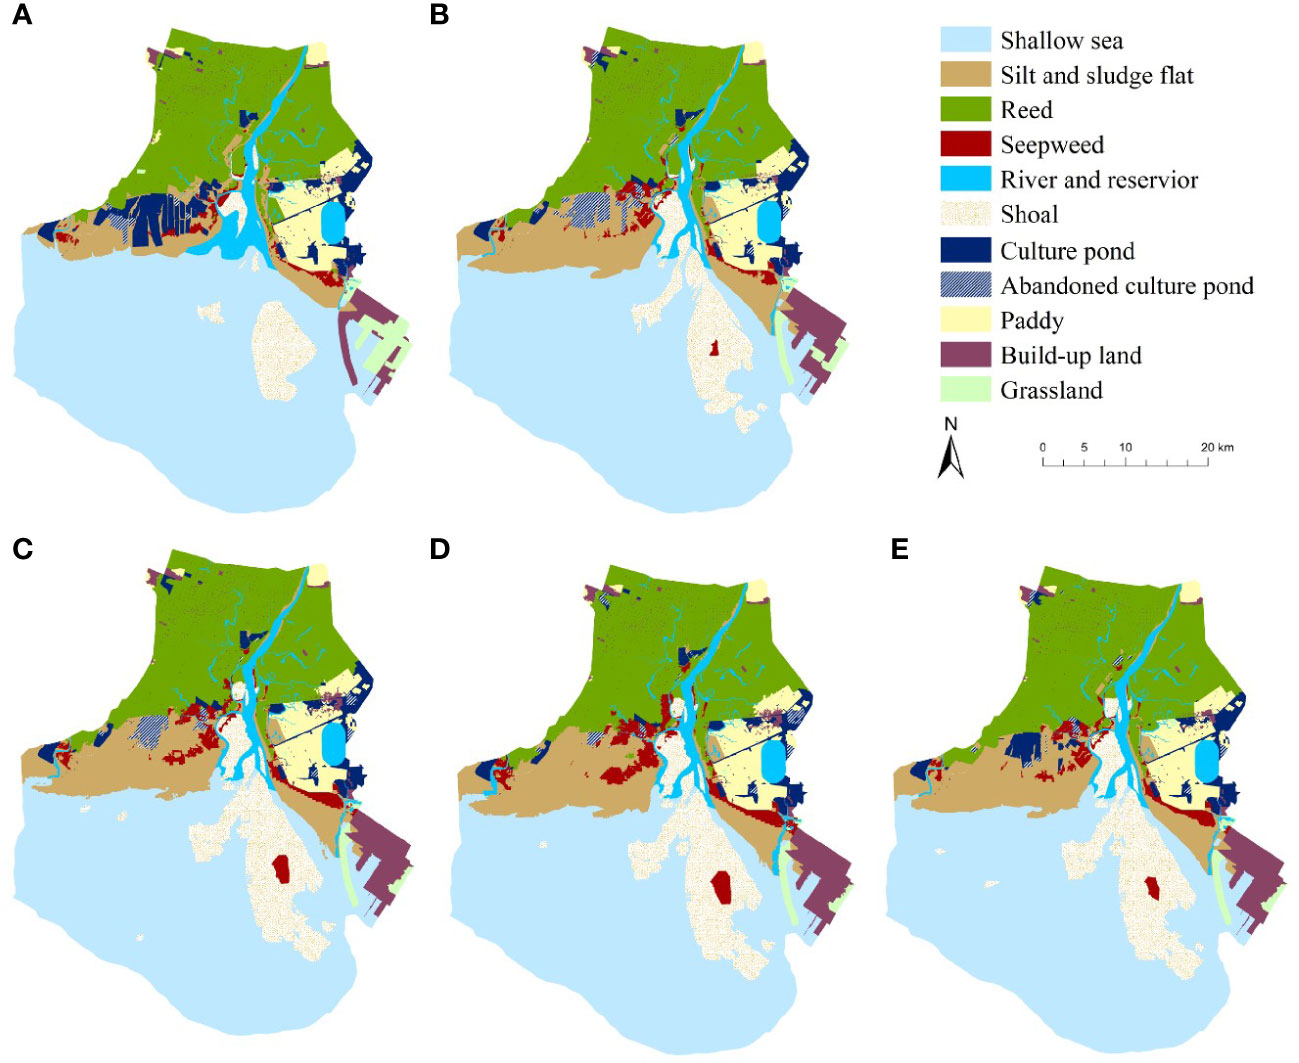
Figure 3 Landscape type distribution in the study area in (A) 2015, (B) 2021, (C) 2030 under ND scenarios, (D) 2030 under SP scenarios, and (E) 2030 under CPT scenarios.
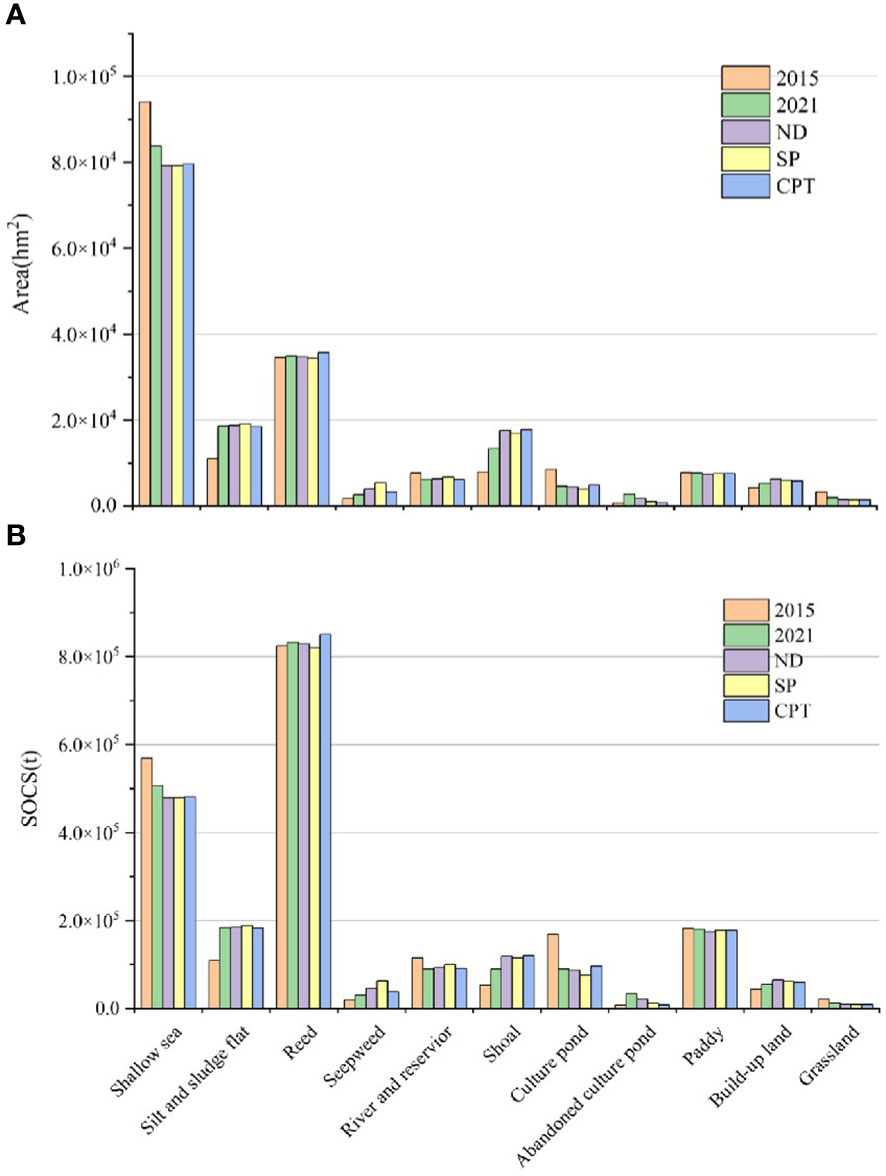
Figure 4 Comparison of each area (A) and each soil organic carbon storage (SOCS) (B) of different landscape.
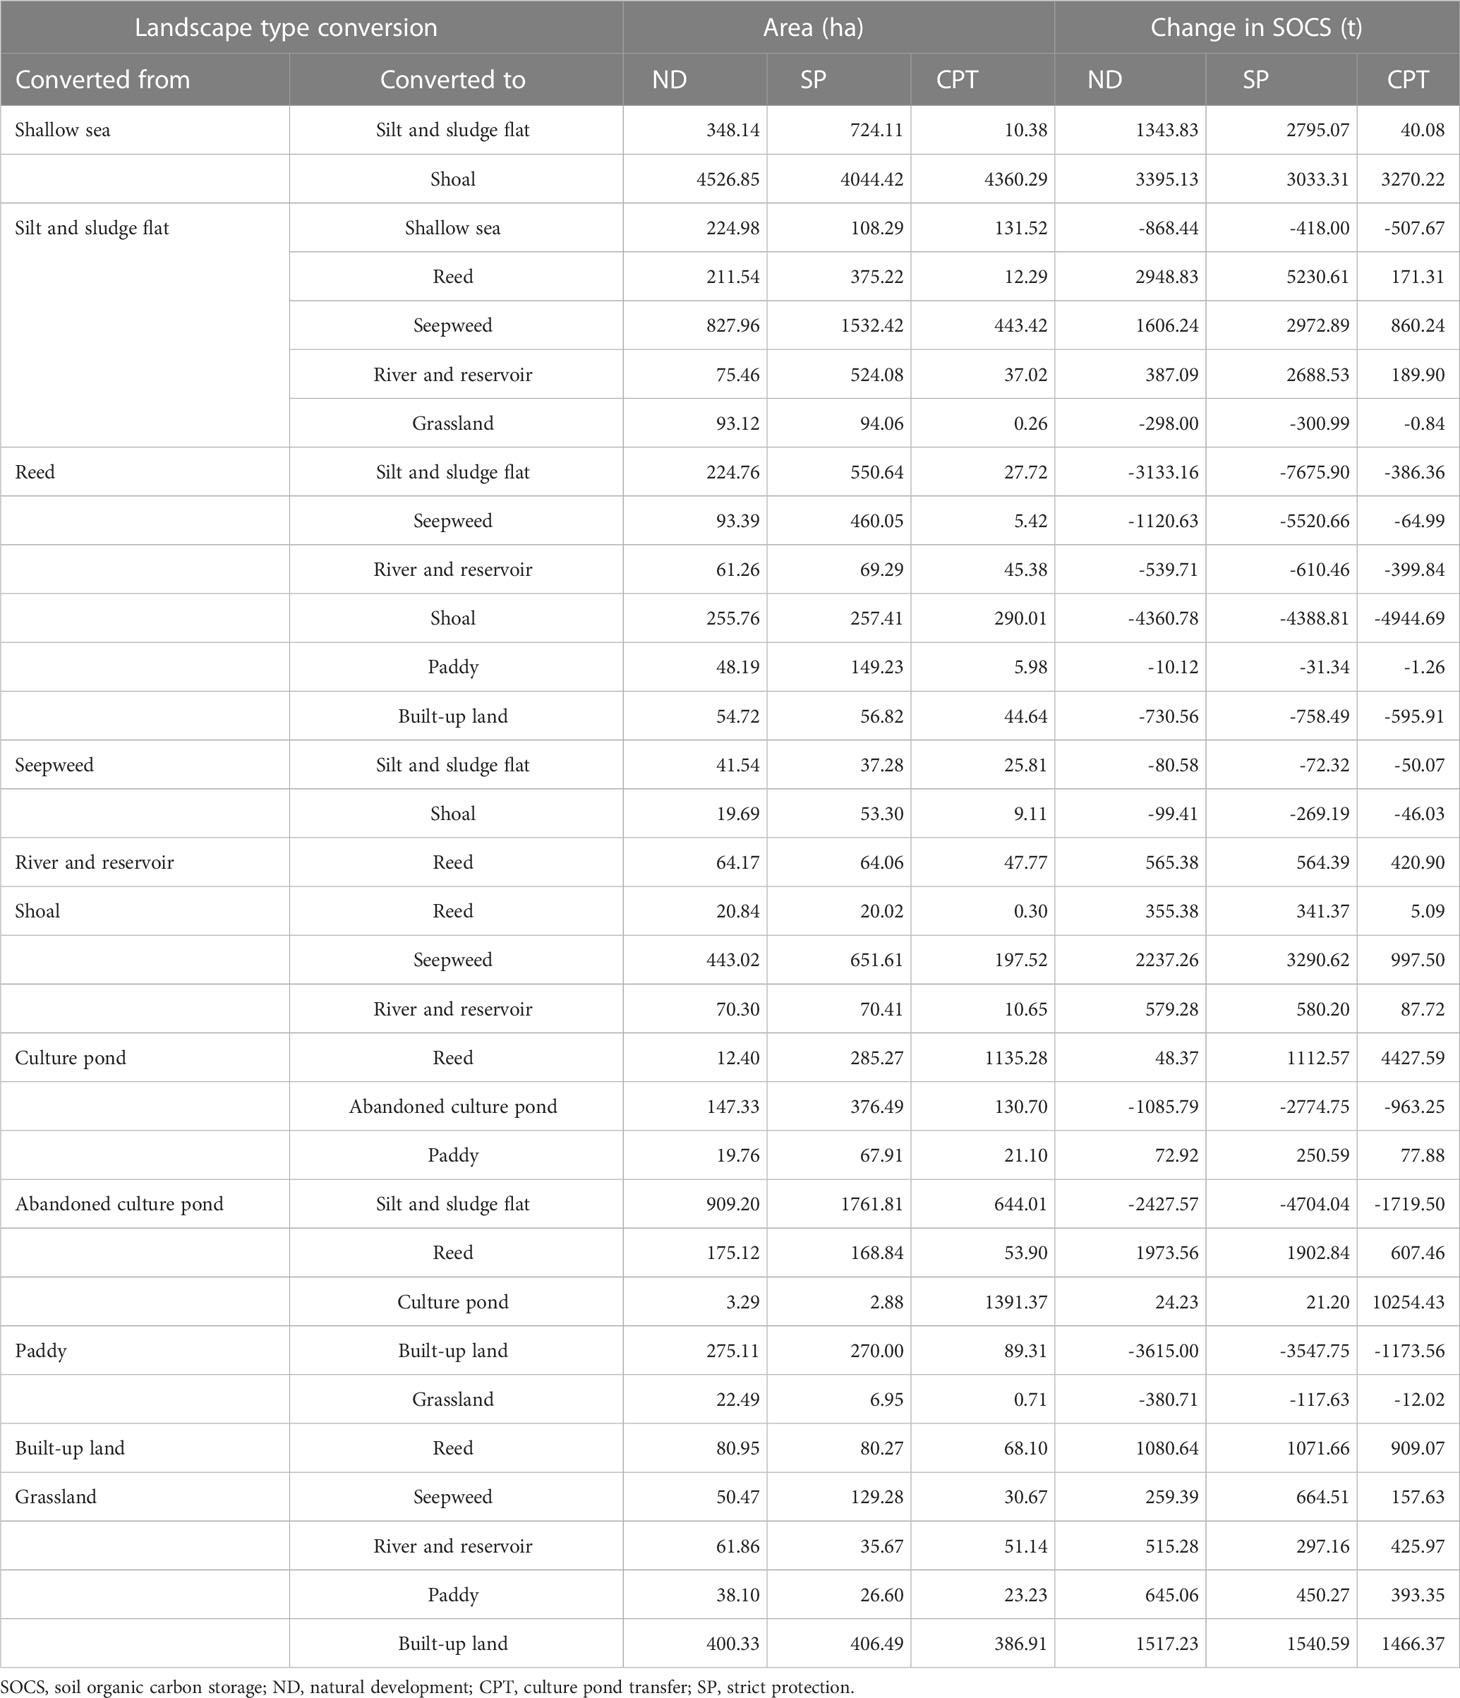
Table 3 Areas of change in landscape and soil organic carbon storage (SOCS) under different scenarios.
Under the ND scenario, 45.27 km2 of shallow sea will transform into sandbars, 9.09 km2 of abandoned ponds will become tidal flats, and 8.28 km2 of tidal flats and 4.43 km2 of sandbars will transform into seepweeds. Under the SP scenario, 40.44 km2 of shallow sea will transform into sandbars, 17.62 km2 of abandoned culture ponds will become tidal flats, and 15.23 km2 of tidal flats and 6.52 km2 of shoals become seepweeds.
In contrast to the ND and SP scenario trends, the reed area will increase by 7.36 km2 and the pond extent by 3.08 km2 in the CPT scenario (Figure 3E). The seepweeds area will increase by 6.64 km2, and the abandoned pond will decrease by 19.58 km2. An extent of 43.60 km2 of shallow sea will transform into sandbar, 6.44 km2 and 13.91 km2 of abandoned breeding ponds into tidal flats and breeding ponds, 11.35 km2 of breeding ponds into reeds, and 4.43 km2 of silt flats into seepweeds.
The carbon stock of the surface soil in the LREW was 2,108.03 ×103 t in 2021 (Figure 4B). The SOCS of reeds was the highest at 828.83×10³ t. The SOCS of the shallow sea was the second highest at 507.04×10³ t. Compared with 2015, the total SOCS decreased by 9.35×10³ t. The SOCS of culture ponds and shallow sea decreased by 78.44×10³ t and 62.44×10³ t, respectively. The SOCS of silt and sludge flats increased by 74.99×10³ t (Figure 5A). The process of turning breeding ponds into abandoned culture ponds or tidal flats reduces approximately 34.1 × 10³ t SOCS during 2015-2021.
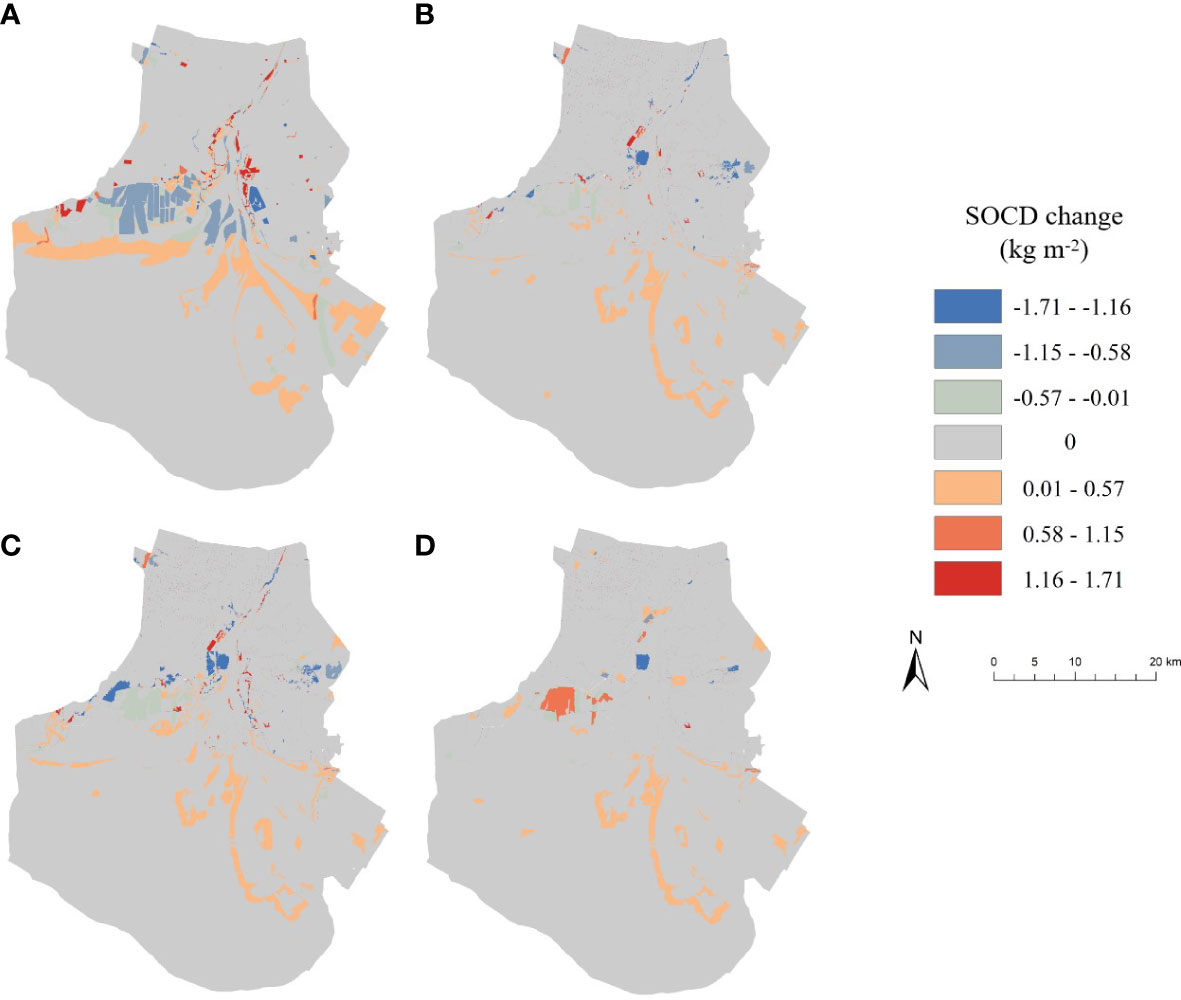
Figure 5 Changes in soil organic carbon density (SOCD) comparing (A)2015 with 2021, (B) 2021 with 2030 under ND scenarios, (C) 2021 with 2030 under SP scenarios, and (D) 2021 with 2030 under CPT scenarios.
By 2030, the surface soil carbon stock in the ND scenario will be 2,108.53×103 t, an increase of 0.51×10³ t from 2021 (Figure 5B). The extent of the storage increase zone is 74.70 km2. The change from shallow sea into shoals and silt flats into reeds will increase SOCS by 3.40×10³ t and 2.95×10³ t, respectively. The storage reduction zone is 25.53 km2. The change of reeds into shoals and silt flats will decrease SOC by 7.49×10³ t, and the change of agricultural land into built-up land will decrease SOC by 3.62×10³ t.
The surface SOCS under the SP scenario will be 2,105.25×103 t, which is 2.77×10³ t less than that in 2021 (Figure 5C). The area of the stock increase zone will be 92.44 km2. The change in silt and sludge flats to reeds and seepweeds will increase SOCS by 8.20×10³ t. The transformation of sandbar to seepweeds will increase SOCS by 3.29×10³ t. The combined extent of the SOCS decrease areas will be 44.57 km2. The area of the stock reduction zone will be 44.57 km2. If reeds become silt flats, seepweeds, and shoal SOCS will decrease by 17.59×10³ t. If abandoned ponds become tidal flats, SOCS will be reduced by 4.70×10³ t. Some breeding ponds will be abandoned, reducing SOCS by 2.77×10³ t.
The surface soil carbon stock under the CPT scenario will be 2,121.18×103 t, an increase of 13.15×10³ t from 2021 (Figure 5D). The area of the SOCS increase zone is 82.80 km2. The change of abandoned ponds to culture ponds and the culture ponds to reeds will increase SOC by 10.25×10³ t and 4.42×10³ t, respectively. The extent of the SOCS decrease region is 14.84 km2. The change from reed to sandbar will decrease SOCS by 4.95×10³ t.
According to Luo et al. (2015), in the LREW, the surface SOCS in vegetated areas accounted for ~ 70% of the overall SOCS, with 30% being held in areas without vegetation cover. Therefore, the SOCS of the coastal wetland is ~ 5,015.10×103 t, and the average SOCD is ~ 2.77 kg m-2. This value is lower than that of many salt marshes, such as Louisiana and the northern Gulf of Mexico (Dodla et al., 2008; Hansen & Nestlerode, 2014). However, this does not imply that the carbon sink capacity of the LREW is weak. In contrast, the LREW has an organic carbon accumulation rate of 388 g cm-2 yr, with a high carbon sequestration potential (Ye et al., 2015). The main reason for the low SOCS is perhaps the nascent coastal wetlands of the LREW and the annual harvesting of crops on the agricultural land and reeds in the area, which significantly reduces the soil carbon source income (Brix et al., 2014; Cui et al., 2022). In addition, except for reed wetlands, which have good carbon sequestration capacity, the SOCD of farmland is high. This is because most of the agricultural fields in the region are paddy fields. Flooded soils provide favorable conditions for carbon sequestration (Wan et al., 2018; Liu et al., 2021a).
Many studies have assessed the impact of land-use cover change on carbon stocks (Arrouays et al., 2001; Lozano-García et al., 2017; Padbhushan et al., 2022). However, the error in estimating carbon stocks based on land-use type alone is large. Surface soil carbon stocks are more closely related to vegetation type. For example, reeds and seepweeds under the same land-use type fall under swamps; however, their soil carbon stocks differ by nearly double. The results of this study, which used a landscape classification approach to estimate carbon stocks, may be more accurate, which in turn may provide support for the statistics on carbon sink capacity.
Anthropogenic activities were the main drivers of landscape change in the LREW from 1995–2015. Most areas have been under development because of the establishment of economic development zones. Reed wetlands have been transformed into paddy fields and tidal flats into aquaculture ponds (Zhao et al., 2017; Liu et al., 2020). Our study shows that development of the LREW ceased from 2015–2021. The promotion of ecological restoration projects has led to a continuous reduction in the extent of aquaculture ponds on the tidal flats on the west bank of the Liaohe River. The culture ponds gradually transformed into tidal flats after abandonment. Subsequently, seepweeds grew in some of the restoration areas. Due to the port construction works on the east side of the LREW, grassland was transformed into built-up land. Siltation in the LREW is evident, indicating that the shallow sea became estuarine sandbars and silt flats. The extent of reeds has increased slightly because of the establishment of a national protection zone.
The removal of breeding ponds would restore natural plant cover, reduce pollution, and increase bird habitats and foraging sites (Yuan et al., 2022). However, this study showed that the restoration of soil carbon stocks might be less effective in the short term. The ecological restoration project has transformed the west coast culture ponds into abandoned culture ponds and tidal flats, reducing soil carbon storage. The abandonment of culture ponds will reduce about 7 t SOCS per hectare and the conversion to tidal flats will reduce 10 t SOCS. The ecological restoration method of removing ponds reduces 34.1×10³ t SOCS in the LREW area until 2021.
It should be noted that the main sources of soil carbon stocks are the decay and deposition of plants. Soil carbon stocks in newly formed landscapes often take some time to reach a steady state (Chen et al., 2016; Peter, 2017). In addition, especially in decommissioned areas, soil carbon stocks recover more slowly after vegetation growth. The estimation of future soil carbon stock in this study does not consider this long-term change, which may lead to some errors.
The main driver of landscape change in the ND and SP scenarios up to 2030 is the interaction of anthropogenic and natural factors. The LREW will continue to silt up, existing sandbars will develop, and new sandbars will appear. The formation of sandbars and breeding ponds that become tidal flats provides a basis for the growth of alkali ponies. Strict protection has increased the rate of conversion of breeding ponds to tidal flats and seepweeds. The development of the east bank of the LREW has resulted in the transformation of more grassland into built-up land.
The impact of climate change on the LREW is expected to increase in the future. Many coastal wetlands are affected by sea level rise (SLR) (Moomaw et al., 2018; Sklar et al., 2021). The sea level in the Bohai Sea, where the LREW is located, is predicted to rise by 0.7 m in the 21st century (Chen et al., 2021). Our prediction shows that the shallow sea of the LREW will not expand substantially until 2030. This may be because of the siltation and accumulation of sediment by wetland vegetation, which raises the foundation. Thus, the LREW is resistant to SLR (Liu et al., 2021b; Buchanan et al., 2022). However, seawater intrusion due to SLR may transform the reeds into seepweeds and even mudflats (Yu et al., 2019). By 2100, SLR will transform most of the mudflats in the study area into shallow sea, and the salt marsh wetlands will retreat and degrade to some extent (Zhi et al., 2022).
In the long term, tidal flats formed by the retreat will provide space for the growth of plants with high carbon storage capacity. Even without human involvement in cultivation, future growth of seepweeds is expected in the areas where culture ponds have been removed. By 2030, approximately 880ha of tidal flats will grow seepweeds under the ND scenario. This is similar to the results of the analysis by Cao et al. (2022) of a suitable zone for seepweeds growth in this region. Vegetation growth provides additional carbon input to the soil and improves its physicochemical conditions. However, the growth of seepweeds only adds about 2 t of SOCS per hectare. Furthermore, the SOC content of restored wetlands is often lower than that of natural wetlands, and it may take decades to reach the same level (Wang et al., 2021a).
A single means of ecological restoration (e.g., culture pond removal for LREW) typically has a lower effect than a combination of multiple approaches (Luke et al., 2017). The LREW is still in the process of restoration. Although ecological restoration currently contributes little to carbon storage function, future effects need to be supported by monitoring data (Li et al., 2022a). The formation of resilient ecosystems is the most successful sign of ecological restoration (Billah et al., 2022).
In the absence of human intervention, the conversion of culture ponds to natural wetlands is a long process and the recovery of the carbon storage function is slower. The transfer of culture ponds will increase the surface soil carbon storage by ~ 12 ×103 t, which is much higher than that in the ND and SP scenarios. In addition, the degree of landscape fragmentation will be significantly reduced. Aquaculture ponds usually pollute and destroy wildlife habitats (Macecek & Grabas, 2011; Gao et al., 2019). However, their direct removal can result in economic losses and a reduction in carbon storage capacity. Appropriate farmland and culture ponds can improve the carbon sink function of coastal wetlands. The method of transforming farming ponds might achieve harmony between humans and nature in coastal wetlands. Reducing pesticide and fertilizer use is also an effective way to achieve sustainable development.
In addition, the predicted results show that degradation is evident in the reed areas near the shoreline owing to SLR. The regression of reeds into mudflats or seepweeds will reduce the soil carbon storage function and release sequestered carbon. To cope with SLR, measures such as mudflat conservation and reserving coastal space for development buffer zones should be taken to safeguard the carbon storage and other ecosystem service values of coastal wetlands. Otherwise, SLR will result in a loss of 110×103 t of carbon storage by 2100 (Zhi et al., 2022).
An important assumption and limitation of this study is that soil carbon accumulation for each landscape type will not change over the next 10 years (Yue et al., 2012; Zhao et al., 2017). We believe that more accurate SOC estimates will improve the ability to develop wetland management strategies in the future. To provide more information on coastal wetlands to address global warming, future research should be conducted in the following areas:1) deep soil sampling and surface plant sampling might be conducted for the ecologically restored areas in the future. Conduct a more comprehensive and accurate analysis of the impact of the carbon storage function brought about by the project started in 2015.; 2) long-term monitoring of wetlands after project implementation to determine more precise change trends in landscape and soils to facilitate the development of adapted ecological restoration strategies; and 3) the feasibility of wetland management strategies for culture pond transfer from an economic perspective; that is, whether the amount of capital investment required for the initiative matches the economic value generated.
In this study, soil carbon sequestration capacity was linked to the PLUS model. Based on the delineation of the landscape pattern of coastal wetlands in the LREW from 2015–2021 and the assessment of soil carbon storage, we predicted the carbon storage in 2030 under various scenarios and reached the following conclusions:
1) The LREW landscape in 2021 was dominated by shallow marine waters with reeds. The surface SOCS was 2108.03 ×103 t. The SOCD of vegetated landscapes was larger than that of unvegetated landscapes. SOCD gradually decreased from land to sea.
2) The landscape of coastal wetlands in the LREW changed significantly from 2015–2021. The areas of tidal flats, shoals, abandoned culture ponds, and built-up land increased. The areas of shallow sea, rivers and reservoirs, breeding ponds, and grasslands decreased. The surface SOCS was reduced by 9.35t×103 t, and 34.1×10³ t SOCS was reduced due to the ecological restoration project over this period.
3) By 2030, the area of shallow sea, reeds, culture ponds, abandoned culture ponds and grasslands will decrease under the ND and SP scenarios. However, the decrease in the area of reeds, ponds, and abandoned ponds is higher in the SP scenario. The extent of shoal, seepweeds, and built-up land will increase. The extent of reeds and culture ponds will increase in the CPT scenario. The increase in the extent of seepweeds and the decrease in that of abandoned culture ponds are smaller than in the other two scenarios. The change trend of the remaining landscape will be similar.
4) The carbon sequestration of the LREW can be better achieved by the transformation of aquaculture ponds. The carbon stock of surface soil in 2030 under the CPT scenario will be 12.52×10³ t higher than that in 2021. It is much higher, at 0.57×10³ t under the ND scenario and –2.72×10³ t under the SP scenario.
In conclusion, future wetland management strategies can be informed by more accurate SOC estimates. Further research should be conducted to provide more information on coastal wetlands with the aim of addressing global warming.
The original contributions presented in the study are included in the article/supplementary material. Further inquiries can be directed to the corresponding author.
In this manuscript, GW, JP, and JY conceived the study, GW was responsible for writing, WY and JY are charged with reviewing and editing. GW, JP, JY, and WY performed data processing and statistical analyses. DG and JD contributed a lot to processing the observed data. All authors contributed to the article and approved the submitted version.
This research was funded by the National Key Research and Development Program (Grant No. 2018YFC040800101), Special Project on Basic Resources Investigation (Grant No. 2018FY100102) and Special Project of Ministry of Natural Resources (Grant No. SY122210032).
The authors declare that the research was conducted in the absence of any commercial or financial relationships that could be construed as a potential conflict of interest.
All claims expressed in this article are solely those of the authors and do not necessarily represent those of their affiliated organizations, or those of the publisher, the editors and the reviewers. Any product that may be evaluated in this article, or claim that may be made by its manufacturer, is not guaranteed or endorsed by the publisher.
Aitali R., Snoussi M., Kolker A. S., Oujidi B., Mhammdi N. (2022). Effects of land Use/Land cover changes on carbon storage in north African coastal wetlands. J. Mar. Sci. Eng. 10 (3), 364. doi: 10.3390/jmse10030364
Arrouays D., Deslais W., Badeau V. (2001). The carbon content of topsoil and its geographical distribution in France. Soil Use Manage. 17 (1), 7–11. doi: 10.1111/j.1475-2743.2001.tb00002.x
Billah M. M., Bhuiyan M. K. A., Islam M. A., Das J., Hoque A. R. (2022). Salt marsh restoration: an overview of techniques and success indicators. Environ. Sci. Pollut. Res., 29 (11), 15347–15363. doi: 10.1007/s11356-021-18305-5
Bonan G. B. (2008). Forests and climate change: forcings, feedbacks, and the climate benefits of forests. Science 320 (5882), 1444–1449. doi: 10.1126/science.1155121
Braswell A. E., Heffernan J. B. (2019). Coastal wetland distributions: Delineating domains of macroscale drivers and local feedbacks. Ecosystems 22 (6), 1256–1270. doi: 10.1007/s10021-018-0332-3
Bridgham S. D., Megonigal J. P., Keller J. K., Bliss N. B., Trettin C. (2006). The carbon balance of north American wetlands. Wetlands 26 (4), 889–916. doi: 10.1672/0277-5212(2006)26[889:TCBONA]2.0.CO;2
Brix H., Ye S., Laws E. A., Sun D., Li G., Ding X., et al. (2014). Large-Scale management of common reed, phragmites australis, for paper production: A case study from the liaohe delta, China. Ecol. Eng. 73, 760–769. doi: 10.1016/j.ecoleng.2014.09.099
Buchanan M. K., Kulp S., Strauss B. (2022). Resilience of US coastal wetlands to accelerating sea level rise. Environ. Res. Commun. 4 (6), 061001.
Cao C., Su F., Song F., Yan H., Pang Q. (2022). Distribution and disturbance dynamics of habitats suitable for Suaeda salsa. Ecol. Indic. 140, 108984. doi: 10.1016/j.ecolind.2022.108984
Chen L. F., He Z. B., Zhu X., Du J., Yang J. J., Li J. (2016). Impacts of afforestation on plant diversity, soil properties, and soil organic carbon storage in a semi-arid grassland of northwestern China. Catena 147, 300–307. doi: 10.1016/j.catena.2016.07.009
Chen C., Wang G., Yan Y., Luo F. (2021). Projected sea level rise on the continental shelves of the China seas and the dominance of mass contribution. Environ. Res. Lett. 16 (6), 064040. doi: 10.1088/1748-9326/abfdea
Cui Q., Yang H., Wang G., Ma J., Feng L., Jingtao L. (2022). Response of soil carbon fractions and enzyme activities to mowing management on in a coastal wetland of the yellow river delta. Front. Mar. Sci. 1533. doi: 10.3389/fmars.2022.993181
Dodla S. K., Wang J. J., DeLaune R. D., Cook R. L. (2008). Denitrification potential and its relation to organic carbon quality in three coastal wetland soils. Sci. total Environ. 407 (1), 471–480. doi: 10.1016/j.scitotenv.2008.08.022
Earth System Research Laboratories (2022) NOAA. Available at: https://www.esrl.noaa.gov/e-coli (Accessed July 15, 2022).
Gao D., Liu M., Hou L., Derrick Y. L., Wang W., Li X., et al. (2019). Effects of shrimp-aquaculture reclamation on sediment nitrate dissimilatory reduction processes in a coastal wetland of southeastern China. Environ. pollut. 255, 113219. doi: 10.1016/j.envpol.2019.113219
Hansen V. D., Nestlerode J. A. (2014). Carbon sequestration in wetland soils of the northern gulf of Mexico coastal region. Wetlands Ecol. Manage. 22 (3), 289–303. doi: 10.1007/s11273-013-9330-6
Horsburgh N., Tyler A., Mathieson S., Wackernagel M., Lin D. (2022). Biocapacity and cost-effectiveness benefits of increased peatland restoration in Scotland. J. Environ. Manage. 306, 114486. doi: 10.1016/j.jenvman.2022.114486
Hussenot J. M. (2003). Emerging effluent management strategies in marine fish-culture farms located in European coastal wetlands. Aquaculture 226 (1-4), 113–128. doi: 10.1016/S0044-8486(03)00472-1
Ji H., Han J., Xue J., Hatten J. A., Wang M., Guo Y., et al. (2020). Soil organic carbon pool and chemical composition under different types of land use in wetland: Implication for carbon sequestration in wetlands. Sci. Total Environ. 716, 136996. doi: 10.1016/j.scitotenv.2020.136996
Kodaira H. (2014). Responding to climate change and expectations for research. Paddy Water Environ. 12 (2), 211–212. doi: 10.1007/s10333-014-0421-7
Li X., Jongman R. H., Hu Y., Bu R., Harms B., Bregt A. K., et al. (2005). Relationship between landscape structure metrics and wetland nutrient retention function: A case study of liaohe delta, China. Ecol. Indic. 5 (4), 339–349. doi: 10.1016/j.ecolind.2005.03.007
Li S., Xie T., Bai J., Cui B. (2022a). Degradation and ecological restoration of estuarine wetlands in China. Wetlands 42 (7), 1–10. doi: 10.1007/s13157-022-01589-9
Li S., Xie T., Pennings S. C., Wang Y., Craft C., Hu M. (2019). A comparison of coastal habitat restoration projects in China and the united states. Sci. Rep. 9 (1), 1–10. doi: 10.1038/s41598-019-50930-6
Li J., Yan D., Yao X., Liu Y., Xie S., Sheng Y., et al. (2022b). Dynamics of carbon storage in saltmarshes accross china’s Eastern coastal wetlands from 1987 to 2020. Front. Mar. Sci. 885. doi: 10.3389/fmars.2022.915727
Liang X., Guan Q., Clarke K. C., Liu S., Wang B., Yao Y. (2021). Understanding the drivers of sustainable land expansion using a patch-generating land use simulation (PLUS) model: A case study in wuhan, China. Comput. Environ. Urban Syst. 85, 101569. doi: 10.1016/j.compenvurbsys.2020.101569
Liu D., Chen J., Ouyang Z. (2020). Responses of landscape structure to the ecological restoration programs in the farming-pastoral ecotone of northern China. Sci. Total Environ. 710, 136311. doi: 10.1016/j.scitotenv.2019.136311
Liu Z., Fagherazzi S., Cui B. (2021b). Success of coastal wetlands restoration is driven by sediment availability. Commun. Earth Environ. 2 (1), 1–9. doi: 10.1038/s43247-021-00117-7
Liu Y., Ge T., van Groenigen K. J., Yang Y., Wang P., Cheng K., et al. (2021a). Rice paddy soils are a quantitatively important carbon store according to a global synthesis. Commun. Earth Environ. 2 (1), 1–9. doi: 10.1038/s43247-021-00229-0
Liu X., Xu H., Wang X., Wu Z., Bao X. (2014). An ecological engineering pond aquaculture recirculating system for effluent purification and water quality control. CLEAN–Soil Air Water 42 (3), 221–228. doi: 10.1002/clen.201200567
Lozano-García B., Muñoz-Rojas M., Parras-Alcántara L. (2017). Climate and land use changes effects on soil organic carbon stocks in a Mediterranean semi-natural area. Sci. Total Environ. 579, 1249–1259. doi: 10.1016/j.scitotenv.2016.11.111
Luke H., Martens M. A., Moon E. M., Smith D., Ward N. J., Bush R. T. (2017). Ecological restoration of a severely degraded coastal acid sulfate soil: A case study of the East trinity wetland, Queensland. Ecol. Manage. Restor. 18 (2), 103–114. doi: 10.1111/emr.12264
Luo X., Jia H., Yang J., Wang Z. (2015). A comparison of soil organic carbon pools in two typical estuary reed wetlands in northern China. Periodical Ocean Univ. China 45 (3), 99–106. doi: 10.16441/j.cnki.hdxb.20140116
Macecek D., Grabas G. P. (2011). Applying a regional coastal wetland monitoring framework to refine and report on wildlife and habitat delisting criteria in the bay of quinte area of concern. Aquat. Ecosyst. Health Manage. 14 (1), 94–103. doi: 10.1080/14634988.2011.549439
Mcleod E., Chmura G. L., Bouillon S., Salm R., Björk M., Duarte C. M., et al. (2011). A blueprint for blue carbon: toward an improved understanding of the role of vegetated coastal habitats in sequestering CO2. Front. Ecol. Environ. 9 (10), 552–560. doi: 10.1890/110004
Meng W., Feagin R. A., Hu B., He M., Li H. (2019). The spatial distribution of blue carbon in the coastal wetlands of China. Estuar. Coast. Shelf Sci. 222, 13–20. doi: 10.1016/j.ecss.2019.03.010
Mitsch W. J., Bernal B., Nahlik A. M., Mander Ü., Zhang L., Anderson C. J., et al. (2013). Wetlands, carbon, and climate change. Landscape Ecol. 28 (4), 583–597. doi: 10.1007/s10980-012-9758-8
Moomaw W. R., Chmura G. L., Davies G. T., Finlayson C. M., Middleton B. A., Natali S. M., et al. (2018). Wetlands in a changing climate: science, policy and management. Wetlands 38 (2), 183–205. doi: 10.1007/s13157-018-1023-8
Padbhushan R., Kumar U., Sharma S., Rana D. S., Kumar R., Kohli A., et al. (2022). Impact of land-use changes on soil properties and carbon pools in India: A meta-analysis. Front. Environ. Sci. 722. doi: 10.3389/fenvs.2021.794866
Peter P. C. (2017). Soil organic Matter/Carbon dynamics in contrasting tillage and land management systems: A case for smallholder farmers with degraded and marginal soils. Commun. Soil Sci. Plant Anal. 48 (17), 2013–2031. doi: 10.1080/00103624.2017.1406099
Phang V. X., Chou L. M., Friess D. A. (2015). Ecosystem carbon stocks across a tropical intertidal habitat mosaic of mangrove forest, seagrass meadow, mudflat and sandbar. Earth Surface Processes Landforms 40 (10), 1387–1400. doi: 10.1002/esp.3745
Ramsar Sites Information Service (2022) Ramsar. Available at: https://rsis.ramsar.org/ris/1441 (Accessed September 16, 2022).
Rivera-Monroy V. H., Elliton C., Narra S., Meselhe E., Zhao X., White E., et al. (2019). Wetland biomass and productivity in coastal Louisiana: base line data, (1976–2015) and knowledge gaps for the development of spatially explicit models for ecosystem restoration and rehabilitation initiatives. Water 11 (10), 2054. doi: 10.3390/w11102054
Sasmito S. D., Taillardat P., Clendenning J. N., Cameron C., Friess D. A., Murdiyarso D., et al. (2019). Effect of land-use and land-cover change on mangrove blue carbon: A systematic review. Global Change Biol. 25 (12), 4291–4302. doi: 10.1111/gcb.14774
Sklar F. H., Carlson C., Coronado-Molina C., Maran A. C. (2021). Coastal ecosystem vulnerability and sea level rise (SLR) in south Florida: a mangrove transition projection. Front. Ecol. Evol. 278. doi: 10.3389/fevo.2021.646083
Wan S., Mou X., Liu X. (2018). Effects of reclamation on soil carbon and nitrogen in coastal wetlands of liaohe river delta, China. Chin. Geogr. Sci. 28 (3), 443–455. doi: 10.1007/s11769-018-0961-7
Wang C., Li H., Cai T., Sun X. (2021a). Variation of soil carbon and nitrogen storage in a natural restoration chronosequence of reclaimed temperate marshes. Global Ecol. Conserv. 27, e01589. doi: 10.1016/j.gecco.2021.e01589
Wang N., Li J. M., Xu Z. H. (2021b). Public preference for the ecological restoration of coastal wetlands in jiaozhou bay in China based on a choice experiment. Mar. Policy 128, 104487. doi: 10.1016/j.marpol.2021.104487
Wang F., Sanders C. J., Santos I. R., Tang J., Schuerch M., Kirwan M. L., et al. (2021c). Global blue carbon accumulation in tidal wetlands increases with climate change. Natl. Sci. Rev. 8 (9), nwaa296. doi: 10.1093/nsr/nwaa296
Wang H., Steyer G. D., Couvillion B. R., Rybczyk J. M., Beck H. J., Sleavin W. J., et al. (2014). Forecasting landscape effects of Mississippi river diversions on elevation and accretion in Louisiana deltaic wetlands under future environmental uncertainty scenarios. Estuar. Coast. Shelf Sci. 138, 57–68. doi: 10.1016/j.ecss.2013.12.020
Wang X. G., Zhu B., Hua K. K., Luo Y., Zhang J., Zhang A. B. (2013). Assessment of soil organic carbon stock in the upper Yangtze river basin. J. Mountain Sci. 10 (5), 866–872. doi: 10.1007/s11629-012-2195-y
Xia H., Kong W., Zhou G., Sun O. J. (2021). Impacts of landscape patterns on water-related ecosystem services under natural restoration in liaohe river reserve, China. Sci. Total Environ. 792, 148290. doi: 10.1016/j.scitotenv.2021.148290
Xia H., Liu L., Bai J., Kong W., Lin K., Guo F. (2020). Wetland ecosystem service dynamics in the yellow river estuary under natural and anthropogenic stress in the past 35 years. Wetlands 40 (6), 2741–2754. doi: 10.1007/s13157-020-01368-4
Ye S., Laws E. A., Yuknis N., Ding X., Yuan H., Zhao G., et al. (2015). Carbon sequestration and soil accretion in coastal wetland communities of the yellow river delta and liaohe delta, China. Estuar. Coasts 38 (6), 1885–1897. doi: 10.1007/s12237-014-9927-x
Yu M., Rivera-Ocasio E., Heartsill-Scalley T., Davila-Casanova D., Rios-López N., Gao Q. (2019). Landscape-level consequences of rising sea-level on coastal wetlands: saltwater intrusion drives displacement and mortality in the twenty-first century. Wetlands 39 (6), 1343–1355. doi: 10.1007/s13157-019-01138-x
Yuan L., Liu D., Tian B., Yuan X., Bo S., Ma Q., et al. (2022). A solution for restoration of critical wetlands and waterbird habitats in coastal deltaic systems. J. Environ. Manage. 302, 113996. doi: 10.1016/j.jenvman.2021.113996
Yue A., Ni J., Borthwick A. G., Miao C.. (2012). Diagnosis of river basins as CO2 sources or sinks subject to sediment movement. Earth Surf. Process. Landf. 37 13, 1398–1406. doi: 10.1002/esp.3254
Zhao G., Ye S., Li G., Yu X., Mcclellan S. A. (2017). Soil organic carbon storage changes in coastal wetlands of the liaohe delta, China, based on landscape patterns. Estuar. Coasts 40 (4), 967–976. doi: 10.1007/s12237-016-0194-x
Zhi L., Gou M., Li X., Bai J., Cui B., Zhang Q., et al. (2022). Effects of Sea level rise on land use and ecosystem services in the liaohe delta. Water 14 (6), 841. doi: 10.3390/w14060841
Keywords: soil carbon stocks, estuary wetland, Liaohe River, PLUS model, carbon sequestration, land use
Citation: Wang G, Pan J, Yu J, Yan W, Gu D and Du J (2023) Soil organic carbon storage in Liaohe River Estuary Wetlands under restoration and multiple management strategies, based on landscape patterns. Front. Mar. Sci. 10:1100208. doi: 10.3389/fmars.2023.1100208
Received: 16 November 2022; Accepted: 06 March 2023;
Published: 16 March 2023.
Edited by:
Roberto Danovaro, Marche Polytechnic University, ItalyReviewed by:
Xiaoyun Li, Shaanxi Normal University, ChinaCopyright © 2023 Wang, Pan, Yu, Yan, Gu and Du. This is an open-access article distributed under the terms of the Creative Commons Attribution License (CC BY). The use, distribution or reproduction in other forums is permitted, provided the original author(s) and the copyright owner(s) are credited and that the original publication in this journal is cited, in accordance with accepted academic practice. No use, distribution or reproduction is permitted which does not comply with these terms.
*Correspondence: Jing Yu, Ynk2ODAxQG91Yy5lZHUuY24=; Wenwen Yan, eWFud2Vud2VuQGZpby5vcmcuY24=
Disclaimer: All claims expressed in this article are solely those of the authors and do not necessarily represent those of their affiliated organizations, or those of the publisher, the editors and the reviewers. Any product that may be evaluated in this article or claim that may be made by its manufacturer is not guaranteed or endorsed by the publisher.
Research integrity at Frontiers
Learn more about the work of our research integrity team to safeguard the quality of each article we publish.