 Kui Zhang
 Jun Zhang
 Peng Zhang1,2
 Li Su
Li Su Yongsong Qiu
 Zuozhi Chen
- 1South China Sea Fisheries Research Institute, Chinese Academy of Fishery Sciences, Guangzhou, China
- 2Key Laboratory for Sustainable Utilization of Open-sea Fishery, Ministry of Agriculture and Rural Affairs, Guangzhou, China
Skipjack tuna (Katsuwonus pelamis) is a highly migratory species of significant value in global marine fisheries. The South China Sea (SCS) is the largest marginal sea in the northwestern Pacific Ocean, and many tuna and tuna-like species occur within it. Although a recent Western and Central Pacific Fisheries Commission report identified skipjack tuna in the western and central Pacific to be sustainably fished, the exploitation status of skipjack tuna in the SCS is still unclear, due to limited data. We apply two data-poor methods, length-based Bayesian biomass estimation (LBB) and length-based spawning potential ratio (LBSPR), to assess the status of skipjack tuna stock in the SCS. We use electronic length frequency analysis to estimate von Bertalanffy growth parameters (asymptotic length Linf and growth coefficient K) to serve as priors for LBB and LBSPR estimation. Estimates are calculated for SCS skipjack tuna Linf (68.3 cm), K (0.325 year−1), natural mortality (0.49 year−1) and mean fork length at 50% sexual maturity (36.7 cm). LBB analysis reveals the estimated relative stock size (0.29) indicates that the SCS skipjack tuna stock maybe heavily overfished. LBSPR analysis reveals the estimated spawning potential ratio for this fishery to be 3%, which is significantly below the limit reference point of 20%. Accordingly, for the SCS skipjack tuna stock we identify a need to reduce fishing mortality by controlling fishing effort and increasing catchable size.
Introduction
The highly migratory skipjack tuna (Katsuwonus pelamis) occurs widely throughout tropical, subtropical and temperate oceans. This species ranks third in catch tonnage (2.8 × 10⁶ t in 2020; FAO, 2022) in global marine fisheries (behind Anchoveta Engraulis ringens, and Alaska pollock Gadus chalcogrammus)—a position it has held for 11 consecutive years. The largest skipjack tuna fishery is in the Western and Central Pacific Ocean (WCPO), with catches contributing to 62% of global catch in 2020 (Hare et al., 2021). The Western and Central Pacific Fisheries Commission (WCPFC), responsible for managing tuna species, recently reported this fishery was in a sustainable condition in the whole WCPO (Hare et al., 2021). However, the spawning potential of skipjack tuna in region 5 (of the eight skipjack tuna stock assessment regions) (Figure 1) was considered to have decreased in recent years. A recent assessment report also stated the concern of the unquantified (and probably heavy) fishing pressure on juvenile skipjack tuna in this region (Prince et al., 2022). Limited data for region 5 meant that the exploitation status of skipjack tuna was unclear in some sea areas, such as the South China Sea (SCS). Although the SCS belongs to region 5 of the WCPO, there is no effective multilateral fisheries management mechanism while there are increasing fishing efforts from many surrounding countries. Despite its regional significance, knowledge of the SCS’s fisheries and stock status remains scarce, the initial assessments of commercial species appear to be particularly significant.
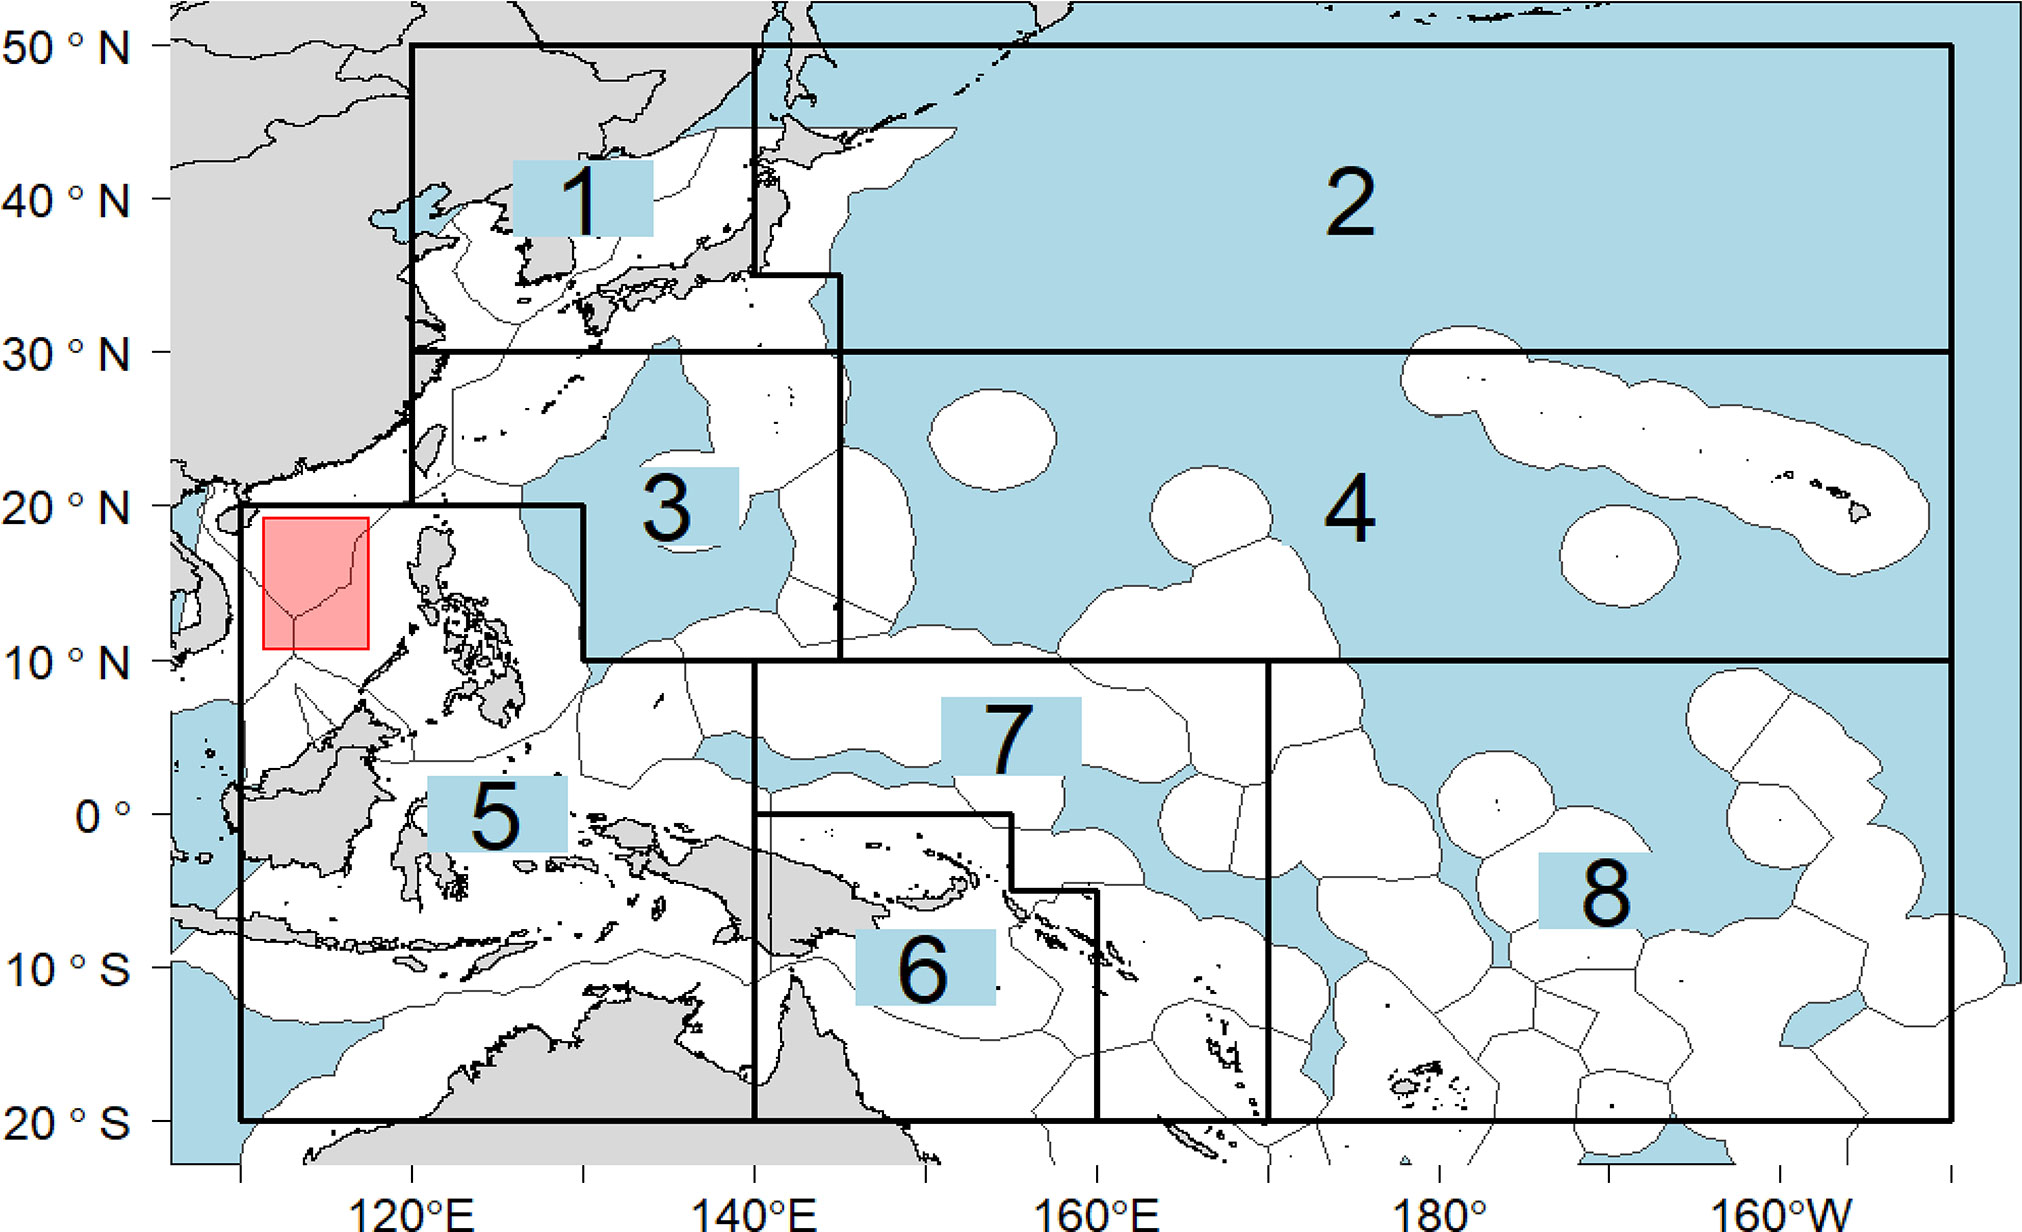
Figure 1 Eight (1–8) WCPO skipjack tuna stock assessment regions (sourced WCPFC, available online at https://www.wcpfc.int/doc/03/skipjack-tuna ). The red rectangle represents the South China Sea skipjack tuna sampling area.
Overfishing is one of the most intractable challenges facing marine ecosystems. The Food and Agricultural Organization of the United Nations (FAO) suggest that the percentage of fishery stocks exploited at unsustainable levels had increased from 10% to 35.4% since the 1970s (FAO, 2022). Stock assessment is becoming increasingly necessary to implement effective fishery management and sustainability. Nevertheless, only one fifth of the global landings comes from assessed species, and less than one eighth of the world’s fisheries are sufficiently well managed or have detailed stock assessments for management purposes (Costello et al., 2012; FAO, 2022; Kindong et al., 2022). The severity of this problem is increasingly recognized, and various types of data-poor stock assessment methods have been put forward over the past 20 years as part of a solution (Zhang et al., 2021a; Liao et al., 2022). Among these methods, length-based assessment models are widely used because length-frequency data are rather cost-effective and easy to collect (Quinn and Deriso, 1999; Hordyk et al., 2015; Hordyk et al., 2016; Mildenberger et al., 2017; Froese et al., 2018; Chong et al., 2020).
In this study, we apply length-based spawning potential ratio (LBSPR) and length-based Bayesian biomass estimation (LBB) models to assess the status of skipjack tuna stocks in the SCS. We calculate the prior information required for these models, asymptotic length (Linf) and growth coefficient (K), by electronic length frequency analysis (ELEFAN). Results are important for more informed and effective management of this fishery resource, and to ensure its sustainable exploitation in an otherwise data-poor environment.
Materials and methods
Data collection
Skipjack tuna in the SCS were mainly caught by the Philippines, Vietnam, China, Malaysia and Indonesia. The main fishing gears were purse seine, handline, light falling-net, troll, hook and line (Prince et al., 2022). Skipjack tuna in the SCS (Figure 1) were collected using a light falling-net (290-m circumference, 85-m stretched length, 22-mm cod-end mesh, and 52-mm net mouth mesh) in series of scientific surveys conducted by South China Sea Fisheries Research Institute, Chinese Academy of Fishery Sciences, from 2014–2019. The surveys covered four seasons. The light falling-net is a relatively new type of fishing gear which first appeared in the SCS in the early 1990s, and widely used in deep waters of the SCS in recent years. In this fishery, lamps function as fish-aggregating devices. Two rows of lamps (n = 230, 1 kw/lamp) are arranged along the sides of a vessel to attract fish (Zhang et al., 2021b). The main fishing targets are cephalopods, phototrophic species, and the pelagic fish species (e.g., skipjack tuna) which feed on them (Wang et al., 2021; Zhang et al., 2021b).
All species caught in the net during surveys were sampled, identified, and counted. Biological data for main commercial species, e.g., skipjack tuna, were collected. When fewer than 50 individuals were caught in a trap, all individuals were measured; otherwise, 50 individuals were randomly sampled for measurement. For each skipjack tuna, fork length (nearest mm) and body weight (nearest g) were measured. The maturity was macroscopically determined based on gonad development; specimens were attributed to one of six stages. We regard individuals with stage IV–VI gonads to be sexually mature, and those of stage I–III to be immature (Li et al., 2011).
Data analysis
The length–weight relationship is described by the power function:
where W is the body weight (g) of an individual fish, L represents its fork length (cm), a is a scaling coefficient, and b is an allometric growth parameter. The difference in length–weight relationship parameters between males and females was tested by one-way analysis of variance (ANOVA).
Length-frequency data were grouped into monthly catches, assuming that samples represented the monthly length distribution of the overall catch (Kindong et al., 2022). We used ELEFAN in the “TropFishR” package (Mildenberger et al., 2017) to estimate the asymptotic length (Linf) and growth coefficient (K) of skipjack tuna. Growth is described by the von Bertalanffy growth function:
where Lt represents mean length (cm) at age t, Linf is the asymptotic length, K is the growth coefficient, and t0 is the theoretical age when Lt = 0.
The parameter t0 was estimated using the empirical equation (Pauly, 1983):
The growth performance index (Φ) was eatimated from the following equation (Pauly and Munro, 1984):
Natural mortality (M) was estimated using six empirical methods:
where Amax is the maximum reported age (12) for skipjack tuna (Froese and Pauly, 2022), and T is the mean environmental temperature (°C), which we assume to be 27°C (Yu et al., 2019). We average the M1–M6 estimates to obtain a true value for skipjack tuna.
Mean fork length at 50% sexual maturity (L50) was calculated based on relationships between the arcsin square-root (ASR) transformative percentage Pi of mature individuals in each 20-mm fork length interval and the midpoint value of the standard-length interval (Xi), as per the following equation (Chen and Paloheimo, 1994):
where G is the maximum attainable proportion of mature fish (G = 1 in this study), δ is the instantaneous rate of maturation, and εi is the error. The mean fork length at 95% sexual maturity (L95) was estimated by 1.1 × L50 (Prince et al., 2015).
LBB method
LBB is a recently developed method used to assess the exploitation status of data-poor fisheries based on length-frequency data (for single or multiple years). It uses a Bayesian Monte Carlo Markov Chain (MCMC) to calculate mortality parameters and the relative stock size. The principle of LBB method is that the absolute values of biomass and age can be replaced by their relative values (Froese et al., 2018). LBB is appropriate to use for species that can grow continuously through their life (Pons et al., 2020). This method can estimate asymptotic length (Linf), length of 50% of individuals captured by a gear (Lc), relative natural mortality (M/K), fishing mortality relative to natural mortality (F/M), the exploited biomass relative to the unexploited biomass (B/B0), and the relative stock size (B/BMSY) for a target species (where MSY is the maximum sustainable yield). Although the LBB method only requires length-frequency data, the priors of M/K, Linf, and L50 can also be included to obtain more accurate results (Table 1). We use the priors of M/K, Linf, and L50 estimated using aforementioned approaches, including “TropFishR,” empirical formulas for M, and the ASR method.
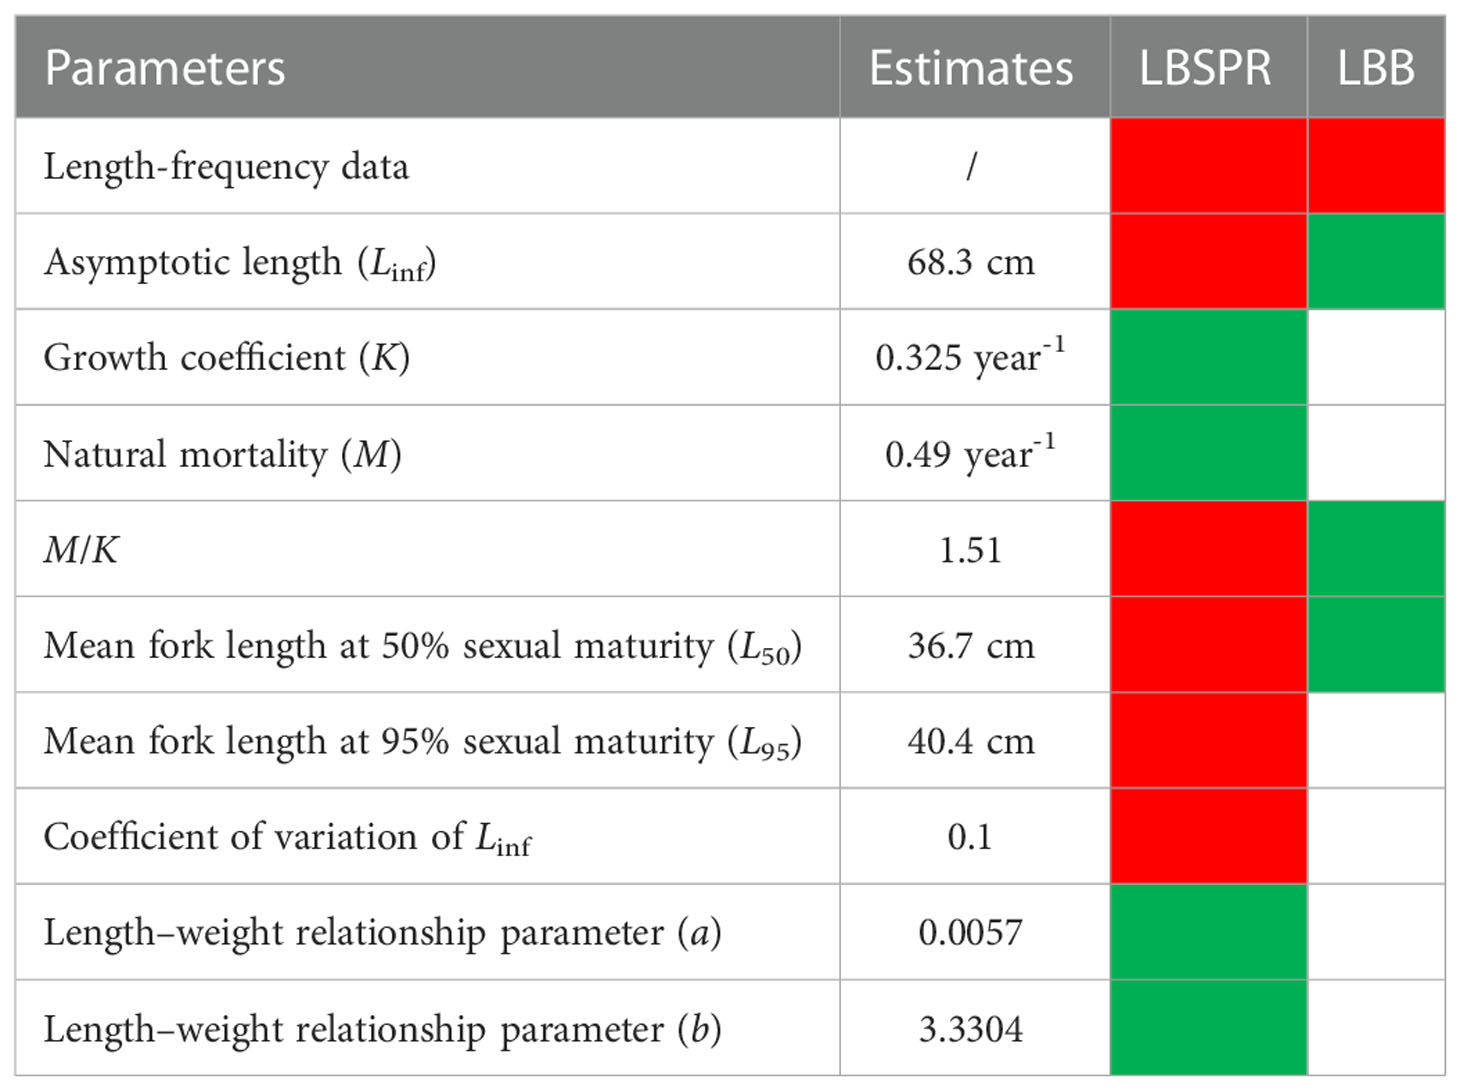
Table 1 Summary of data requirements for LBB and LBSPR methods (red boxes represent required data; green boxes represent optional data).
We determined the exploitation status of the skipjack tuna fishery based on estimates of B/BMSY. We regard a stock to be healthy if B/BMSY > 1; slightly overexploited where 0.8< B/BMSY ≤ 1; overfished where 0.8 ≤ B/BMSY ≤ 0.5; heavily overfished where 0.2< B/BMSY ≤ 0.5, and collapsed when B/BMSY ≤ 0.2 (Palomares et al., 2018). Stocks are also considered to suffer from ‘growth overfishing’ (when fish are harvested at an average size that is smaller than the size that would produce the maximum yield per recruit) if the estimated Lc/Lc_opt< 1 (Zhang et al., 2021a), where Lc_opt represents the length at first capture that maximizes the catch and biomass. More details of LBB method are presented in Froese et al. (2018). All LBB analyses were performed using an R code (LBB_33a. R), downloaded from http://oceanrep.geomar.de/44832/(access date: 5 September 2022) following user guidelines.
LBSPR method
The spawning potential ratio (SPR) is a well-known biological reference point that can be used to inform fisheries management decisions for data-limited fisheries (Hordyk et al., 2015). It can be interpreted as the proportion of the unfished spawning potential remaining under fishing pressure (Walters and Martell, 2004). We use the LBSPR method to estimate the SPR of skipjack tuna in the SCS. This method has been widely used in stock assessments for data-poor fisheries (Prince et al., 2015; Prince et al., 2020; Han et al., 2021; Alam et al., 2022); Kindong et al., 2022, and it has proven to be a consistent and accurate model (Chong et al., 2020; Pons et al., 2020). LBSPR assumes that SPR of an exploited fish stock is a function of relative fishing mortality (F/M) and two life-history ratios (M/K and L50/Linf). In addition to target species length-frequency data, other parameters needed in the estimation (Table 1) include the M/K ratio, Linf, variability of length-at-age (default value 10%), and L50 and L95 (Prince et al., 2015). We estimate these parameters using aforementioned approaches, including “TropFishR,” empirical formulas for M, and the ASR method. To analyze the uncertainty of nature mortality on LBSPR method, M1–M6 estimates were also used to run LBSPR and check the results.
In the LBSPR model, mean fork length at 50% and 95% selectivity (SL50 and SL95), and relative fishing mortality (F/M) are estimated using the maximum likelihood method. The LBSPR model applies maximum likelihood estimation to evaluate the selectivity ogive, which is expected to be a logistic curve described by the selection parameters (SL50 and SL95), and F/M, which are then utilized to estimate the SPR (Prince et al., 2015; Hordyk et al., 2016). Note that SPR estimates of 20% represent a limit reference point; SPR estimates< 20% suggest a level likely to reduce recruitment and a stock verging on collapse; and SPR estimates range 0.35–0.4 are generally associated with a stock at MSY levels (Hordyk et al., 2015; Prince et al., 2015; Kindong et al., 2022). All LBSPR analyses were performed using R code, available at https://cran.r-project.org/web/packages/LBSPR (access date: 11 September 2022).
Results
Parameter estimation
A total of 2033 skipjack tuna individuals of 8.3–52.9-cm fork length and 10–3250-g body weight were collected between 2014 and 2019. The length-frequency distribution was unimodal, with 58.1% of individuals ranging 21–30-cm fork length. There was no significant difference in parameters (a and b) in length–weight relationships (Figure 2) between males and females (F= 0.32, p > 0.05; F = 0.71, p > 0.05). Length–weight relationships are estimated as:
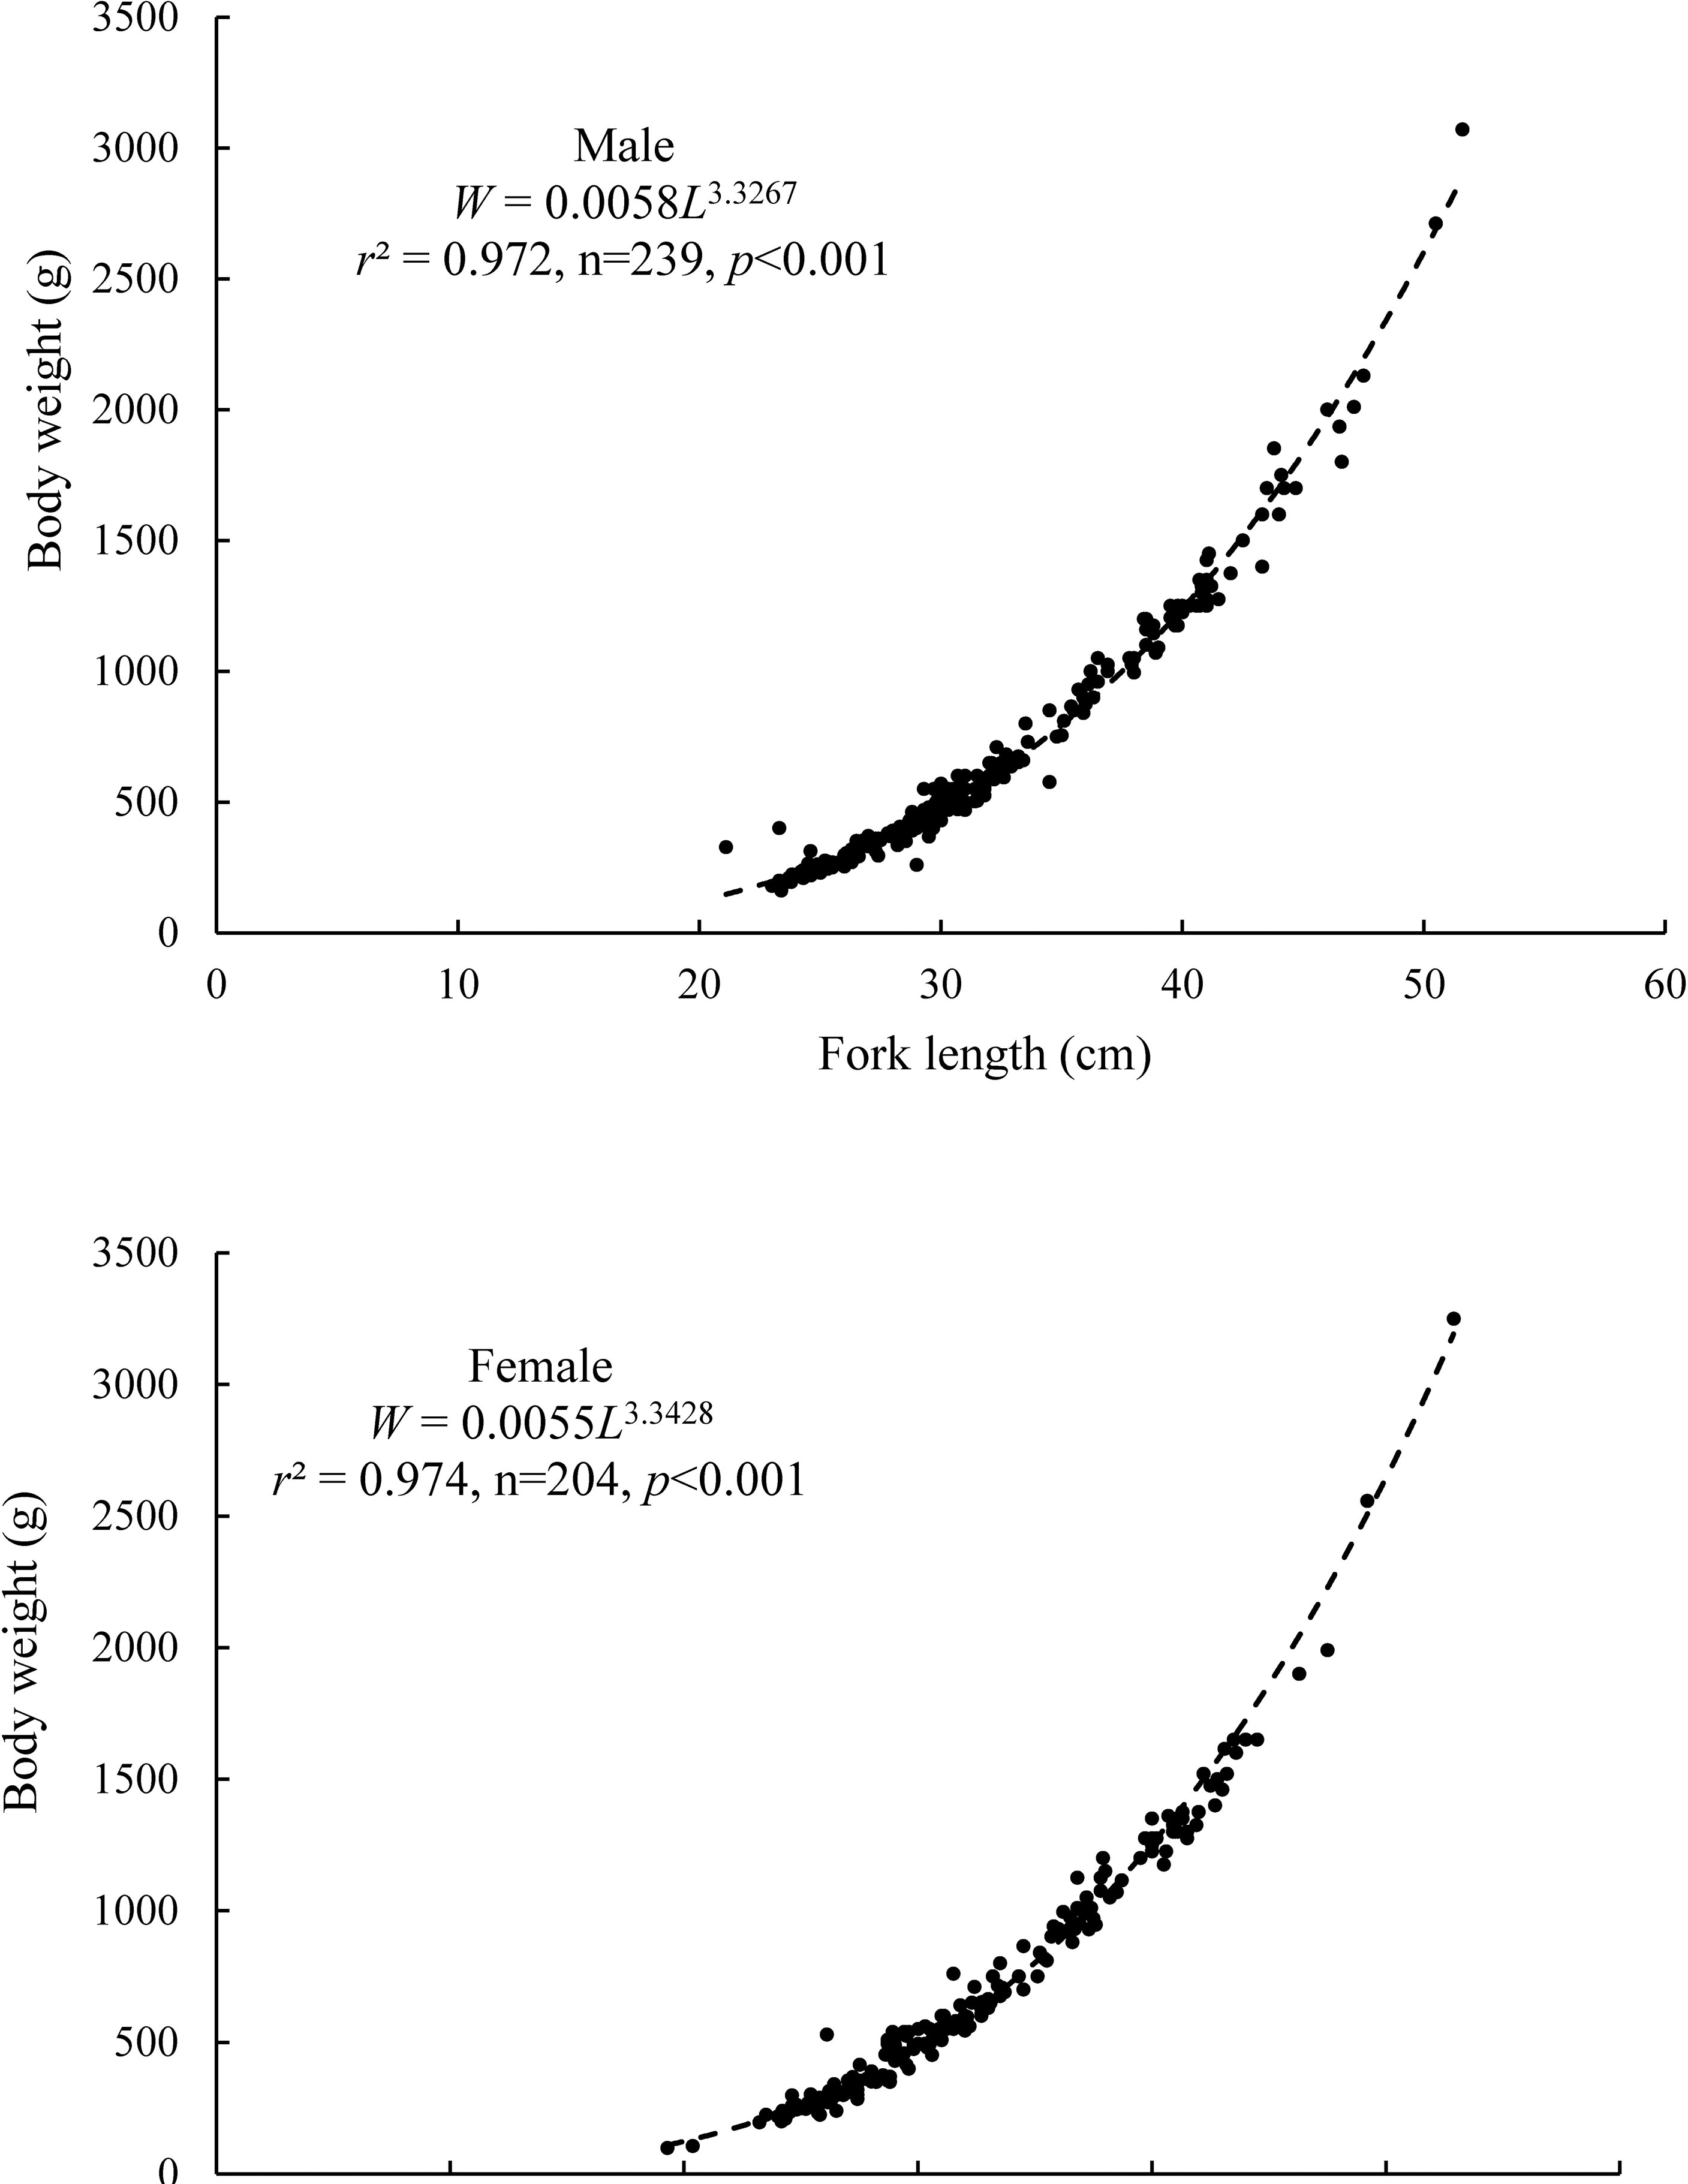
Figure 2 Male (upper) and female (lower) skipjack tuna length–weight relationships in the South China Sea.
Estimated von Bertalanffy growth parameters using the ELEFAN method and Pauly’s empirical equation are 68.3 cm for Linf, 0.325 year−1 for K, and −0.41 for t0. These results indicate that skipjack tuna attains a maximum fork length of 68.3 cm with a relatively low growth rate. The estimated growth performance index (Φ) is 3.18 with a high goodness of fit value (Rn) of 0.515. The von Bertalanffy growth function is described by:
Estimated natural mortalities (M) of skipjack tuna using empirical formulas M1–M6 are 0.60, 0.67, 0.35, 0.37, 0.50, and 0.45, respectively. We use the mean value (0.49) and set the prior M/K for LBB and LBSPR to 1.51 (= 0.49/0.325) (Table 1).
Based on an ASR logistic curve fitted by nonlinear regression (Figure 3), the estimated mean fork length at 50% sexual maturity (L50) of skipjack tuna is 36.7 cm, with 95% confidence interval (CI) 32.1–41.0 cm. The estimated mean fork length at 95% sexual maturity (L95) is 1.1 × L50 = 40.4 cm.
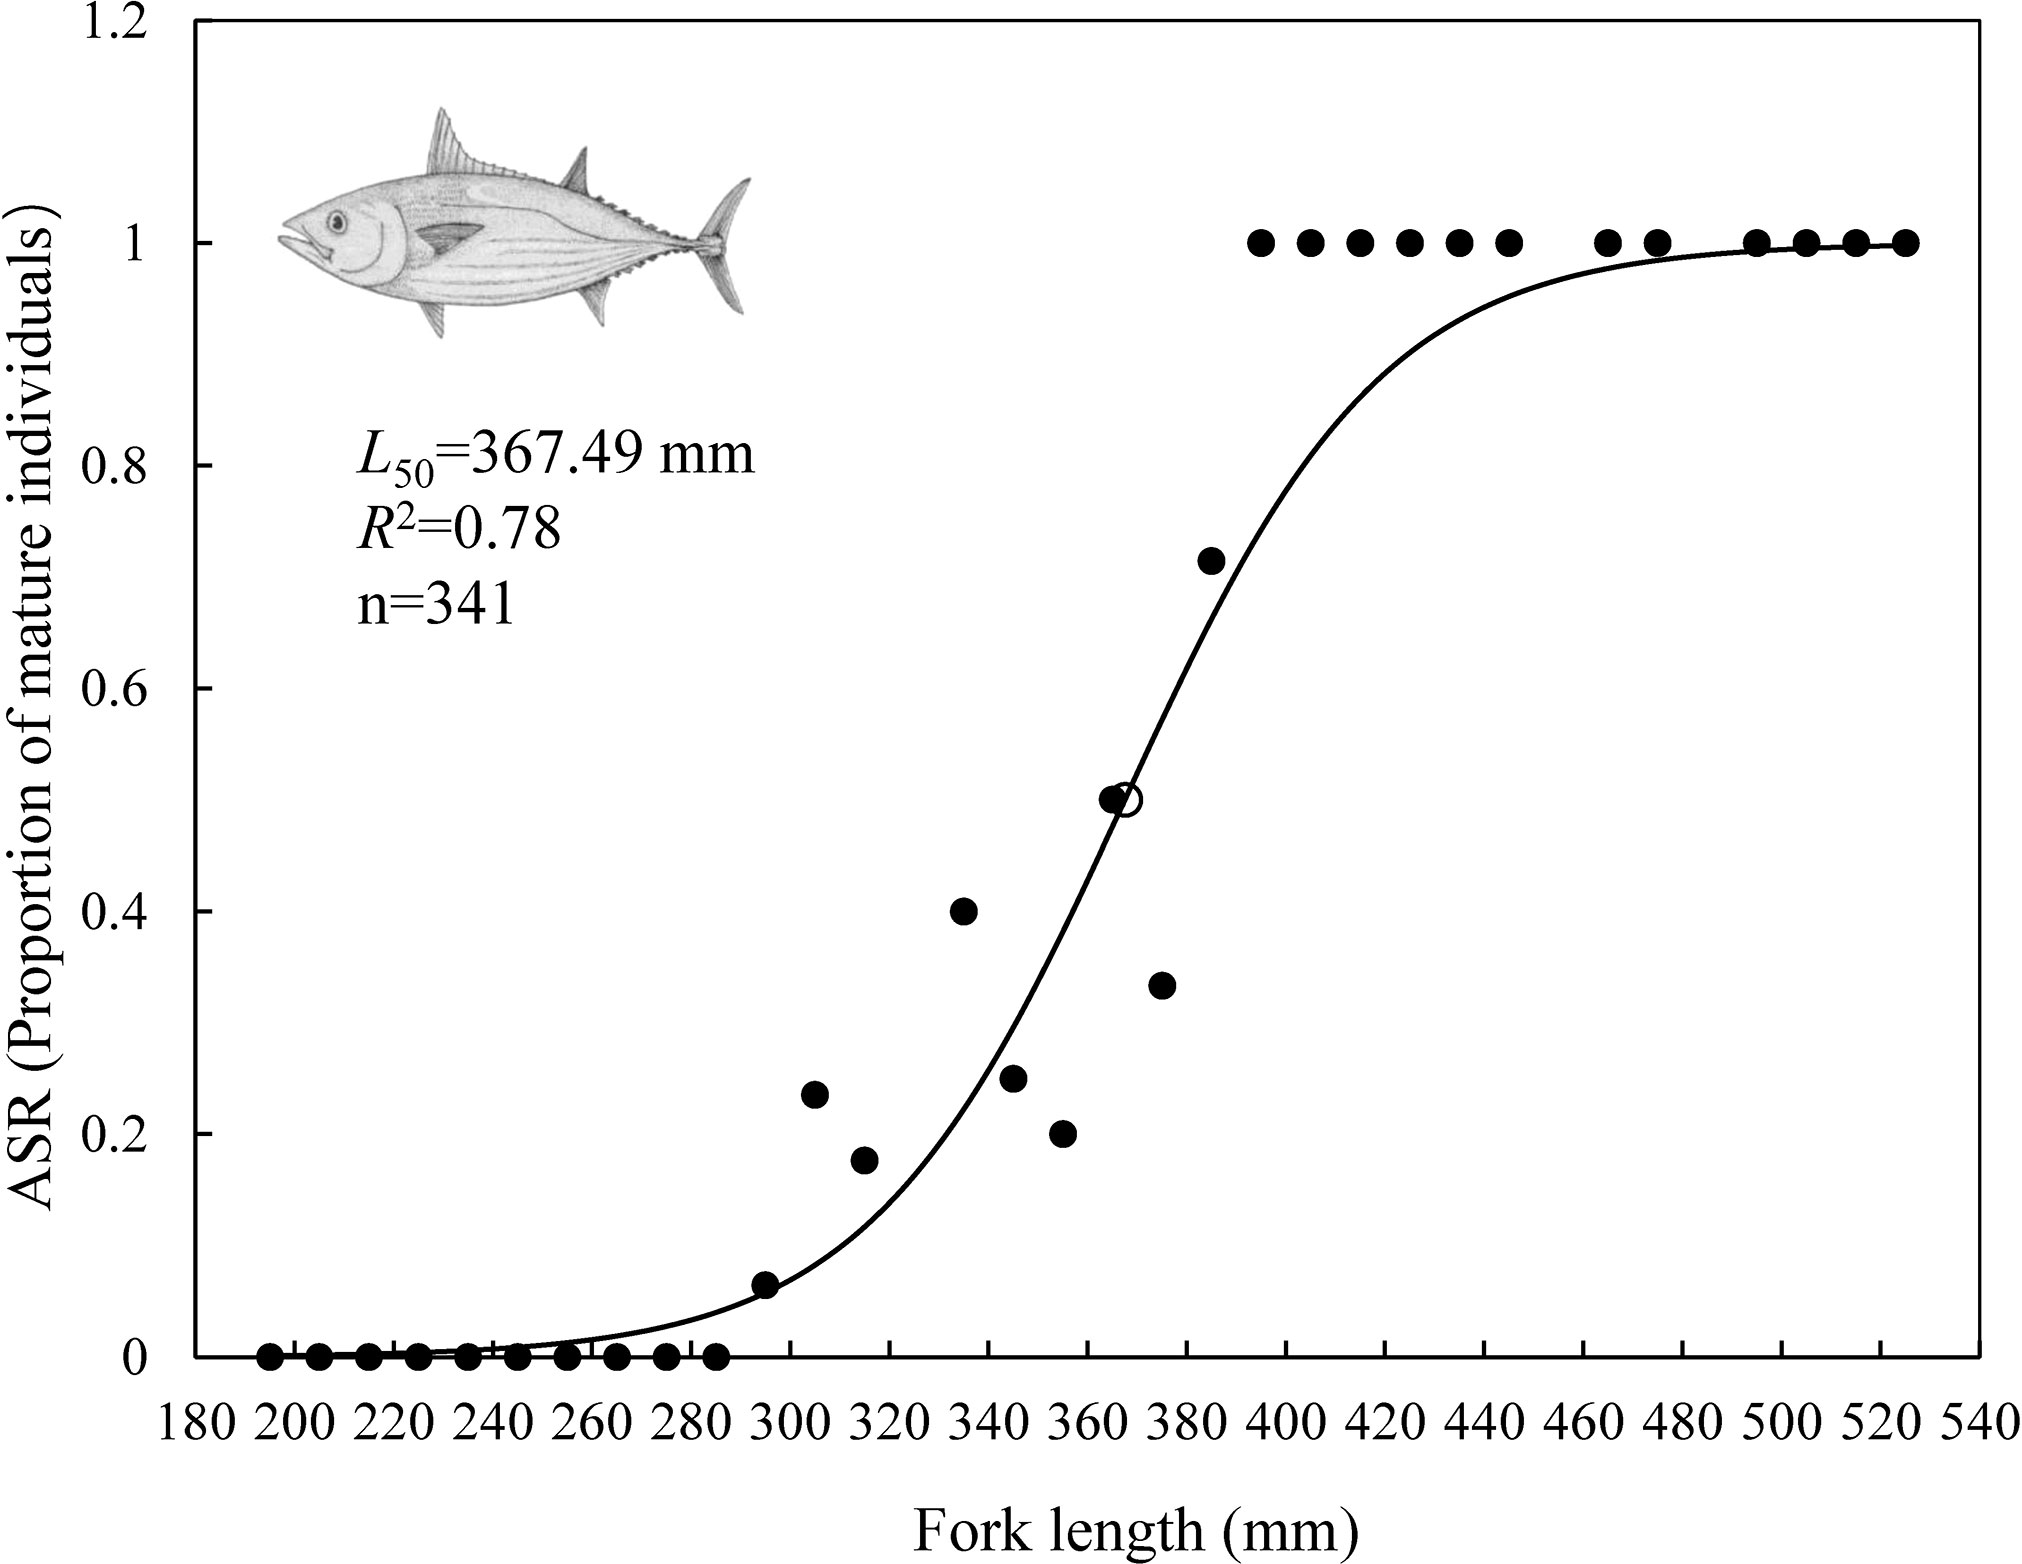
Figure 3 Proportions of mature skipjack tuna and logistic curves fitted using the ASR model. Solid points represent observed data, and the circle represents the estimated mean fork length at 50% sexual maturity (L50).
LBB assessment results
According to LBB outputs (Figure 4), the estimated Linf is 68.7 cm (95% CI = 67.6–69.7 cm) and M/K is 1.59 (95% CI = 1.45–1.72). The estimated relative stock size B/BMSY is 0.29 (95% CI = 0.232–0.352), and the estimated Lc/Lc_opt is 0.53, which indicates that the current SCS skipjack tuna stock is heavily overfished (0.2< B/BMSY ≤ 0.5) and experiencing growth overfishing (Lc/Lc_opt< 1). Meanwhile, the estimated F/M is 2.28 (95% CI = 1.94–2.68), indicating that fishing mortality is twice as high as natural mortality. Therefore, the exploitation rate E can be calculated by F/(F+M) = 0.695, which also indicates an overfished stock status. The estimated length at first capture that maximizes the catch and biomass Lc_opt is 40.0 cm, but only 5.2% of all individuals exceeded this length. Therefore, the optimum skipjack tuna catchable size should be increased.
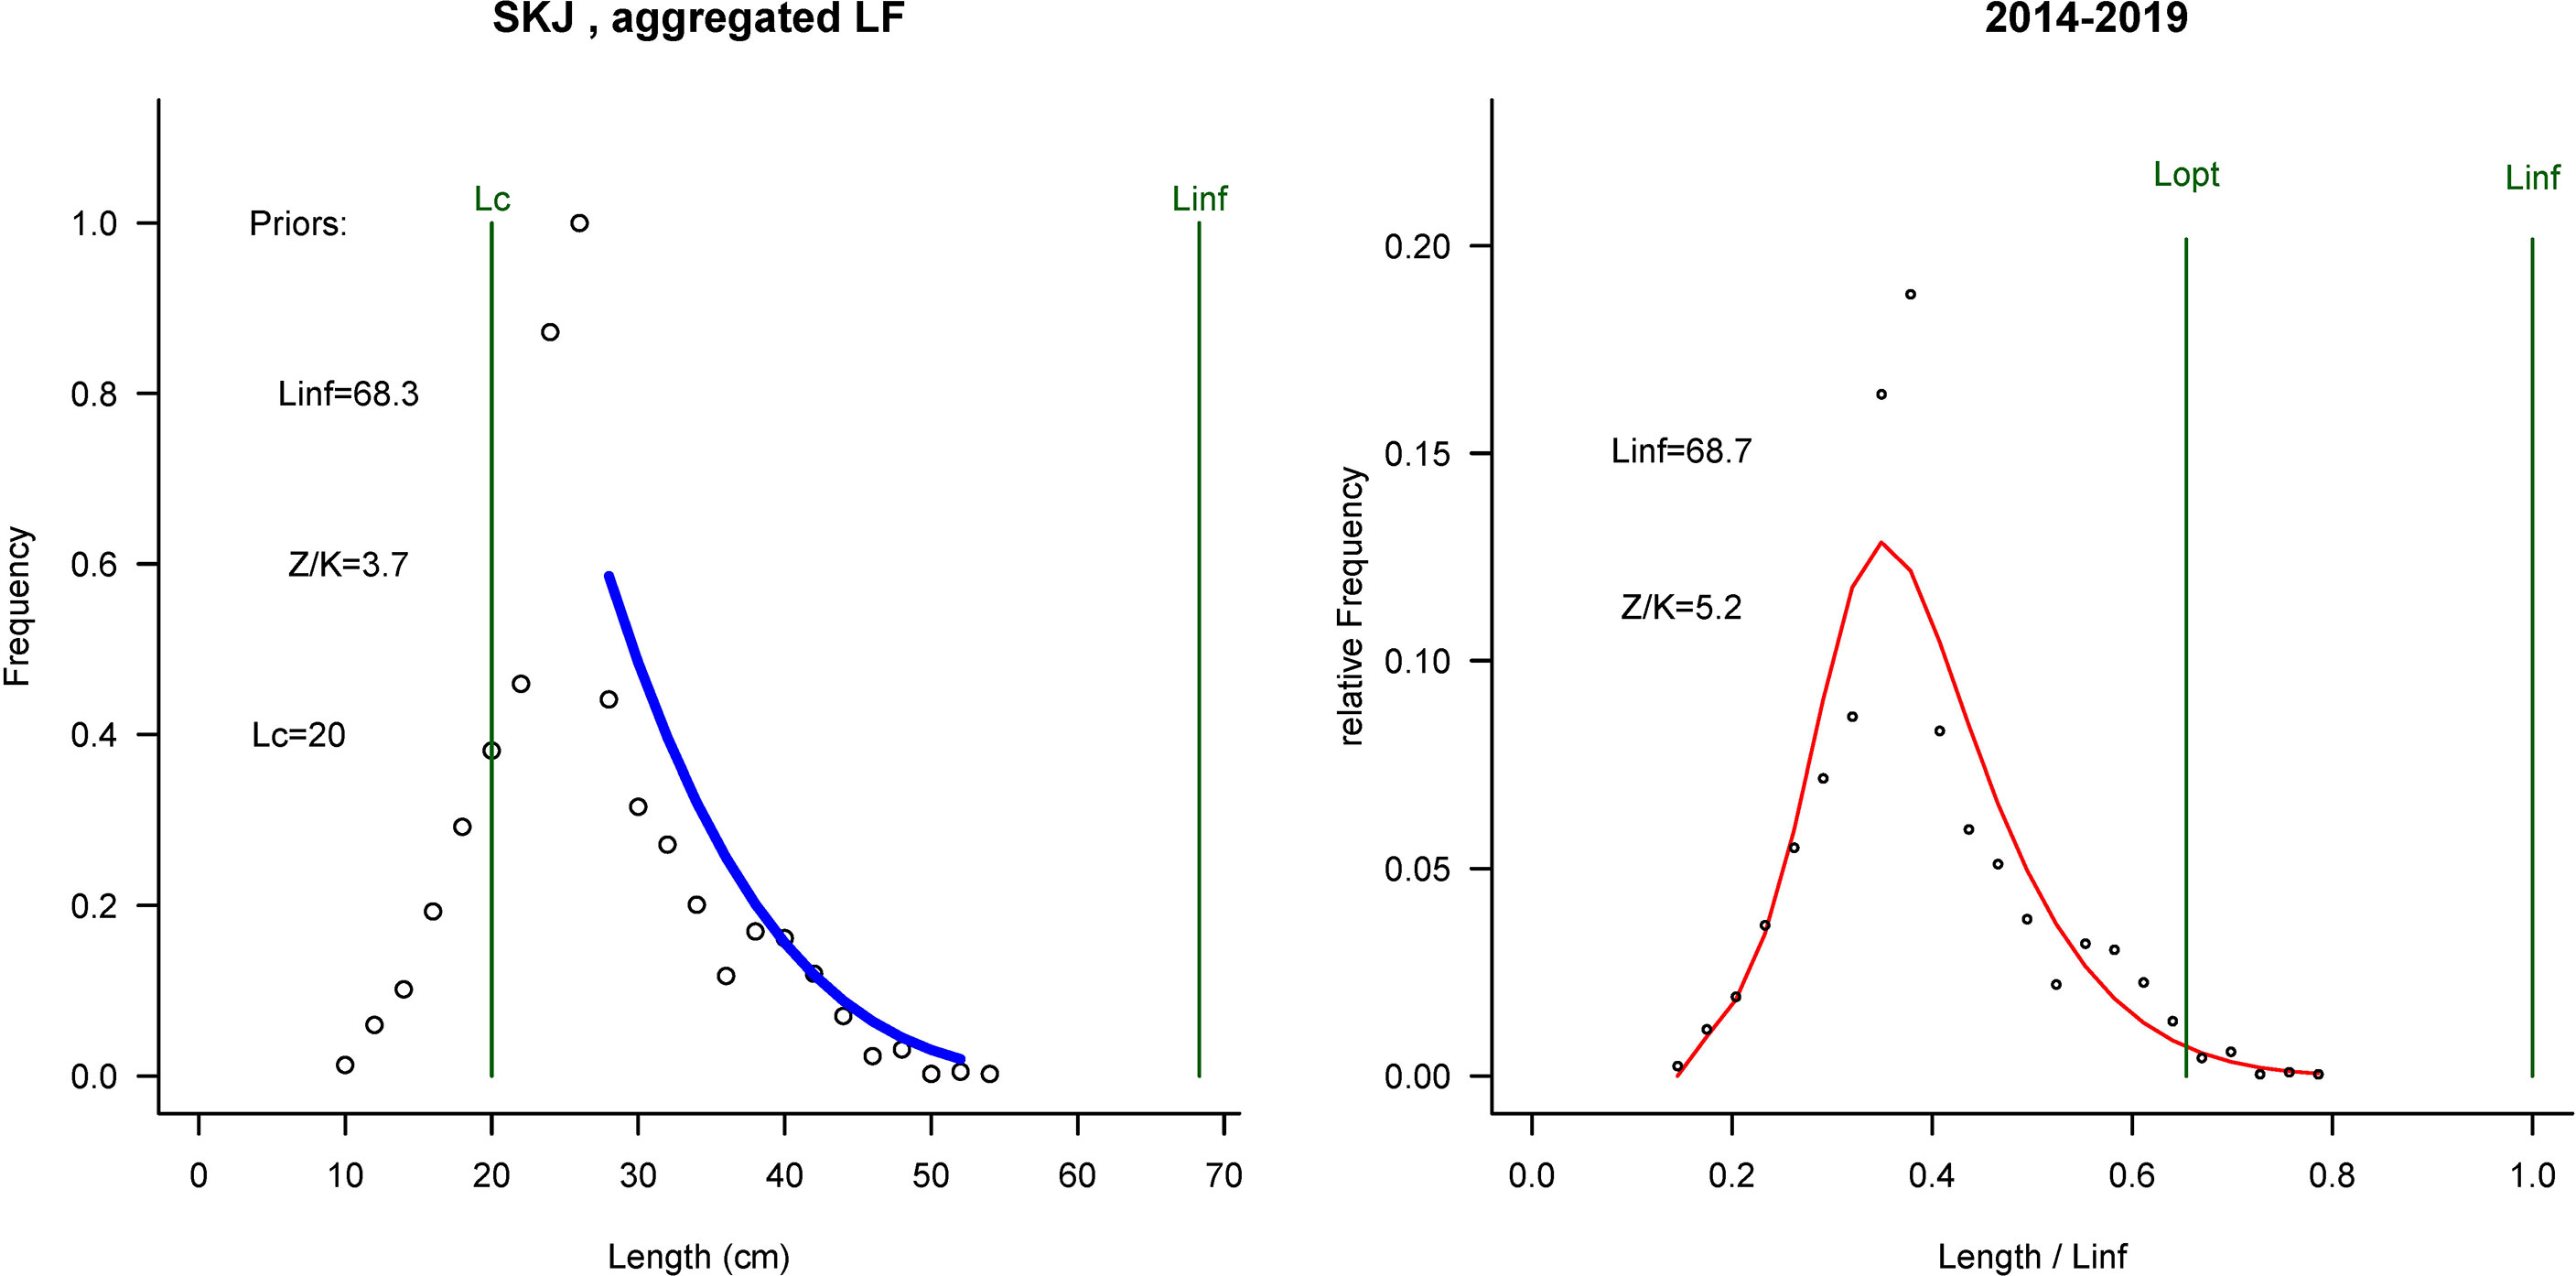
Figure 4 Length-based Bayesian biomass estimates for skipjack tuna in the South China Sea. Left: fits of the model to length data; right: predictions of the LBB analysis. Linf, asymptotic length; Lc, length of 50% individuals captured by the gear; Lopt, length where the maximum biomass of the unexploited stock is obtained.
LBSPR assessment results
According to LBSPR outputs (Figure 5A–D), the mean F/M estimate is 3.1, and the exploitation rate E (0.756) is higher than the LBB estimate of 0.695. The ogive curve for selectivity and maturity (Figure 5B) reveals the length at maturity to be higher than the length at first capture. The estimated fork length at 50% and 95% selectivity (SL50 and SL95) are 20.0 and 27.6 cm, respectively (Figure 5C). Assuming that our length- frequency data are in a steady-state (Hordyk et al., 2015), the estimated SPR for the current SCS skipjack tuna stock is at 3%, which is significantly below the limit reference point of 20%. The length composition which should be targeted to maintain the threshold level (SPR = 0.2) against the current observed length-frequency data is shown in Figure 5D. The uncertainty of nature mortality has effected the SPR values, and were 0.04, 0.05, 0.01, 0.01, 0.03 and 0.02, respectively, using M1–M6 estimates. The size of fish currently targeted by this fishery is significantly lower than would be expected, indicating that most caught fish are juveniles. Therefore, this fishery is overfished and the catchable size of skipjack tuna should be increased.
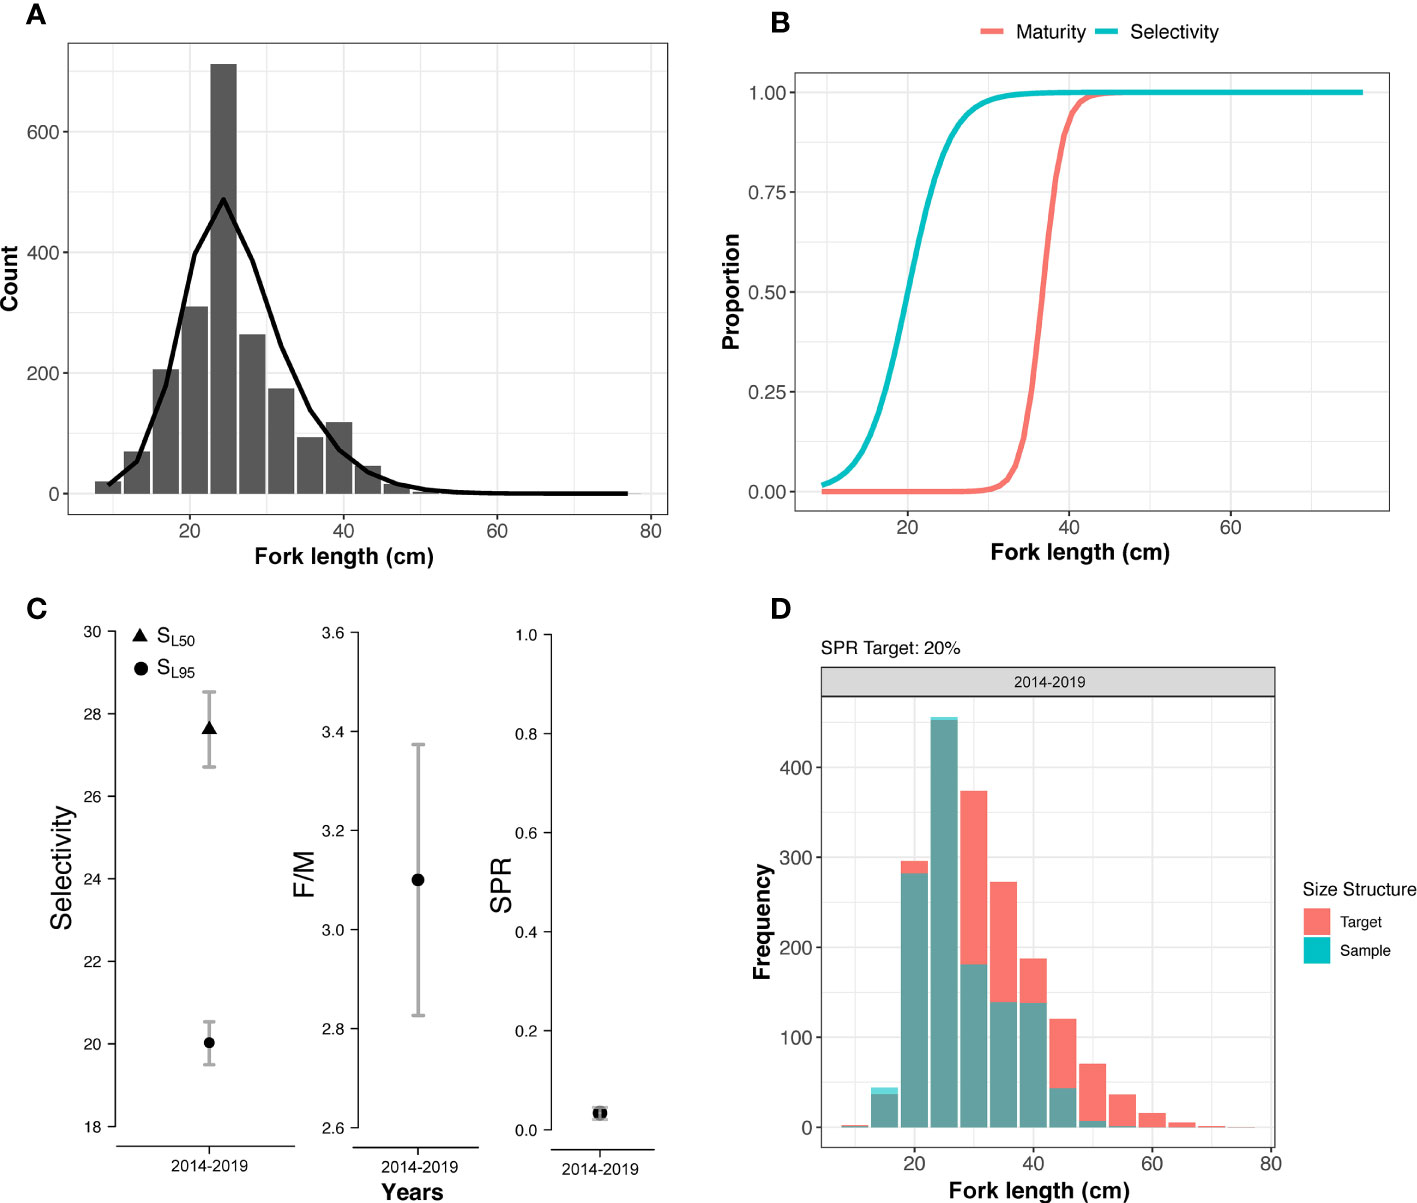
Figure 5 LB-SPR model outputs for South China Sea skipjack tuna. (A) length-frequency distribution (pillars), and predicted fished size composition (black line); (B) maturity and selectivity curves from the fitted LBSPR model when L50 = 36.7 cm and L95 = 40.4 cm; (C) shows the distribution of mean selectivity parameters (SL50 and SL95), fishing mortality to natural mortality (F/M), and spawning potential ratio; (D) observed length-frequency data against an expected size composition at a target SPR = 0.2.
Discussion
This study attempted to apply two length-based methods (LBB and LBSPR) on stock assessment for the data-poor skipjack tuna stock in the SCS. Results show a precarious situation for this fishery, with a current relative stock size B/BMSY of 0.29 and SPR of 3%. Although the WCPFC announced in a recent report that this fishery was sustainable in the WCPO (Hare et al., 2021), both LBB and LBSPR length-based methods suggest that it might be heavily overfished in the SCS. A recent assessment (Prince et al., 2022) also used LBSPR to evaluate skipjack tuna fishery in the SCS. Our study differed from this assessment by the following two points. Firstly, two length-based methods (LBB and LBSPR) were applied in our study and the results of LBB and LBSPR corroborated each other. Prince et al. (2022) used only LBSPR but length data from many fisheries and different countries. Secondly, we estimated the growth, mortality and maturity parameters directly from our existing data collected in the SCS while Prince et al. (2022) used previous and similar estimates (e.g., L50 = 40.9 cm, L95 = 45.0 cm). Actually, our estimates showed skipjack tuna in the SCS matured earlier (L50 = 36.7 cm), and population parameters might be different with other regions (Table 1). Therefore, prior information used in LBSPR seemed more precise in our study. Our analyses contribute significantly to understanding the status of skipjack tuna stocks throughout the entire WCPO region.
The SCS occupies a central position in the Indo-West Pacific region, and is the third largest marginal sea in the world (Li et al., 2019). Fish diversity and fisheries resources within it are extremely rich (Zhang et al., 2021a), there are limited data available for many of its fisheries (Zhang et al., 2017). Shallow water (< 200 m) fisheries resources in the northern SCS had been overfished in the 1990s (Zhang et al., 2017; Zhang et al., 2021a). The main commercial fish species in deeper SCS waters are tuna and tuna-like species, e.g., yellowfin tuna (Thunnus albacares), bigeye tuna (Thunnus obesus), skipjack tuna, bullet tuna (Auxis rochei), frigate tuna (Auxis thazard), and Carangidae species (Wang et al., 2021; Zhang et al., 2021b). The status of most of these fish stocks has not been assessed because of data limitations. For data-poor fisheries, three methods (length-, catch-, and abundance-based) are usually used to calculate biological reference points within the context of MSY (Liao et al., 2022). Because accurate catch statistics in the SCS are not available, and there is a lack of time-series survey abundance data, catch- and abundance-based methods cannot be applied to assess the status of the skipjack tuna fishery in this region. Accordingly, we applied two length-based models on the SCS skipjack tuna assessment.
Previous sensitivity analysis have demonstrated the results of LBB to be sensitive to Linf settings, and that the ELEFAN method can provide effective prior information for this method (Zhang et al., 2021a; Liao et al., 2022). Therefore, we used ELEFAN in the “TropFishR” package to calculate priors of important growth parameters (Linf, K) for skipjack tuna before LBB and LBSPR estimation. Our results differ from previous estimates of von Bertalanffy growth parameters for skipjack tuna in the Pacific and Atlantic oceans (Table 2). The estimated Linf in the SCS is smaller than elsewhere. The estimated K is greater than values for the Atlantic Ocean, and about average for Pacific Ocean values. The growth performance index (Φ) ranged 3.02–3.58 in all results, and our result (Φ = 3.18) is consistent with them. The “TropFishR” package allows users to visualize fitted scores across a range of Linf-K combinations in response surface analysis (RSA). This visualization of Rn scores across discrete combinations of both variables may also aid in narrowing possible variable ranges in subsequent, more refined searches (Mildenberger et al., 2017). While our Rn score (0.515) is higher than that reported in other recent studies (Alam et al., 2022; Kindong et al., 2022), the parameters estimated by “TropFishR” match those of other studies (Table 2). Therefore, the priors that we used in LBB and LBSPR are sound and informative.
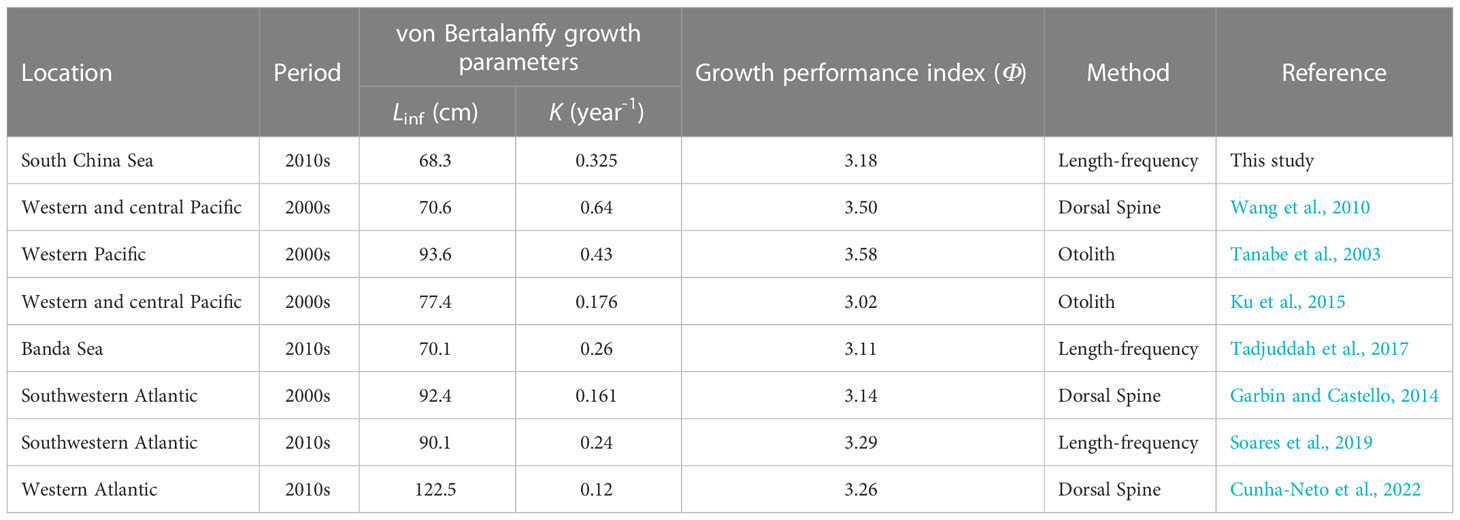
Table 2 Growth parameters and growth performance index of skipjack tuna stocks.
Results of the two models suggest that the SCS skipjack tuna fishery might be overfished. However, the evaluation processes and the reference points obtained from LBB and LBSPR differ. LBB works for species that grow throughout their lives, and estimates asymptotic length, length at first capture, relative natural mortality, and relative fishing mortality using MCMC analysis. Standard fisheries equations can then be used to approximate the current exploited biomass relative to the unexploited biomass (Froese et al., 2018). The relative stock size (B/BMSY) is a useful biological reference point and management limit that is commonly used in tuna fishery management (ICCAT, 2013; Hare et al., 2021; Liao et al., 2022). The estimated B/BMSY (0.29) of the SCS skipjack tuna fishery is quite low for the WCPO (Hare et al., 2021). Hordyk et al. (2019) indicated that the LBB analysis did not correct for pile-up effects and may result in a biased estimate of fishing mortality F and M/K. Zhang et al. (2021a) also suggested using other methods in conjunction with LBB if decisions regarding actual fisheries had to be made. Therefore, we also applied another length-based method (LBSPR) to assess fishery stocks. The LBSPR method assumes that length-at-age is normally distributed with a constant coefficient of variation (CV), and assesses stock status by comparing the spawning potential as measured through length composition data to that expected in an unfished stock (Hordyk et al., 2015; Hordyk et al., 2016). The SPR obtained by LBSPR is a well-established biological reference point, and a powerful tool to help assess the impact of present-day fishing pressure on a stock’s reproductive potential. The estimated SPR (0.03) of the SCS skipjack tuna fishery is the lowest throughout the WCPO (Hare et al., 2021). Therefore, we conclude that fishing mortality must be reduced by controlling fishing effort, and that the skipjack tuna catchable size must be increased in the SCS. We also emphasize collaboration mechanism should be established by the main fishing countries for management and sustainability of skipjack tuna fishery in the SCS.
There are some limitations in this study. The two methods assume that the length composition of the catch data is representative of the exploited population, and LBSPR assumes that selectivity is well represented by a logistic curve. However, the estimated Linf in the SCS is the lowest thus-far reported (Table 2). This may be because the predominant size-class of skipjack tuna elsewhere ranges 40–60 cm (Garbin and Castello, 2014; Hare et al., 2021), while those from the SCS are smaller (20–40 cm). Possible explanations for this include density-dependent effects, the influence of environmental factors (e.g., higher water temperature), and fishing-induced evolution (Zhang et al., 2020). But most likely, skipjack tuna caught in unassociated (free-swimming) schools are larger than those taken in schools associated with fish aggregating devices such as light falling-net (Hare et al., 2021). Meanwhile, we found skipjack tuna in the SCS matured earlier (L50 = 36.7 cm), which indicated the body size might be smaller than those of other regions. Therefore, the sampling representativeness and smaller body size in the SCS should be explored in further studies.
Data availability statement
The raw data supporting the conclusions of this article will be made available by the authors, without undue reservation.
Ethics statement
The animal study was reviewed and approved by South China Sea Fisheries Research Institute Animal Welfare Committee.
Author contributions
KZ conceived the study and wrote the first draft. JZ and PZ provided the original length data. LS, and XH performed the data analyses and prepared the graphs. YQ, and ZC revised the manuscript. All authors contributed to the article and approved the submitted version.
Funding
This work was supported by the Key Research and Development Project of Guangdong Province (2020B1111030001), the Central Public-Interest Scientific Institution Basal Research Fund, CAFS (2020TD05), and the Central Public Interest Scientific Institution Basal Research Fund, South China Sea Fisheries Research Institute, CAFS (2021SD01).
Conflict of interest
The authors declare that the research was conducted in the absence of any commercial or financial relationships that could be construed as a potential conflict of interest.
Publisher’s note
All claims expressed in this article are solely those of the authors and do not necessarily represent those of their affiliated organizations, or those of the publisher, the editors and the reviewers. Any product that may be evaluated in this article, or claim that may be made by its manufacturer, is not guaranteed or endorsed by the publisher.
References
Alam M. S., Liu Q., Schneider P., Mozumder M. M. H., Chowdhury M. Z. R., Uddin M. M., et al. (2022). Length-based stock assessment for the data-poor bombay duck fishery from the northern bay of Bengal coast, Bangladesh. J. Mar. Sci. Eng. 10, 213. doi: 10.3390/jmse10020213
Alverson D. L., Carney M. J. (1975). A graphic review of the growth and decay of population cohorts. ICES J. Mar. Sci. 36, 133–143. doi: 10.1093/icesjms/36.2.133
Chen Y., Paloheimo J. E. (1994). Estimating fish length and age at 50% maturity using a logistic type model. Aquat. Sci. 56, 206–219. doi: 10.1007/BF00879965
Chong L., Mildenberger T. K., Rudd M. B., Taylor M. H., Cope J. M., Branch T. A., et al. (2020). Performance evaluation of data-limited, length-based stock assessment methods. ICES. J. Mar. Sci. 77, 97–108. doi: 10.1093/icesjms/fsz212
Costello C., Ovando D., Hilborn R., Gaines S. D., Deschenes O., Lester S. E. (2012). Status and solutions for the world’s unassessed fisheries. Science 338, 517–520. doi: 10.1126/science.1223389
Cunha-Neto M. A., Hazin H. G., Silva G. B. (2022). Age and growth of skipjack tuna (Katsuwonus pelamis) in the western equatorial Atlantic based on dorsal spines analysis. Bol. Inst. Pesca 48, e686. doi: 10.20950/1678-2305/bip.2022.48.e686
FAO (2022). “The state of world fisheries and aquaculture 2022,” in Towards blue transformation (Rome: FAO).
Froese R., Pauly D. (2022) FishBase. world wide web electronic publication. Available at: www.fishbase.org (Accessed 19 October 2022).
Froese R., Winker H., Coro G., Demirel N., Tsikliras A. C., Dimarchopoulou D., et al. (2018). A new approach for estimating stock status from length frequency data. ICES J. Mar. Sci. 75, 2004–2015. doi: 10.1093/icesjms/fsy078
Garbin T., Castello J. P. (2014). Anges in population structure and growth of skipjack tuna, Katsuwonus pelamis during 30 years of exploitation in the southwestern Atlantic. Lat. Am. J. Aquat. Res. 42, 434–446. doi: 10.3856/vol42-issue3-fulltext-13
Han Q., Shan X., Jin X., Gorfine H., Yang T., Su C. (2021). Data-limited stock assessment for fish species devoid of catch statistics: case studies for Pampus argenteus and Setipinna taty in the Bohai and Yellow Seas. Front. Mar. Sci. 8,766499. doi: 10.3389/fmars.2021.766499
Hare S. R., Williams P. G., Castillo J. C., Hamer P. A., Hampton W. J., Scott R. D., et al. (2021). “The western and central Pacific tuna fishery: 2020 overview and status of stocks,” in Tuna fisheries assessment report no. 21 (Noumea, New Caledonia: Pacific Community), 53.
Hewitt D.A., Hoenig J.M. (2005). Comparison of two approaches for estimating natural mortality based on longevity. Fish. Bull. 103, 433–437.
Hoenig J. M. (1983). Empirical use of longevity data to estimate mortality rates. Fish. Bull. 82, 898–903.
Hordyk A., Ono K., Prince J. D., Walters C. J. (2016). A simple length-structured model based on life history ratios and incorporating size-dependent selectivity: application to spawning potential ratios for data-poor stocks. Can. J. Fish. Aquat. Sci. 13, 1–13. doi: 10.1139/cjfas-2015-0422
Hordyk A., Ono K., Valencia S., Loneragan N., Prince J. (2015). A novel length-based empirical estimation method of spawning potential ratio (SPR), and tests of its performance, for small-scale, data-poor fisheries. ICES J. Mar. Sci. 72, 217–231. doi: 10.1093/icesjms/fsu004
Hordyk A. R., Prince J. D., Carruthers T. R., Walters C. J. (2019). Comment on “A new approach for estimating stock status from length frequency data” by froese et al., (2018). ICES J. Mar. Sci. 76, 457–460. doi: 10.1093/icesjms/fsy168
ICCAT (2013). Report of the 2013 ICCAT north and south Atlantic albacore data preparatory meeting (Madrid, Spain: The International Commission for the Conservation of Atlantic Tunas), 68.
Kindong R., Sarr O., Wu F., Tian S. (2022). Length-based assessment methods for the conservation of a pelagic shark, Carcharhinus falciformis from the tropical Pacific Ocean. Fishes 7, 184. doi: 10.3390/fishes7040184
Ku J. E., Lee S., Kim J.-K., Park H. W., Lee M. K., Kim Z. G., et al. (2015). Age and growth of the skipjack tuna Katsuwonus pelamis in the western and central Pacific Ocean. Kor. J. Fish. Aquat. Sci. 48, 377–385. doi: 10.5657/KFAS.2015.0377
Liao B., Xu Y., Sun M., Zhang K., Liu Q. (2022). Performance comparison of three data-poor methods with various types of data on assessing southern Atlantic albacore fishery. Front. Mar. Sci. 9, 825461. doi: 10.3389/fmars.2022.825461
Li Z., Shan X., Jin X., Dai F. (2011). Long-term variations in body length and age at maturity of the small yellow croaker (Larimichthys polyactis bleeker 1877) in the Bohai Sea and the Yellow Sea, China. Fish. Res. 110, 67–74. doi: 10.1016/j.fishres.2011.03.013
Li Y., Wang C., Zou X., Feng Z., Yao Y., Wang T., et al. (2019). Occurrence of polycyclic aromatic hydrocarbons (PAHs) in coral reef fish from the South China Sea. Mar. pollut. Bull. 139, 339–345. doi: 10.1016/j.marpolbul.2019.01.001
Mildenberger T. K., Taylor M. H., Wolff M. (2017). TropFishR: An r package for fisheries analysis with length-frequency data. Meth. Ecol. Evol. 8, 1520–1527. doi: 10.1111/2041-210X.12791
Palomares M. L. D., Froese R., Derrick B., Nöel S.-L., Tsui G., Woroniak J., et al. (2018). A preliminary global assessment of the status of exploited marine fish and invertebrate populations (Washington, DC, USA: OCEANA).
Pauly D. (1980). On the interrelationships between natural mortality, growth parameters, and mean environmental temperature in 175 fish stocks. ICES J. Mar. Sci. 39, 175–192. doi: 10.1093/icesjms/39.2.175
Pauly D. (1983). Some simple methods for the assessment of tropical fish stocks (Rome, Italy: FAO), 234.
Pauly D., Munro J. L. (1984). Once more on the composition of growth in fish and invertebrates. Fishbyte 2, 1–21.
Pons M., Cope J. M., Kell L. T. (2020). Comparing performance of catch-based and length-based stock assessment methods in data-limited fisheries. Can. J. Fish. Aquat. Sci. 77, 1026–1037. doi: 10.1139/cjfas-2019-0276
Prince J., Creech S., Madduppa H., Hordyk A. (2020). Length-based assessment of spawning potential ratio in data-poor fisheries for blue swimming crab (Portunus spp.) in Sri Lanka and Indonesia: Implications for sustainable management. Reg. Stud. Mar. Sci. 36, 101309. doi: 10.1016/j.rsma.2020.101309
Prince J., Victor S., Kloulchad V., Hordyk A. (2015). Length based SPR assessment of eleven Indo-Pacific coral reef fish populations in Palau. Fish. Res. 171, 42–58. doi: 10.1016/j.fishres.2015.06.008
Prince J., Wang X., Lin K., Suryanti A., Jamon S., Santos M. D., et al. (2022) The CFRA: A joint assessment of South China Sea skipjack tuna stocks. Available at: http://www.scspi.org/en/yjbg/cfra-joint-assessment-south-china-sea-skipjack-tuna-stocks (Accessed 16 December 2022).
Quinn T. J. I. I., Deriso R. B. (1999). Quantitative fish dynamics (Oxford, UK: Oxford University Press).
Soares B. J., Monteiro-Neto C., Costa M. R., Martins R. R. M., Vieira F. C. S., Andrade-Tubino M. F., et al. (2019). Size structure, reproduction, and growth of skipjack tuna (Katsuwonus pelamis) caught by the pole-and-line fleet in the southwest Atlantic. Fish. Res. 212, 136–145. doi: 10.1016/j.fishres.2018.12.011
Tadjuddah M., Anadi L., Mustafa A., Arami H., Abdullah K. S., et al. (2017). Growth pattern and size structure of skipjack tuna caught in Banda Sea, Indonesia. AACL Bioflux. 10, 227–233.
Tanabe T., Kayama S., Ogura M. (2003). “Precise age determination of young to adult skipjack tuna (Katsuwonus pelamis) with validation of otolith daily increment,” in Proceedings of the 16th Meeting of the Standing Commitee on Tuna and Billfish, (Mooloolaba, Aus).
Then A. Y., Hoenig J. M., Hall N. G., Hewitt D. A., Jardim H. E. E. (2015). Evaluating the predictive performance of empirical estimators of natural mortality rate using information on over 200 fish species. ICES J. Mar. Sci. 72, 82–92. doi: 10.1093/icesjms/fsu136
Walters C. J., Martell S. J. D. (2004). Fisheries ecology and management (Princeton, USA: Princeton University Press).
Wang X. F., Xu L. X., Zhu G. P., Wang C. L. (2010). Age identification and growth characteristics of Katsuwonus pelamis in western and central Pacific Ocean. Chin. J. Appl. Ecol. 21, 756–762.
Wang T., Zhang P., Li J., Zhang J., Xie B., Yan L., et al. (2021). Distribution of skipjack tuna (Katsuwonus pelamis) associated with a light falling-net in the South China Sea. J. Fish. Sci. China 28, 79–89. doi: 10.3724/SP.J.1118.2021.20104
Yu Y., Zhang H., Jin J., Wang Y. (2019). Trends of sea surface temperature and sea surface temperature fronts in the South China Sea during 2003–2017. Acta Oceanol. Sin. 38, 106–115. doi: 10.1007/s13131-019-1416-4
Zhang K., Guo J. Z., Xu Y. W., Jiang Y., Fan J. T., Xu S. N., et al. (2020). Long-term variations in fish community structure under multiple stressors in a semi-closed marine ecosystem in the South China Sea. Sci. Total Environ. 745, 140892. doi: 10.1016/j.scitotenv.2020.140892
Zhang K., Liao B., Xu Y., Zhang J., Sun M., Qiu Y., et al. (2017). Assessment for allowable catch of fishery resources in the South China Sea based on the statistical data. Haiyang Xuebao 39, 25–33. doi: 10.3969/j.issn.0253-4193.2017.08.003
Zhang K., Li J., Hou G., Huang Z., Shi D., Chen Z., et al. (2021a). Length-based assessment of fish stocks in a data-poor, jointly exploited (China and Vietnam) fishing ground, northern South China Sea. Front. Mar. Sci. 8, 718052. doi: 10.3389/fmars.2021.718052
Keywords: tuna fishery, western and central Pacific, data-poor fisheries, length-based methods, overfished
Citation: Zhang K, Zhang J, Zhang P, Su L, Hong X, Qiu Y and Chen Z (2023) This is what we know: Assessing the stock status of the data-poor skipjack tuna (Katsuwonus pelamis) fishery in the South China Sea. Front. Mar. Sci. 10:1095411. doi: 10.3389/fmars.2023.1095411
Received: 11 November 2022; Accepted: 05 January 2023;
Published: 18 January 2023.
Edited by:
Wei Liu, Qilu University of Technology (Shandong Academy of Sciences), ChinaReviewed by:
Chongliang Zhang, Ocean University of China, ChinaSiquan Tian, Shanghai Ocean University, China
Copyright © 2023 Zhang, Zhang, Zhang, Su, Hong, Qiu and Chen. This is an open-access article distributed under the terms of the Creative Commons Attribution License (CC BY). The use, distribution or reproduction in other forums is permitted, provided the original author(s) and the copyright owner(s) are credited and that the original publication in this journal is cited, in accordance with accepted academic practice. No use, distribution or reproduction is permitted which does not comply with these terms.
*Correspondence: Zuozhi Chen, Y2hlbnp1b3poaUBzY3NmcmkuYWMuY24=