 Rebeca Rodríguez-Mendoza
 Fran Saborido-Rey
94% of researchers rate our articles as excellent or good
Learn more about the work of our research integrity team to safeguard the quality of each article we publish.
Find out more
REVIEW article
Front. Mar. Sci., 29 May 2023
Sec. Marine Fisheries, Aquaculture and Living Resources
Volume 10 - 2023 | https://doi.org/10.3389/fmars.2023.1095171
This article is part of the Research TopicProspects and Challenges for the Implementation of HTS Genetic Methods in Fisheries Research Surveys and Stock Assessments.View all 15 articles
In Europe, research surveys carried out by state governments provide the great majority of fishery-independent data. Member States (MS) in the European Union (EU) regularly conduct research surveys to provide the necessary data to assess the status of exploited fish stocks and to monitor the general condition of the marine ecosystem. In the surveys, samplings are carried out throughout the distribution range of the targeted fish species using standardized gears (e.g., trawls and seines) and other methods (e.g., hydroacoustics and underwater cameras). In the context of fish stock assessment, survey data are important because they provide indices that help tuning the stock assessment models (e.g., the index of fish abundance) and key information about the size and age distributions of the stock, the size-age relationships, the proportion of fish mature at each age, and information on reproductive performance of the stocks. However, research surveys have a number of shortcomings that include, for example, a high economic cost coupled with complex logistics and a long time required for processing the collected data. In addition, some of the parameters that are needed in stock assessment cannot be estimated from survey data for certain commercially important species. For instance, age is usually determined using hard structures (such as otoliths) in fish target species. However, for European hake, age cannot be determined accurately because there are many difficulties in interpreting the ring patterns of the otoliths. This highlights the need to look for alternative methodologies such as genomics, that have the potential of improving the data obtained from research surveys and hence, improve fish stock assessments. Considering this, we carried out a review of the bottom trawl research surveys in the EU with the purpose of: 1) identifying the current approaches for monitoring fishery resources and the ecosystem and 2) determining how genomic techniques can be used to improve survey data, taking into account the needs of current and future stock assessment in Europe.
The status of marine fish stocks needs to be evaluated regularly to ensure fishing practices are kept at sustainable levels, through a process called “stock assessment”. This process involves collecting, analyzing, and reporting demographic information to determine changes in the abundance of fishery stocks in response to fishing and, to the extent possible, predict future trends of stock abundance (NMFS, 2001). It is based on different data types, for example, fishery catches, landings, biological information recorded by onboard observers and fishery-independent data coming from research surveys. In the European Union (EU), the Common Fisheries Policy (CFP) established in Regulation (EU) No. 1380/2013 is supported by the fisheries data collected by Member States (MS). This regulation sets out the rules for managing European fishing fleets in a sustainable way and protecting marine resources exploited in European fisheries. According to the CFP, MS shall “collect biological, environmental, technical, and socio-economic data necessary for fisheries management”, enabling “the assessment of: (a) the state of exploited marine biological resources; (b) the level of fishing and the impact that fishing activities have on the marine biological resources and on the marine ecosystems; and (c) the socio-economic performance of the fisheries, aquaculture and processing sectors within and outside Union waters”.
To do this, a Data Collection Framework (DCF) was established in the EU and is currently set out in Regulation (EU) 2017/1004 and the Commission Delegated Decision (EU) 2021/1167, that establishes the multiannual Union programme for the collection and management of biological, environmental, technical and socioeconomic data in the fisheries and aquaculture sectors from 2022 (EU MAP). The DCF provides for the EU MAP that details the requirements for data collection by MS and a list mandatory scientific surveys at sea. Under EU MAP, a research survey at sea is defined as: “trips carried out on a research vessel, or a vessel dedicated to scientific research for stock and ecosystem monitoring, and designated for this task by the body in charge of the implementation of the national work plan established in accordance with Article 21 of Regulation (EU) No 508/2014” (Commission Delegated Decision (EU) 2019/910). The current list of mandatory surveys is established in Commission Implementing Decision (EU) 2021/1168, and includes 51 surveys that are carried out in the Baltic Sea, the North Sea and eastern Arctic, the North Atlantic and the Mediterranean and Black Sea.
In research surveys, samples are taken across the distribution range of the targeted fish species employing standardized fishing gears (e.g., trawls and seines), hydroacoustics and other devices (remotely operated vehicles, towed cameras, etc.). Survey data are important in stock assessment because they provide indices that help tuning the stock assessment models (e.g., fish abundance indices, usually the number or weight of fish caught per unit of effort). For example, the Baltic International Trawl Survey (BITS) provides two indices (one from the BITS-Q1 and another from the BITS-Q4) used in the stock assessment of cod in the eastern Baltic Sea. Surveys also provide key information about fish stocks such as the size and age distributions, the size-age relationships, the proportion of fish mature at each age, and information on reproductive performance of the stocks. Species’ diet and trophic relationships can also be determined by sampling stomach contents in research surveys (Cooper, 2006). However, the sampling programs in the surveys also provide information on various ecosystem components such as hydrography, geochemistry of seawater and sediment, benthic epifauna and infauna, zooplankton, phytoplankton, and other aspects such as marine litter (ICES, 2019). In fact, the sampling design used in surveys takes into account the distribution of many different species, the overall community and the environmental characteristics. In the recent years, budget and time-dependent efforts have enabled the development of a full ecosystem monitoring programme without disrupting the fisheries time-series (ICES, 2019).
Nevertheless, traditional methods to assess the state of fish stocks through scientific surveys have experienced a very slow progress and present recognized shortcomings (Maunder and Piner, 2015). Research surveys involve complex logistics and are costly. The consequence of this is that the data collected are sparse in space and time. In addition, a long time is needed to process and analyze the collected data (Stamatopoulos, 2002). Moreover, some important parameters in fish stock assessment cannot be estimated using traditional methodologies at present. For example, the sex of juveniles cannot be determined using traditional methods (e.g., observation of the gonads), despite the importance of sex ratios to evaluate the status of exploited stocks. Similarly, difficulties have been faced when determining the age of individuals of some species, an essential parameter for growth estimates, population dynamic studies and for optimizing the harvesting time (Gursoy et al., 2005). Otoliths of some commercially important fish species such as European hake (Merluccius merluccius) or cod (Gadus morhua), for instance, have proved unreliable due to the presence of false rings, lack of definition of rings or deposition at irregular intervals (Morales-Nin et al., 1998; Hüssy et al., 2010; Ligas et al., 2011). In this context, High-throughput sequencing (HTS) genomic methods can offer the possibility to resolve some of these hurdles and enhance the data collected for fisheries assessment. In recent years, several genomic methods have been developed and applied to study different aspects of marine organisms and biodiversity. For example, Close-Kin Mark-Recapture (CKMR) is a method that allows estimating abundance and other demographic parameters (e.g., mortality rates and connectivity) from kinship relationships determined from genetic samples (Bravington et al., 2016a). Until now, it has been used for few fish species, such as bluefin tuna (Bravington et al. 2016b), white sharks (Hillary et al., 2018), brook trout (Ruzzante et al., 2019) and thornback ray (Trenkel et al., 2022), but CKMR is being considered for several more species (e.g., Maunder et al., 2021). Another genomic method that could potentially provide an indicator of stock abundance and/or biomass is environmental DNA (eDNA). eDNA is DNA that is collected from an environmental sample (e.g., water, sediment and air) rather than directly from an organism. eDNA can originate in cells from the body or waste products of organisms (Ficetola et al., 2008; Taberlet et al., 2012). This genomic tool has been mostly used to determine the presence and distribution of a species, but recent evidence suggests the concentration of eDNA could also be used to estimate abundance and/or biomass for stock assessments in a fast and cost-effective way (Rourke et al., 2022 and references therein). Regarding age estimation, epigenetic age determination (Horvath and Raj, 2018) could provide an accurate alternative method for aging fish and overcome the limitations of the current methods (e.g., otolith readings). This genomic method analyses changes in DNA methylation associated with ageing and allows constructing epigenetic clocks to predict age, such as the one recently developed for sea bass (Dicentrarchus labrax) (Anastasiadi and Piferrer, 2020). Genomic methods could be used as well to improve knowledge on stock structure and substructure, which is also relevant to stock assessment. For example, restriction site-associated DNA sequencing (RAD-seq) could be used to analyze genome-wide diversity of fish populations using thousands of single nucleotide polymorphisms (SNPs). Then, for example, differences of RAD-Seq‐derived SNP frequencies within stocks could be analyzed to define their substructure (e.g., Ceballos et al., 2021); or screening of SNPs could be used to search for sex markers that would allow sexing fish individuals and determining the sex structure of the stock (e.g., Palaiokostas et al., 2013; Gamble, 2016; Feron et al., 2021).
Considering this, we carried out a review of the bottom trawl research surveys in the EU with the purpose of: 1) identifying the current approaches for monitoring fishery resources and the ecosystem and 2) determining how genomic techniques can be used to improve survey data, taking into account the needs of current and future stock assessment in Europe.
Currently, there are 19 mandatory bottom trawl surveys that are carried out by EU MS and other European countries (see tables in Supplementary Materials S1, S2). These surveys are carried out in several regions: The Baltic Sea, the North Sea (ICES areas 1 and 2), the North Atlantic (ICES Areas 5-14 and the NAFO areas) and the Mediterranean and Black Sea (Figure 1). Thus, different organizations are responsible for coordinating and standardizing these surveys. The main management bodies involved in planning and coordinating research surveys in Europe are the following:
● The International Council for the Exploration of the Sea (ICES). Three groups are involved in the coordination and standardization of bottom trawl surveys in European waters: i) The ICES Working Group on Beam Trawl Surveys (WGBEAM) is in charge of planning, coordinating and implementing European inshore and offshore beam trawl surveys, ii) The ICES International Bottom Trawl Survey Working Group (IBTSWG) coordinates bottom-trawl research surveys within the ICES area and iii) The ICES Baltic International Fish Survey Working Group (WGBIFS) plans, coordinates, and implements bottom-trawl and hydroacoustic research surveys in the Baltic Sea.
● The Northwest Atlantic Fisheries Organization (NAFO): Three of the bottom trawl surveys in this review are carried out in the NAFO convention area, i) The Flemish Cap Survey (3M), ii) the 3LNO Survey (Flemish Pass and Grand Bank) and iii) the Greenland Groundfish Survey (around Greenland).
● The General Fisheries Commission for the Mediterranean (GFCM), which coordinates three surveys: i) the Bottom Trawl Survey in the Black Sea, the International Bottom Trawl Survey in the Mediterranean (MEDITS) and the Beam Trawl Survey in GSA 17 (SOLEMON).
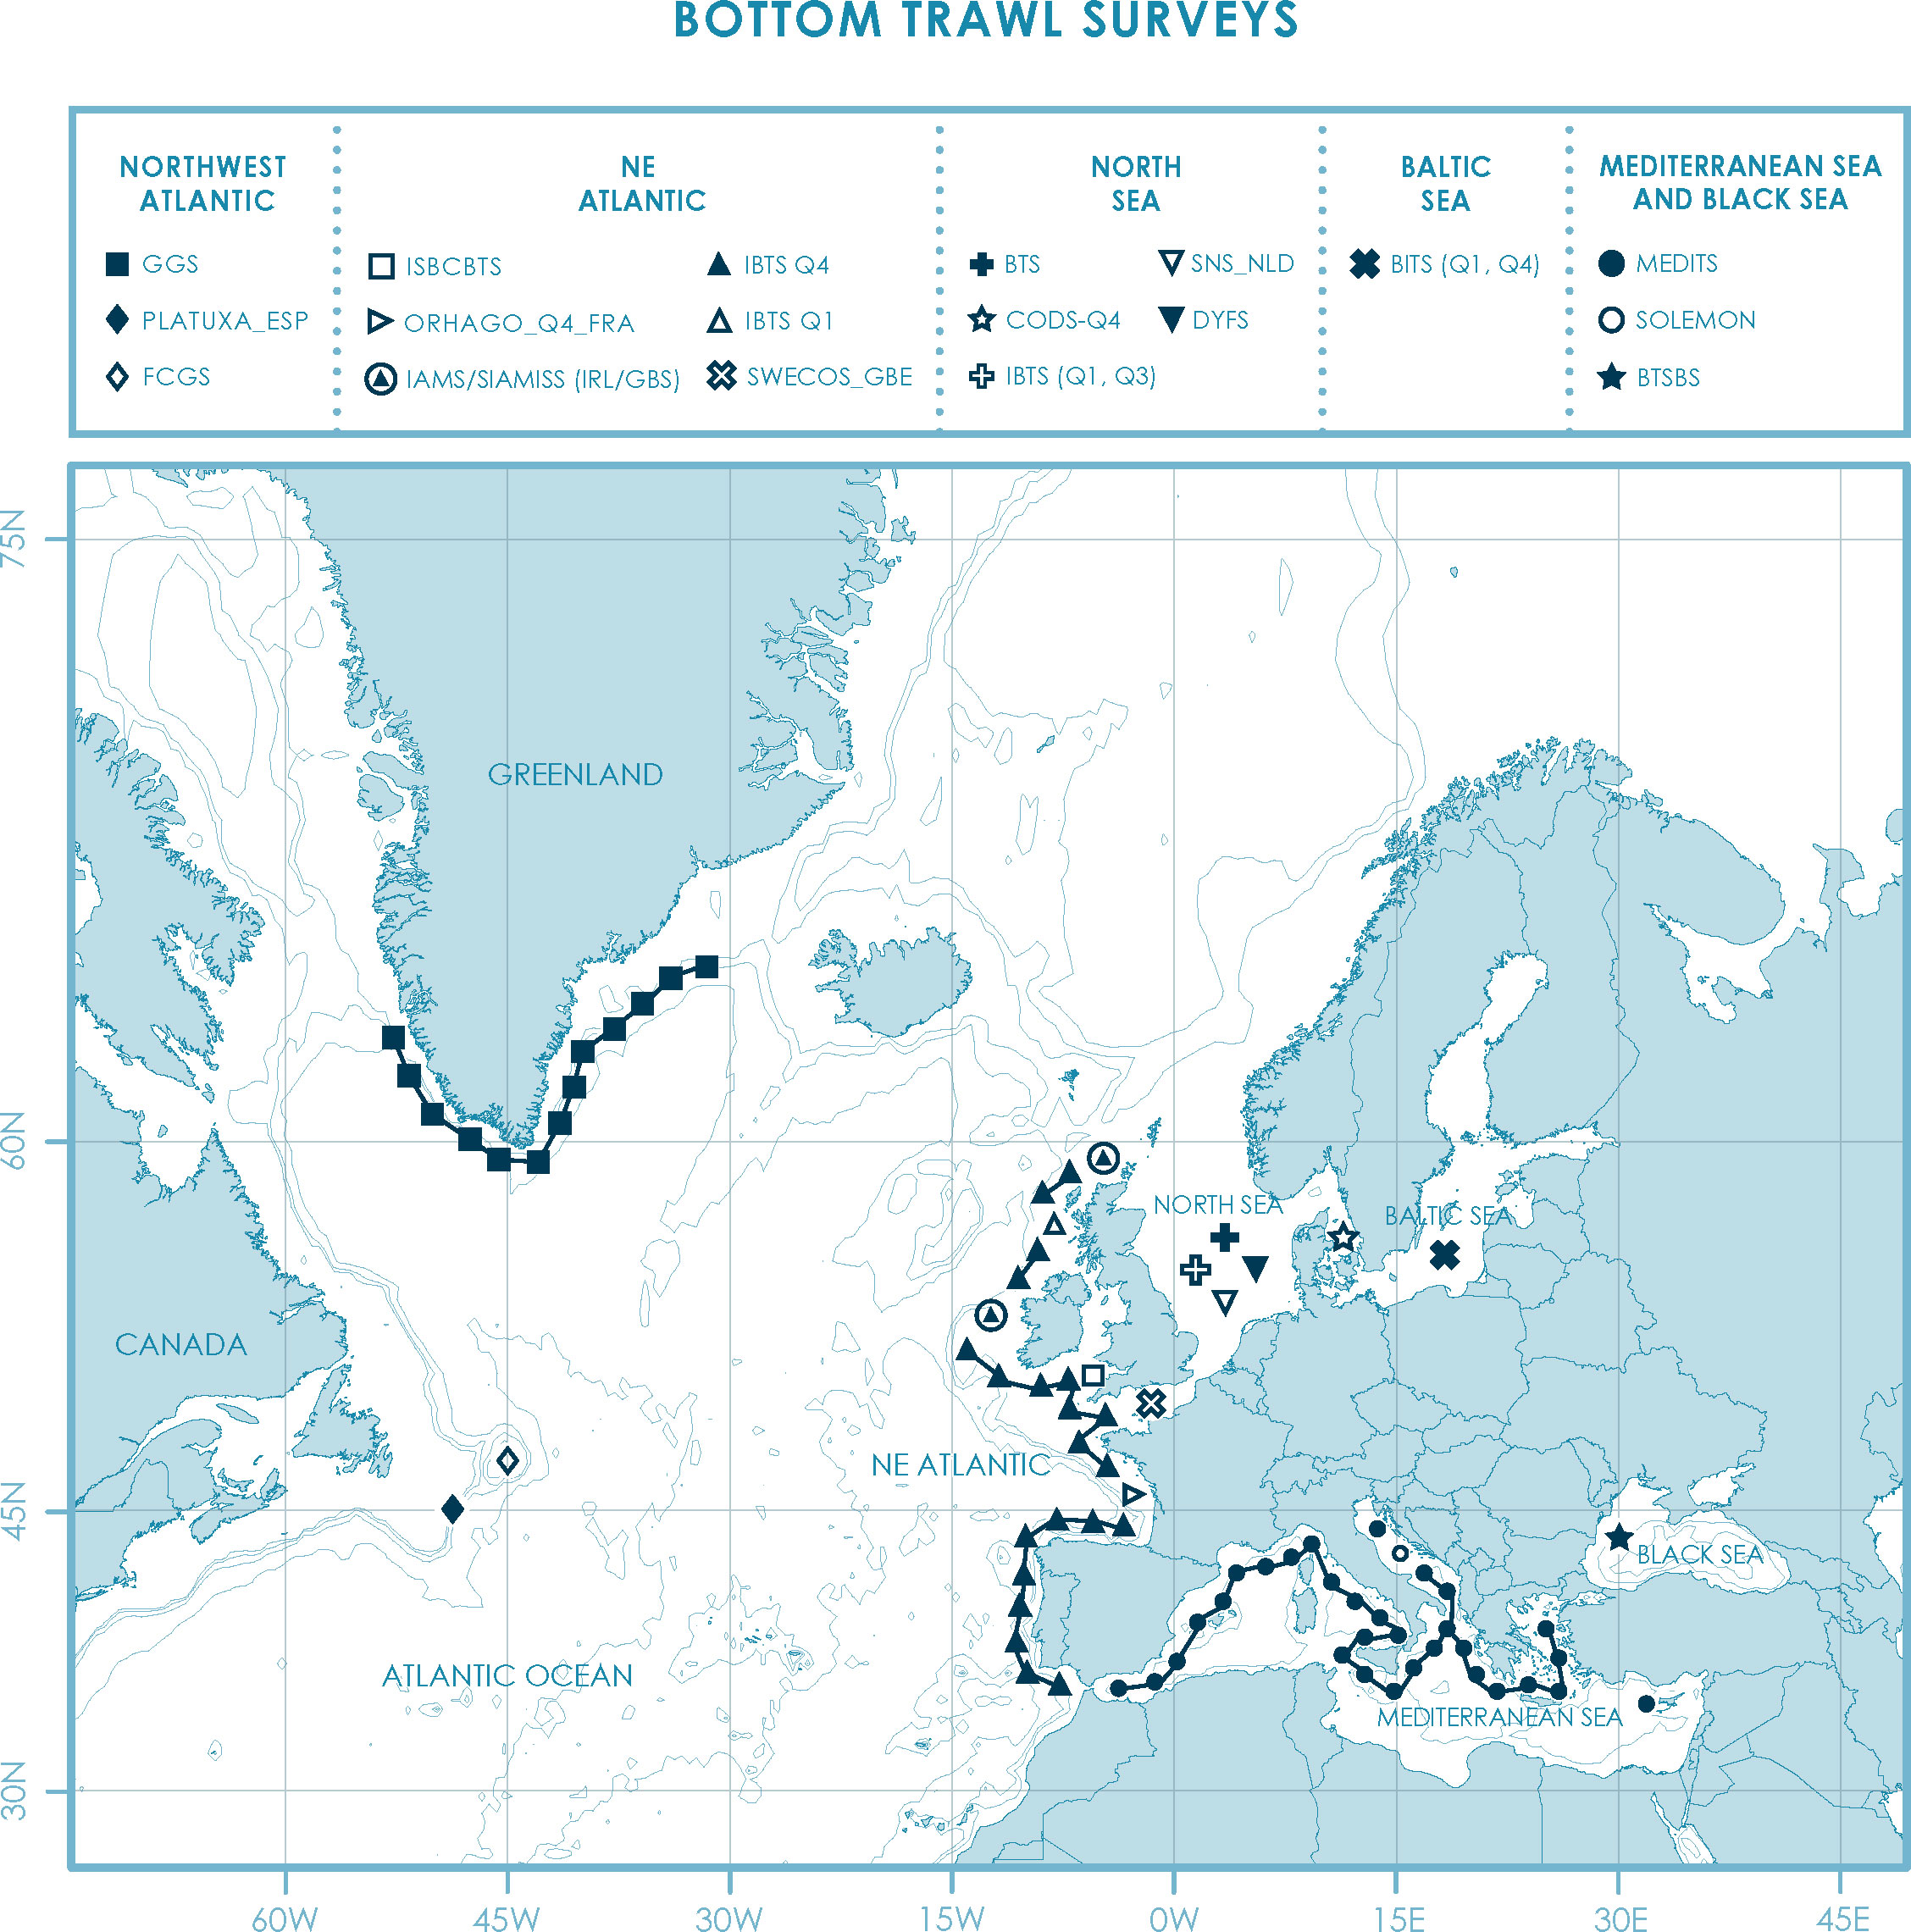
Figure 1 Overview of mandatory bottom trawl surveys as established in Commission Implementing Decision (EU) 2021/1168. Bottom trawl surveys are carried out in several regions: the North Atlantic (ICES Areas 5-14 and the NAFO areas), the North Sea (ICES areas 1 and 2), the Baltic Sea and the Mediterranean and Black Sea.
Mandatory bottom trawl surveys are diverse. Primarily, this is a consequence of the different regions covered by each survey, which means that different ecosystems with different species of marine organisms are surveyed. Regarding methodological aspects, bottom trawl surveys have different characteristics related to the fishing gear used, the survey duration, the distance from the shore, and the international participation (i.e., number of countries contributing to a particular survey). There are two types of fishing gears used in bottom trawl surveys in Europe, the otter trawl (e.g., Northeast Atlantic IBTS) and the beam trawl (e.g., North Sea BTS). Otter trawls are generally used in surveys targeting a wide variety of demersal species and that cover large areas, many of them located off-shore. Beam trawls are used mostly in surveys targeting flatfish species. In beam trawl surveys, there is no standardized gear across surveys, as the width and rigging of the beam trawls depends on the local circumstances and the vessel’s capacity. The setup of the gear is mainly determined by seafloor conditions. For instance, in the beam trawl survey carried out by the Netherlands (part of the BTS survey) the gear is rigged with a flip-up rope in the central and western North Sea to avoid rocks from entering the net. In the south-eastern North Sea, no flip-up rope is used because there are no rocks in that area (ICES, 2019). Regarding distance, surveys can be divided into in-shore surveys and off-shore surveys. In-shore surveys such as the DYFS and SNS_NLD in the North Sea cover small regions close to the coast. On the other hand, off-shore surveys are carried out further away from the coast and may cover extensive areas (e.g., IBTS and MEDITS). Among off-shore surveys, those that are carried out in NAFO areas can be considered long-distance (i.e., GGS, FCGS and 3LNO). Survey duration is very variable. For example, the Sole Net in-shore survey lasts for 8 or 9 days, while others like the IBTS or MEDITS last more than 250 days (when the effort from all participating countries is considered). In addition to these differences, some surveys are focused in only a few species (for example, the Sole Net Survey in the North Sea, that targets 0-4 group sole, plaice and turbot) while others target dozens of species (e.g., MEDITS or western IBTS) (see table in Supplementary Material S1). Regarding international participation, the number of countries contributing to a particular survey also differs among surveys. About half of the surveys are carried out by one or two countries but there are surveys, such as MEDITS, the North Sea IBTS and the western IBTS, that involve many countries.
Regarding data collection, biological parameters such as length, weight, sex, maturity and age are determined in all surveys for target species. For the rest of species, taxonomic identification is carried out and, in many cases, length of the specimens is recorded. Additional information is collected on other biological components of the ecosystem (e.g., marine mammals, birds, benthic invertebrates and plankton) as input to an ecosystem approach to fisheries. Oceanographic data such as temperature and salinity and marine litter data are recorded as well. The type of data that are collected in each bottom trawl survey is shown in the table in Supplementary Material S3.
A stock assessment is “the process of collecting, analyzing, and reporting demographic information to determine changes in the abundance of fishery stocks in response to fishing and, to the extent possible, predict future trends of stock abundance” (NMFS, 2001). Figure 2 shows the general process of stock assessment, including in this case, sampling for genomic methods within “Data Collection”. Stock assessments are used to provide scientific advice to resource managers and policy makers about the present health and expected trends of a particular fish stock. Certainly, stock assessments are the technical basis for establishing annual fishery harvest levels (e.g., catch limits and quotas) and other management measures for the fishery (NOAA, 2012). These assessments are usually carried out by fitting mathematical models to the available information to produce simplified representations of population and fishery dynamics. Stock assessment methods have progressed over time, from descriptive models to complex statistical models with many estimated parameters and formal approaches to evaluating uncertainty (Cadrin and Dickey-Collas, 2015).

Figure 2 Overview of the stock assessment process.
Stock assessment models require different sources of information depending on their assumptions. In general, the data used in assessments includes commercial catches and landings, effort, biological information recorded by onboard observers (e.g., age and length composition data) and fishery-independent data coming from research surveys. As already mentioned, survey data are important in stock assessment because they provide indices that help tuning the stock assessment models (e.g., fish abundance indices, usually the number or weight of fish caught per unit of effort). For example, survey abundance indices are used in analytical stock assessment models such as Stock synthesis models (Methot and Wetzel, 2013), in State-space assessment models (SAM, Nielsen and Berg, 2014; Berg and Nielsen, 2016) or in Stochastic surplus production model in continuous time (SPiCT, Pedersen and Berg, 2017). Equally important, surveys provide information about fish stocks such as the size and age distributions, the size-age relationships, the proportion of fish mature at each age, and information on their reproductive performance. For instance, the eastern Baltic cod (cod in ICES subdivisions 24-32) is currently assessed using an age-length based Stock synthesis model, where abundance indices from the Baltic International Trawl Surveys (BITS Q1 and Q4) are used. In this model, age-length keys are based on otolith readings from these surveys as well, and maturity and weight-length data are provided by the BITS Q1 survey (ICES, 2022b). In the case of the northern European hake (ICES subareas 4,6 and 7, and in divisions 3a, 8ab) the assessment is done using a length-based and sex-disaggregated Stock Synthesis model. In this model, several survey indices are used, including those from the western IBTS survey (i.e., from the French Southern Atlantic Bottom trawl survey (EVHOE-WIBTS-Q4), the Spanish Porcupine Bottom Trawl Survey (SpPGFS-WIBTS-Q3), the Irish Groundfish Survey (IGFS-WIBTS-Q4), the French surveys in the Bay of Biscay (FR-RESSGACQ)) and from the Irish Anglerfish and Megrim Survey (IAMS_IRL) (ICES, 2022c). For other species (e.g., data-limited species such as stocks in the ICES stock category 3), management advice relies solely on a survey trend-based assessment. Such assessments are “restricted to qualitative advice about whether the stock is trending up, down or is stable, and on whether the stock is approaching a possible trigger for management action (e.g., the lowest point in the abundance index time series)”. For this reason, these assessments cannot be used to provide advice on the absolute level of the fish stock or the direct effect of fishing on it. (ICES, 2012). For example, for the beaked redfish in Division 14b, the assessment is based only on the Greenland Groundfish Survey (GGS) abundance indices (ICES, 2022a).
The assessments are carried out by several expert working groups within ICES, NAFO, GFCM and the European Commission’s Scientific Technical and Economic Committee on Fisheries (STECF). A list of these groups can be found in Table 1.
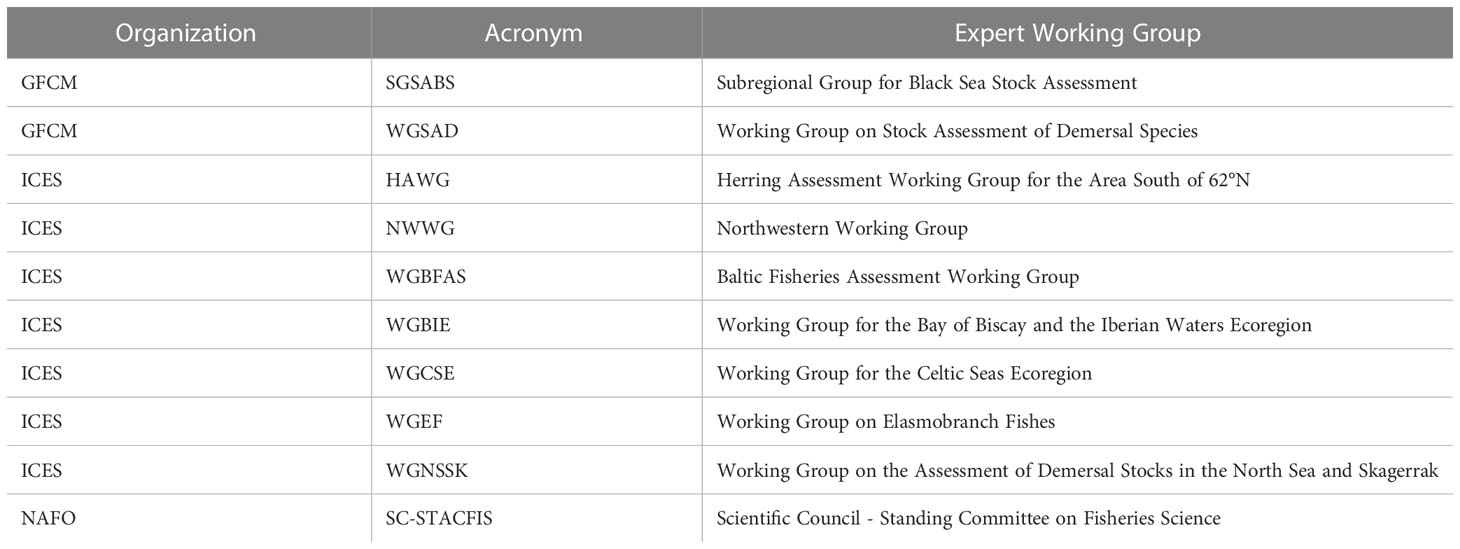
Table 1 Expert working groups involved in stock assessments that are related to bottom trawl surveys in the European Union.
At present, there are several genomic methods that could be used to estimate key parameters of fish populations, and possibly resolve some of the current difficulties and enhance the data collected for fisheries assessment. In this section, an overview of the most relevant methods is presented, namely, CKMR, eDNA, epigenetic age determination and other approaches, such as RAD-Seq.
Close-Kin Mark-Recapture (CKMR) is a method that was developed to estimate abundance and other demographic parameters (e.g., mortality rates and connectivity) from kinship relationships determined from genetic samples (Bravington et al., 2016a). This method is based in the traditional mark-recapture framework, where population size and other parameters can be estimated from marking experiments adequately designed for this purpose. In CKMR, however, DNA tags are used instead of traditional physical tags. With DNA tags, an individual is marked by its presence in the sample, and “recaptured” if one or more close relatives are also present (e.g., parents and offspring or siblings). The idea behind this is that finding relatives is less likely to occur in bigger populations, so the number of “recaptures” provides information on adult abundance (Bravington et al., 2016a)
Regarding trawl abundance indices, a fundamental problem is the unknown detection probability or catchability, which prevents from obtaining absolute abundance indices. Therefore, CKMR method represents a major advance that allows estimating absolute abundance, leading to a change in paradigm (Trenkel et al., 2022 and references therein). Until now, CKMR has allowed determining absolute abundance of several fish populations around the world, such as southern bluefin tuna (Bravington et al., 2016b), white sharks in eastern Australia and New Zealand (Hillary et al., 2018), brook trout in Nova Scotia (Ruzzante et al., 2019) and thornback ray in the Bay of Biscay (Trenkel et al., 2022). CKMR is also being considered to estimate abundance of other species like silky shark and bigeye tuna in the eastern Pacific Ocean (Maunder et al., 2021).
At present, CKMR has already produced significant progress in the stock assessment of some species. For example, in the case of southern bluefin tuna (Thunnus maccoyii), the stock assessment relies on CPUE from fisheries as a primary index of (relative) abundance (Bravington et al., 2016a). For this species, CKMR has demonstrated its ability for estimating three of the key parameters of fisheries stock assessments, namely, the absolute abundance of adults and total adult mortality and selectivity of the southern bluefin tuna stock. In this case, CKMR has been used as a stand-alone assessment framework that is independent of the catch and effort of southern bluefin tuna fisheries, avoiding the large uncertainties associated with the interpretation of the CPUE series derived from them. The results of CKMR for southern bluefin tuna have been already reviewed and accepted by the Scientific Committee of the Commission for the Conservation of Southern Bluefin Tuna (CCSBT). This method has been adopted by the CCSBT as a fisheries-independent method to monitor spawner abundance (Davies et al., 2020).
Another key parameter in fisheries stock assessment and management is natural mortality (M), because it directly affects estimates of stock productivity and reference points. This parameter is very difficult to estimate and has a large uncertainty associated, mainly because there is a lack of information and it is difficult to obtain unbiased data (e.g., age-composition in the absence of fishing). In practice, there are several approaches for estimating M (e.g., methods based on life history theory; empirical relationships; analysis of tagging data; analysis of catch-at-age data or estimation within integrated population models) (Maunder et al., 2023). At present, mark-recapture is considered one of the most reliable methods for estimating M, in spite of limitations such as such as non-reporting of tags, tag loss and tag-related behavioral changes and mortality. In this context, CKMR, is probably the most promising direct method to estimate M for stocks, because it avoids many of the problems associated with conventional tagging mentioned before (Maunder et al., 2023).
For further information about CKMR and its use for estimating fish population parameters, the reader is referred to the relevant articles that are also part of this Research Topic “Prospects and Challenges for the Implementation of HTS Genetic Methods in Fisheries Research Surveys and Stock Assessment”.
eDNA refers to DNA that can be extracted from environmental samples (e.g., soil, water or air), without first isolating any target organisms. eDNA is actually made up by a complex mixture of genomic DNA from many different organisms, and may be partly degraded (i.e., formed by small fragments of DNA molecules) (Taberlet et al., 2012). In recent years, eDNA has been increasingly applied to assess marine fish diversity (e.g., Fraija-Fernández et al., 2020; Zhou et al., 2022), as it is a non-invasive and cost-effective approach that yields good results (Miya, 2022), In addition to this, recent evidence suggests the concentration of eDNA could also be used to provide a rapid, cost-effective indicator of abundance and/or biomass for fisheries stock assessments (Rourke et al., 2022 and references therein). However, more research is needed before this tool can be routinely applied in the context of research surveys, because factors affecting eDNA concentrations in seawater (or sediment) need to be better understood. For example, it is known that biotic factors such as intraspecific variation in DNA production, shedding rates among individuals, metabolic rate and size of individuals affect the quantity of DNA that is released to the environment. Also, abiotic factors such as underwater currents or water temperature can affect DNA concentrations as well (Rourke et al., 2022). Genomic methods, such as eDNA, could help overcome some situations where survey approaches fail and may produce more reliable data than research surveys in such cases. For instance, in trawl surveys, the catch may not be representative of the true abundance and biomass of fish in a determined area (Thomsen et al., 2016). This is because no trawl gear samples all the individuals present in its path, and catch rates of fish of different species and size in a given fishing gear vary considerably. The availability of fish to the trawl gear is affected by several factors, such as: daily variations of the vertical distributions that occur in many species, the behavior of fish ahead of the trawl gear (some are herded into the net by the otter boards while others show net-avoidance behavior), the size and shape of the fish, their swimming endurance, etc. (Fraser et al., 2007 and references therein). When considering all this, it is possible that genomic methods could provide more accurate information than traditional surveys. For example, Thomsen et al. (2016) showed that the estimated abundance of Greenland sharks in the continental slope in Southwest Greenland using eDNA was much higher than the one calculated from the trawling data. Given that Greenland sharks are considered to be highly abundant in the surveyed area (Nielsen et al., 2014), the authors suggest that the ability of these sharks for escaping from the trawling net must be affecting the estimated abundance from the trawl survey. So, in this case, the results from using eDNA methodology appeared to reflect shark abundance more accurately. Moreover, it is difficult to obtain trawl-based abundance estimates for those stocks closer to the shore, because rocky coasts or shallow waters are not accessible to trawling. For these situations, eDNA could improve existing fish stock monitoring programs (Knudsen et al., 2019). Other studies have demonstrated that eDNA was able to detect species that were missed by trawling. Mostly, these were species that are anadromous, pelagic, small, rare, or those inhabiting rocky and muddy areas. This evidences the limited ability of trawl surveys to capture taxa in certain types of habitats, or fish at different life stages, sizes, and behaviors, whereas eDNA can in theory detect fish in any type of habitat, regardless of their swimming behaviors and sizes once the eDNA metabarcoding protocols are well-established (Afzali et al., 2021). Nevertheless, there are still insufficient studies where the efficacy of traditional methods (surveys) versus genomic methods has been formally compared. To the present, most of these studies have been focused on eDNA metabarcoding (i.e., biodiversity approach). For example, the study carried out by Thomsen et al. (2016) demonstrated that eDNA results are equivalent to catch data obtained from trawling: In total, 26 fish families were detected by both methods, while three families were only detected using eDNA and two families only by trawling. While eDNA was able to identify species that are not commonly observed in the trawling nets, trawling detected other taxa that were not recognized at the species level by eDNA. As a matter of fact, different studies suggest that traditional surveys and eDNA metabarcoding are complementary, because they offer a broader picture of marine biodiversity (Deiner et al., 2017; Evans et al., 2017; Gillet et al., 2018; Stat et al., 2019).
A detailed explanation of how eDNA works and its application for fisheries assessment in marine environments is available in the article by Ramírez-Amaro et al. (2022) and other relevant articles in this Research Topic: “Prospects and Challenges for the Implementation of HTS Genetic Methods in Fisheries Research Surveys and Stock Assessment”.
Epigenetic age determination is based on the clock-like patterns of change in DNA methylation that occur at particular cytosine-guanine dinucleotides in the genome (i.e., CpG sites). At these sites, the proportion of methylated copies of the genome in the cells from a particular tissue sample either progressively increases or decreases across the life span (Guevara and Lawler, 2018). Chronological age predictors built from DNA methylation are termed ‘epigenetic clocks’ (Zhang et al., 2019). Regarding age estimation, epigenetic clocks could provide an accurate alternative method for aging fish and overcome the limitations of the current methods (e.g., otolith readings). At present, epigenetic clocks have been built for a few marine species (e.g., seabass, Anastasiadi and Piferrer, 2020) but further evidence is needed to validate its use across different fish species. In the future, development of universal epigenetic clocks that are evolutionary conserved across a broad range of fish species should be explored, as this would provide a fast, reader-independent tool for ageing fishes that are sampled in bottom trawl surveys. Epigenetic age determination may offer a solution for obtaining accurate age structure of monitored fish stock in cases where traditional otolith reads is challenging. It must be considered that many teleost fish species do not show otolith growth increments or other phenotypic features related to age, complicating monitoring of the population dynamics for those species (Mayne et al., 2020 and references therein). Also, extracting otoliths for age estimation is a lethal procedure and is undesirable in the case of endangered, threatened and protected species. In addition, age estimates that are based on counting otolith increments may be affected by large biases and uncertainties due to the combination of processing and interpretation errors. Such errors are then carried on into the growth and mortality estimates and other demographic rates required for population dynamics models (Dortel et al., 2013). This is the case of the Atlantic cod (Gadus morhua) in the eastern Baltic Sea, for which ageing uncertainty has led to failed analytical stock assessment, greatly affecting the management of the stock between 2014 and 2019 (Heimbrand et al., 2020 and references therein). Therefore, developing epigenetic clocks for target species could have a major impact since it will likely provide an accurate method to assess age in fish and circumvent the limitations of the current methods. In this sense, epigenetic age determination could also open the possibility of using advanced stock assessment models in species where age determination has been shown to be difficult (e.g., European hake – Merluccius merluccius, or monkfish – Lophius spp.) (ICES, 2021). Moreover, epigenetic age determination is non-lethal, which makes it very attractive in the case of threatened species, such as sharks. A detailed explanation of the method to determine age using epigenetics and its applications in fisheries management and conservation biology is available in Piferrer and Anastasiadi (2023).
In fisheries management, genomics has been successfully used to define fish stocks and quantify the extent of adaptive divergence and connectivity between them, also allowing performing mixed-stock analysis with substantially increased resolution (Bernatchez et al., 2017). Genomic high-throughput methods are now enabling the discovery and genotyping of thousands of genetic markers for all kinds of species at affordable costs, including non-model organisms. Because of this, these methods are revolutionizing ecological, evolutionary and conservation genetics (Andrews et al., 2016). The availability of thousands of molecular markers to representing the genome, has greatly expanded the number of characters available for stock identification, improving also our understanding of genetic geographical variation. In addition, more variable genetic markers have been developed offering a greater sensitivity for detecting genetic differences among groups. For example, genetic differences have been found within many coastal and oceanic species that were initially considered to be genetically homogeneous (Cadrin, 2020 and references therein).
In this context, restriction site-associated DNA sequencing (RAD-seq) has been increasingly applied to analyze genome-wide diversity of fish populations using thousands of genetic markers called single nucleotide polymorphisms (SNPs). RAD-Seq is a fractional genome sequencing strategy that is designed to interrogate anywhere from 0.1 to 10% of a selected genome, instead of analyzing the whole genome. RAD-Seq works by first fragmenting the target genome using a restriction enzyme. After digestion, DNA is transformed into a pool of DNA of fragments (i.e., library) suitable for use on a sequencing platform (e.g., Illumina). Sequence data are then analyzed to identify and score genetic variations in the samples or population of interest. Parallel screening of the thousands of markers derived from RAD-Seq allow then researchers to map natural variation and induced mutations (Floragenex, 2015).
In the context of fisheries, differences of RAD-Seq‐derived SNP frequencies can be analyzed to define stock structure. For instance, the population structure of European hake was analyzed in samples from the Mediterranean Sea, the northwestern Iberian Peninsula (southern stock), the eastern Bay of Biscay (northern stock), and the Norwegian Sea (northern stock) using RAD-seq (Leone et al., 2019). The study indicated that hake in the Norwegian Sea is genetically different from that of the rest of the locations under study and confirmed differentiation of Mediterranean and northeast Atlantic locations. However, samples from the eastern Bay of Biscay and the northwestern Iberian Peninsula were not found to be genetically different. These results imply that samples from the northern stock belong to different genetic populations, and that samples belonging to locations included in the northern and southern stocks are part of a single genetically homogeneous population. This information can help improving management of European hake by defining more meaningful management units. In the Northeast Atlantic, assessment and management of the European hake is currently done independently for two stocks (southern and northern), separated by the Capbreton Canyon. However, as shown by the results of that study, the southern stock and the southern part of the northern stock should be assessed jointly.
Thus, RAD-Seq and similar approaches can help improve stock assessments mainly by providing better information of stock identity, their spatial boundaries and connectivity between different stocks. Generally, including spatial structure in assessments when the available evidence indicates stock heterogeneity leads to less bias in estimates of management interest, even if resulting in less precision. In addition, failure to include spatial and stock structure in the management of fisheries can lead to overexploitation of local populations (Punt et al., 2020 and references therein). Nevertheless, incorporating spatial and stock structure into stock assessments is still challenging. Using spatial models leads to more complex population dynamics models, requiring additional parameters that describe movement, the spatial allocation of recruitment and, potentially, spatial variation in biological parameters (especially growth rates) (Punt, 2019). Moreover, including movement among spatial areas introduces another dimension of flexibility that will be confounded with natural mortality, growth, selectivity, and recruitment. Thus, future stock assessment packages will need to provide tools to diagnose and control this confounding to provide accurate assessments (Punt et al., 2020).
Screening of SNPs could be also used to search for sex markers that would allow sexing fish individuals. Such genomic-based sex markers would be useful for developing simple sex identification assays for species or developmental stages (e.g., eggs and larvae) where sex of the individuals is not identifiable. In addition, the sex of the younger juveniles cannot be assigned using traditional methods in those species that lack sexual dimorphism. Sex determination using RAD-Seq would allow us to determine the sex of such individuals, and for larger specimens as well, with the advantage of being non-lethal (important for protected, endangered or threatened species, for example). At present, genomic markers for sex have been identified in a variety of fish species. For example, in the Atlantic halibut (Hippoglossus hippoglossus), a major sex determining locus has been identified and assays for 10 SNPs with significant association with phenotypic sex have been used to distinguish males and females successfully (Palaiokostas et al., 2013). RAD-Seq has also been used to identify a male specific genomic region in Atlantic cod and to identify positions in the genome that displayed significant differences in read depth between males and females (Kirubakaran et al., 2019). A diagnostic test to determine gender, using a simple PCR reaction, was also developed in that same study.
So far, RAD-seq has been the most popular approach for population genomics of non-model organisms. However, one of the main limitations of this method is that large stretches of the genome between markers remain unsampled and signatures of selection and adaptive divergence that are highly localized in the genome can be missed (Lou et al., 2021 and references therein). Thus, whole genome sequencing approaches are increasingly being used to overcome this limitation. For example, a recent study used whole-genome screening to investigate the population structure of Greenland halibut (Reinhardtius hippoglossoides) in the NW Atlantic. This approach allowed identifying a weak but significant divergence between Greenland Halibut from the Gulf of Saint Lawrence and those from the rest of locations analyzed in the Northwest Atlantic (Ferchaud et al., 2022). In this case, whole-genome sequencing allowed finding all the SNPs that were differentiated, including those in the very restricted genomic regions that explained most of the differentiation between the two stocks. The authors of the study highlight that a restricted approach (such as RAD-Seq) would have likely missed such narrow regions, potentially leading to a lower average differentiation.
Stock assessments are continuously improving, mainly due to methodological and computational advances (Punt et al., 2020), but also due to improvements in data collection that allow better estimates of stock parameters. In this context, the information coming from genomic methods, such as abundance estimates (CKMR, eDNA), mortality rates (CKMR), age (epigenetics) and sex (RAD-Seq) determination and stock substructure (RAD-Seq) has the potential to improve stock assessments. In general, the use of genomic approaches can improve stock assessments by allowing, facilitating or improving estimation of key parameters and by providing insights of stock structure and connectivity. However, this does not necessarily mean that these approaches will end up substituting traditional data collection. The set of traditional methods is the outcome of a long process of adaptation to the goals and needs of stock assessments, while genomic methodologies are scientific developments which still need to follow further innovation steps for fitting them with the stock assessment specific needs. It is expected that genomic methods, once fully developed and tuned, will be able to provide more accurate data on their fields of application than traditional methods. Nevertheless, the improved accuracy of the genomic methods regarding traditional approaches is yet to be demonstrated in a variety of scenarios. Data obtained from genomic methods cannot be implemented in stock assessment if their accuracy is lower than that from traditional methods. In such a case, its implementation would incorporate a great uncertainty in the stock assessment. Thus, thorough research on genomic accuracy and precision in comparison with traditional methods is required for each of the stocks where the genomic methods can be expected to be implemented.
Also, the type of data that can be collected by using the different approaches varies. For example, the size structure of a fish population can be determined in a traditional survey by measuring the length of fish samples, however, no genomic method is capable of determining size structure because the length of a fish cannot be determined by genomic analysis. When comparing the type of data that can be obtained using traditional methodology and genomic methods (see Table 2), it is evident that genomic methods do not provide all the parameters that traditional methods are able to provide for the stock assessment of targeted species. Traditional surveys, in addition, provide information for monitoring the general conditions of the marine environment (e.g., marine litter and pollutants). Most notably, genomic methods do not provide information on size structure and maturity, and there are difficulties for estimating abundance-at-age.
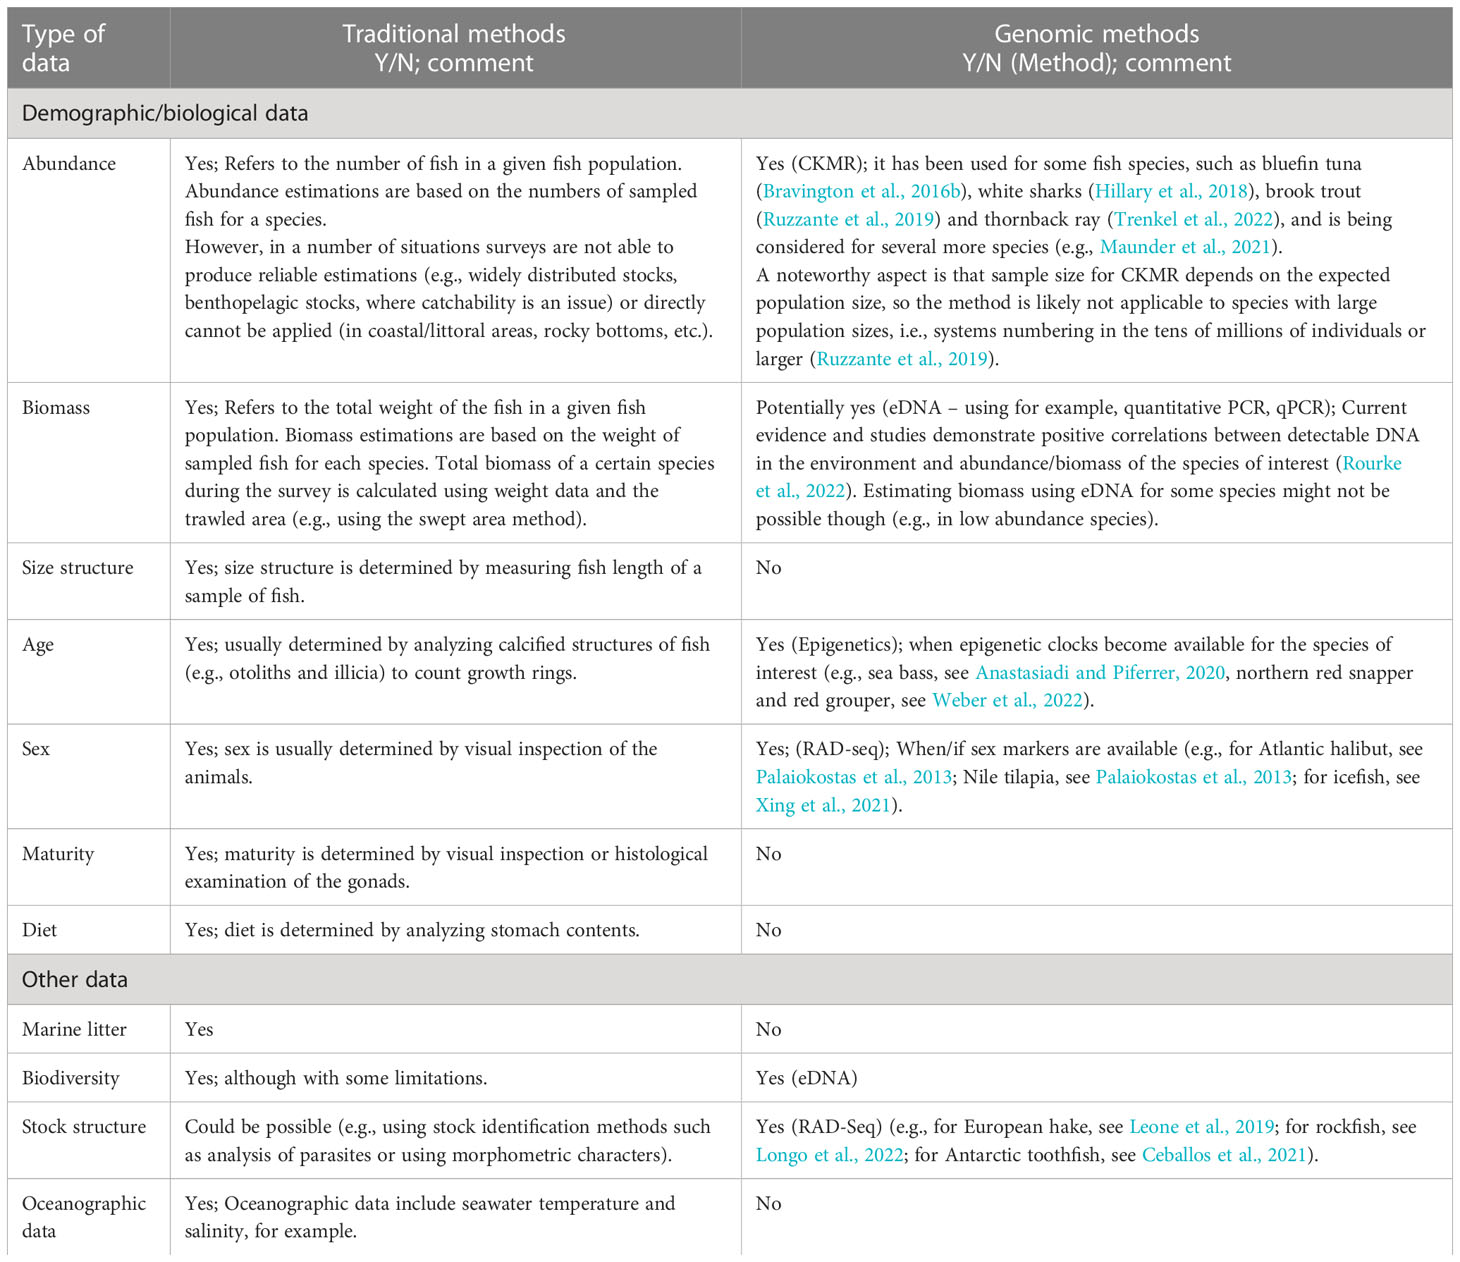
Table 2 Information provided by the traditional fisheries surveys, compared with the potential information provided by genomic methods.
It is clear that traditional methods show a number of difficulties in relation to data collection and stock assessment that genomic methods may help to overcome. But at present, substituting traditional methods with genomic methods would lead to a loss of information, and both methodologies seem to be rather complementary than substitutes. For instance, the few assessments based on the CKMR methodology (e.g., Bravington et al., 2016a; Ruzzante et al., 2019; Marcy-Quay et al., 2020) also required traditional parameters (e.g., length-based estimated age or sex).
From the above, it stands out that data collection, in terms of quantity and quality, would benefit from complementing traditional surveys with genomic methods. The next question that arises is: How can genomic methods be implemented into the already existing traditional surveys? To answer this, two options could be considered: the first would be to implement directly genomic methods into existing surveys. This would mean adding the collection of tissue and water/sediment samples required by genomic methods on top of the already existing activities in the survey, but without altering the survey program (i.e., survey duration, number of sampled stations, etc.). The second option would be to re-structure the surveys, for example, by reducing sampling effort using traditional methodology and giving genomic methods their own space in the survey.
The first option can be considered for surveys with sufficient resources —mainly, scientific staff and storage capacity, given that the extraction of samples for the genomic analysis does not require significant additional equipment and/or consumables onboard. In these cases, integrating the tissue sample collection for genetic analysis into the regular survey work can provide a solution to this without increasing costs significantly. However, even if costs do not increase during the survey itself, the processing and analysis of samples using genomic methods is still costly and would add up to the already expensive survey. The second option (restructuring the survey) could be considered when data collection for genomic methods cannot be directly implemented on an existing survey or if cost reduction is necessary. In that case, the survey would need to be restructured, so that dedicated resources (e.g., scientific/technical staff time) can be reorganized to gather samples for both traditional and genomic methods. For example, in the case of a particular survey which could be reduced from 30 days to 20 days, the first 5 days could be dedicated to collect eDNA samples and the remaining 15 days to collect biological samples (for genomics, size structure, age, sex and maturity) but from fewer stations (due to fewer days available). This could reduce the total survey cost, but not without several consequences regarding the quantity and quality of the data obtained. According to ICES (2020), reductions in survey effort (i.e., number of sampled stations, tow duration, survey frequency) can have consequences on many aspects of the information produced from surveys. These consequences not only may affect stock assessments, but would also have an impact on fisheries management, ecosystem indicators, and fisheries research (e.g., loss of data on ecosystem indicators, loss of non-target fish and invertebrates’ abundance data, loss of food habits information needed for multispecies ecosystem models, loss of platforms for novel studies, etc.).
Another possibility worth exploring is complementing traditional surveys with genomic data obtained using commercial fishing vessels. For example, Russo et al. (2021) have investigated the possibility of assessing catch composition of single hauls carried out by trawlers by applying eDNA metabarcoding to the dense water draining from fishing nets just after the end of hauling operations (i.e., slush). In that study, the authors demonstrate that the fish assemblages identified using eDNA in the slush reflected those determined by visual inspection of net content (approx. 71% of species and 86% of families of fish) and detected a strong relationship between read counts and species abundances in the catch. Thus, this approach could be upscaled to serve as a powerful source of information on the structure of demersal assemblages and the impact of fisheries. Following that line, Maiello et al. (2022) designed a customized low-cost 3D-printed plastic probe that, placed inside the trawl net, serves as a container for rolls of gauze that are positioned to capture DNA from the during fishing operations. Their results strengthen the idea that eDNA-based biomonitoring can become embedded in fishery-dependent surveys, at negligible additional cost and effort, to study catch composition and the broader faunal features of the ecosystems that sustain commercial fishing.
As already mentioned, fish stock assessments have been evolving over time due to several reasons, for example, due to improvements in computational approaches, advances in methods for fitting models to data, and the need to not only provide best estimates of model parameters and outputs but also to quantify the uncertainties associated with the estimates (Punt et al., 2020). However, the incorporation of genomic data into these methods will necessarily mean that assessment methods must be also adapted to be able to handle these data. In fact, some experts already consider that one of the necessary improvements for a next-generation stock assessment package in the next 5-15 years is to ensure its ability for handling genetic data, and in particular, to be able to use close-kin mark-recapture data (Punt et al., 2020).
In conclusion, in the short and medium-term, it does not seem feasible to implement directly genomic tools into data collection and stock assessment, given that stock assessment accuracy requires a certain length and stability of the data time series. However, given the growing evidence of the utility of genomic tools in the stock assessment context, it is necessary to devise a roadmap to implement such tools in the future. The guideline for future implementation could be based on the evolution of the cost-efficiency and on further evidence of precision and accuracy gains.
RR-M and FS-R: conceived the article. RR-M: wrote the article. FS-R: reviewed the article. All authors contributed to the article and approved the submitted version.
The information and views set out in this publication are based on scientific data and information collected under Service Contract “Improving cost-efficiency of fisheries research surveys and fish stocks assessments using next-generation genetic sequencing methods [EMFF/2018/015]” signed with the European Climate, Infrastructure and Environment Executive Agency (CINEA) and funded by the European Union.
The information and views set out in this publication are based on scientific data and information collected under Service Contract “Improving cost-efficiency of fisheries research surveys and fish stocks assessments using next-generation genetic sequencing methods [EMFF/2018/015]” signed with the European Climate, Infrastructure and Environment Executive Agency (CINEA) and funded by the European Union. The information and views set out in this publication are those of the author(s) and do not necessarily reflect the official opinion of CINEA or of the European Commission. Neither CINEA nor the European Commission can guarantee the accuracy of the scientific data/information collected under the above Specific Contract or the data/information included in this publication. Neither CINEA nor the European Commission or any person acting on their behalf may be held responsible for the use which may be made of the information contained therein. RR-M would like to thank Carmen Blanco Tilve for her help editing some parts of the manuscript.
The authors declare that the research was conducted in the absence of any commercial or financial relationships that could be construed as a potential conflict of interest.
All claims expressed in this article are solely those of the authors and do not necessarily represent those of their affiliated organizations, or those of the publisher, the editors and the reviewers. Any product that may be evaluated in this article, or claim that may be made by its manufacturer, is not guaranteed or endorsed by the publisher.
The Supplementary Material for this article can be found online at: https://www.frontiersin.org/articles/10.3389/fmars.2023.1095171/full#supplementary-material
Afzali S. F., Bourdages H., Laporte M., Mérot C., Normandeau E., Audet C., et al. (2021). Comparing environmental metabarcoding and trawling survey of demersal fish communities in the Gulf of St. Lawrence, Canada. Environmental DNA 3, 1, 22–42. doi: 10.1002/edn3.111
Anastasiadi D., Piferrer F. (2020). A clockwork fish: age prediction using DNA methylation-based biomarkers in the European seabass. Mol. Ecol. Resour. 20, 287–397. doi: 10.1111/1755-0998.13111
Andrews K. R., Good J. M., Miller M. R., Luikart G., Hohenlohe P. A. (2016). Harnessing the power of RADseq for ecological and evolutionary genomics. Nat. Rev. Genet. 17 (2), 81–92. doi: 10.1038/nrg.2015.28
Berg C. W., Nielsen A. (2016). Accounting for correlated observations in an age-based state-space stock assessment model. ICES J. Mar. Sci. 73 (7), 1788–1797. doi: 10.1093/icesjms/fsw046
Bernatchez L., Wellenreuther M., Araneda C., Ashton D. T., Barth J. M., Beacham T. D., et al. (2017). Harnessing the power of genomics to secure the future of seafood. Trends Ecol. Evol. 32 (9), 665–680. doi: 10.1016/j.tree.2017.06.010
Bravington M. V., Grewe P. M., Davies C. R. (2016b). Absolute abundance of southern bluefin tuna estimated by close-kin mark-recapture. Nat. Commun. 7, 13162. doi: 10.1038/ncomms13162
Bravington M. V., Skaug H. J., Anderson E. C. (2016a). Close-kin mark-recapture. Stat. Sci. 31 (2), 259–274. doi: 10.1214/16-STS552
Cadrin S. X. (2020). Defining spatial structure for fishery stock assessment. Fish. Res. 221, 105397. doi: 10.1016/j.fishres.2019.105397
Cadrin S. X., Dickey-Collas M. (2015). Stock assessment methods for sustainable fisheries. ICES J. Mar. Sci. 72 (1), 1–6. doi: 10.1093/icesjms/fsu228
Ceballos S. G., Papetti C., Babbucci M., Fernández D. A., Schiavon L., Cheng C. H. C. (2021). Genome-wide analysis reveals striking lack of genetic differentiation over long distances for the Antarctic toothfish Dissostichus mawsoni: high genetic connectivity or shared spawning grounds? Fish. Res. 243, 106074. doi: 10.1016/j.fishres.2021.106074
Cooper A. B. (2006). A guide to fisheries stock assessment: from data to recommendations (Durham, USA: University of New Hampshire/New Hampshire Sea Grant College Program - NOAA), 44.
Davies C., Bravington M., Eveson P., Lansdell M., Aulich J., Grewe P. (2020). Next-generation close-kin mark recapture: using SNPs to identify half-sibling pairs in southern bluefin tuna and estimate abundance, mortality and selectivity. technical report Vol. 52 (Hobart, Australia: Fisheries research and Development Corporation and CSIRO, Australia).
Deiner K., Bik H. M., Mächler E., Seymour M., Lacoursière-Roussel A., Altermatt F., et al. (2017). Environmental DNA metabarcoding: transforming how we survey animal and plant communities. Mol. Ecol. 26 (21), 5872–5895. doi: 10.1111/mec.14350
Dortel E., Massiot-Granier F., Rivot E., Million J., Hallier J. P., Morize E., et al. (2013). Accounting for age uncertainty in growth modeling, the case study of yellowfin tuna (Thunnus albacares) of the Indian ocean. PloS One 8 (4), e60886. doi: 10.1371/journal.pone.0060886
Evans N. T., Li Y., Renshaw M. A., Olds B. P., Deiner K., Turner C. R., et al. (2017). Fish community assessment with eDNA metabarcoding: effects of sampling design and bioinformatic filtering. Can. J. Fish. Aquat. Sci. 74 (9), 1362–1374. doi: 10.1139/cjfas-2016-0306
Ferchaud A. L., Normandeau E., Babin C., Præbel K., Hedeholm R., Audet C., et al. (2022). A cold-water fish striving in a warming ocean: insights from whole-genome sequencing of the Greenland halibut in the Northwest Atlantic. Front. Mar. Sci. 9. doi: 10.3389/fmars.2022.992504
Feron R., Pan Q., Wen M., Imarazene B., Jouanno E., Anderson J., et al. (2021). RADSex: a computational workflow to study sex determination using restriction site-associated DNA sequencing data. Mol. Ecol. Resour. 21 (5), 1715–1731. doi: 10.1111/1755-0998.13360
Ficetola G. F., Miaud C., Pompanon F., Taberlet P. (2008). Species detection using environmental DNA from water samples. Biol. Lett. 4 (4), 423–425. doi: 10.1098/rsbl.2008.0118
Floragenex (2015). Technical brief: RAD-sequencing (Beaverton, Oregon, USA: Floragenex Inc). Available at: https://static1.squarespace.com/static/542f1ecee4b0a7afa8674662/t/555b7a68e4b014a961e564b3/1432058472478/2015+RAD-Seq+Technical+Whitepaper+v1.0.pdf.
Fraija-Fernández N., Bouquieaux M. C., Rey A., Mendibil I., Cotano U., Irigoien X., et al. (2020). Marine water environmental DNA metabarcoding provides a comprehensive fish diversity assessment and reveals spatial patterns in a large oceanic area. Ecol. Evol. 10 (14), 7560–7584. doi: 10.1002/ece3.6482
Fraser H. M., Greenstreet S. P. R., Piet G. J. (2007). Taking account of catchability in groundfish survey trawls: implications for estimating demersal fish biomass. ICES J. Mar. Sci. 64, 1800–1819. doi: 10.1093/icesjms/fsm145
Gamble T. (2016). Using RAD-seq to recognize sex-specific markers and sex chromosome systems. Mol. Ecol. 25, 2114–2116. doi: 10.1111/mec.13648
Gillet B., Cottet M., Destanque T., Kue K., Descloux S., Chanudet V., et al. (2018). Direct fishing and eDNA metabarcoding for biomonitoring during a 3-year survey significantly improves number of fish detected around a South East Asian reservoir. PloS One 13 (12). doi: 10.1371/journal.pone.0208592
Guevara E. E., Lawler R. R. (2018). Epigenetic clocks. Evolutionary anthropology: issues, news, and reviews. Evol. Anthropol. 27, 6, 256–260. doi: 10.1002/evan.21745
Gursoy C., Tarkan A. S., Acipinar H., Gaygusuz O. (2005). Validation of the scales for age determination in a cyprinid, Scardinius erythrophthalmus (L. 1758). Int. J. Zoological Res. 1 (1), 33–36. doi: 10.3923/ijzr.2005.33.36
Heimbrand Y., Limburg K. E., Hüssy K., Casini M., Sjöberg R., Palmén Bratt A. M., et al. (2020). Seeking the true time: exploring otolith chemistry as an age-determination tool. J. Fish Biol. 97 (2), 552–565. doi: 10.1111/jfb.14422
Hillary R. M., Bravington M. V., Patterson T. A., Grewe P., Bradford R., Feutry P., et al. (2018). Genetic relatedness reveals total population size of white sharks in eastern Australia and New Zealand. Sci. Rep. 8, 2661. doi: 10.1038/s41598-018-20593-w
Horvath S., Raj K. (2018). DNA Methylation-based biomarkers and the epigenetic clock theory of ageing. Nat. Rev. Genet. 19 (6), 371–384. doi: 10.1038/s41576-018-0004-3
Hüssy K., Hinrichsen H. H., Fey D. P., Walther Y., Velasco A. (2010). The use of otolith microstructure to estimate age in adult Atlantic cod, Gadus morhua. J. Fish Biol. 76 (7), 1640–1654. doi: 10.1111/j.1095-8649.2010.02602.x
ICES (2012). Report on the classification of stock assessment methods developed by SISAM. ICES CM 2012/ACOM/SCICOM:01, 15.
ICES (2019). SISP 14 - Manual for the Offshore Beam Trawl Surveys (WGBEAM). Series of ICES Survey Protocols (2012–2020). Report. 54. doi: 10.17895/ices.pub.5353
ICES (2020). ICES Workshop on Unavoidable Survey Effort Reduction (WKUSER). ICES Sci. Rep. 2 (72), 92. doi: 10.17895/ices.pub.7453
ICES (2021). Workshop on tools and development of stock assessment models using a4a and stock synthesis (WKTADSA). ICES Sci. Rep. 3 (33), 197. doi: 10.17895/ices.pub.8004
ICES (2022a). “Beaked redfish (Sebastes mentella) in division 14.b, demersal (Southeast Greenland),” in In report of the ICES Advisory Committe. ICES advice 2022 (Copenhagen, Denmark: ICES), reb.27.14b. Available at: https://www.ices.dk/community/groups/Pages/WGBIE.aspx.
ICES (2022b). Cod (Gadus morhua) in subdivisions 24–32, eastern Baltic stock (eastern Baltic sea). In report of the ICES Advisory Committe. ICES advice 2022 (Copenhagen, Denmark: ICES), cod.27.24–32. doi: 10.17895/ices.advice.19447874
ICES (2022c). Hake (Merluccius merluccius) in subareas 4, 6, and 7, and in divisions 3.a, 8.a–b, and 8.d, northern stock (Greater North Sea, Celtic seas, and the Northern Bay of Biscay). in report of the ICES Advisory Committe. ICES advice 2022, hke.27.3a46-8abd. (Copenhagen, Denmark: ICES). doi: 10.17895/ices.advice.19448012
Kirubakaran T. G., Andersen Ø., De Rosa M. C., Andersstuen T., Hallan K., Kent M. P., et al. (2019). Characterization of a male specific region containing a candidate sex determining gene in Atlantic cod. Sci. Rep. 9 (1), 1–9. doi: 10.1038/s41598-018-36748-8
Knudsen S. W., Ebert R. B., Hesselsøe M., Kuntke F., Hassingboe J., Mortensen P. B., et al. (2019). Species-specific detection and quantification of environmental DNA from marine fishes in the Baltic Sea. J. Exp. Mar. Biol. Ecol. 510, 31–45. doi: 10.1016/j.jembe.2018.09.004
Leone A., Álvarez P., García D., Saborido-Rey F., Rodriguez-Ezpeleta N. (2019). Genome-wide SNP based population structure in European hake reveals the need for harmonizing biological and management units. ICES J. Mar. Sci. 76 (7), 2260–2266. doi: 10.1093/icesjms/fsz161
Ligas A., Pierattini C., Viva C., Bertolini D., Belcari P. (2011). Age estimation and growth of European hake, Merluccius merluccius (Linnaeus 1758), in the northern Tyrrhenian Sea. Atti Della Societa Toscana Di Sci. Naturali Memorie Serie B. 118, 9–14. doi: 10.2424/ASTSN.M.2011.16
Longo G. C., Harms J., Hyde J. R., Craig M. T., Ramón-Laca A., Nichols K. M. (2022). Genome-wide markers reveal differentiation between and within the cryptic sister species, sunset and vermilion rockfish. Conserv. Genet. 23 (1), 75–89. doi: 10.1007/s10592-021-01397-4
Lou R. N., Jacobs A., Wilder A. P., Therkildsen N. O. (2021). A beginner’s guide to low-coverage whole genome sequencing for population genomics. Mol. Ecol. 30 (23), 5966–5993. doi: 10.1111/mec.16077
Maiello G., Talarico L., Carpentieri P., De Angelis F., Franceschini S., Harper L. R., et al. (2022). Little samplers, big fleet: eDNA metabarcoding from commercial trawlers enhances ocean monitoring. Fish. Res. 249, 106259. doi: 10.1016/j.fishres.2022.106259
Marcy-Quay B., Sethi S. A., Therkildsen N. O., Kraft C. E. (2020). Expanding the feasibility of fish and wildlife assessments with close-kin mark–recapture. Ecosphere Freshw. Ecol. 11 (10), e03259. doi: 10.1002/ecs2.3259
Maunder M. N., Hamel O. S., Lee H. H., Piner K. R., Cope J. M., Punt A. E., et al. (2023). A review of estimation methods for natural mortality and their performance in the context of fishery stock assessment. Fish. Res. 257, 106489. doi: 10.1016/j.fishres.2022.106489
Maunder M. N., Piner K. R. (2015). Contemporary fisheries stock assessment: many issues still remain. ICES J. Mar. Sci. 72 (1), 7–18. doi: 10.1093/icesjms/fsu015
Maunder M. N., Xu H., Schaefer K. M., Fuller D. W. (2021). Inter-American tropical tuna commission scientific Advisory Committee 12th meeting (Inter-American Tropical Tuna Commission – Scientific Advisory Committee), 41.
Mayne B., Korbie D., Kenchington L., Ezzy B., Berry O., Jarman S. (2020). A DNA methylation age predictor for zebrafish. Aging 12, 24817–24835. doi: 10.18632/aging.202400
Methot R. D. Jr., Wetzel C. R. (2013). Stock synthesis: a biological and statistical framework for fish stock assessment and fishery management. Fisheries Res. 142, 86–99. doi: 10.1016/j.fishres.2012.10.012
Miya M. (2022). Environmental DNA metabarcoding: a novel method for biodiversity monitoring of marine fish communities. Annu. Rev. Mar. Sci. 14 (1), 161–185. doi: 10.1146/annurev-marine-041421-082251
Morales-Nin B., Tores G. J., Lombarte A., Recasens L. (1998). Otolith growth and age estimation in the European hake. J. Fish Biol. 53 (6), 1155–1168. doi: 10.1111/j.1095-8649.1998.tb00239.x
Nielsen A., Berg C. W. (2014). Estimation of time-varying selectivity in stock assessments using state-space models. Fish. Res. 158, 96–101. doi: 10.1016/j.fishres.2014.01.014
Nielsen J., Hedeholm R. B., Simon M., Steffensen J. F. (2014). Distribution and feeding ecology of the Greenland shark (Somniosus microcephalus) in Greenland waters. Polar Biol. 37, 37–46. doi: 10.1007/s00300-013-1408-3
NMFS (2001) Marine fisheries stock assessment improvement plan. Report of the National Marine Fisheries Service - National Task Force for Improving fish stock assessments. U.S. Dep. Commerce, NOAA Tech. Memo. NMFS-F/SPO-56, 69 p., 25 appendices. Available at: https://spo.nmfs.noaa.gov/sites/default/files/tm56.pdf.
NOAA (2012) Population assessments: fish stocks. Available at: https://www.fisheries.noaa.gov/topic/population-assessments/fish-stocks.
Palaiokostas C., Bekaert M., Davie A., Cowan M. E., Oral M., Taggart J. B., et al. (2013). Mapping the sex determination locus in the Atlantic halibut (Hipoglossus hippoglossus) using RAD sequencing. BMC Genomics 14 (1), 1–12. doi: 10.1186/1471-2164-14-566
Piferrer F., Anastasiadi D. (2023). Age estimation in fishes using epigenetic clocks: applications to fisheries management and conservation biology. Front. Mar. Sci. 10. doi: 10.3389/fmars.2023.1062151
Pedersen M. W., Berg C. W. (2017). A stochastic surplus production model in continuous time. Fish Fish. 18 (2), 226–243. doi: 10.1111/faf.12174
Punt A. E. (2019). Spatial stock assessment methods: a viewpoint on current issues and assumptions. Fish. Res. 213, 132–143. doi: 10.1016/j.fishres.2019.01.014
Punt A. E., Dunn A., Elvarsson B. Þ., Hampton J., Hoyle S. D., Maunder M. N., et al. (2020). Essential features of the next-generation integrated fisheries stock assessment package: a perspective. Fish. Res. 229, 105617. doi: 10.1016/j.fishres.2020.105617
Ramírez-Amaro S., Bassitta M., Picornell A., Ramon C., Terrasa B. (2022). Environmental DNA: state-of-the-art of its application for fisheries assessment in marine environments. Front. Mar. Sci., 2348. doi: 10.3389/fmars.2022.1004674
Rourke M. L., Fowler A. M., Hughes J. M., Broadhurst M. K., DiBattista J. D., Fielder S., et al. (2022). Environmental DNA (eDNA) as a tool for assessing fish biomass: a review of approaches and future considerations for resource surveys. Environ. DNA 4 (1), 9–33. doi: 10.1002/edn3.185
Russo T., Maiello G., Talarico L., Baillie C., Colosimo G., D’Andrea L., et al. (2021). All is fish that comes to the net: metabarcoding for rapid fisheries catch assessment. Ecol. Appl. 31 (2), e02273. doi: 10.1002/eap.2273
Ruzzante D. E., McCracken G. R., Førland B., MacMillan J., Notte D., Buhariwalla C., et al. (2019). Validation of close-kin mark–recapture (CKMR) methods for estimating population abundance. Methods Ecol. Evol. 10, 1445–1453. doi: 10.1111/2041-210X.13243
Spedicato M. T., Massutí E., Mérigot B., Tserpes G., Jadaud A., Relini G. (2019) The MEDITS trawl survey specifications in an ecosystem approach to fishery management. Available at: https://scientiamarina.revistas.csic.es/index.php/scientiamarina/article/view/1829.
Stamatopoulos C. (2002). “Sample-based fishery surveys. a technical handbook,” in FAO fishery technical paper, vol. 425. (Rome: FAO), 1–132.
Stat M., John J., DiBattista J. D., Newman S. J., Bunce M., Harvey E. S. (2019). Combined use of eDNA metabarcoding and video surveillance for the assessment of fish biodiversity. Conserv. Biol. 33 (1), 196–205. doi: 10.1111/cobi.13183
Taberlet P., Coissac E., Hajibabaei M., Rieseberg L. H. (2012). Environmental DNA. Mol. Ecol. 21 (8), 1789–1793. doi: 10.1111/j.1365-294X.2012.05542.x
Thomsen P. F., Møller P. R., Sigsgaard E. E., Knudsen S. W., Jørgensen O. A., Willerslev E. (2016). Environmental DNA from seawater samples correlate with trawl catches of subarctic, deepwater fishes. PloS One 11 (11), e0165252. doi: 10.1371/journal.pone.0165252
Trenkel V. M., Charrier G., Lorance P., Bravington M. V. (2022). Close-kin mark–recapture abundance estimation: practical insights and lessons learned. ICES J. Mar. Sci. 79 (2), 413–422. doi: 10.1093/icesjms/fsac002
Weber D. N., Fields A. T., Patterson W. F. III, Barnett B. K., Hollenbeck C. M., Portnoy D. S. (2022). Novel epigenetic age estimation in wild-caught gulf of Mexico reef fishes. Can. J. Fish. Aquat. Sci. 79 (1), 1–5. doi: 10.1139/cjfas-2021-0240
Xing T. F., Li Y. L., Liu J. X. (2021). Female-specific genomic regions and molecular sex identification of the clearhead icefish (Protosalanx hyalocranius). BMC Genomics 22 (1), 1–9. doi: 10.1186/s12864-021-07830-9
Zhang Q., Vallerga. C. L., Walker R. M., Lin T., Henders A. K., Montgomery G. W., et al. (2019). Improved precision of epigenetic clock estimates across tissues and its implication for biological ageing. Genome Med. 11 (54). doi: 10.1186/s13073-019-0667-1
Keywords: research surveys, bottom trawl, data collection, genomic methods, fish stock assessment
Citation: Rodríguez-Mendoza R and Saborido-Rey F (2023) The potential use of genomic methods in bottom trawl surveys to improve stock assessments in Europe. Front. Mar. Sci. 10:1095171. doi: 10.3389/fmars.2023.1095171
Received: 10 November 2022; Accepted: 07 April 2023;
Published: 29 May 2023.
Edited by:
Jonathan Sandoval, Flinders University, AustraliaReviewed by:
Fausto Valenzuela, Centro de Investigación Biológica del Noroeste (CIBNOR), MexicoCopyright © 2023 Rodríguez-Mendoza and Saborido-Rey. This is an open-access article distributed under the terms of the Creative Commons Attribution License (CC BY). The use, distribution or reproduction in other forums is permitted, provided the original author(s) and the copyright owner(s) are credited and that the original publication in this journal is cited, in accordance with accepted academic practice. No use, distribution or reproduction is permitted which does not comply with these terms.
*Correspondence: Rebeca Rodríguez-Mendoza, cnJvZHJpZ3VlekBpaW0uY3NpYy5lcw==
Disclaimer: All claims expressed in this article are solely those of the authors and do not necessarily represent those of their affiliated organizations, or those of the publisher, the editors and the reviewers. Any product that may be evaluated in this article or claim that may be made by its manufacturer is not guaranteed or endorsed by the publisher.
Research integrity at Frontiers
Learn more about the work of our research integrity team to safeguard the quality of each article we publish.