 Masatoshi Yamada
 Atsushi Suzuki
 Nozomu Iwasaki
95% of researchers rate our articles as excellent or good
Learn more about the work of our research integrity team to safeguard the quality of each article we publish.
Find out more
ORIGINAL RESEARCH article
Front. Mar. Sci. , 27 June 2023
Sec. Marine Biology
Volume 10 - 2023 | https://doi.org/10.3389/fmars.2023.1091594
This article is part of the Research Topic Scientific Approaches for the Conservation and Sustainable Use of Precious Coral Resources View all 6 articles
The Lead 210 (210Pb) concentrations were determined to estimate the skeletal growth rates in the four species of precious corals including Japanese red coral (Corallium japonicum), pink coral (Pleurocorallium elatius), white coral (P. konojoi), and a deep-sea coral (Coralliidae sp.), and in a bamboo coral (Keratoisis sp.). Colonies were collected from the southern coast of Japan, western North Pacific margin. The 210Pb concentrations typically showed the exponential decrease with distance from the edge to the center of the skeleton axis in a cross section of main stem of colonies. The mean radial growth rates for colonies were estimated from the slopes of the best fit curves for exponential decrease in 210Pb concentration along the multiple transects. The obtained mean and standard deviation of radial growth rates in the diameter (the number of transects, n) for three colonies of C. japonicum were 0.31 mm/y (n = 1), 0.21 ± 0.05 mm/y (n = 2), and 0.36 ± 0.13 mm/y (n = 2), respectively, which were broadly comparable to the previously reported growth rates obtained by growth ring counting. Those obtained for three white coral colonies were 0.52 mm/y (n = 1), 0.60 mm/y (n = 1), and 0.36 ± 0.25 mm/y (n = 2). The radial growth rate for the bamboo coral colony was 0.13 mm/y in radius. The linear growth of the main steam of some colonies was analyzed from several cross sections. The linear growth rates of colonies could be estimated from the slope of the best fit curve (1) for increasing mean 210Pb concentration along the cross transects of the axis and (2) for increasing center 210Pb concentration of the skeleton axis. The linear growth rates calculated from the mean and center concentrations for two C. japonicum colonies were 8.5 and 6.1 mm/y, and 1.8 and 1.4 mm/y, respectively. Those for a P. elatius colony were 4.7 and 3.4 mm/y. The difference between the two estimates may reflect the morphological structure of the skeleton. The growth rates measured for the radial increase and linear extension of the main stem of the colonies could provide basic information for the demographic study of these coral species thereby fostering a rational exploitation of their populations.
Coral species whose skeletal axis is used as a gemstone are called precious corals. Precious corals belong to the phylum Cnidaria, sub-phylum Anthozoa, class Octocorallia, order Scleralcyonacea, and family Coralliidae, and among the 42 species of family Coralliidae, eight species are used in jewelry, art objects, and other artifacts (Tu et al., 2012; Tu et al., 2016; Iwasaki, 2019; McFadden et al., 2022). The axial skeletons of precious corals, family Coralliidae, consist of high-magnesian calcite. Precious corals are valuable resources harvested commercially in Japan, Taiwan, Italy, and other countries (Iwasaki and Suzuki, 2010). These corals are also impacted by bottom trawling in the seas of several countries (Althaus et al., 2009; Auster et al., 2011; Clark et al., 2016; Ramirez-Llodra, 2020). Finally, bamboo corals (e.g., families Keratoisidinae and Isididae) are harvested for jewelry in some parts of the world (Lumsden et al., 2007; Bruckner, 2016).
Genetic analyses of precious coral species have progressed in recent years (Uda et al., 2011; Uda et al., 2013; Lendvay et al., 2020; Takata et al., 2021; Lendvay et al., 2022; Kise et al., 2023) and their phylogenetic relationships have been examined (Tu et al., 2015). Additionally, McFadden et al. (2022) have proposed a review of higher-order classification. Besides these species, some corals belonging to Octocorallia and Hexacorallia are used in jewelry and are called semi-precious corals. Among semi-precious corals, the bamboo coral studied here belongs to the order Scleralcyonacea, family Keratoisididae, and classification and the concatenated analysis using genes have been carried out (Watling and France, 2011; Alderslade and Mcfadden, 2012; Ardila et al., 2012).These corals are distributed in shallow to deep waters around the world (Watling et al., 2011). The colonies of these corals form a three-dimensional structure directly above the seafloor, and provide habitats and shelters for other organisms, leading to biodiversity (Jones et al., 1994; Parrish, 2006). In addition, these corals play an important role in coupling between plankton, which is the primary producer in the surface layer, and benthic suspension feeders by their ingesting particulate organic matter in seawater (Gili and Coma, 1998).
The seas off the southern coast of Japan (Kochi, Nagasaki, Kagoshima, and Okinawa Prefectures) are one of the world’s major precious coral fishing fields. Japanese red coral (Corallium japonicum), pink coral (Pleurocorallium elatius), and white coral (P. konojoi) are distributed off this southern coast at depths of 80−300 m and they have been harvested since the late 19 century (Ogi, 2010). Iwasaki (2019) suggested that fishing pressures on precious corals have increased in recent years and concerns on their depletion have been raised. For the sustainable utilization of precious corals, it is necessary to obtain demographic parameters such as population size and density, age frequency distribution, growth rate, fecundity and mortality (Ebert, 1999; Santangelo et al., 2004; Santangelo et al., 2007; Bramanti et al., 2014). The growth rate is essential for estimating age and determining age frequency distribution.
Various methods have been used to estimate the age and growth rate of precious and bamboo corals.
1. The petrographic method: to observe and count growth rings in a thin section of the axis using an optical microscope (Garcia-Rodriguez and Massò, 1986; Tracey et al., 2007; Sherwood and Edinger, 2009), a high-resolution digital microscope (Luan et al., 2013), a scanning electron microscope (Tracey et al., 2007) or X-radiography (Grigg, 1976).
2. The organic matrix staining method: a technique developed by Marschal et al. (2004) to estimate the growth rate using the toluidine blue to stain the organic matrixes in a thin section of C. rubrum. Marschal et al. (2004) showed that a set of dark- and light-colored bands, made visible by the staining, was formed over the course of a year. This method has since been used in many studies on C. rubrum (Gallmetzer et al., 2010; Vielmini et al., 2010; Priori et al., 2013; Bramanti et al., 2014; Benedetti et al., 2016; Boavida et al., 2016; Chaabane et al., 2016; Bavestrello et al., 2021).
3. The synchrotron radiation-infrared method: using synchrotron infrared mapping analysis to count cycles of fluctuation in absorbance (Iwasaki et al., 2014).
4. The trace element mapping analysis method: to count cycles of fluctuation in concentrations of trace elements such as sulfur (S) and magnesium (Mg) (Roark et al., 2005; Hasegawa et al., 2012).
5. The direct measurement method: to measure growth rate of newly settled colonies during an in-situ cultivation period (Garrabou and Harmelin, 2002; Bramanti et al., 2005; Santangelo et al., 2012; Iwasaki et al., 2022).
6. Carbon 14 (14C) and 210Pb radioisotope dating methods: to estimate the age of the axis from concentration gradients of 14C and 210Pb along the growth direction (Griffin and Druffel, 1989; Druffel et al., 1990; Andrews et al., 2002; Andrews et al., 2005; Noé and Dullo, 2006; Roark et al., 2006; Tracey et al., 2007; Sherwood and Edinger, 2009; Okumura et al., 2020).
Methods 1 to 4 above can be used to estimate growth rates only if the timing of the formation of the growth rings and light/dark bands is known. On the other hand, since the culture period in 5 and the half-life of 14C and 210Pb in 6 are clearly defined, these methods can be used to estimate axial growth per unit of time. Marschal et al. (2004) showed in an in-situ culture experiment that a set of light and dark bands, revealed by organic matrix staining, is formed over the course of a year. They showed that the narrower dark bands form in late fall and winter, indicating that the formation of the light/dark bands is related to water temperature. This has become the standard method for estimating growth rates of Mediterranean C. rubrum. In precious corals from the Japanese region, Luan et al. (2013) compared growth rings observed by organic matrix staining and by high-resolution digital microscopy and found that the growth rings corresponded. The growth rings observed by high-resolution digital microscopy were therefore determined to be annual. Iwasaki et al. (2022) used high-resolution digital microscopy to examine the growth rings of C. japonicum cultured for 98 months in-situ. The results showed that the growth ring corresponded to the low-temperature period, and temperature fluctuations occurred more than once a year. This indicated that, if the formation of growth rings is due to water temperature, more than one ring should be formed each year rather than one annual ring. Therefore, it is proposed that the growth rate estimation of Japanese precious corals be reexamined using a method applying a radiometric age time scale such as the 210Pb dating method.
Lead-210 (210Pb; half-life: 22.23 y) is a naturally occurring uranium-series radionuclide. A significant source of 210Pb for seawater is atmospheric input by decay of the noble gas radionuclide radon-222 (222Rn; half-life: 3.82 d) to 210Pb and subsequent removal from the atmosphere by wet and dry depositions that may fall directly into the ocean, or reach the ocean after falling onto the terrestrial environment. Another source for the ocean is in-situ production by decay of radium-226 (226Ra; half-life: 1.600 × 10³ y). One of the most useful geochronological tools in estimation of growth rate of precious corals is 210Pb and 210Pb dating has been used to estimate the growth rates of deep-sea coral collected off the Little Bahama Banks in the Florida Straits (Druffel et al., 1990), and of bamboo corals off southern Australia (Thresher et al., 2004), New Zealand (Tracey et al., 2007), and the Davidson Seamount (Andrews et al., 2009), and in the Gulf of Alaska (Andrews et al., 2009).
Three Japanese precious corals (C. japonicum, P. elatius and P. konojoi) were designated as “Near Threatened” by the Japanese Ministry of the Environment in 2017 due to increased fishing pressure caused by soaring retail prices and the subsequent occurrence of large scale poaching in the region. The conservation and sustainable use of these species is an urgent issue, which requires resource management based on scientific knowledge. However, the biological parameters—such as biomass, recruitment, and mortality rate—necessary to construct a population dynamic model for resource management are not known. Growth rates only, and in a few colonies, have been estimated (Hasegawa and Yamada, 2010; Iwasaki et al., 2022). Since growth rates may differ among areas and depths even for the same species (Ledoux et al., 2010; Boavida et al., 2016), many data from different areas and depths are required for resource management in each area. The accurate growth rate estimates obtained in the present study and their comparison with previous estimates will contribute to the conservation and resource management of Japanese precious corals.
To better understand the effective use of fishing resources and sustainable utilization of precious corals, it is necessary to obtain more information on their radial and linear growth rates. However, only a few estimations of growth rates have been carried out off the southern coast of Japan using synchrotron infrared mapping analysis (Iwasaki et al., 2014), electron probe micro analyzer mapping analysis (Hasegawa et al., 2012), high-resolution digital microscopic analysis (Luan et al., 2013) and the 14C method (Okumura et al., 2020). To the best of the present authors’ knowledge, there are no published investigations that have reported the radial and linear growth rates of precious corals using 210Pb chronology. The present study determined the 210Pb concentrations in the precious corals of Japanese red coral (C. japonicum), pink coral (P. elatius), white coral (P. konojoi), and deep-sea coral (Coralliidae sp.), and in bamboo coral (Keratoisis sp.), in order to estimate their radial and linear growth rates and to provide essential information for sustainable utilization of these precious corals. In addition, the samples used in Hasegawa et al. (2012); Luan et al. (2013), and Iwasaki et al. (2014) were also used in the present research, so the same samples can be compared using multiple estimation methods to verify the estimates.
The samples analyzed in the present study were four species of precious corals, C. japonicum, P. elatius, P. konojoi and Coralliidae sp., and a bamboo coral, Keratoisis sp. belonging to the class Octocorallia (Cnidaria: Anthozoa). Twelve samples were collected off the southern coast of Japan at 94-300, 700, and 1420-1620 meters depth. Sampling information on species, sampling date, location, water depth etc. are given in Table 1.
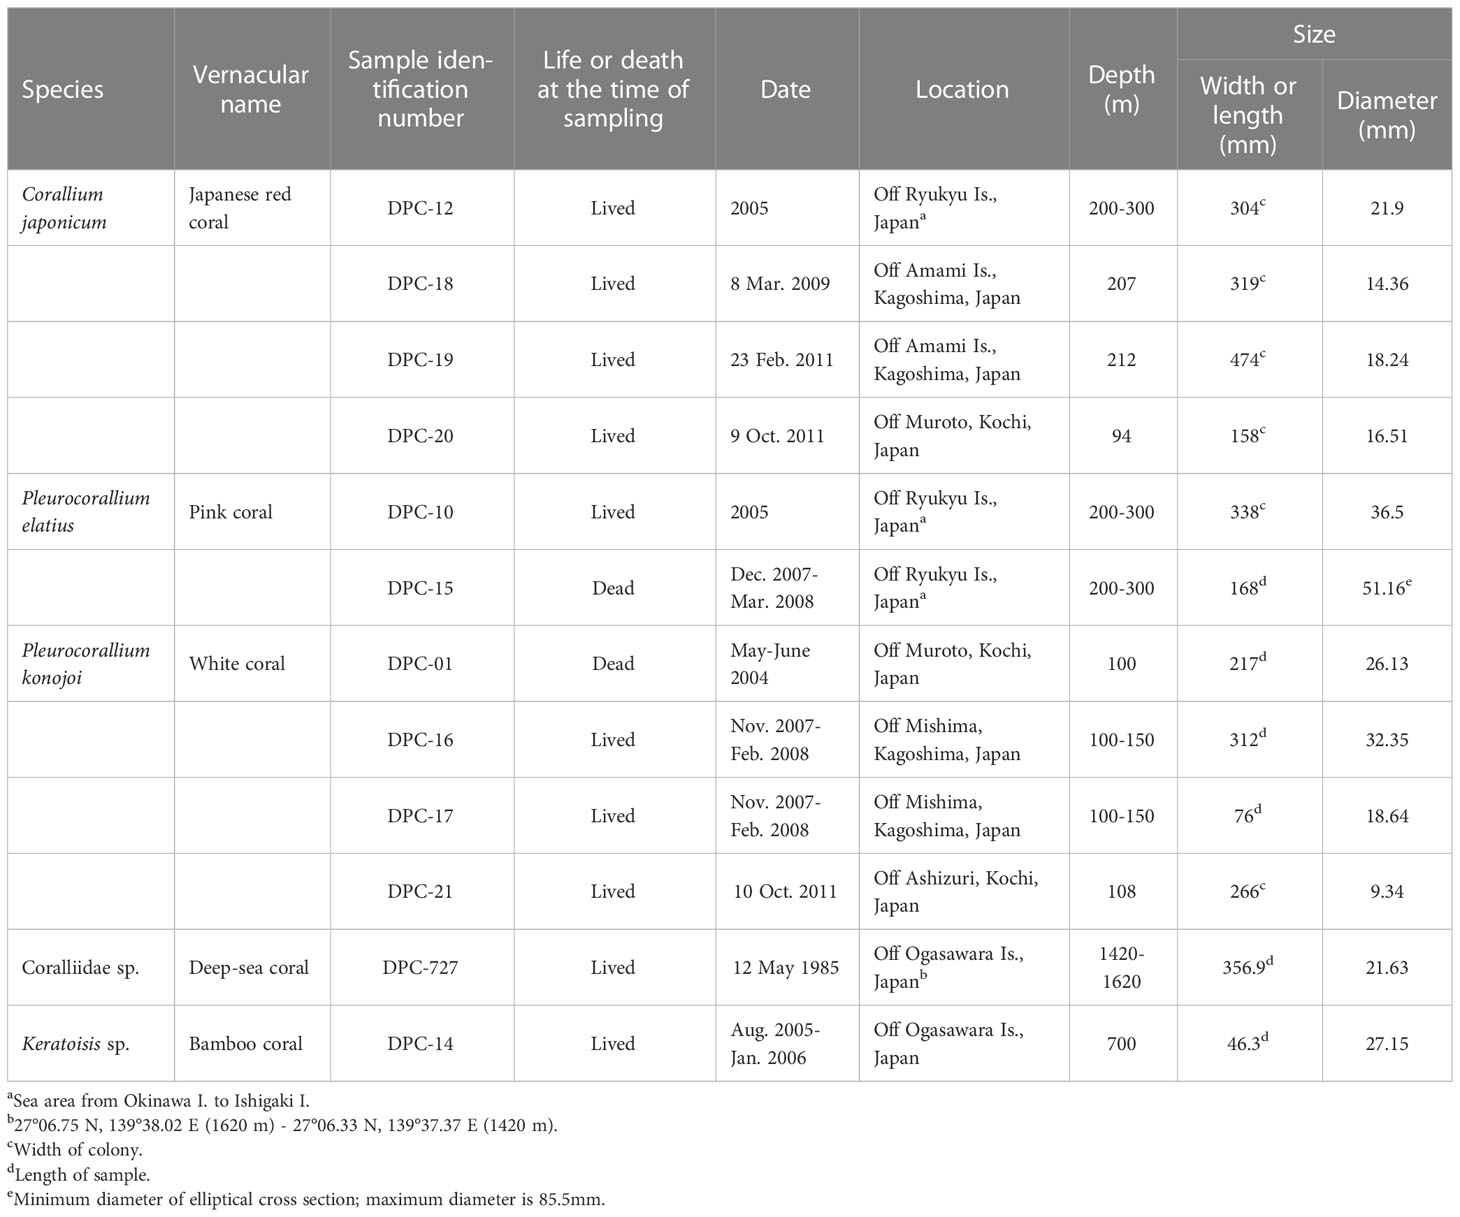
Table 1 Sample locality and sampling information.
Japanese red and white corals, C. japonicum and P. konojoi (DPC-20 and -21) were collected under the authority of the Fisheries Promotion Department, Kochi Prefecture by the ROV “Hakuyo 3000” owned by the Fukada Salvage & Marine Works Co., Ltd. Sample DPC-727, a deep-sea coral, Coralliidae sp. was collected by the Marine Geological Research Vessel “Hakurei Maru” during cruise GH85-1 conducted by the National Institute of Advanced Industrial Science and Technology. The other samples were collected by fishermen with permits.
Two samples, pink coral, P. elatius (DPC-15) and white coral (DPC-01), were dead at the time of sampling, meaning that the coral axes without soft tissues were left on the bottom. Their axis surfaces were discolored to grey. In the DPC-15, there were many small holes on the axis surface caused by boring sponges. The other ten coral samples were harvested live. The skeletons of these colonies were covered with the soft tissues, coenenchyma, indicating their live status.
All samples in the present study had been collected at least 2 years prior to the 166 analyses. Samples for age dating methods were cut from the main stem or branch of each specimen colony. The slabs were cut transversely from the longitudinal section to secure the growth axis of the major stem of the colony along the entire length of the longitudinal section (Figure 1). The slab with the growth axis was then longitudinally cut into several pieces. The thickness of the pieces was adjusted so that as many pieces as possible could be cut in the growth direction, while the length of the pieces was adjusted to be as long as possible to obtain enough skeletal material for analysis. It should be noted that these sizes were adjusted to minimize averaging effects due to the nature of the growth axis being not necessarily straight. Typical width, thickness, and length values of the pieces were ~2 mm, ~1 mm, and ~10 mm, respectively. A power cutter MC-420 manufactured by Maruto Instrument Co., Ltd. (Tokyo, Japan) and a diamond blade (100 mm diameter × 0.2 mm thick) were used to cut the specimens. Purified water was used for cooling the blade during cutting.
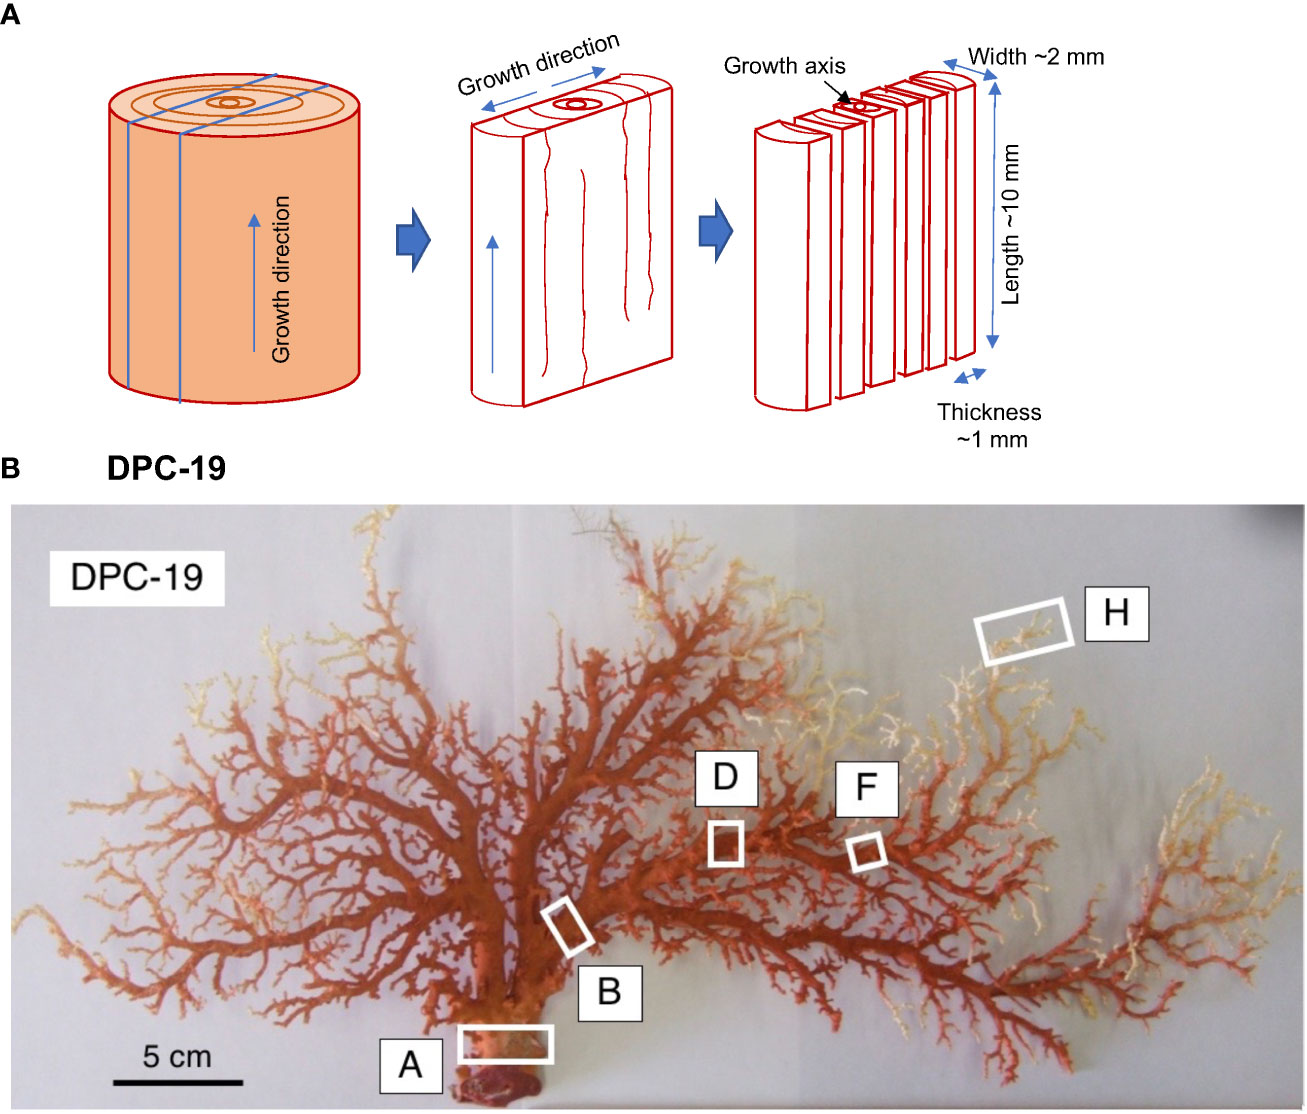
Figure 1 (A) Sample preparation scheme. Samples were cut from the main stem of each specimen colony. The slabs were cut transversely from the longitudinal section samples to secure the growth axis of the major stem of the colony along the entire length of the longitudinal section. The slabs with the growth axis were then longitudinally sectioned into several pieces, and (B) DPC-19, Japanese red coral, Corallium japonicum. The white boxes indicate where the slabs were cut out.
The 12 samples were analyzed for polonium-210 (210Po; half-life: 138.4 d) concentrations; 210Po is a daughter radionuclide of 210Pb and hence it was assumed that 210Po and 210Pb in the samples were in secular equilibrium. A slice of the section sample weighing 50−300 mg was dissolved with 20 mL of 3 M HNO3 after adding a known amount of 209Po yield monitor (National Institute of Standard and Technology, Standard Reference Material 4326). The sample was finally dissolved with 100 mL of 0.5 M HCl and then spontaneously electroplated onto a silver disc. The activities of 209Po and 210Po were measured with α-spectrometers equipped with passivated ion implanted silicon detectors and a multichannel analyzer. The 210Pb concentrations were corrected for decay to the date of sample collection (Table 1). The age of each specimen colony was estimated by dividing the axis diameter by the radial growth rate of the main stem in diameter.
As the precious corals grow in an arborescent tree-like form, their radial growth rate of the main stem can be estimated from the decrease in excess 210Pb concentration (unsupported 210Pb concentration) with distance from an edge (skeleton surface) to the center of the skeleton axis in the corals due to the radioactive decay by assuming a steady-state condition (Druffel et al., 1990). The excess 210Pb concentration is determined by subtracting the 226Ra concentration from the 210Pb concentration. Unfortunately, the data on 226Ra concentrations in the samples were not available in the present study. Therefore, the radial growth rates of the main stem were estimated from the slope of the best fit curve for exponential decrease of the 210Pb concentrations. Distance distributions of 210Pb concentrations in samples DPC-01, -15, -10, -12, -14, and -727 for estimations of the radial growth rates of the main stem are shown in Figures 2–5. For these samples, the growth rates in diameter were calculated as the sum of the estimated radial growth rates of both sides. Distance distributions of 210Pb concentrations in samples DPC-16, -17, -18, -19, -20, and -21 for estimations of the growth rates in diameter are shown in Figures 6–9. Their linear growth rates of the colony were estimated by two methods. One used the increase in the mean 210Pb concentration along the cross transects of the axis, which was measured at 4−5 axial transects. The other was from the increase in the 210Pb concentration of the center of the axis at 3−4 coral axes. Distance distributions of 210Pb concentrations in samples DPC-19, -20, and -21 for estimations of linear growth rates of the colony are shown in Figure 10.
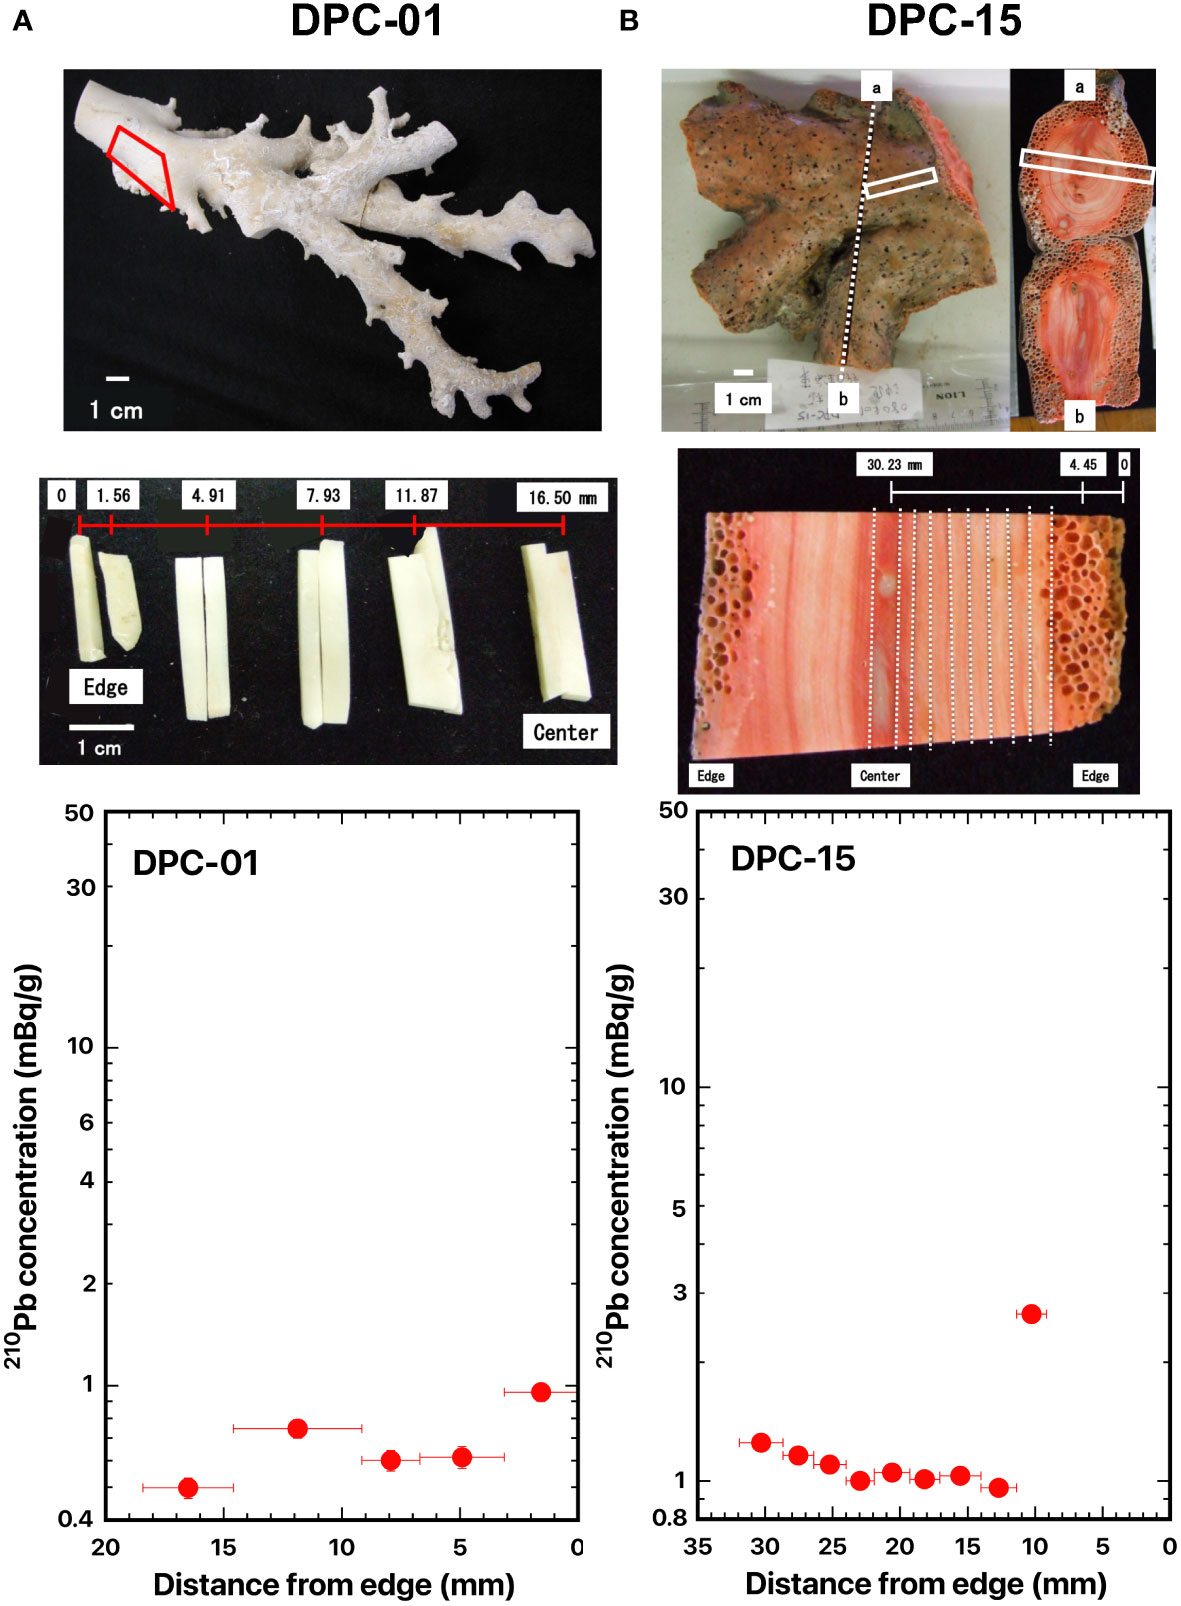
Figure 2 Distance distributions of 210Pb concentrations from the edge: (A) DPC-01, white coral, Pleurocorallium konojoi, and (B) DPC-15, pink coral, P. elatius. The red and white boxes indicate where the slabs were cut out. The dashed lines indicate the location of the cut-off. The numbers indicate the distance from the edge of the axis (mm).
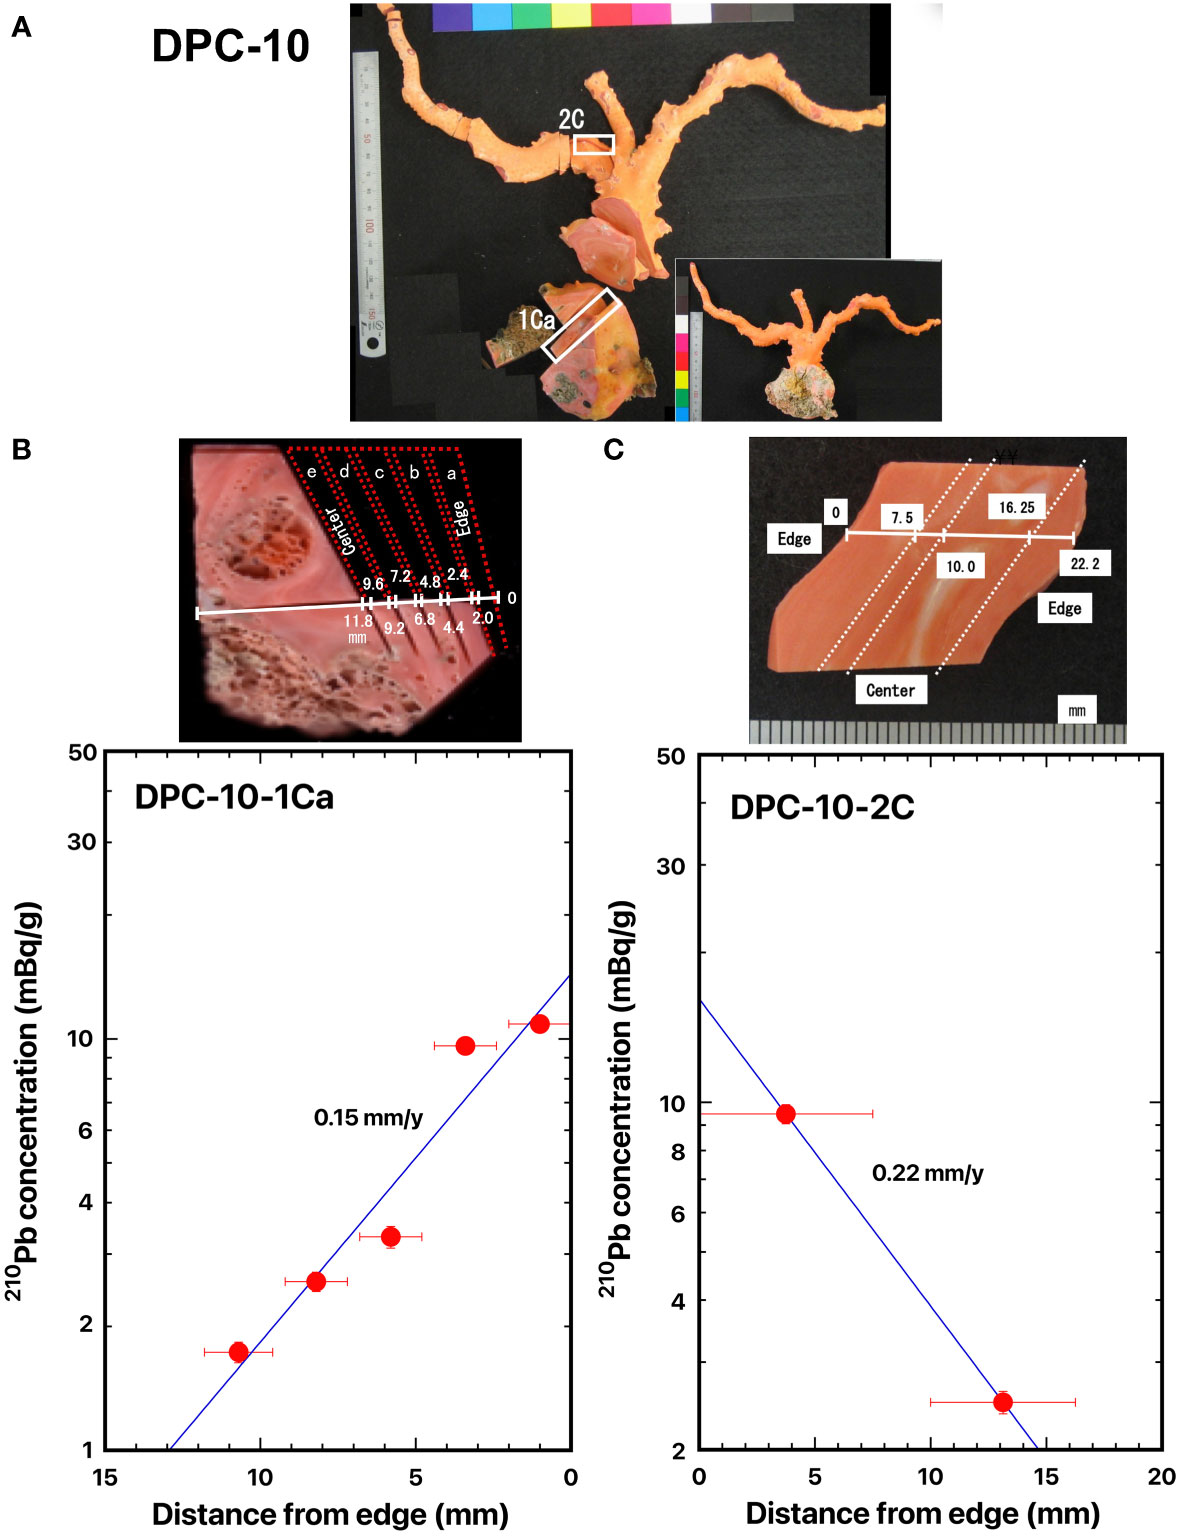
Figure 3 Distance distributions of 210Pb concentrations from the edge: (A) DPC-10, (B) DPC-10-1C, and (C) DPC-10-2C, pink coral, Pleurocorallium elatius. The blue line represents the best fit curve for exponential decrease of the 210Pb concentrations. The white boxes indicate where the slabs were cut out. The dashed lines indicate the location of the cut-off. The numbers indicate the distance from the edge of the axis (mm).
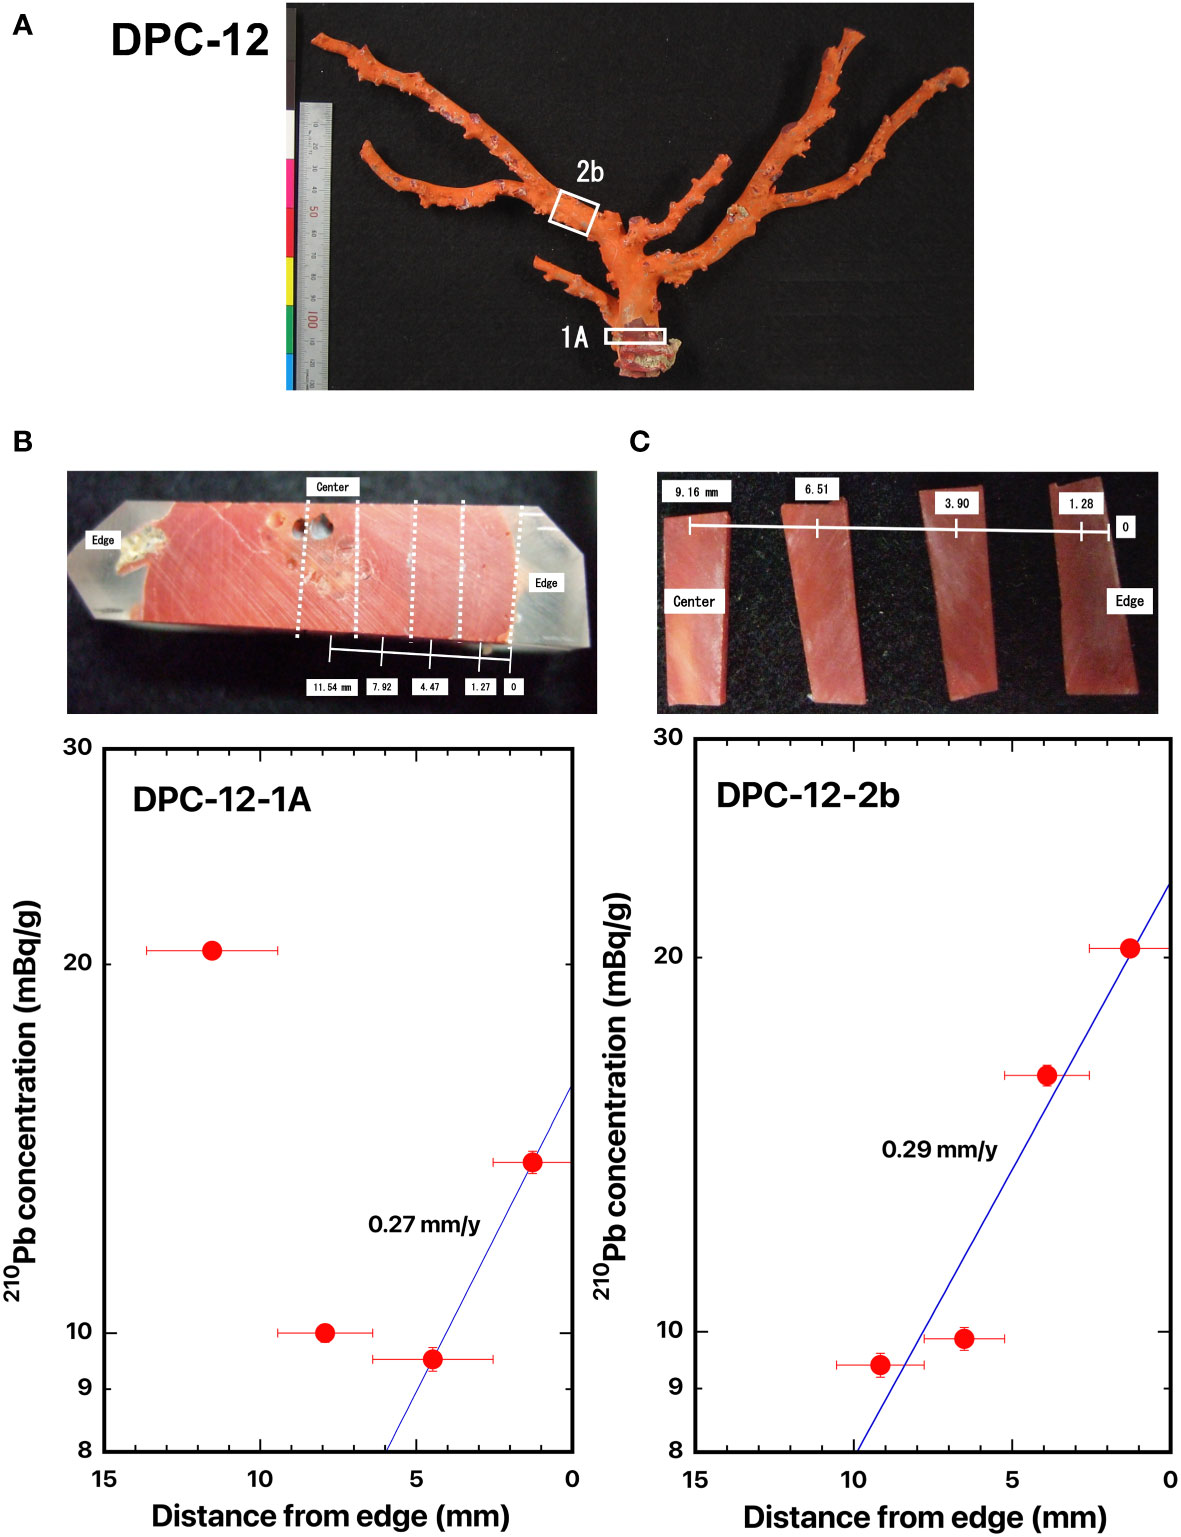
Figure 4 Distance distributions of 210Pb concentrations from the edge: (A) DPC-12, (B) DPC-12-1A, and (C) DPC-12-2b, Japanese red coral, Corallium japonicum. The blue line represents the best fit curve for exponential decrease of the 210Pb concentrations. The white boxes indicate where the slabs were cut out. The dashed lines indicate the location of the cut-off. The numbers indicate the distance from the edge of the axis (mm).
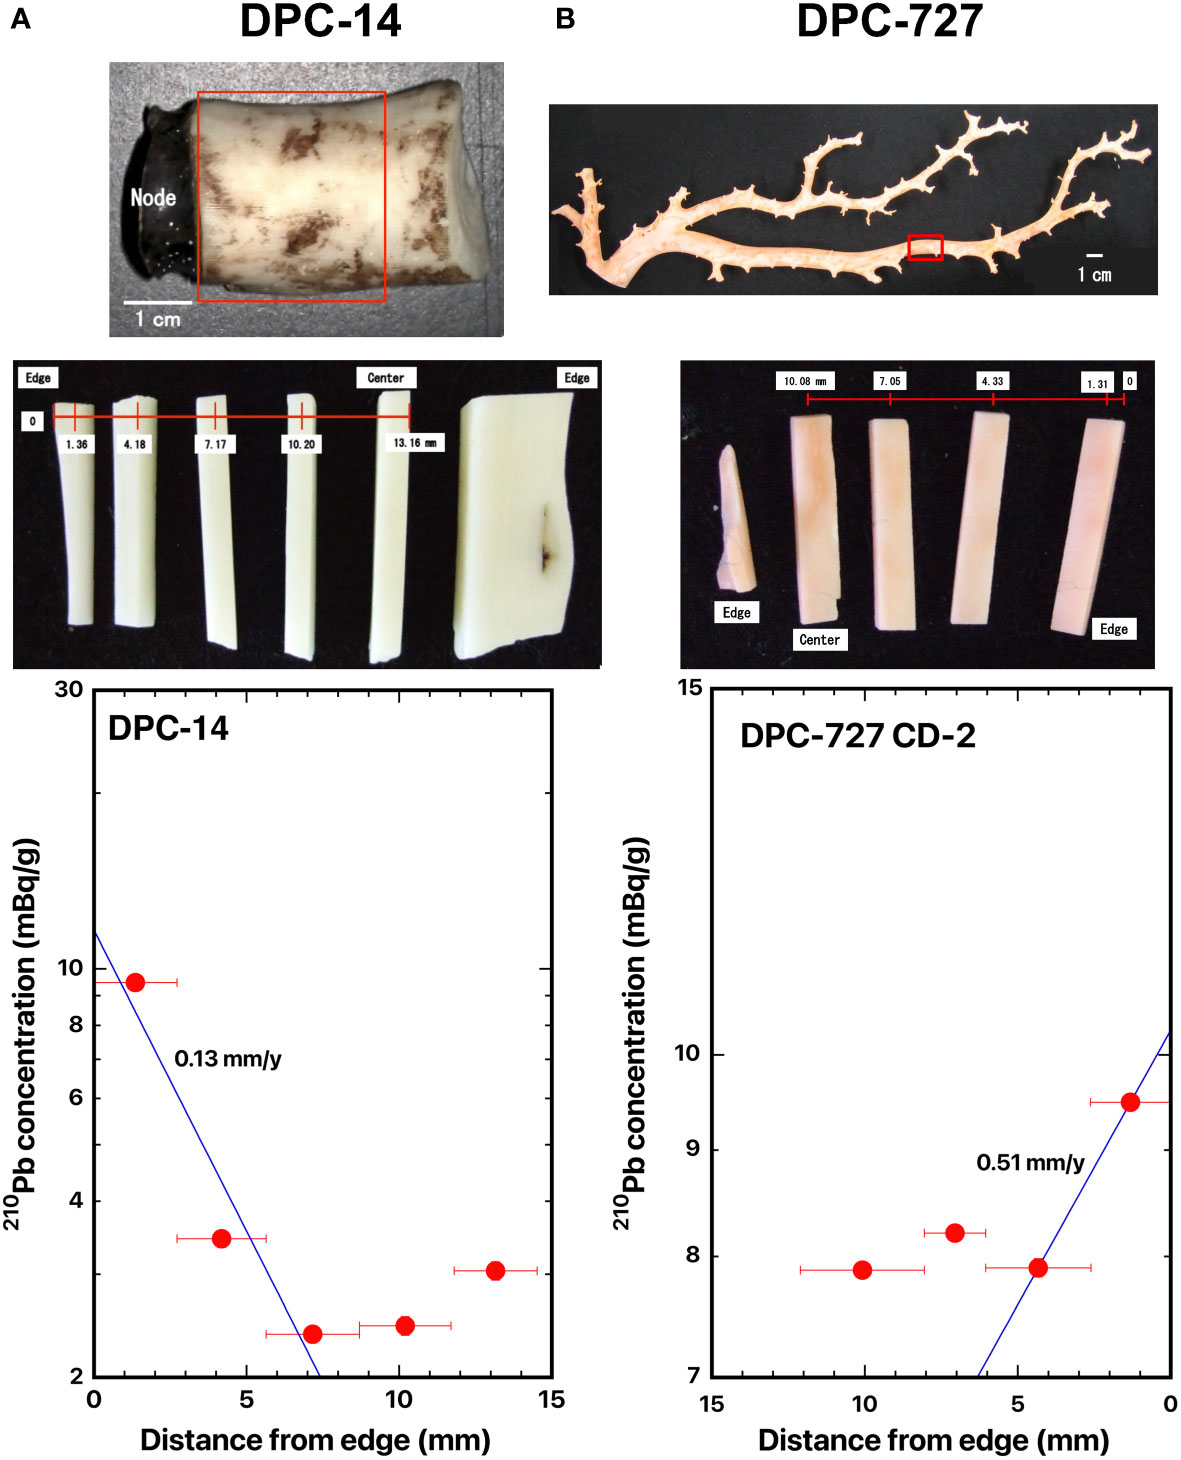
Figure 5 Distance distributions of 210Pb concentrations from the edge: (A) DPC-14, bamboo coral, Keratoisis sp., and (B) DPC-727-CD-2, deep-sea coral, Coralliidae sp. The blue line represents the best fit curve for exponential decrease of the 210Pb concentrations. The red boxes indicate where the slabs were cut out.
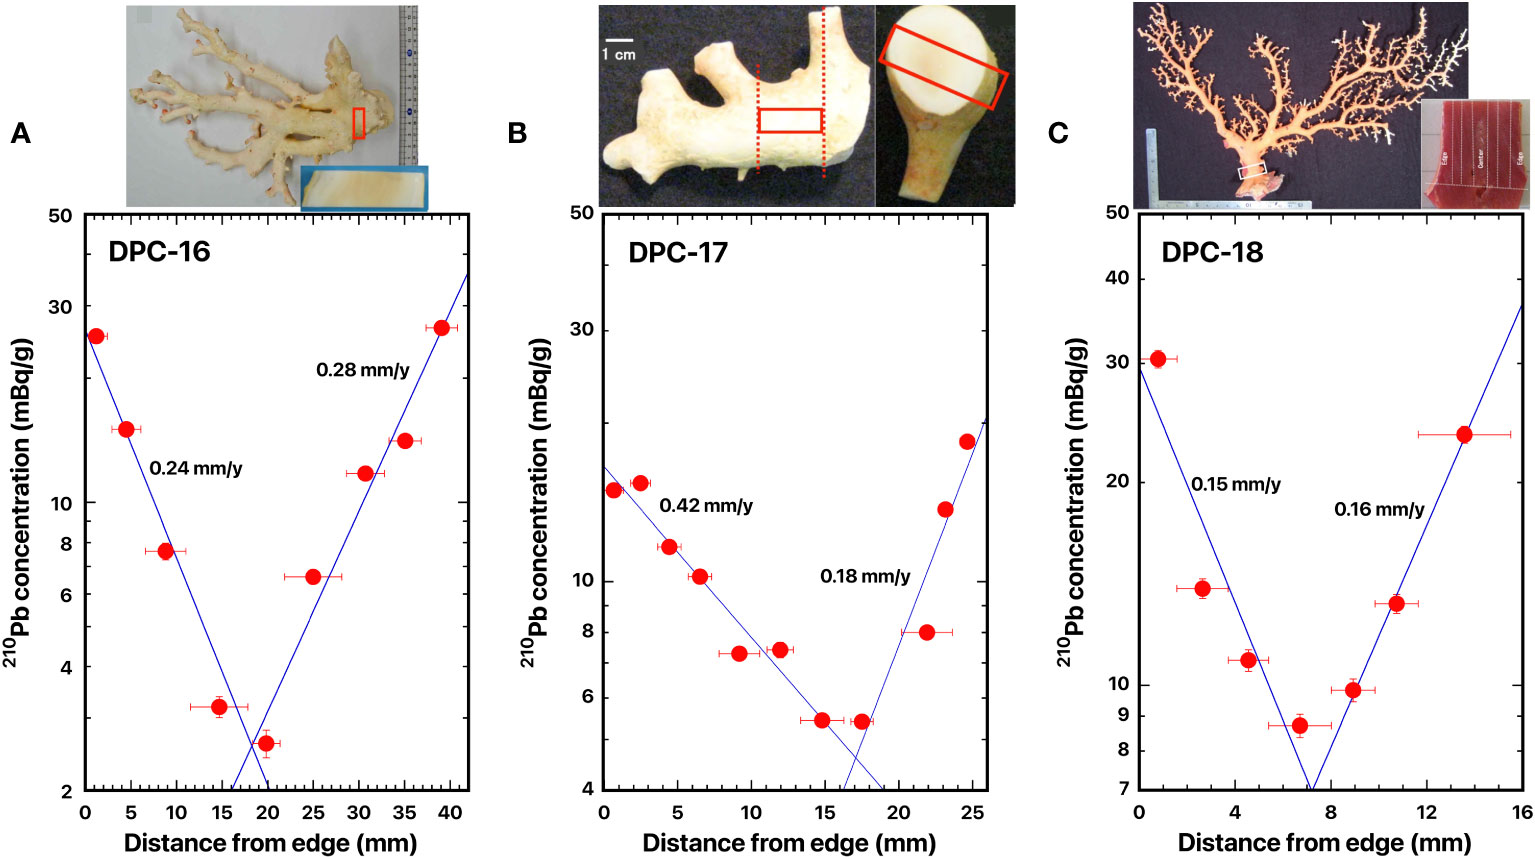
Figure 6 Distance distributions of 210Pb concentrations from the edge: (A) DPC-16, white coral, Pleurocorallium konojoi, (B) DPC-17, white coral, P. konojoi, and (C) DPC-18, Japanese red coral, Corallium japonicum. The blue line represents the best fit curve for exponential decrease of the 210Pb concentrations. The red boxes indicate where the slabs were cut out. The dashed lines indicate the location of the cut-off.
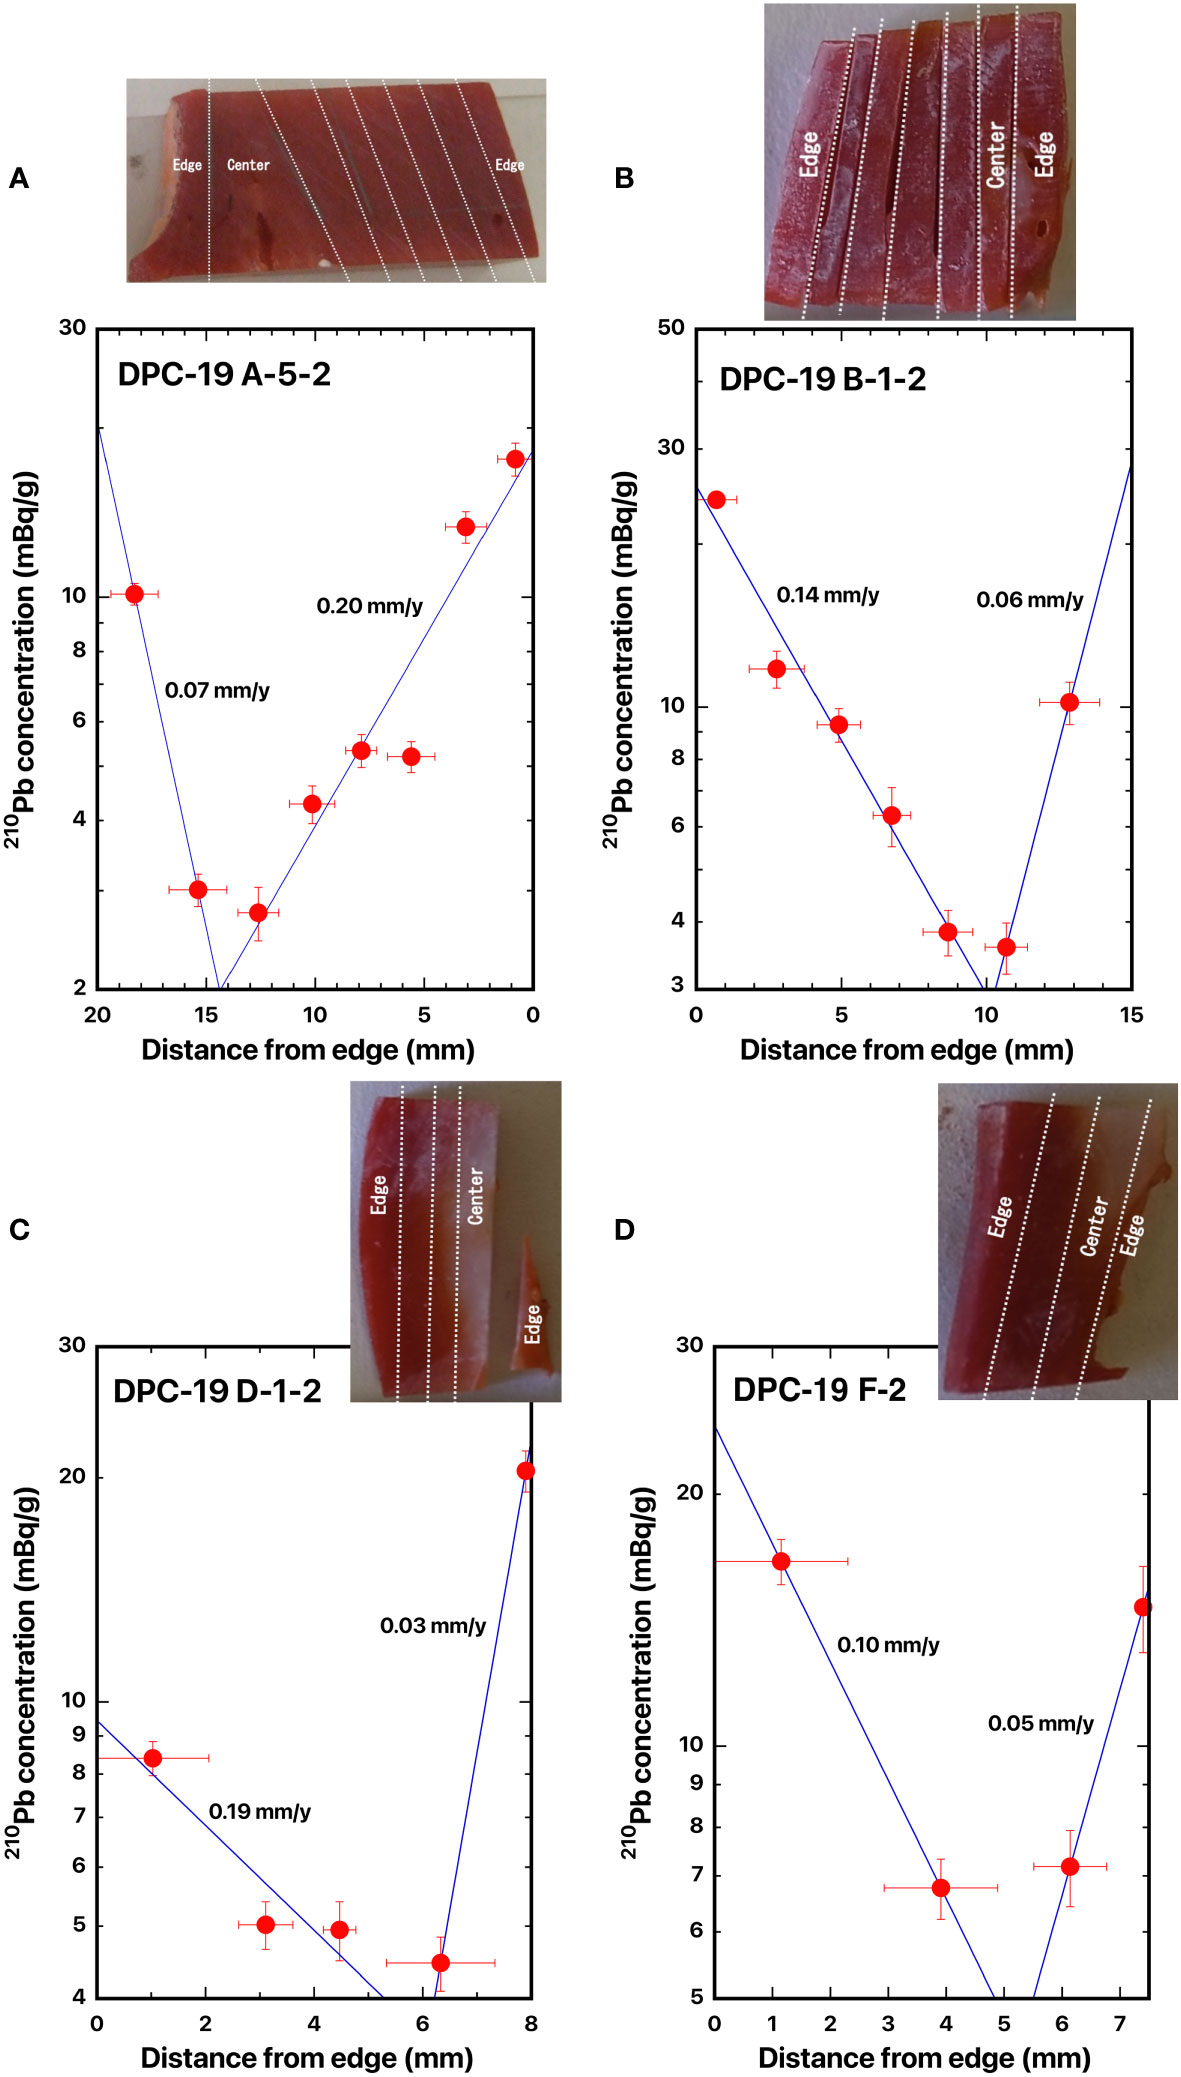
Figure 7 Distance distributions of 210Pb concentrations from the edge: (A) DPC-19-A-5-2, (B) DPC-19-B-1-2, (C) DPC-19-D-1-2, and (D) DPC-19-F-2, Japanese red coral, Corallium japonicum. The blue line represents the best fit curve for exponential decrease of the 210Pb concentrations. The dashed lines indicate the location of the cut-off. See Figure 1 for the colony of DPC-19.
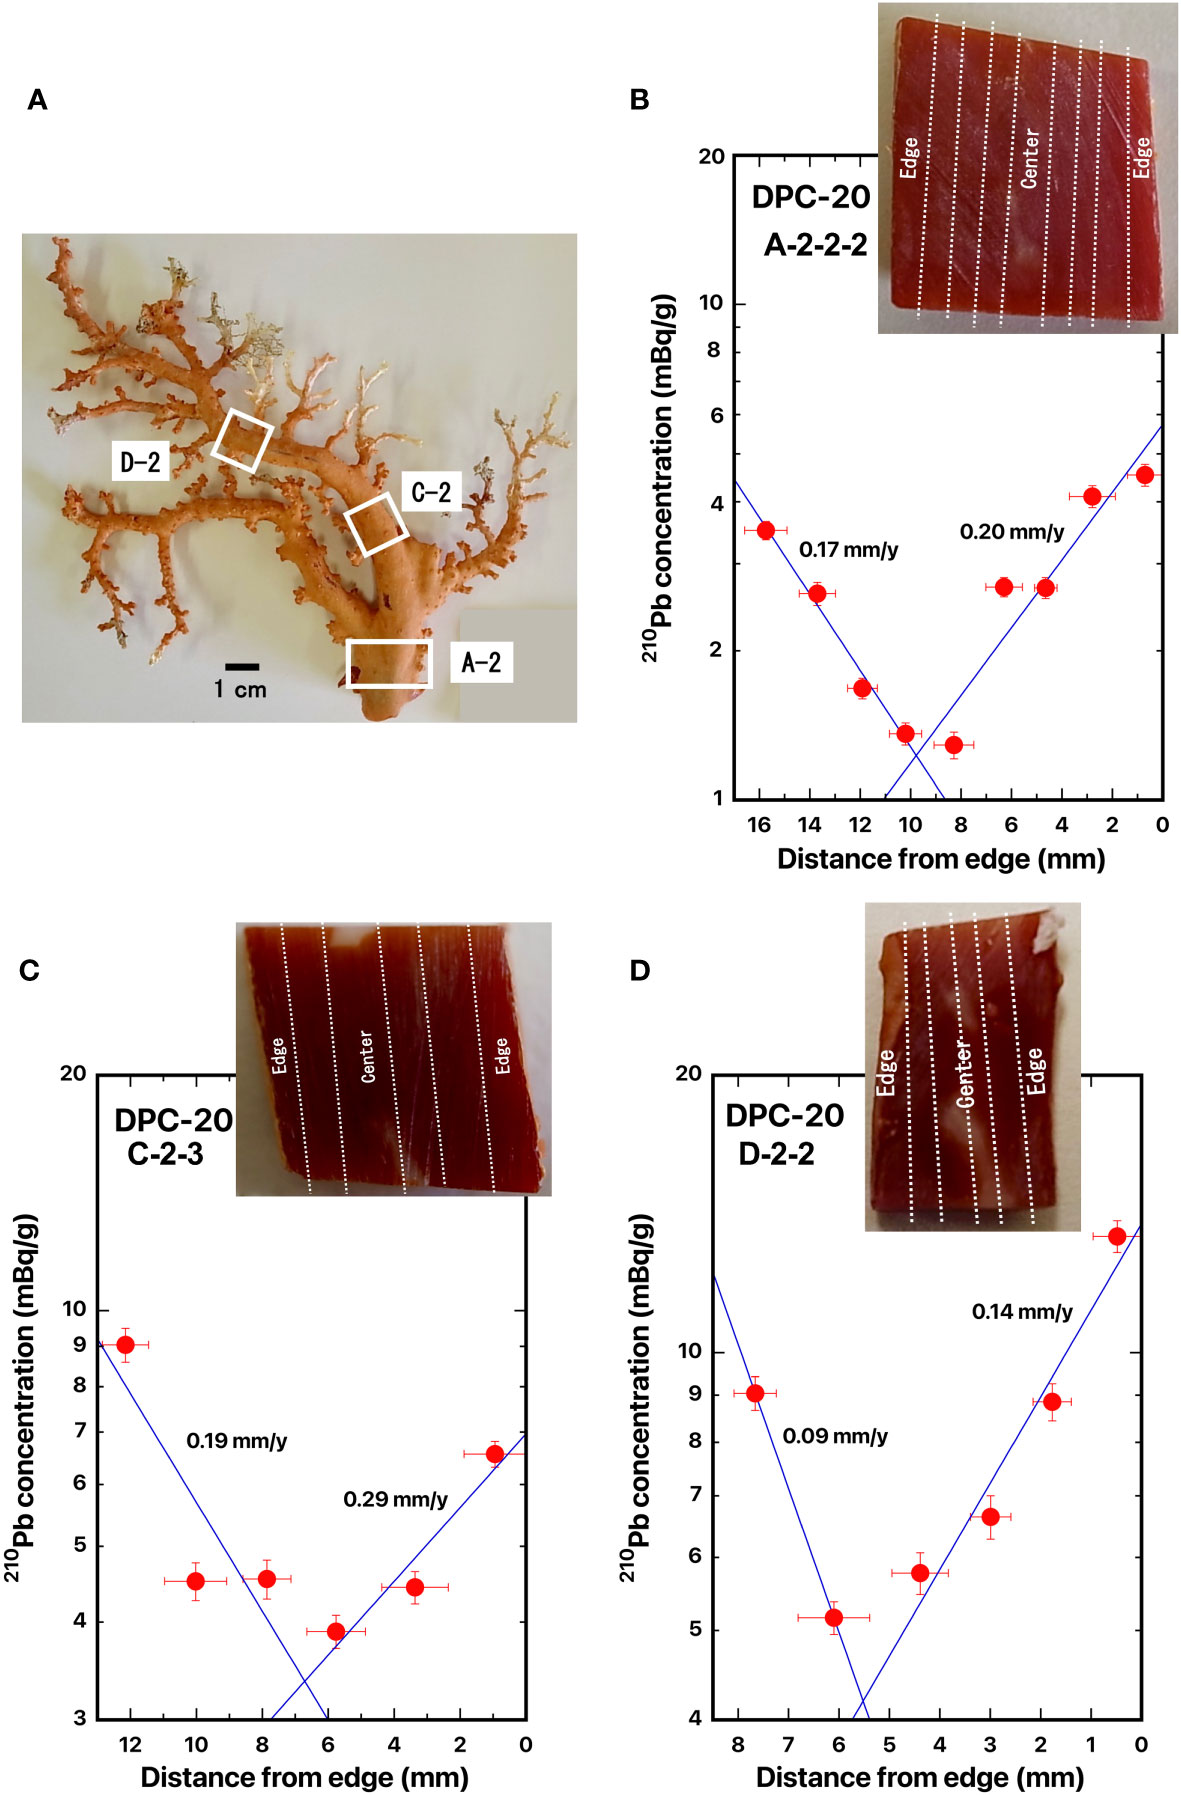
Figure 8 Distance distributions of 210Pb concentrations from the edge: (A) DPC-20, (B) DPC-20-A-2-2-2, (C) DPC-20-C-2-3, and (D) DPC-20-D-2-2, Japanese red coral, Corallium japonicum. The blue line represents the best fit curve for exponential decrease of the 210Pb concentrations. The white boxes indicate where the slabs were cut out. The dashed lines indicate the location of the cut-off.
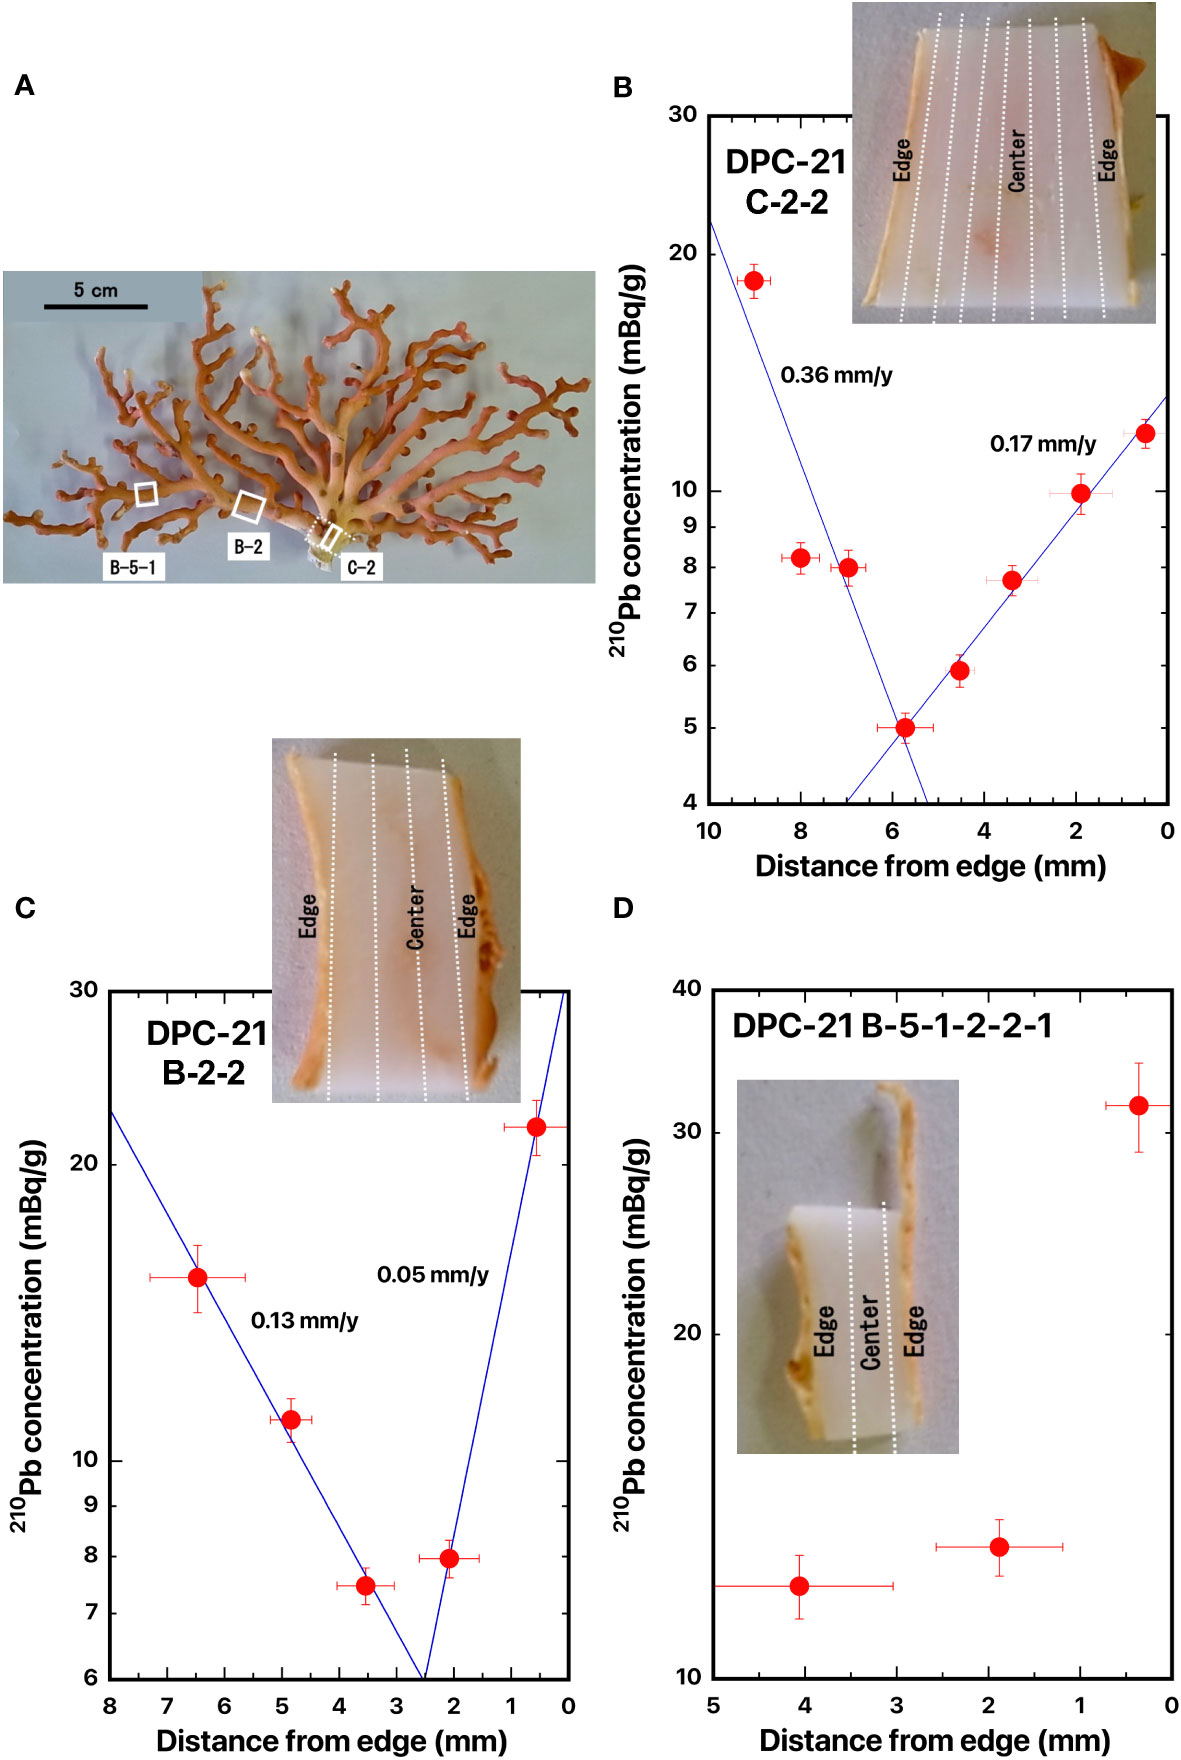
Figure 9 Distance distributions of 210Pb concentrations from the edge: (A) DPC-21, (B) DPC-21-C-2-2, (C) DPC-21-B-2-2, and (D) DPC-21-B-5-1-2-2-1, white coral, Pleurocorallium konojoi. The blue line represents the best fitted curve for exponential decrease of the 210Pb concentrations. The white boxes indicate where the slabs were cut out. The dashed lines indicate the location of the cut-off.
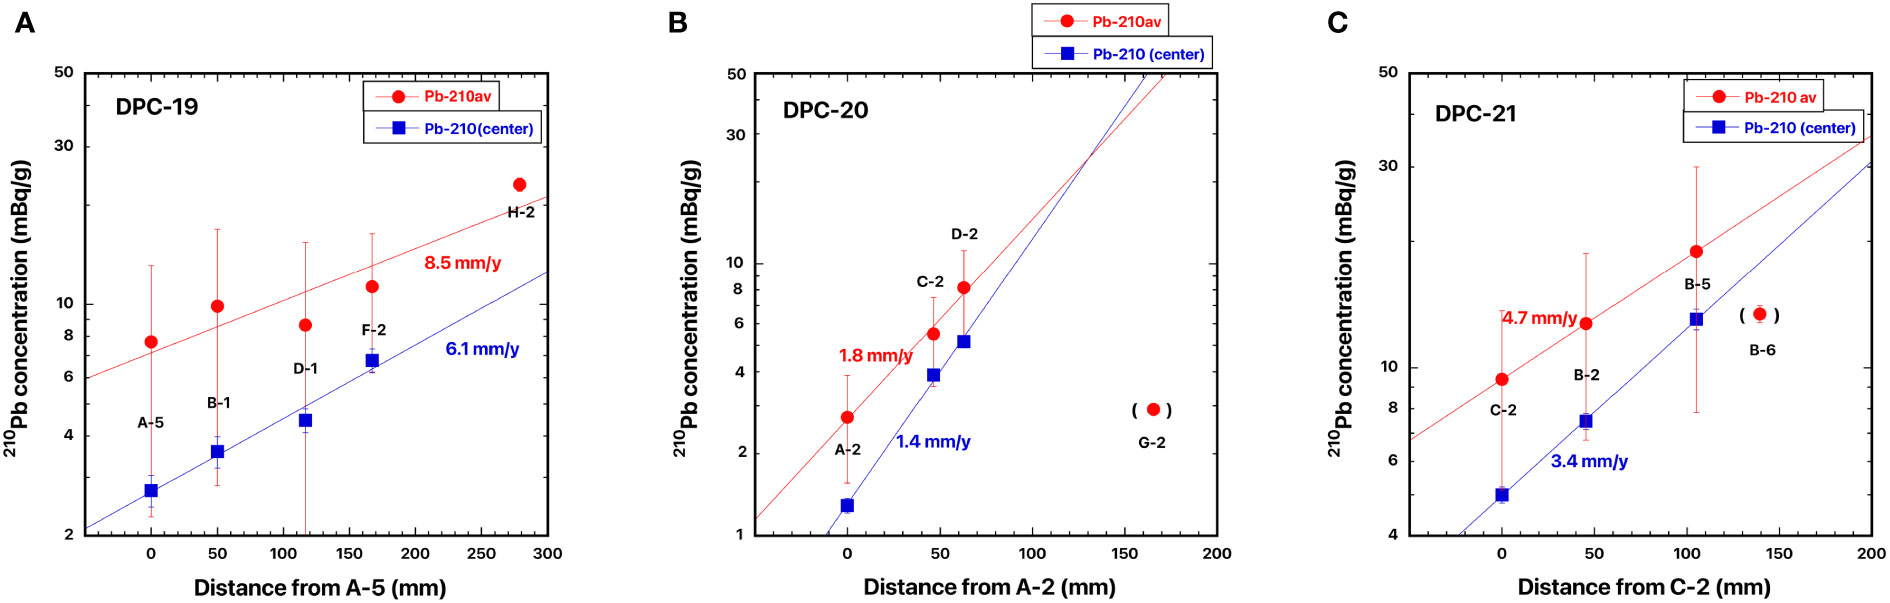
Figure 10 Distance distributions of 210Pb concentrations from the base: (A) DPC-19, Japanese red coral, Corallium japonicum, (B) DPC-20, Japanese red coral, C japonicum, and (C) DPC-21, white coral, Pleurocorallium konojoi. The blue and red lines, respectively, represent the best fit curve for exponential increase in the 210Pb concentration of the center of the skeleton axis and for exponential increase in the mean 210Pb concentration along the cross transects of the axis.
The species name, radial growth rate (this study), radial growth rates (Hasegawa et al., 2012; Luan et al., 2013; Iwasaki et al., 2014), age data for each colony, and the method used to obtain the age data are given in Table 2.

Table 2 Comparison of radial growth rates (mm/y) and age (y) of precious corals.
The 210Pb concentrations ranged from 0.50 to 0.96 mBq/g in white coral (DPC-01) and from 0.96 to 2.65 mBq/g in pink coral (DPC-15). The 210Pb concentrations in DPC-01, with a mean value of 0.68 ± 0.18 mBq/g, were almost uniform from the edge (axis surface) to the center of the axis (Figure 2A; Table 2). The 210Pb concentrations in DPC-15, with a mean value of 1.07 ± 0.10 mBq/g, also were almost uniform except in the axis surface (Figure 2B; Table 2). As mentioned in the Materials and methods section, these two samples were dead at the time of sampling. The high 210Pb concentration of 2.65 mBq/g on the axis surface in DPC-15 might be due to the presence of boring sponges, which bored many small holes into the skeleton surface. No exponential decrease of the 210Pb concentrations from the edge (axis surface) to the center of the axis was observed in these two samples (Figure 2). So, no radial growth of the axis was identified at the time of sampling, and at least more than five half-lives of 210Pb, equivalent to ~110 years had elapsed.
Suzuki et al. (2010) reported that the radiocarbon age of DPC-01 was 3660 years BP (n=3) based on 14C accelerator mass spectrometer dating. This result could support the present finding of no radial growth of the axis at the time of sampling. On the other hand, Iwasaki et al. (2014) estimated the growth rate in diameter of DPC-01 to be 0.22 mm/y based on cycle length of the absorbance ratio obtained using a synchrotron infrared mapping analysis for the cross section of the DPC-01 axis (Table 2). Furthermore, Hasegawa et al. (2012) also estimated the growth rate in diameter of DPC-01 to be 0.32 mm/y based on growth ring density of Mg obtained using an electron probe micro analyzer mapping analysis for the cross section of the DPC-01 axis (Table 2).
Two cross sections of pink coral DPC-10 were taken: one from the base of the main axial skeleton (DPC-10-1Ca) which was located at the bottom of the coral (Figure 3A), where the center of the axis of DPC-10-1Ca was slightly shifted to one side (Figure 3B), and the other from the bottom of the branched axial skeleton (DPC-10-2C) which was located in the middle of the coral, where the center of the axis of DPC-10-2C was shifted to one side (Figure 3C). Distance distributions of 210Pb concentrations for DPC-10-1Ca and DPC-10-2C are shown in Figures 3B, C, respectively. The 210Pb concentration in DPC-10-1Ca was 10.9 ± 0.4 mBq/g in the skeleton surface and it decreased exponentially with distance from the edge (skeleton surface) to the center of the axis. Similarly, the 210Pb concentration in DPC-10-2C decreased from the surface inwards. The radial growth rates of the main stem of pink coral DPC-10 were estimated from the slope of the best fit curve for the decrease of 210Pb concentrations as 0.15 mm/y for DPC-10-1Ca and 0.22 mm/y for DPC-10-2C (Table 2). The growth rate at the bottom of the branched axial skeleton was slightly greater than that at the base of the main axial skeleton. On the other hand, Luan et al. (2013) estimated the growth rates of the precious corals at the bottom using growth ring density in the axial skeleton considering that the growth rings were formed annually. They reported that the growth rates in diameter of DPC-10 were 0.36 mm/y at the base of the main axial skeleton and 0.29 mm/y at the bottom of the branched axial skeleton with the mean value of 0.30 ± 0.04 mm/y as obtained using a high-resolution digital microscope (VHX-1000) (Table 2). The growth rate of 0.15 mm/y in radius or 0.30 mm/y in diameter at the base of the main axial skeleton in the present study agreed well with the mean value reported by Luan et al. (2013).
Based on microscopic X-ray fluorescence/soft X-ray photoabsorption speciation mapping, Tamenori et al. (2014) suggested that sulfate was the primary species in the skeleton of pink coral DPC-10 and the speciation mapping of sulfate in the skeleton showed clear fluctuations with sulfate concentrations being higher at dark bands. Yoshimura et al. (2017) also reported that the skeletal microstructure of pink coral DPC-10 was characterized by concentric growth rings, and that elevated Mg and depleted S concentrations were observed at the central skeletal axes whereas the sodium (Na) and strontium (Sr) signals in the cross section of the slab showed no pronounced changes.
Two cross sections of Japanese red coral DPC-12 were taken: one from the base of the main axial skeleton (DPC-12-1A) which was located at the bottom of the coral, and the other from the bottom of the branched axial skeleton (DPC-12-2b) which was located in the middle of the coral (Figure 4A). The center of the axis of DPC-12-2b was shifted to one side (Figure 4C). The 210Pb concentration in DPC-12-1A was 13.8 ± 0.3 mBq/g in the skeleton surface and it decreased from the surface inwards (Figure 4B). A high 210Pb concentration of 20.5 ± 0.3 mBq/g was observed on the center of the axis in DPC-12-1A; it might be due to sponges which bored the holes into the skeleton center (Figure 4B). The 210Pb concentration in DPC-12-2b was 20.3 ± 0.3 mBq/g in the skeleton surface and it decreased exponentially with distance from the edge (axis surface) to the center of the axis (Figure 4C). The radial growth rates of the main stem of Japanese red coral DPC-12 were estimated as 0.27 mm/y for DPC-12-1A and 0.29 mm/y for DPC-12-2b (Table 2), and no significant differences were indicated between them.
Iwasaki et al. (2014) estimated the growth rate in diameter of DPC-12 to be 0.22 mm/y based on cycle length of the absorbance ratio obtained using a synchrotron infrared mapping analysis in the cross section of the DPC-12 axis (Table 2), which was roughly one half the present value. The present growth rates might be somewhat overestimated compared to the results by Iwasaki et al. (2014).
The 210Pb concentrations in the skeleton surface in DPC-14 and DPC-727 were 9.47 ± 0.26 mBq/g and 9.49 ± 0.07 mBq/g, respectively, and they decreased from the surface inwards (Figures 5A, B). The radial growth rates of the main stem of bamboo coral DPC-14 and deep-sea coral DCP-727 were estimated as 0.13 and 0.51 mm/y, respectively (Table 2).
Iwasaki et al. (2014) indicated that the bamboo coral DPC-14 and deep-sea coral DCP-727 had an infrared absorption spectrum peculiar to calcite based on Fourier-transform infrared attenuated total-reflectance spectrum analysis. They also estimated the growth rates in diameter to be 0.33 mm/y in DPC-14 and 0.27 mm/y in DCP-727 based on the synchrotron infrared mapping analysis (Table 2). The growth rate in diameter of DPC-14 in the present study was roughly equivalent to the value by Iwasaki et al. (2014). However, that of DCP-727 might be somewhat overestimated compared to the value by Iwasaki et al. (2014), which was similar to the result of Japanese red coral DPC-12. Further studies are needed to confirm the reason for the difference in results by the two methods.
The slabs for the cross section of DPC-16, -17, and -18 were taken from the axis surface through the center of the axis to the opposite side of the skeleton surface, which was located in the base of the main axial skeleton. In DPC-17, the center of the axis was slightly shifted to one side. Distance distributions of 210Pb concentrations are shown in Figure 6A for DPC-16, Figure 6B for DPC-17, and Figure 6C for DPC-18.
The 210Pb concentration in the axis surface in DPC-16 was 25.3 ± 0.7 mBq/g and it decreased exponentially with distance from the edge (skeleton surface) to the center of the axis; a minimum of 2.60 ± 0.20 mBq/g was identified at the center of the axis; and then it increased exponentially to the opposite side of the axis surface (Figure 6A). The radial growth rates of the main stem of white coral DPC-16 were estimated as 0.24 mm/y for one side and 0.28 mm/y for the opposite side (Table 2). The growth rate in diameter of DPC-16 was calculated as the sum of the estimated radial growth rates of both sides and it was 0.52 mm/y (Table 2).
The 210Pb concentration in the axis surface in DPC-17 was 14.9 ± 0.4 mBq/g and it decreased exponentially with distance from the edge to the center of the axis; a minimum of 5.41 ± 0.16 mBq/g was identified at the center of the axis; and then it increased exponentially to the opposite side of the axis surface (Figure 6B). As mentioned earlier, the center of the axis in DPC-17 was slightly shifted to one side. The radial growth rates of the main stem of white coral DPC-17 were estimated as 0.42 mm/y for the radius of the major axis and 0.18 mm/y for the radius of the minor axis (Table 2). The calculated growth rate in diameter of DPC-17 was 0.60 mm/y (Table 2).
The 210Pb concentration in the axis surface in DPC-18 was 30.5 ± 0.9 mBq/g and it decreased exponentially with distance from the edge to the center of the axis; a minimum of 8.72 ± 0.34 mBq/g was identified at the center of the axis; and then it increased exponentially to the opposite side of the axis surface (Figure 6C). The radial growth rates of the main stem of Japanese red coral DPC-18 were estimated as 0.15 mm/y for one side and 0.16 mm/y for the opposite side (Table 2) and DPC-18 was growing at the same rate on both sides. The growth rate in diameter of DPC-18 was calculated to be 0.31 mm/y (Table 2) and it was significantly slower than rates of white corals DPC-16 and 17. Based on the growth ring density in the axial skeleton, Luan et al. (2013) estimated the growth rate in diameter of Japanese red coral DPC-18 to be 0.24 ± 0.02 mm/y on average (Table 2), and the present value was roughly equivalent.
Four slabs for the cross section of Japanese red coral DPC-19 were taken from the base of the main axial skeleton (DPC-19-A-5-2) which was located at the bottom of the coral, from the bottom of the branched axial skeleton (DPC-19-B-1-2) which was located at the bottom of the branched coral, from the middle of the branched axial skeleton (DPC-19-D-1-2) which was located in the middle of the branched coral, and from the tip of the branched axial skeleton (DPC-19-F-2). The distances were 49.9 mm between A-5-2 to B-1-2, 66.7 mm between B-1-2 to D-1-2, and 50.6 mm between D-1-2 to F-2. In DPC-19, the center of axis was deviated to one side.
The 210Pb concentration in DPC-19 decreased with distance from the axis surface to the center of the axis and then it increased to the opposite side of the skeleton surface (Figures 7A–D). The radial growth rates of the main stem of Japanese red coral DPC-19 for the radius of the major axis were estimated as 0.20 mm/y for A-5-2, 0.14 mm/y for B-1-2, 0.19 mm/y for D-1-2, and 0.10 mm/y for F-2 (Table 2). Those for the radius of the minor axis were estimated as 0.07 mm/y for A-5-2, 0.06 mm/y for B-1-2, 0.03 mm/y for D-1-2, and 0.05 mm/y for F-2 (Table 2). The growth rates in diameter of DPC-19 were calculated as 0.27 mm/y at the base of the main axial skeleton, 0.20 mm/y at the bottom of the branched axial skeleton, 0.22 mm/y at the middle of the branched axial skeleton, and 0.15 mm/y at the tip of the branched axial skeleton with the mean value of 0.21 ± 0.05 mm/y (Table 2). Based on the growth ring density in the axial skeleton, the growth rates in diameter of DPC-19 were reported as 0.27 mm/y at the base of the main axial skeleton, 0.23 mm/y at the bottom of the branched axial skeleton, 0.28 mm/y at the middle of the branched axial skeleton, and 0.28 mm/y at the tip of the branched axial skeleton with the mean value of 0.27 ± 0.01 mm/y (Table 2; Luan et al., 2013). Although the positions of the axial skeleton analyzed here and in Luan et al. (2013) were not exactly the same place, the two were roughly comparable.
Three slabs for the cross section of Japanese red coral DPC-20 were taken from the base of the main axial skeleton (DPC-20-A-2-2-2) which was located at the bottom of the coral, from the bottom of the branched axial skeleton (DPC-20-C-2-3) which was located at the bottom of the branched coral, and from the middle of the branched axial skeleton (DPC-20-D-2-2) which was located in the middle of the branched coral (Figure 8A). The distances were 46.4 mm between A-2-2 to C-2-3 and 16.4 mm between C-2-3 to D-2-2. In DPC-20-D-2-2, the center of the axis was shifted to one side.
The 210Pb concentration in DPC-20 decreased with distance from the skeleton surface to the center of the axis and then it increased to the opposite side of the axis surface (Figures 8B–D). The radial growth rates of the main stem of Japanese red coral DPC-20 were estimated as 0.20 mm/y for A-2-2-2, 0.29 mm/y for C-2-3, and 0.14 mm/y for D-2-2 (Table 2). Those for the opposite side were estimated as 0.17 mm/y for A-2-2-2, 0.19 mm/y for C-2-3, and 0.09 mm/y for D-2-2 (Table 2). The growth rates in diameter of DPC-19 were calculated as 0.37 mm/y at the base of the main axial skeleton, 0.48 mm/y at the bottom of the branched axial skeleton, and 0.23 mm/y at the middle of the branched axial skeleton with the mean value of 0.36 ± 0.13 mm/y (Table 2). The growth rates in diameter of DPC-20 were reported as 0.23 mm/y at the base of the main axial skeleton, and 0.14 mm/y at the middle of the branched axial skeleton with the mean value of 0.20 ± 0.08 mm/y (Table 2; Luan et al., 2013). The growth rate in diameter of Japanese red coral DPC-18 obtained here was slightly faster than that obtained by Luan et al. (2013).
Three slabs for the cross section of white coral DPC-21 were taken from the base of the main axial skeleton (DPC-21-C-2-2) which was located at the bottom of the coral, from the bottom of the branched axial skeleton (DPC-21-B-2-2) which was located at the bottom of the branched coral, and from the middle of the branched axial skeleton (DPC-21-B-5-1-2-2-1) which was located in the middle of the branched coral (Figure 9A). The distances were 45.5 mm between C-2-2 to B-2-2 and 59.5 mm between B-2-2 to B-5-1-2-2-1.
The 210Pb concentration in the axis surface in DPC-21-C-2-2 was 18.5 ± 0.9 mBq/g and it decreased exponentially with distance from the axis surface to the center of the axis; a minimum of 5.00 ± 0.22 mBq/g was identified at the center of the axis; and then it increased exponentially to the opposite side of the axis surface (Figure 9B). The 210Pb concentration in DPC-21-B-2-2 also had the same distribution pattern as that in DPC-21-C-2-2 (Figure 9C). In DPC-21-B-5-1-2-2-1, the 210Pb concentration in the axis surface of one side was 12.1 ± 0.8 mBq/g, however, the high 210Pb concentration of 31.7 ± 2.8 mBq/g was obtained in the axis surface of the opposite side (Figure 9D). This high value was possibly due to the coenenchyme that might not have been completely removed. Therefore, no estimation of growth rate has done for DPC-21-B-5-1-2-2-1. The radial growth rates of the main stem of white coral DPC-21 were estimated as 0.36 mm/y in DPC-21-C-2-2 and 0.13 mm/y in DPC-21-B-2-2 for one side, and 0.17 mm/y in DPC-21-C-2-2 and 0.05 mm/y in DPC-21-B-2-2 for the opposite side (Table 2). The growth rates in diameter of DPC-21 were calculated as 0.53 mm/y at the base of the main axial skeleton and 0.18 mm/y at the bottom of the branched axial skeleton with the mean value of 0.36 ± 0.25 mm/y (Table 2). Luan et al. (2013) estimated the growth rate in diameter of white coral DPC-21 to be 0.46 mm/y at the base of the main axial skeleton and 0.39 mm/y at the bottom of the branched axial skeleton with the mean value of 0.44 ± 0.04 mm/y (Table 2), and the present value was roughly equivalent.
Two different methods have been employed for estimating the linear growth rate of the colony: one uses the slope of the best fit curve for the increase in the mean 210Pb concentration along the cross transects of the axis; and the other uses the increase in the 210Pb concentration of the center of the skeleton axis. The linear growth rates of the colony (this study and Luan et al., 2013) are given in Table 3.
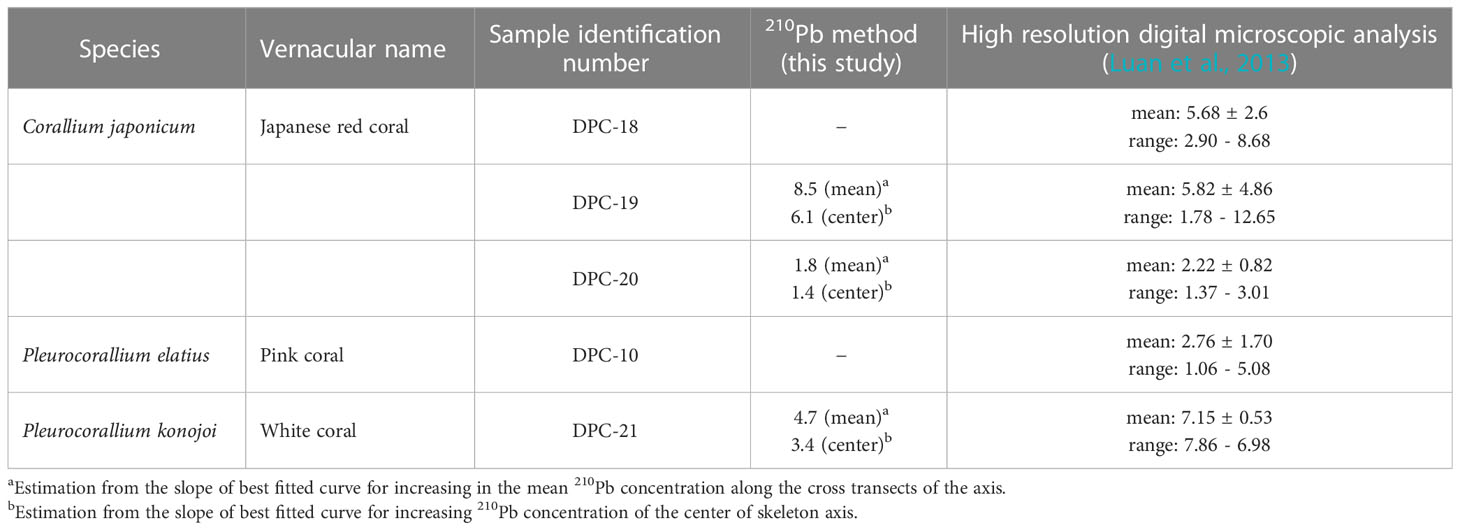
Table 3 Comparison of linear growth rates (mm/y) of precious corals.
Distance distributions of 210Pb concentrations in Japanese red coral DPC-19 for estimation of linear growth rate of the colony are shown in Figure 10A. Distances from the base (A-5) were 49.9 mm to B-1 in the bottom of the branched axial skeleton, 116.6 mm to D-1 in the lower quarter of the branched axial skeleton, 167.2 mm to F-2 in the center of the branched axial skeleton, and 278.7 mm to H-2 at the tip of the axial skeleton (Figure 1B). Both of the mean 210Pb concentration along the cross transects of the axis and the 210Pb concentration of the center of the skeleton axis increased exponentially with increasing distance. The linear growth rates of the colony of DPC-19 were estimated to be 8.5 mm/y from the slope of the increase in the mean 210Pb concentration and 6.1 mm/y from that of the increase in the 210Pb concentration of the center of the skeleton axis (Table 3). Based on the number of annual growth rings and the diameters of the axial skeleton obtained using the high-resolution digital microscope, Luan et al. (2013) reported that the linear growth rate of DPC-19 ranged from 1.78 to 12.65 mm/y with the mean value of 5.82 ± 4.86 mm/y (n=3) (Table 3). The linear growth rates of 6.1 and 8.5 mm/y estimated in the present study were in good agreement with those reported by Luan et al. (2013).
Distance distributions of 210Pb concentrations in Japanese red coral DPC-20 are shown in Figure 10B. Distances from the base (A-2) were 46.4 mm to B-2 in the bottom of the branched axial skeleton, 62.8 mm to D-2 in the middle of the branched axial skeleton, and 165.5 mm to G-2 in the tip of the axial skeleton (Figure 8A). Both the mean 210Pb concentration along the cross transects of the axis and the 210Pb concentration of the center of the skeleton axis increased exponentially with increasing distance except for the 210Pb concentration in the tip of the axial skeleton (G-2). The linear growth rates of the colony of DPC-20 were estimated to be 1.8 mm/y from the slope of the increase in the mean 210Pb concentration and 1.4 mm/y from that of the increase in the 210Pb concentration of the center of the skeleton axis (Table 3). Luan et al. (2013) reported that the linear growth rate of DPC-20 ranged from 1.37 to 3.01 mm/y with the mean value of 2.22 ± 0.82 mm/y (n=3) (Table 3), and the present value was roughly equivalent.
Distance distributions of 210Pb concentrations in white coral DPC-21 are shown in Figure 10C. Distances from the base (C-2) were 45.5 mm to B-2 in the bottom of the branched axial skeleton, 105.0 mm to B-5 in the middle of the branched axial skeleton, and 139.4 mm to B-6 in the tip of the axial skeleton (Figure 9A). Both the mean 210Pb concentration along the cross transects of the axis and the 210Pb concentration of the center of the skeleton axis increased exponentially with increasing distance except for the 210Pb concentration in the tip of the axial skeleton (B-6). Similar to the result for DPC-20, an extremely low 210Pb concentration was observed in the tip of the axial skeleton. The reason for the extremely low 210Pb concentration observed in the tip of the axial skeleton for DPC-20 and 21 is unknown at this time. The linear growth rates of the colony of DPC-21 were estimated to be 4.7 mm/y from the slope of the increase in the mean 210Pb concentration and 3.4 mm/y from that of the increase in the 210Pb concentration of the center of the skeleton axis (Table 3). Luan et al. (2013) reported that the linear growth rate of DPC-21 ranged from 6.60 to 7.86 mm/y with the mean value of 7.15 ± 0.53 mm/y (n=3) (Table 3), which was slightly faster than the present rate.
Iwasaki et al. (2022) carried out the in-situ culture of Japanese red coral for 98 months at a depth of 135 m off Takeshima Island, Kagoshima Prefecture and analyzed it by microscopic X-ray fluorescence/soft X-ray photoabsorption speciation mapping. They showed that the growth ring was light in color when the water temperature was increasing, and conversely, a dark band in the growth ring was observed when the water temperature was decreasing: the distribution patterns of S and Mg concentrations corresponded to the dark and light bands in the annual growth rings. They also found that the radial growth rate of the main stem (diameter) of the in-situ cultured Japanese red coral was 0.37 mm/y (Table 4). In addition, two radial growth rates (diameter) of Japanese red coral were reported: 0.21 mm/y obtained using the 14C method (Okumura et al., 2020) and 0.22 mm/y obtained using synchrotron infrared mapping analysis (Iwasaki et al., 2014) (Table 4). The radial growth rate (diameter) of 0.31 mm/y (DPC-18) of Japanese red coral and the mean radial growth rates (diameter) of 0.21 ± 0.05 (DPC-19) and 0.36 ± 0.13 (DPC-20) of Japanese red coral (Table 2) in the present study were within the range of the previously reported radial growth rates (Iwasaki et al., 2014; Okumura et al., 2020; Iwasaki et al., 2022).
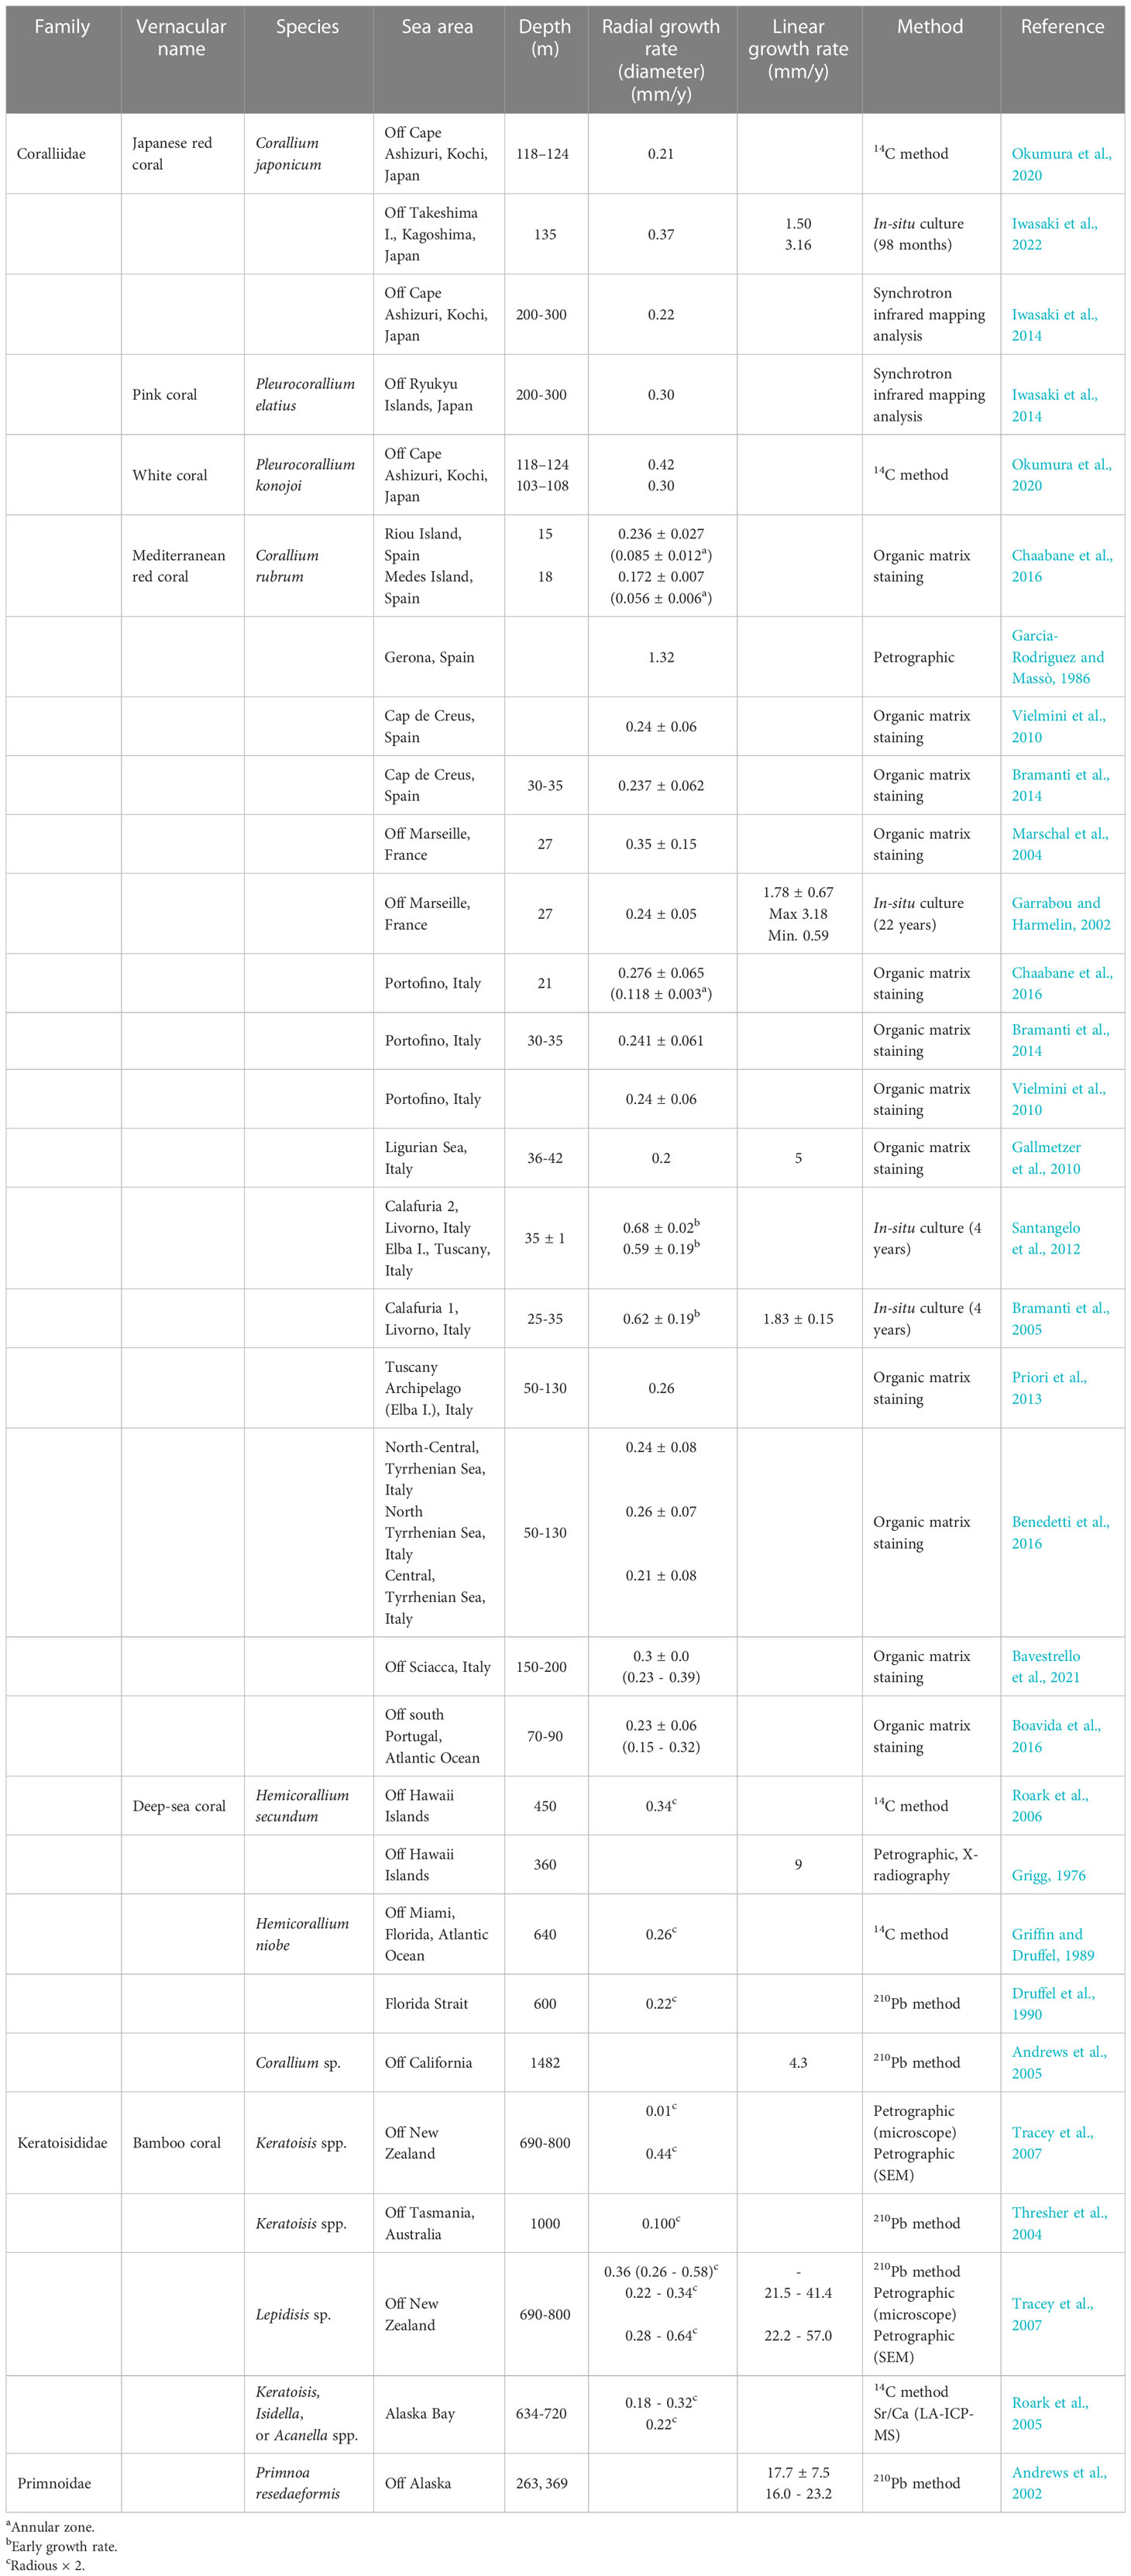
Table 4 Comparison of radial and linear growth rates in precious corals and other octocorallian corals.
Iwasaki et al. (2014) reported the radial growth rate (diameter) of 0.30 mm/y of pink coral collected off the Ryukyu Islands using the synchrotron infrared mapping analysis (Table 4). The radial growth rate (radius) of pink coral (DPC-10-1Ca) was estimated to be 0.15 mm/y (Table 2) in the present study, which corresponded to the radial growth rate (diameter) of 0.30 mm/y (radius × 2) and was comparable with the value for Iwasaki et al. (2014).
The radial growth rates (diameter) of white coral were reported to be 0.42 mm/y at a depth of 118−124 m and 0.30 mm/y at a depth of 103−108 m for samples collected off Cape Ashizuri, Kochi Prefecture using the 14C method (Okumura et al., 2020) (Table 4). The radial growth rate of the main stem (diameter) of 0.52 mm/y (DPC-16) and 0.60 mm/y (DPC-17) of white coral and the mean radial growth rate (diameter) of 0.36 ± 0.25 (DPC-21) of white coral (Table 2) in the present study were slightly higher than the values from Okumura et al. (2020).
The radial growth rates of the main stem of Mediterranean red coral collected off the coasts of Italy, France, and Spain have been widely investigated using mostly the organic matrix staining method (Table 4; Marschal et al., 2004; Gallmetzer et al., 2010; Vielmini et al., 2010; Priori et al., 2013; Bramanti et al., 2014; Benedetti et al., 2016; Boavida et al., 2016; Chaabane et al., 2016; Bavestrello et al., 2021). The radial growth rates (diameter) of Mediterranean red coral obtained using organic matrix staining were reported as: 0.172 ± 0.007 mm/y at a depth of 18 m, Medes Island, Spain (Chaabane et al., 2016); 0.241 ± 0.007 mm/y at a depth of 30-35 m, Portofino, Italy (Bramanti et al., 2014); 0.26 mm/y at a depth of 50-130 m, Tuscany Archipelago, Italy (Priori et al., 2013); and 0.35 ± 0.15 mm/y at a depth of 27 m, off Marseille, France (Marschal et al., 2004). They were as similar to the present values for Japanese red corals of 0.31 mm/y (DPC-18), 0.21 ± 0.05 mm/y (DPC-19), and 0.36 ± 0.25 mm/y (DPC-20) (Table 2). In addition, the radial growth rates (diameter) from three in-situ culture experiments were reported as: 0.24 ± 0.05 mm/y for 22 years of culturing at a depth of 27 m, off Marseille, France (Garrabou and Harmelin, 2002); 0.68 ± 0.02 mm/y, Calafuria 2, Livorno, Italy and 0.59 ± 0.19 mm/y, Elba, Tuscany, Italy for 4 years of culturing at a depth of 35 ± 1 m (Santangelo et al., 2012); and 0.62 ± 0.19 mm/y for 4 years of culturing at a depth of 25−35 m, Calafuria 1, Livorno, Italy (Bramanti et al., 2005) (Table 4). The radial growth rates of Mediterranean red coral obtained from Bramanti et al. (2005) and Santangelo et al. (2012) were higher than other estimates because of the higher growth rate (in basal diameter) occurring in the first four years of colony life. The growth rate quickly decreased in older colonies (Priori et al., 2013; Bramanti et al., 2014) and the decrease followed a monotonic curve with a negative exponent (Priori et al., 2013). Santangelo et al. (2012) suggested that a higher growth was evident during the first years of colony life and early colony growth rates of Mediterranean red coral were different in geographically distinct populations and constant over time in the same area.
Three radial growth rates (diameter) of deep-sea coral obtained using the radiometric methods were reported as: 0.34 mm/y at a depth of 450 m, off the Hawaii Islands, USA obtained by the 14C method (Roark et al., 2006); 0.26 mm/y at a depth of 640 m, off Miami, USA obtained by the 14C method (Griffin and Druffel, 1989); and 0.22 mm/y at a depth of 600 m, Florida Strait, USA obtained by the 210Pb method (Druffel et al., 1990) (Table 4). The reported growth rates of bamboo corals were in the range of 0.10 to 0.44 mm/y (Table 4; Thresher et al., 2004; Roark et al., 2005; Tracey et al., 2007). For both deep-sea coral and bamboo coral, the growth rates were comparable with the values for Mediterranean red corals obtained using organic matrix staining (Priori et al., 2013; Bramanti et al., 2014) and those for Japanese red corals (DPC-18, -19, and -20) in the present study.
The linear growth rates of the colony estimated from the slope of the increase in the mean 210Pb concentration along the cross transects of the axis were faster than those from the slope of the increase in the 210Pb concentration of the center of the skeleton axis for all precious corals DPC-19, -20, and -21 (Figures 10A, B, C). It is known that the growth rate in the center of the skeleton axis is faster than that in the periphery and that the growth rate in the early stages (1-4 years) is fast and then slows down (Chaabane et al., 2016). Based on the high resolution microscopic analysis, the growth rate at the tip was reported to be slower than that at the base (Table 2; calculated from growth ring count data in Luan et al., 2013). This is because the thicker the diameter of the skeletal axis, the lower the percentage occupied by the central part, and the narrower the tip, the higher the percentage occupied by the central part. It is not clear at this time why the linear growth rates of the colony obtained from the slope of the increase in the mean 210Pb concentration along the cross transects of the axis were faster than those from the slope of the increase in the 210Pb concentration of the center of the skeleton axis.
Roark et al. (2005) determined Δ14C in bamboo corals collected from the Gulf of Alaska and they estimated the linear growth rates to range from 0.05 ± 0.01 mm/y to 0.16 ± 0.01 mm/y. They suggested that larger individual corals were growing faster than smaller ones and that the growth rate was not uniform over the life of the corals. Iwasaki et al. (2022) found that the linear growth rates of the in-situ cultured Japanese red coral were 1.50 and 3.16 mm/y (Table 4), which were roughly equivalent to the present values of white coral (DPC-21; 3.4 or 4.7 mm/y), and were slightly slower than that of Japanese red coral (DPC-19; 6.1 or 8.5 mm/y) (Table 3). Furthermore, the linear growth rates of the in-situ cultured Mediterranean red coral were reported as: 1.78 ± 0.67 mm/y for 22 years of culturing (Garrabou and Harmelin, 2002) and 1.83 ± 0.15 mm/y for 4 years of culturing (Bramanti et al., 2005) (Table 4), which were in good agreement with the present values of Japanese red coral (DPC-20; 1.4 or 1.8 mm/y) (Table 3).
The nascent axis and its tips, which become the center of a cross section of the axis (the medullar zone), are formed by aggregations of sclerites secreted by scleroblasts in the coenenchyme. The axis is then surrounded with deposits of calcium carbonate secreted by the axis epithelium, causing the axis to thicken and elongate with age (Allemand, 1993; Grillo et al., 1993; Allemand and Bénazet-Tambutté, 1996; Perrin et al., 2015; Urushihara et al., 2016). Previous studies have shown that the growth rate of the axis is not constant but faster initially and becomes slower with age (Priori et al., 2013; Bramanti et al., 2014; Benedetti et al., 2016; Boavida et al., 2016; Chaabane et al., 2016). For example, a comparison of growth rates between the medullar and the annular zones showed that the medullar zone grew faster (Chaabane et al., 2016); the growth rate in the first four years was reported to be two to three times faster than the growth rate in subsequent years (Bramanti et al., 2005; Santangelo et al., 2012; Bramanti et al., 2014); and, in some cases, growth was found to be negligible or to stop (Bavestrello et al., 2010). Growth rates have also been reported to vary within the same colony: the main branch grows more slowly after it branches, secondary branches grow comparatively faster (Harmelin, 1984); and apical branches (new growth at the tips) grow fastest (Benedetti et al., 2016).
These reports suggest that accurate estimates of growth rate cannot be obtained by simply counting growth rings and dividing the thickness (radius or diameter) of the axis by the number of rings. That is, the growth rate of a thin axis will be overestimated because a relatively large proportion of the cross section is occupied by the central portion, i.e. the fast-growing medullar zone. Conversely, the growth rate will be underestimated in a thick axis due to its proportionately larger annular zone. The 210Pb dating method compares the difference in concentration between the medullar and annular zones. Therefore, this problem does not occur and average values can be estimated. Also, in growth ring counting, discontinuous rings found near the medullar zone and crossed rings (Chaabane et al., 2016) are sources of error. However, the 210Pb dating method does not use growth rings to estimate growth rates, so errors due to growth lines do not occur.
The growth rates of the precious corals in the present study have supported the results obtained in previous studies. The obtained rates of the precious corals were slower than those of hermatypic corals whose bone axis is aragonite (5−10 mm/y at the slowest for genus Montastrea, and 100−150 mm/y at the fastest for family Acroporidae (Dullo, 2005)) and those of black corals whose bone axis is keratin (6.42 cm/y for Antipathes dichotoma (Grigg, 1976); up to 159 cm/y for Stichopathes cf. maldivensis (Bo et al., 2009)). The lifespan of the precious corals estimated from the growth rate tended towards longevity. The ages obtained from the growth rate of the precious corals (excluding Keratoisis sp.) in the present study ranged from 17.6 to 98.7 years old (Table 2). The age of DPC-15 (P. elatius), which had the largest axis diameter of 51.16 mm among the present species of interent, was estimated to be 138.3 years old using the average growth rate of 0.37 mm/y for DPC-10 (P. elatius) as the growth rate of DPC-15 was not available. The characteristics of slow growth rate and longevity of precious corals indicate that they are vulnerable to excessive fishing pressure and take a long time to recover from fishing impacts (Althaus et al., 2009; Clark et al., 2016; Baco et al., 2019; Santangelo, 2022). Biological and ecological parameters such as growth rate, recruitment, natural mortality, and reproductive fecundity are necessary for fisheries management, and this study provides accurate growth rates.
The precious corals have been overfished for many years and they require proper management to ensure the survival of the species and resources. In recent years, heatwaves, which are phenomena in which seawater temperature rises rapidly due to global warming, have occurred in the Mediterranean Sea, and the mass mortality of red corals has become a serious issue (Garrabou et al., 2001; Garrabou et al., 2009; Gomez-Gras et al., 2021). For the red coral (C. ruburum), a demographic approach has been used to evaluate the impact of mortality and its recovery due to heavy fishing pressure and heatwaves (Santangelo et al., 2007; Priori et al., 2013; Bramanti et al., 2016; Baco et al., 2023). The results of ecological research are utilized in resource management, and the General Fisheries Commission for the Mediterranean regulates fisheries by stipulating minimum harvestable colony size, minimum landing size, and minimum depth for fishing activities (General Fisheries Commission for the Mediterranean, 2014; Cannas et al., 2019). In Hawaii, based on the Beverton and Holt yield-recruit model, the maximum sustainable yield (MSY) for H. secundum has been estimated (Grigg, 1976). On the other hand, since the demographic parameters such as population size and density, age frequency distribution, growth rate, fecundity and mortality (Ebert, 1999; Santangelo et al., 2007; Bramanti et al., 2016) have not been obtained for the precious corals in Japanese waters, the resource management by a demographic approach has not been carried out. In the present study, the radial and linear growth rates for the precious corals in Japanese waters were estimated by the 210Pb method; thus, one of the demographic parameters was obtained for them. These results make it possible to obtain data on the age and age frequency distribution of a population based on accurate growth rates, opening the way to resource management using a demographic approach.
Some preliminary results of the present study were used as unpublished data to estimate the age of red corals distributed in the waters around Amami Island, Japan. Iwasaki et al. (2012) estimated the radial growth rate was 0.44 mm/y in diameter (the preliminary result), which was within the range of values (0.21−0.56 mm/y) presently obtained for the four red coral samples. However, their estimated rate was faster than the average value of 0.36 mm/y presently obtained which led to an age underestimation by about 1.2 times. For example, the average age of red coral in the waters around Amami Island was 43.7 years old, but it was estimated to be 53.3 years old using the presently obtained average growth rate. In addition, Iwasaki et al. (2012) showed the possibility of sustainable fisheries by rotating the fishing area every 10−20 years based on the age frequency distribution. The different estimates of growth rates lead to different fishing moratorium period of 10−20 years. For example, when the radial growth rate of 0.36 mm/y is used, the fishing moratorium period is about 1.2 times longer (12−24 years) than that when 0.44 mm/y is used. Therefore, the accurate growth rate estimations and age assessments based on them have important implications for resource management.
Both radial and linear growth rates of precious corals are essential information required for ensuring sustainable utilization of the corals. In order to estimate these growth rates, the 210Pb concentrations were determined in the four species of precious corals (Japanese red coral (Corallium japonicum), pink coral (Pleurocorallium elatius), white coral (P. konojoi), and deep-Sea coral (Coralliidae sp.)), and in a bamboo coral (Keratoisis sp.), collected from the southern coast of Japan, in the western North Pacific margin. The 210Pb concentrations in precious corals typically showed the exponential decrease with distance from the edge (axis surface) to the center of the skeleton axis. The radial growth rates of the main stem were estimated from the slope of the best fit curve for the exponential decrease in 210Pb concentration with distance from the edge to the center of the axis in the samples. The radial growth rates (radius) of white coral samples DPC-16 and DPC-17, respectively, were estimated as 0.24 and 0.42 mm/y for one side and 0.28 and 0.18 mm/y for the opposite side, and those in diameter were 0.52 and 0.60 mm/y. The mean growth rates in diameter were estimated as 0.21 ± 0.05 mm/y for Japanese red coral DPC-19, 0.36 ± 0.13 mm/y for Japanese red coral DPC-20, and 0.36 ± 0.25 mm/y for white coral DPC-21. The linear growth rates were estimated from the slope of the best fit curve for the increase in the mean 210Pb concentration along the cross transects of the axis and from that for increasing 210Pb concentration at the center of the axis. The linear growth rates of the colony were estimated to be 8.5 mm/y for DPC-19, 1.8 mm/y for DPC-20, and 4.7 mm/y for DPC-21 from the slope of the increase in the mean 210Pb concentration, and 6.1 mm/y for DPC-19, 1.4 mm/y for DPC-20, and 3.4 mm/y for DPC-21 from the slope of the increase in the center 210Pb concentration of the skeleton axis. The data provided in this study can assist in the management of this important resource in Japanese waters.
The original contributions presented in the study are included in the article/supplementary material. Further inquiries can be directed to the corresponding author.
MY: Methodology, Investigation, Formal analysis, Writing – original draft. AS: Methodology, Investigation, Writing – review and editing. NI: Conceptualization, Methodology, Investigation, Funding acquisition, Project administration, Writing – review and editing. All authors contributed to the article and approved the submitted version.
This work was supported by the Research and Development Projects for Application in Promoting New Policy of Agriculture, Forestry and Fisheries, Ministry of Agriculture and Fisheries, Japan (grant number: 22032) and by a Grant-in-Aid for Scientific Research from the Japan Society for the Promotion of Science (grant number: 20310144).
The authors would like to thank the National Institute of Advanced Industrial Science and Technology, the Department of Fisheries, Kochi Prefecture, and Fukada Salvage & Marine Works Co., Ltd. for providing coral samples. They express their gratitude to T. Ohsato and H. Kawaguchi for providing samples. They are also grateful to Hiroshi Hasegawa, Dianne Tracey, and Giovanni Santangelo for their many valuable suggestions for improvement of the manuscript.
The authors declare that the research was conducted in the absence of any commercial or financial relationships that could be construed as a potential conflict of interest.
All claims expressed in this article are solely those of the authors and do not necessarily represent those of their affiliated organizations, or those of the publisher, the editors and the reviewers. Any product that may be evaluated in this article, or claim that may be made by its manufacturer, is not guaranteed or endorsed by the publisher.
Alderslade P., Mcfadden C. S. (2012). A new genus and species of the family isididae (Coelenterata: octocorallia) from a CMAR biodiversity study, and a discussion on the subfamilial placement of some nominal isidid genera. Zootaxa 3154, 21–39. doi: 10.11646/zootaxa.3154.1.2
Allemand D. (1993). The biology and skeletogenesis of the Mediterranean red coral, a review. Precious Corals Octocoral. Res. 2, 19–39.
Allemand D., Bénazet-Tambutté S. (1996). Dynamics of calcification in the Mediterranean red coral, Corallium rubrum. J. Exp. Zool. 276, 270–278. doi: 10.1002/(SICI)1097-010X(19961101)276:4<270::AID-JEZ4>3.0.CO;2-L
Althaus F., Williams A., Schlacher T. A., Kloser R. J., Green M. A., Barker B. A., et al. (2009). Impacts of bottom trawling on deep-coral ecosystems of seamounts are long-lasting. Mar. Ecol. Prog. Ser. 397, 279–294. doi: 10.3354/meps08248
Andrews A. H., Cailliet G. M., Kerr L. A., Coale K. H., Lundstrom C., DeVogelaere A. P. (2005). “Investigations of age and growth for three species of deep-sea coral from the Davidson seamount off central california,” in Cold-water corals and ecosystems. Eds. Freiwald A., Roberts J. M. (Heidelberg: Springer Berlin), 1021–1038. doi: 10.1007/3-540-27673-4
Andrews A. H., Cordes E. E., Mahoney M. M., Munk K., Coale K. H., Cailliet G. M., et al. (2002). Age, growth and radiometric age validation of a deep-sea, habitat-forming gorgonian (Primnoa resedaeformis) from the gulf of Alaska. Hydrobiologia 471, 101–110. doi: 10.1023/A:1016501320206
Andrews A. H., Stine R. P., Lundstrom C., DeVogelaere A. P. (2009). Growth rate and age determination of bamboo corals from the northeastern pacific ocean using refined 210Pb dating. Mar. Ecol. Prog. Ser. 397, 173–185. doi: 10.3354/meps08193
Ardila N. E., Giribet G., Sánchez J. A. (2012). A time-calibrated molecular phylogeny of the precious corals: reconciling discrepancies in the taxonomic classification and insights into their evolutionary history. BMC Evol. Biol. 12, 246. doi: 10.1186/1471-2148-12-246
Auster P. J., Gjerde K., Heupel E., Watling L., Grehan A., Rogers A. D. (2011). Definition and detection of vulnerable marine ecosystems on the high seas: problems with the “move-on” rule. ICES J. Mar. Sci. 68 (2), 254–264. doi: 10.1093/icesjms/fsq074
Baco A. R., Morgan N. B., Roark E. B., Biede V. (2023). Bottom-contact fisheries disturbance and signs of recovery of precious corals in the northwestern Hawaiian islands and emperor seamount chain. Ecol. Indic. 148, 110010. doi: 10.1016/j.ecolind.2023.110010
Baco A. R., Roark E. B., Morgan N. B. (2019). Amid fields of rubble, scars, and lost gear, signs of recovery observed on seamounts on 30- to 40-year time scales. Sci. Adv. 5, eaaw4513. doi: 10.1126/sciadv.aaw4513
Bavestrello G., Bo M., Calcagnile L., Canessa M., D’Elia M., Quarta G., et al. (2021). The sub-fossil red coral of sciacca (Sicily channel, Mediterranean sea): colony size and age estimates. Facies 67, 13. doi: 10.1007/s10347-020-00620-x
Bavestrello G., Cerrano C., Cattaneo-Vietti R. (2010). “Biological interactions affecting the growth rates of red coral (Corallium rubrum) colonies,” in Proceedings of the 1st symposium on the coralligenous and other calcareous bio-concretions of the Mediterranean Sea. Eds. Bussoletti E., Cottingham D., Bruckner A., Roberts G., Sandulli R. (Napoli: NOAA Technical Memorandum CRCP-13, Silver Spring), 151–158.
Benedetti M. C., Priori C., Erra F., Santangelo G. (2016). Growth patterns in mesophotic octocorals: timing the branching process in the highly-valuable Mediterranean Corallium rubrum. Est. Coast. Shelf Sci. 171, 106–110. doi: 10.1016/j.ecss.2015.12.026
Bo M., Di Camillo C. G., Addamo A. M., Valisano L., Bavestrello G. (2009). Growth strategies of whip black corals (Cnidaria: antipatharia) in the bunaken marine park (Celebes Sea, Indonesia). Mar. Biodivers. Rec. 2, e54. doi: 10.1017/S1755267209000712
Boavida J., Paulo D., Aurelle D., Arnaud-Haond S., Marschal C., Reed J., et al. (2016). A well-kept treasure at depth: precious red coral rediscovered in atlantic deep coral gardens (SW Portugal) after 300 years. PloS One 11 (1), e0147228. doi: 10.1371/journal.pone.0147228
Bramanti L., Benedetti M. C., Cupido R., Cocito S., Priori C., Erra F., et al. (2016). “Demography of animal forests: the example of Mediterranean gorgonians,” in Marine animal forests. Ed. Rossi S. (Cham, Switzerland: Springer International Publishing Switzerland), 1–20. doi: 10.1007/978-3-319-17001-5_13-1
Bramanti L., Magagnini G., De Maio L., Santangelo G. (2005). Recruitment, early survival and growth of the Mediterranean red coral Corallium rubrum (L. 1758), a 4-year study. J. Exp. Mar. Biol. Ecol. 314, 69–78. doi: 10.1016/j.jembe.2004.08.029
Bramanti L., Vielmini I., Rossi S., Tsounis G., Iannelli M., Cattaneo-Vietti R., et al. (2014). Demographic parameters of two populations of red coral (Corallium rubrum L. 1758) in the north Western Mediterranean. Mar. Biol. 161, 1015–1026. doi: 10.1007/s00227-013-2383-5
Bruckner A. W. (2016). “Advances in management of precious corals to address unsustainable and destructive harvest techniques,” in The cnidaria, past, present and future. Eds. Goffredo S., Dubinsky Z. (Cham, Switzerland: Springer International Publishing Switzerland), 747–786. doi: 10.1007/978-3-319-31305-4
Cannas R., Follesa M. C., Cau A., Cau A., Friedman K. (2019). Global report on the biology, fishery and trade of precious corals. FAO fisheries and aquaculture circular no. 1184 (Rome: Food and Agriculture Organization of the United Nations), 257.
Chaabane S., Correa M. L., Montagna P., Kallel N., Taviani M., Linares C., et al. (2016). Exploring the oxygen and carbon isotopic composition of the Mediterranean red coral (Corallium rubrum) for seawater temperature reconstruction. Mar. Chem. 186, 11–23. doi: 10.1016/j.marchem.2016.07.001
Clark M. R., Althaus F., Schlacher T. A., Williams A., Bowden D. A., Rowden A. A. (2016). The impacts of deep-sea fisheries on benthic communities: a review. ICES J. Mar. Sci. 73 (suppl. 1), i51–i69. doi: 10.1093/icesjms/fsv123
Druffel E. R. M., King L. L., Belastock R. A., Buesseler K. O. (1990). Growth rate of a deep-sea coral using 210Pb and other isotopes. Geochim. Cosmochim. Acta 54, 1493–1500. doi: 10.1016/0016-7037(90)90174-J
Dullo W.-C. (2005). Coral growth and reef growth: a brief review. Facies 51, 33–48. doi: 10.1007/s10347-005-0060-y
Ebert T. A. (1999). Plant and animal populations: methods in demography (San Diego: Academic Press), 308.
Gallmetzer I., Haselmair A., Velimirov B. (2010). Slow growth and early sexual maturity: bane and boon for the red coral Corallium rubrum. Est. Coast. Shelf Sci. 90, 1–10. doi: 10.1016/j.ecss.2010.04.018
Garcia-Rodriguez M., Massò C. (1986). Algunas bases para la determinacion directa de la edad del coral rojo (Corallium rubrum L.). Bol. Inst. Esp. Oceanogr. 3, 65–74.
Garrabou J., Coma R., Bensoussan N., Bally M., Chevaldonné P., Cigliano M., et al. (2009). Mass mortality in northwestern Mediterranean rocky benthic communities: effects of the 2003 heat wave. Glob. Change Biol. 15, 1090–1103. doi: 10.1111/j.1365-2486.2008.01823.x
Garrabou J., Harmelin J. G. (2002). A 20-year study on life-history traits of a harvested long-lived temperate coral in the NW Mediterranean: insights into conservation and management needs. J. Anim. Ecol. 71, 966–978. doi: 10.1046/j.1365-2656.2002.00661.x
Garrabou J., Perez T., Sartoretto S., Harmelin J. G. (2001). Mass mortality event in red coral corallium rubrum populations in the Provence region (France, NW Mediterranean). Mar. Ecol. Prog. Ser. 217, 263–272. doi: 10.3354/meps217263
General Fisheries Commission for the Mediterranean (2014). Report of the workshop on the regional management plan on red coral in the Mediterranean. Brussels Belgium: GFCM., 15.
Gili J.-M., Coma R. (1998). Benthic suspension feeders: their paramount role in littoral marine food webs. Trends Ecol. Evol. 13, 316–321. doi: 10.1016/S0169-5347(98)01365-2
Gomez-Gras D., Linares C., Lopez-Sanz A., Amate R., Ledoux J. B., Bensoussan N., et al. (2021). Population collapse of habitat-forming species in the Mediterranean: a long-term study of gorgonian populations affected by recurrent marine heatwaves. Proc. R. Soc B: Biol. Sci. 288, 20212384. doi: 10.1098/rspb.2021.2384
Griffin S., Druffel E. R. M. (1989). Sources of carbon to deep-sea corals. Radiocarbon 31, 533–543. doi: 10.1017/S0033822200012121
Grigg R. W. (1976). “Fishery management of precious and stony corals in Hawaii,” in NOAA-Sea Grant technical report UNIHI-Seagrant-TR-77-03, HIMB contribution no 490 (Hawaii: University of Hawaii, Sea Grant).
Grillo M.-C., Goldberg W. M., Allemand D. (1993). Skeleton and sclerite formation in the precious red coral Corallium rubrum. Mar. Biol. 117, 119–128. doi: 10.1007/BF00346433
Harmelin J. G. (1984). Biologie du corail rouge. paramètres de populations, croissance et mortalité naturelle. etat des connaissances en France. FAO Fish. Rep. 306, 99–103.
Hasegawa H., Rahman M. A., Luan N. T., Maki T., Iwasaki N. (2012). Trace elements in Corallium spp. as indicators for origin and habitat. J. Exp. Mar. Biol. Ecol. 414-415, 1–5. doi: 10.1016/j.jembe.2012.01.005
Hasegawa H., Yamada M. (2010). “Chemical analyses of carbonate skeletons in precious corals,” in A biohistory of precious corals. Ed. Iwasaki N. (Hadano, Kanagawa: Tokai University Press), 43–60.
Iwasaki N. (2019). “Asian regional report on the biology, fishery and trade of precious and semi-precious corals,” in Global report on the biology, fishery and trade of precious corals. Eds. Cannas R., Follesa M. C., Cau A., Cau A., Friedman K. (Rome: Food and Agriculture Organization of the United Nations), 191–254.
Iwasaki N., Hasegawa H., Suzuki A., Moriwaki T., Ikemoto Y. (2014). Structural analysis of precious coral carbonate layers using synchrotron radiation-infrared rays. Bunseki Kagaku 63 (7), 593–502. doi: 10.2116/bunsekikagaku.63.593
Iwasaki N., Hasegawa H., Tamenori Y., Kikunaga M., Yoshimura T., Sawai H. (2022). Synchrotron μ-XRF mapping analysis of trace elements in in-situ cultured Japanese red coral, Corallium japonicum. PeerJ 10, e13931. doi: 10.7717/peerj.13931
Iwasaki N., Suzuki T. (2010). “Biology of precious corals,” in A biohistory of precious corals. Ed. Iwasaki N. (Hadano, Kanagawa: Tokai University Press), 3–25.
Iwasaki N., Fujita T., Bavestrello G., Cattaneo-Vietti R. (2012). Morphometry and population structure of non-harvested and harvested populations of the Japanese red coral (Paracorallium japonicum) off Amami Island, southern Japan. Mar. Freshw. Res. 63, 468–474. doi: 10.1071/mf11254
Jones C. G., Lawton J. H., Shachak M. (1994). Organisms as ecosystem engineers. Oikos 69, 373–386. doi: 10.2307/3545850
Kise H., Iguchi A., Saito N., Yoshioka Y., Uda K., Suzuki T., et al. (2023). Genetic population structure of the precious coral Corallium japonicum in the Northwest Pacific. Front. Mar. Sci. 10, 1052033. doi: 10.3389/fmars.2023.1052033
Ledoux J. B., Garrabou J., Bianchimani O., Drap P., Feral J. P., Aurelle D. (2010). Fine-scale genetic structure and inferences on population biology in the threatened Mediterranean red coral, Corallium rubrum. Mol. Ecol. 19 (19), 4204–4216. doi: 10.1111/j.1365-294X.2010.04814.x
Lendvay B., Cartier L. E., Costantini F., Iwasaki N., Everett M. V., Krzemnicki M. S., et al. (2022). Coral-ID: a forensically validated genetic test to identify precious coral material and its application to objects seized from illegal traffic. Forensic Sci. Int. Genet. 58, 102663. doi: 10.1016/j.fsigen.2022.102663
Lendvay B., Cartier L. E., Gysi M., Meyer J. B., Krzemnicki M. S., Kratzer A., et al. (2020). DNA Fingerprinting: an effective tool for taxonomic identification of precious corals in jewelry. Sci. Rep. 10, 8287. doi: 10.1038/s41598-020-64582-4
Luan N. T., Rahman M. A., Maki T., Iwasaki N., Hasegawa H. (2013). Growth characteristics and growth rate estimation of Japanese precious corals. J. Exp. Mar. Biol. Ecol. 441, 117–125. doi: 10.1016/j.jembe.2013.01.012
Lumsden S. E., Hourigan T. F., Bruckner A. W., Dorr G. (2007). The state of deep coral ecosystems of the United States ( Silver Springs, Maryland: NOAA Technical Memorandum CRCP-3. Silver Spring MD).
Marschal C., Garrabou J., Harmelin J. G., Pichon M. (2004). A new method for measuring growth and age in the precious red coral Corallium rubrum (L.). Coral Reefs 23, 423–432. doi: 10.1007/s00338-004-0398-6
McFadden C. S., Van Ofwegen L. P., Quattrini A. M. (2022). Revisionary systematics of octocorallia (Cnidaria: anthozoa) guided by phylogenomics. Bull. Soc Syst. Biol. 1 (3), 1–79. doi: 10.18061/bssb.v1i3.8735
Noé S. U., Dullo W.-C. (2006). Skeletal morphogenesis and growth mode of modern and fossil deep-water isidid gorgonians (Octocorallia) in the West Pacific (New Zealand and Sea of Okhotsk). Coral Reefs 25, 303–320. doi: 10.1007/s00338-006-0095-8
Ogi S. (2010). “Coral fishery and the kuroshio region in modern Japan,” in A biohistory of precious corals. Ed. Iwasaki N. (Hadano, Kanagawa: Tokai University Press), 163–197.
Okumura T., Kumon F., Tokuyama H. (2020). Radiocarbon dating of precious corals off the southwest coast of Kochi prefecture, southwest Japan. Radiocarbon 63 (1), 195–212. doi: 10.1017/RDC.2020.114
Parrish F. A. (2006). Precious corals, and subphotic fish assemblages. Atoll Res. Bull. 543, 425–438.
Perrin J., Vielzeuf D., Ricolleau A., Dallaporta H., Valton S., Floquet N. (2015). Block-by-block and layer-by-layer growth modes in coral skeletons. Am. Mineral. 100, 681–695. doi: 10.2138/am-2015-4990
Priori C., Mastascusa V., Erra F., Angiolillo M., Canese S., Santangelo G. (2013). Demography of deep-dwelling red coral populations: age and reproductive structure of a highly valued marine species. Est. Coast. Shelf Sci. 118, 43–49. doi: 10.1016/j.ecss.2012.12.011
Ramirez-Llodra E. (2020). “Deep-sea ecosystems: biodiversity and anthropogenic impacts,” in The law of the seabed: access, uses, and protection of seabed resources. Ed. Banet. C. (Leiden, Boston: Brill Nijhoff), 36–60.
Roark E. B., Guilderson T. P., Dunbar R. B., Ingram B. L. (2006). Radiocarbon-based ages and growth rates of Hawaiian deep-sea corals. Mar. Ecol. Prog. Ser. 327, 1–14. doi: 10.3354/meps327001
Roark E. B., Guilderson T. P., Flood-Page S., Dunbar R. B., Ingram B. L., Fallon S. J., et al. (2005). Radiocarbon-based ages and growth rates of bamboo corals from the Gulf of Alaska. Geophys. Res. Lett. 32, L04606. doi: 10.1029/2004GL021919
Santangelo G. (2022). Conservation of long-lived marine species: some hints for adopting a population approach. Arq. Ciên. Mar. Fortaleza 55 (Especial Labomar- 60 anos) 54, 231–259. doi: 10.32360/78515
Santangelo G., Abbiati M., Giannini F., Cicogna F. (2004). Demography of the over-exploited Mediterranean red coral (Corallium rubrum L. 1758). Sci. Mar. 68 (Suppl. 1), 199–204.
Santangelo G., Bramanti L., Iannelli M. (2007). Population dynamics and conservation biology of the over-exploited Mediterranean red coral. J. Theor. Biol. 244, 416–423. doi: 10.1016/j.jtbi.2006.08.027
Santangelo G., Bramanti L., Rossi S., Tsounis G., Vielmini I., Lott C., et al. (2012). Patterns of variation in recruitment and post-recruitment processes of the Mediterranean precious gorgonian coral Corallium rubrum. J. Exp. Mar. Biol. Ecol. 411, 7–13. doi: 10.1016/j.jembe.2011.10.030
Sherwood O. A., Edinger E. N. (2009). Ages and growth rates of some deep-sea gorgonian and antipatharian corals of Newfoundland and Labrador. Can. J. Fish. Aquat. Sci. 66, 142–152. doi: 10.1139/F08-195
Suzuki A., Inoue M., Yokoyama Y. (2010). “Past climate and marine environmental reconstruction using deep-sea precious corals,” in A biohistory of precious corals. Ed. Iwasaki N. (Hadano, Kanagawa: Tokai University Press), 61–82.
Takata K., Iwase F., Iguchi A., Yuasa H., Taninaka H., Iwasaki N., et al. (2021). Genome-wide SNP data revealed notable spatial genetic structure in the deep-Sea precious coral Corallium japonicum. Front. Mar. Sci. 8, 667481. doi: 10.3389/fmars.2021.667481
Tamenori Y., Yoshimura T., Luan N. T., Hasegawa H., Suzuki A., Kawahata H., et al. (2014). Identification of the chemical form of sulfur compounds in the Japanese pink coral (Corallium elatius) skeleton using μ-XRF/XAS speciation mapping. J. Struct. Biol. 186, 214–223. doi: 10.1016/j.jsb.2014.04.001
Thresher R., Stephen R., Rintoul J., Koslow A., Weidman C., Adkins J., et al. (2004). Oceanic evidence of climate change in southern Australia over the last three centuries. Geophys. Res. Lett. 31, L07212. doi: 10.1029/2003GL018869
Tracey D. M., Neil H., Marriott P., Andrews A. H., Cailliet G. M., Sanchez J. A. (2007). Age and growth of tow genera of deep-sea bamboo corals (Family isididae) in new Zealand waters. Bull. Mar. Sci. 81, 393–408.
Tu T.-H., Dai C.-F., Jeng M.-S. (2012). Precious corals (Octocorallia: coralliidae) from the northern West Pacific region with descriptions of two new species. Zootaxa 3395, 1–17. doi: 10.11646/zootaxa.3395.1.1
Tu T.-H., Dai C.-F., Jeng M.-S. (2015). Phylogeny and systematics of deep-sea precious corals (Anthozoa: octocorallia: coralliidae). Mol. Phylogenet. Evol. 84, 173–184. doi: 10.1016/j.ympev.2014.09.031
Tu T.-H., Dai C.-F., Jeng M.-S. (2016). Taxonomic revision of coralliidae with descriptions of new species from New Caledonia and the Hawaiian archipelago. Mar. Biol. Res. 12, 1003–1038. doi: 10.1080/17451000.2016.1241411
Uda K., Komeda Y., Fujita T., Iwasaki N., Bavestrello G., Giovine M., et al. (2013). Complete mitochondrial genomes of the Japanese pink coral (Corallium elatius) and the Mediterranean red coral (Corallium rubrum): a reevaluation of the phylogeny of the family coralliidae based on molecular data. Comp. Biochem. Physiol. Part D 8, 209–219. doi: 10.1016/j.cbd.2013.05.003
Uda K., Komeda Y., Koyama H., Koga K., Fujita T., Iwasaki N., et al. (2011). Complete mitochondrial genomes of two Japanese precious corals, Paracorallium japonicum and Corallium konojoi (Cnidaria, octocorallia, coralliidae): notable differences in gene arrangement. Gene 476, 27–37. doi: 10.1016/j.gene.2011.01.019
Urushihara Y., Hasegawa H., Iwasaki N. (2016). X-Ray micro-CT observation of the apical skeleton of Japanese white coral Corallium konojoi. J. Exp. Mar. Biol. Ecol. 475, 124–128. doi: 10.1016/j.jembe.2015.11.016
Vielmini I., Bramanti L., Tsounis G., Rossi S., Gili J. M., Cattaneo-Vietti R., et al. (2010). “Determination of corallium rubrum population age structure,” in Proceedings of the international workshop on red coral science, management, and trade: lessons from the Mediterranean. Eds. Bussoletti E., Cottingham D., Bruckner A., Roberts G. (Napoli: NOAA Technical Memorandum CRCP-13, Silver Spring), 179–182.
Watling L., France S. C. (2011). A new genus and species of bamboo coral (Octocorallia: isididae: keratoisidinae) from the New England seamounts. Bull. Peabody Mus. Nat. Hist. 52, 209–220. doi: 10.3374/014.052.0202
Watling L., France S. C., Pante E., Simpson A. (2011). “Biology of deep-water octocorals,” in Advances in marine biology, vol. 60 . Ed. Lesser M. (London: Elsevier), 41–122.
Keywords: Japanese red coral, white coral, pink coral, deep-sea coral, bamboo coral, radial growth rate, linear growth rate, 210Pb chronology
Citation: Yamada M, Suzuki A and Iwasaki N (2023) Growth rate estimation by 210Pb chronology in precious corals collected off the southern coast of Japan. Front. Mar. Sci. 10:1091594. doi: 10.3389/fmars.2023.1091594
Received: 07 November 2022; Accepted: 11 May 2023;
Published: 27 June 2023.
Edited by:
Federico Betti, University of Genoa, ItalyReviewed by:
Dianne Margaret Tracey, National Institute of Water and Atmospheric Research (NIWA), New ZealandCopyright © 2023 Yamada, Suzuki and Iwasaki. This is an open-access article distributed under the terms of the Creative Commons Attribution License (CC BY). The use, distribution or reproduction in other forums is permitted, provided the original author(s) and the copyright owner(s) are credited and that the original publication in this journal is cited, in accordance with accepted academic practice. No use, distribution or reproduction is permitted which does not comply with these terms.
*Correspondence: Masatoshi Yamada, bS15YW1hZGFAa2Fpc2Vpa2VuLm9yLmpw
Disclaimer: All claims expressed in this article are solely those of the authors and do not necessarily represent those of their affiliated organizations, or those of the publisher, the editors and the reviewers. Any product that may be evaluated in this article or claim that may be made by its manufacturer is not guaranteed or endorsed by the publisher.
Research integrity at Frontiers
Learn more about the work of our research integrity team to safeguard the quality of each article we publish.