 Hui Li
 Xuekang Lu1
 Yong Chen
94% of researchers rate our articles as excellent or good
Learn more about the work of our research integrity team to safeguard the quality of each article we publish.
Find out more
ORIGINAL RESEARCH article
Front. Mar. Sci., 03 February 2023
Sec. Marine Biogeochemistry
Volume 10 - 2023 | https://doi.org/10.3389/fmars.2023.1091549
This article is part of the Research TopicChemical and Biogeochemical Processes at Methane and Other Cold SeepsView all 15 articles
Most experiments show that gas hydrates are often enriched in C2+ gases relative to the feeding gas source because of fractionation during hydrate crystallization directly from free gases and dissolved gases. However, sediments below and near the base of the gas hydrate stability zone (BGHSZ) in many ocean drilling program (ODP)/International Ocean Discovery Program (IODP) sites are relatively enriched in C2+ hydrocarbon gases, compared with the hydrate-occurring zone above. It is still unclear what kind of process causes the abrupt decreases in C1/C2+ ratios with the depth in headspace gas in sediments around seismic bottom-simulating reflector (BSR) and increasing upward C1/C2 ratios in the hydrate-occurring zone. To test the “dissolution/migration mechanism” and its links to the enrichment of ethane near the BSR and increasing upward C1/C2 ratios in the hydrate-occurring zone, we performed a series of pore-scale experimental observations, simulating the gas dissolution–migration–hydration processes, and investigated the effects of the composition of feeding gases and temperatures on the composition of the hydrate grown under the dissolution–migration mechanism. Hydrates are grown from aqueous fluids supplied by the migration of gases dissolved from the capillary-trapped free gas in a capillary high-pressure optical cell, with different supplying gases (90 mol% CH4 + 10 mol% C2H6, 80 mol% CH4 + 20 mol% C2H6) and a geothermal gradient (temperature from 278.15 to 293.15 K). The gas hydrate structure and composition were determined by quantitative Raman spectroscopy. Our study indicated that (1) under the dissolution–migration–hydration processes, the mole fraction of C2H6 in hydrates is depleted compared with gas sources, which confirms that the dissolution–migration of gases is a mechanism to enrich ethane near the BSR; (2) the proportion of C2H6 in structure I (sI) or structure II (sII) hydrates decreases with decreasing temperature, and decreasing temperature enlarges the difference of diffusion coefficient between methane and ethane and enhances the gas fractionation during migration, which could cause the increase upwardly C1/C2 ratios in the hydrate-occurring zone. A simplified geological model was proposed to explain the variability of hydrate composition with depth in the hydrate-occurring zone and the fractionation of gases near the BSR.
Natural gas hydrates are ice-like crystallites, formed and preserved in conditions of high pressure and low temperature, which exist extensively in marine sediments at deep-sea continental margins (Hester et al., 2007; Kida et al., 2009; Klapp et al., 2010a), in permafrost areas (Lu et al., 2011; Liu et al., 2016), and in deep lakes (Khlystov et al., 2013).
In natural geological environments, gas hydrates can form three different structures [structure I (sI) or structure II (sII), and H], which contain gas hydrocarbon molecules such as methane (C1), ethane (C2), propane (C3), etc. (Sloan, 2003; Sloan, 2008). Methane is the dominant hydrocarbon gas in these gas hydrates (Hester et al., 2007; Kida et al., 2009; Liu et al., 2015) and ethane is the second most important component (Klapp et al., 2010a), accounting for up to 17% of hydrate composition (Liang et al., 2019).
Hydrates are often enriched in C2+ gases relative to void and the pressure core sampler (PCS) gases (Milkov et al., 2004). However, sediments near the base of the gas hydrate stability zone are relatively enriched in C2+ hydrocarbon gases (Milkov et al., 2004; Paganoni et al., 2016), leading to an abrupt decrease in C1/C2+ ratios in headspace gas in sediments around the bottom-simulating reflector (BSR), which has been termed the “geochemical BSR” (Whiticar et al., 1995) (Figure 1). In the hydrate-occurring zone, there is a general trend for the ratio of methane to ethane and heavier hydrocarbons (C1/C2+) to reduce with depth (Milkov et al., 2004; Plaza-Faverola et al., 2017; Wei et al., 2021). As the geochemical processes that occur in the sediments around the depth of the BSR are poorly understood, it is unclear what kind of process could cause ethane enrichment near the BSR and increasing upward C1/C2 ratios in the hydrate-occurring zone.
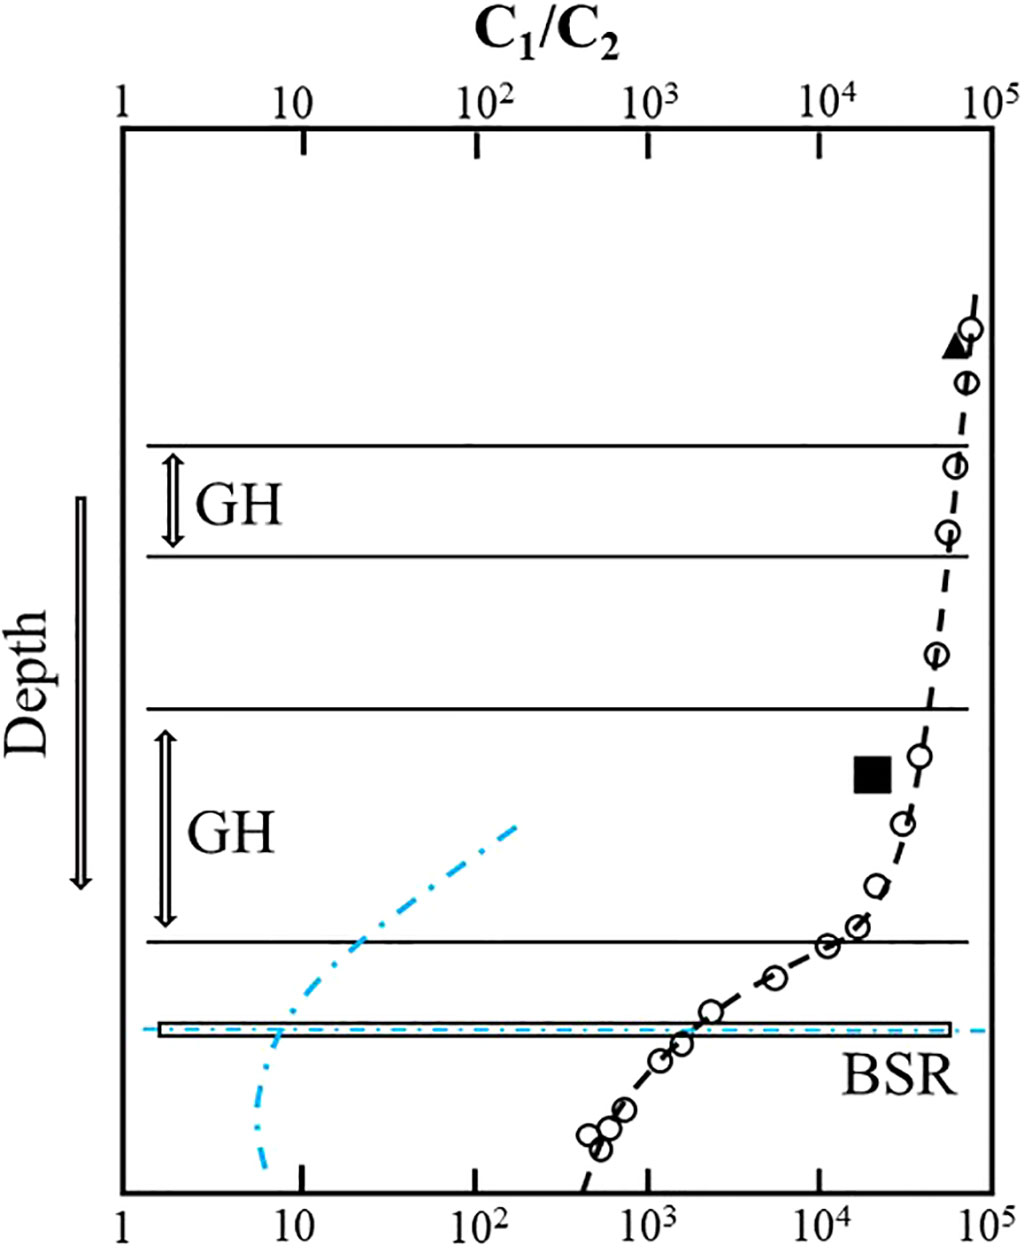
Figure 1 Gas fractionation near and above the bottom-simulating reflector (BSR). C1/C2 ratio in gas voids (open circles) and PCS gases (black triangles) and C1/C2 ratio in hydrates at sites 1,247, ODP Leg 204 (Milkov et al., 2004); blue indicates C1/C2 ratio in gas voids at NW Borneo (Paganoni et al., 2016).
Most experiments show that gas hydrates are often enriched in C2+ gases relative to the feeding gas source. Subramanian (Subramanian et al., 2000) studied the influence of feed gas composition, consisting of different mixtures of CH4 and C2H6, on hydrate structure and composition at three-phase equilibrium [aqueous solution of water (LW)– hydrate (H)–pure vapor phase (V)] conditions and 274.2 K using Raman and nuclear magnetic resonance (NMR) spectroscopic techniques in the laboratory. They found evidence of a change in hydrate structure from sI to sII in between 72.2 and 75 mol% methane in vapor, which was associated with a 20% change in hydrate composition. In addition, they also showed that the ethane component in mixed hydrates was also higher than in original feed gases. Another experiment conducted by Uchida (Uchida et al., 2002) indicated that ethane was enriched in both sI and sII hydrates formed at 150 K and 1–3 MPa. Seo (Seo et al., 2009) found that heavy hydrocarbon molecules of natural gas preferentially occupied large cages of sII hydrates formed by finite methane–ethane–propane–iso-butane gases (CH4–C2H6–C3H8–i-C4H10), resulting in the enrichment of heavy hydrocarbons in the hydrate phase.
Until now, there has been no experimental or numerical simulation work to explain why there are often abrupt decreases in C1/C2+ ratios with depth in headspace gas in sediments around the BSR. Upward migration of gases from the base of the gas hydrate stability zone (BGHSZ) (as well as the corresponding BSR) through the sediment is linked to the concentration of gases in the hydrate-occurring zone. Brown (Brown et al., 1996) proposed a “dissolution–diffusion mechanism”: below the BGHSZ, the bubbles trapped in sediments by capillary forces in the free gas zone must continually dissolve, and methane and ethane in solution are transported upward and incorporated into the hydrate layer. Such “dissolution–migration–hydration” processes could happen in most marine environments, especially at sites with a low flux of upward migration near the BGHSZ.
To test the “dissolution–migration–hydration mechanism” and the links to the enrichment of ethane near the BSR and increasing upward C1/C2 ratios in the hydrate-occurring zone, we performed a series of pore-scale experimental observations, simulating the dissolution–diffusion of gas molecules from a free gas zone and migration in aqueous solution for the growth of hydrate, and studying the fractionation of methane and ethane during the process. The structure and composition of mixed gas hydrates were investigated by in situ Raman spectroscopy. The effects of feed gases and temperatures on the composition and structure of the corresponding hydrates were investigated.
A capillary high-pressure optical cell (HPOC) (Lu et al., 2007; Caumon et al., 2014; Ou et al., 2016) in combination with a Linkam CAP500 heating–cooling stage was used to simulate and observe the hydrate growing processes, supplied by gas migration in aqueous solution from the dissolution of free gas. The HPOC was constructed from a fused-silica capillary tube with an outer diameter (OD) of 375 μm, an inner diameter (ID) of 50 μm, and a length of around 25 cm. To prepare the sample, we loaded a section of ultrapure water (about 10 mm in length) into the sealed end of the capillary cell, then connected the other end to the pipeline with the feed gases and pressure pump. The capillary cell was inserted into the sample chamber of the heating–cooling stage for temperature control and Raman spectroscopic measurements, where the temperature could be maintained with an accuracy of ± 0.1 K from 273 to 373 K. The pressure in the cell could be adjusted by the pressure generator and measured by a full-scale pressure gauge (Setra 206 digital pressure transducer with a Datum 2000 manometer, accurate to ± 0.14%). The experimental apparatus has been reported in previous studies. (Lu et al., 2008; Guo et al., 2013; Lu et al., 2013).
The water used was ultra-purified in the laboratory with a resistivity of 18.24 MΩ·cm. Three different mixed CH4 and C2H6 gas cylinders, obtained from Wuhan Iron & Steel Group Gas Co. Ltd, were used and the compositions (5.08 mol% C2H6 + 94.92 mol% CH4, 10.18 mol% C2H6 + 89.82 mol% CH4, and 20.12 mol% C2H6 + 79.88 mol% CH4) were analyzed by gas chromatography before the experiment.
To simulate the dissolution–diffusion of gas molecules from the free gas zone, and migration in an aqueous solution for the growth of hydrate, we used the following procedures. First, the capillary cell (with a section of pure water loaded in its closed end) and pipeline were evacuated. Second, mixed methane and ethane gas were loaded into the pressure line and cell, and then pressurized to 30 MPa by a pressure generator; this pressure was maintained for several days to ensure that the mixed gas diffused into the ultrapure water in the capillary cell. Hydrates were nucleated in the solution near the closed end of the optical cell by placing about 5 mm of the cell in the heating–cooling stage and adjusting the temperature to 243 K for a few minutes. The sample areas of the capillary cell were then warmed to the target temperature (above 273.15 K to avoid possible ice) to ensure the formation of a single hydrate crystal at 30 MPa. During the growth of the hydrate, guest molecules (methane and ethane) were supplied through diffusion in the aqueous phase from the vapor–aqueous solution interface, and the hydrate was grown for 2–5 days (i.e., a minimum of 48 h and maximum of 126 h) to achieve a long column of hydrate for Raman spectroscopic observation (Figure 2).
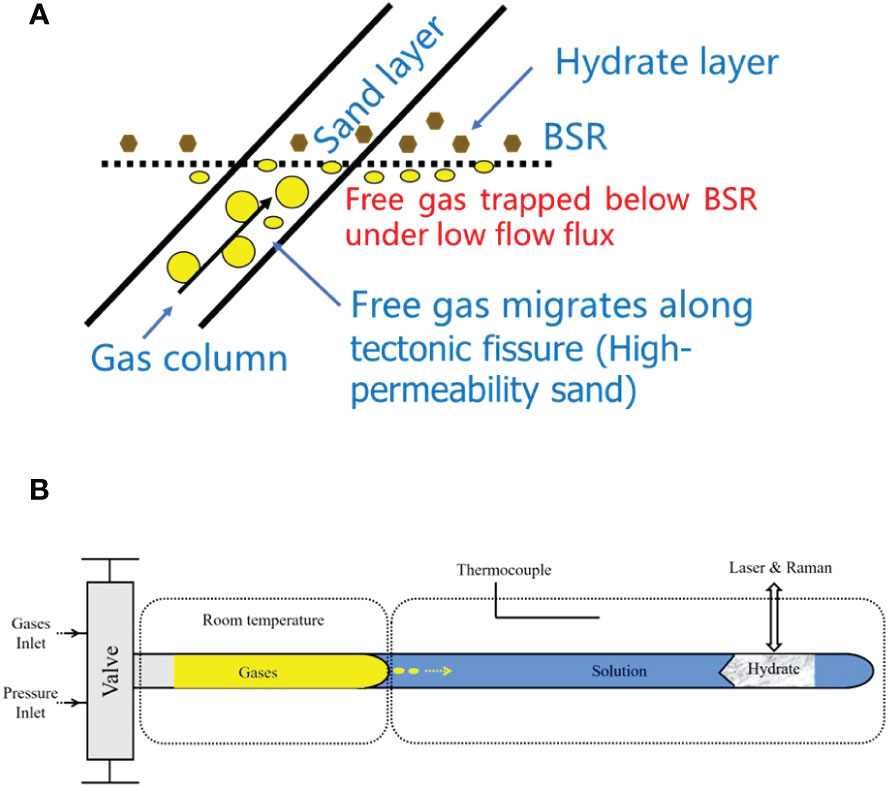
Figure 2 The dissolution–migration–hydration process near the bottom-simulating reflector (BSR). (A) In a submarine environment, the growth of the hydrate was supplied by guest molecules (i.e., methane and ethane) through diffusion in the aqueous phase from the vapor–aqueous solution interface near the base of the gas hydrate stability zone (BGHSZ). (B) Hydrates were grown from aqueous fluids supplied by the gases dissolved from the capillary-trapped free gas in a capillary high-pressure optical cell. Yellow arrows indicate the direction of gas migration. The shadow corner line is the boundary between hydrate and water solution, indicating growth direction.
To investigate the effects of temperature and the feed gas composition on the composition and structure of mixed gas hydrates grown from the solution, experiments were performed at four temperatures, 278.15, 283.15, 288.15, and 293.15 K, at 30 MPa, with two different mixtures of methane and ethane at each temperature and pressure condition.
The composition of hydrates cannot be determined directly by Raman spectroscopy. In order to acquire the composition of hydrates, the hydrates were heated to 298.15 K at 30 MPa (with a heating rate of 50°C/min) and rapidly dissociated into free gas and water columns (Figure 3). The composition of the hydrate-dissociated gas columns was then measured by Raman spectroscopy in a very short space of time. The average composition of the hydrate-dissociated gas was considered to be the same as the composition of the original hydrate, as the standard deviation between the measured values of composition was small.
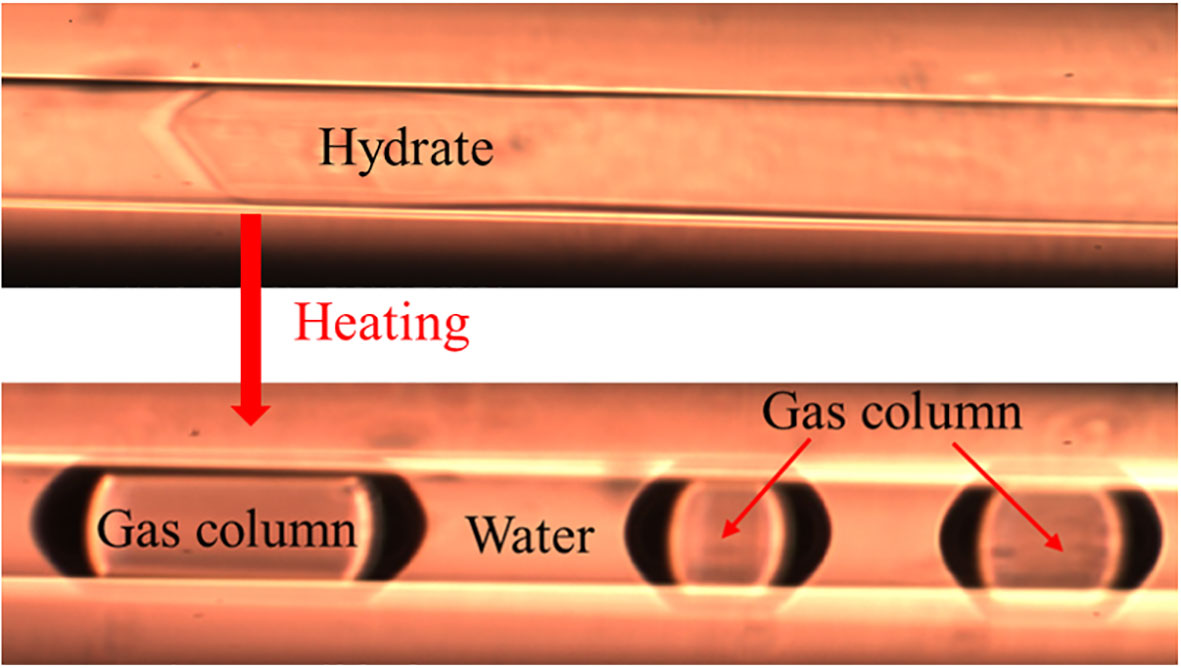
Figure 3 Gas column decomposed from hydrate after heating for quantitative Raman spectroscopic study.
Raman scattering cross-sections are related to the specific Raman-active species and may be affected by molecular interactions. Instrumental efficiency varies with the instrumental settings, so Raman spectroscopic measurements and the Raman quantification factor of pure mixed methane and ethane gas with the same instrumental settings was necessary. Raman intensity is positively correlated with the number of molecules, as described in previous works (Lu et al., 2006; Lu et al., 2008). For Raman-active species a and b in the gas phase, their relative concentrations, Xr (e.g., mole or mol%), are related to their Raman peak area AS and Raman peak height HS. The same method was used to estimate hydrate compositions for the CH4 and CO2 system (Sum et al., 1997). In this study, the relationship between the peak heights ratio (HR) of methane and ethane and mole fraction ratios of the gases at 30 MPa, at temperatures from 278.15 to 298.15 K, was established by the formula:
The specific nomenclatures are shown in Table 1.
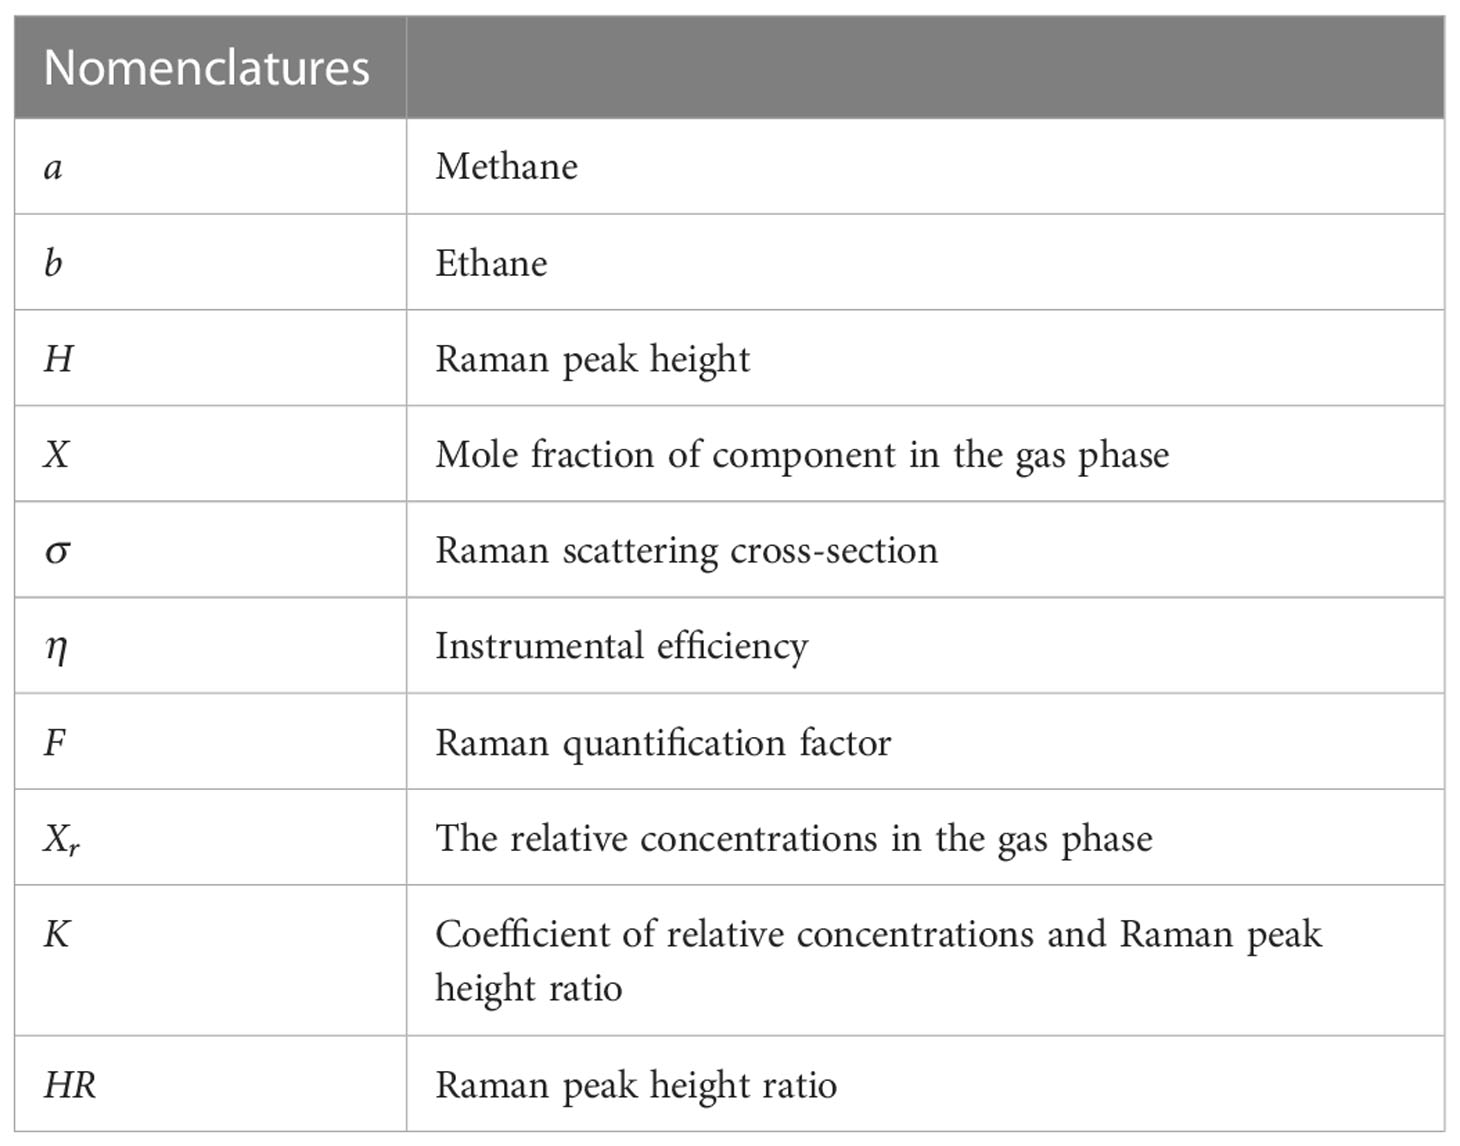
Table 1 Overall nomenclatures in this section.
Raman spectra of hydrate and the dissociation gas were acquired by a JY/Horiba LabRam HR Raman system, using a 532.06 nm [frequency-doubled neodymium-doped yttrium aluminum garnet (Nd : YAG)] laser excitation with an output laser power of approximately 45 mW, at a 20× long-work-distance Olympus objective with a 0.5 numerical aperture, and an 1,800 groove/mm grating with a spectral resolution of about 1 cm–1. Raman shifts were calibrated with the spectrum of the neon emission during the measurement, ranging from 2,720 to 3,080 cm–1, which covers the C–H stretching vibration of methane and Fermi resonance doublet bands of ethane in hydrate s I and s II cages (Klapp et al., 2010a; Klapp et al., 2010b). Peak area and peak heights of CH4 and C2H6 for hydrate were calculated using a Gaussian and Lorentzian function by NGSLabSpec software (Lu et al., 2013; Ou et al., 2015).
Figure 4 shows the relationship between the peak height ratio (HR) of methane and ethane and mole fraction ratios of the gases, and the calibration curve for the CH4 and C2H6 system at 30 MPa and different temperatures that was then constructed. All data used in this figure were obtained at 273.15, 278.15, 283.15, 288.15, 293.15, and 298.15 K. The peak HRs of CH4 and C2H6 were well fitted by a linear function of vapor mole fraction ratios (X(C2H6)/X(CH4)), with a correlation coefficient over 0.9978, which showed good agreement with the results obtained by Subramanian (Subramanian et al., 2000). The calibration curve was further used to determine the composition of feed gas and the hydrate decomposition gases.
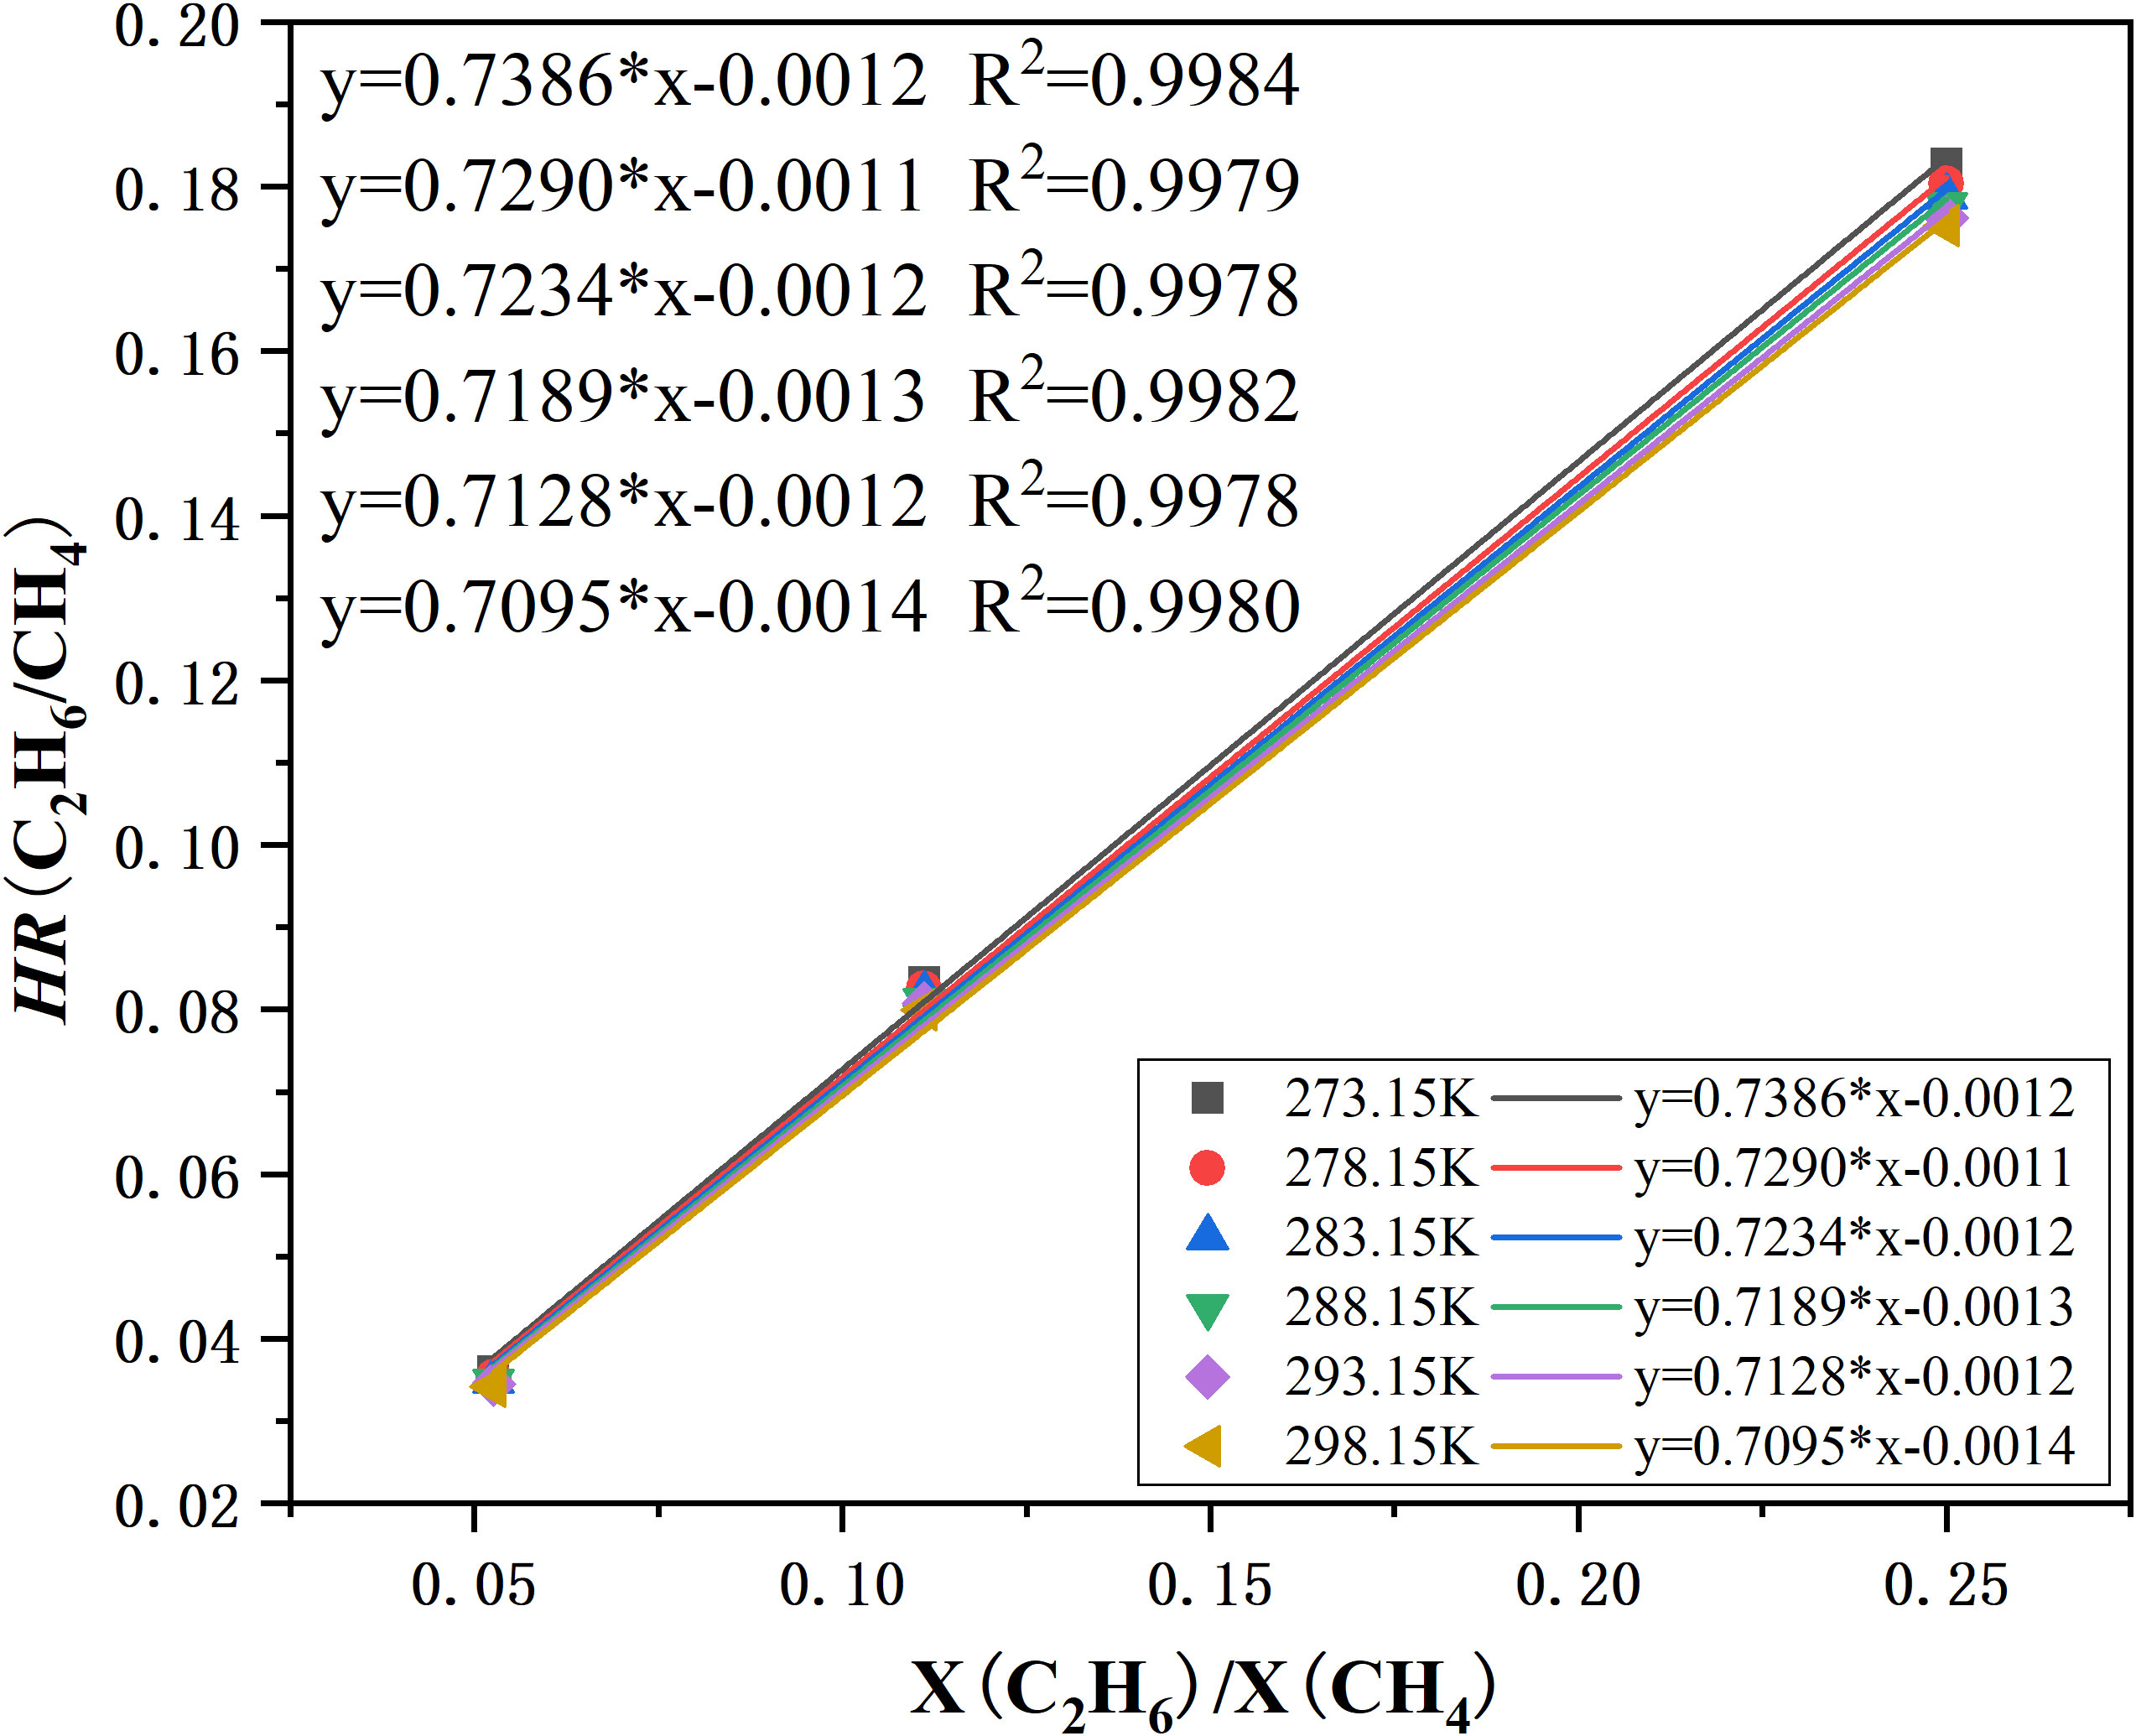
Figure 4 Calibration curve for the CH4 and C2H6 system based on vapor mixtures at 30 MPa. The ordinate is the Raman peak height ratios. The abscissa is the mole fraction ratios of CH4 and C2H6 gas. The linear functions’ corresponding temperatures are indicated.
For each hydrate crystal, at least three locations were selected for Raman spectra measurements. Figure 5 shows the corrected representative Raman spectra of the mixed gas hydrates in the regions between 2,800 cm–1 and 3,000 cm–1 covering the C–H stretching vibrations in hydrates. The Raman spectra are reliable for the identification of hydrate structures (Subramanian et al., 2000), and the measured and assigned Raman band positions of C–H symmetric stretching are listed in Table 2.

Figure 5 Raman spectra of the mixed gas hydrate samples in the regions between 2,800 cm–1 and 3,000 cm–1. Sample number and corresponding experimental temperature are marked. (A) Raman spectra of the C–H region for structure I (sI) hydrate samples (A1, A2, A3, A4, and B2); and (B) Raman spectra of the C–H region for structure II (sII) hydrate samples (B1, B3, and B4).

Table 2 Assigned and measured Raman shifts in different hydrates based on literature data.
Logically, all the Raman characteristic signatures of C–H symmetric stretching for hydrates can be used as the judgment of hydrate structure, but the difference in the Raman shifts characteristics of CH4 in sI and sII hydrates is very small, with only one difference of wavenumber. Therefore, the Raman stretching vibration band frequencies of C2H6 molecules in hydrates can be a useful index for determining the hydrate structures, with four differences of wavenumber (Subramanian et al., 2000). The ratio of the number of large cages (LC) to the number of small cages (SC) in sI and sII hydrates is 3:1 and 1:2, respectively. If all the cages are occupied, the Raman peaks area intensity ratio (PAR) of CH4 in the LC to SC (IMLC/IMSC) should be 3 and 0.5 for sI and sII hydrates, respectively (Wei et al., 2021). Therefore, the above two Raman spectra characteristics can mutually support the hydrate structures (Klapp et al., 2010b).
Between 2,800 cm–1 and 3,000 cm–1, two patterns of Raman spectra can be distinguished. Figure 5A shows the first pattern of Raman spectra, that for hydrate samples A1, A2, A3, A4, and B2. There are two distinct strong peaks for CH4 and a weak peak (ν2) for C2H6 molecules (at about 2,946 cm–1). The Raman spectra signature (ν1), located at 2,891 cm–1, was very feeble and could be fitted only with the use of software. Figure 5B shows the second pattern of Raman spectra, that for hydrate samples B1, B3, and B4. In this case, there are two distinct strong peaks for CH4 molecules and two weak peaks (ν1 and ν2) for C2H6 molecules (at 2,886 cm–1 and 2,942 cm–1, respectively), with lower wavenumbers. Note that the Raman peaks for C2H6 molecules located at 2,891 cm–1 and 2,946 cm–1 are assigned to the C2H6 engaged in the large cavities of the sI hydrate, whereas the Raman peaks for the C2H6 molecules that occur 2,887 cm–1 and 2,942 cm–1 were reported by previous researchers to be an indication of C2H6 engaged in the large cavities of the sII hydrate (Murshed and Kuhs, 2009; Klapp et al., 2010b; Sum et al., 1997). Therefore, we considered hydrate samples A1, A2, A3, A4, and B2, exhibiting the first pattern of Raman spectra, to be sI hydrates, and hydrate samples B1, B3, and B4, exhibiting the second pattern of Raman spectra, to be sII hydrates. The weak signature of C–H shifts of ethane for sI hydrates might be due to the relatively low cage occupancies of ethane in large cages, which could lead to the deviation of the Raman spectra signature (ν1) in the fitting procedure. The shapes of the Raman spectra obtained for sII hydrates in this work are consistent with that of the methane and ethane hydrate formed in Monterey Bay (1,024 m, 278 K) (Hester et al., 2006).
In addition, Raman spectra of the ν1 and ν2 C–H stretch of C2H6 for mixed gas hydrates and Raman PARs of CH4 in the LC to SC (IMLC/IMSC) are demonstrated in Figure 6, which corresponds to the Raman spectra of the first and second patterns in Figures 5A, B. The Raman peak positions of ethane in C–H regions for sII hydrates were lower than those of ethane for sI hydrates (Table 2). The Raman PARs of CH4 in the LC to SC (IMLC/IMSC) for hydrate samples A1–A4 and B2 were 3.41, 3.26, 3.11, 3.02, and 3.13, respectively, and IMLC/IMSC for hydrate samples B1, B3, B4, and C1 was 0.41, 0.24, 0.24, and 0.17, respectively. Hence, we concluded that the hydrate samples A1–A4 and B2 were sI hydrates, and hydrate samples B1, B3, B4, and C1 were sII hydrates. The Raman PAR of CH4 in the LC to SC for sI hydrates (red point in Figure 6) was greater than 3.0, which might be attributed to relatively high occupancies of methane in large cages for sI hydrates. Meanwhile, IMLC/IMSC for sI hydrates decreased from 3.4 to 3.0 with a rise in temperature, which indicated that ethane had a preference to enter the large cages for sI hydrates with increasing temperature. By contrast, IMLC/IMSC for sII hydrates was smaller than 0.5; a reasonable explanation is that the relatively high cage occupancies of ethane for sII hydrates led to a decrease in the occupancies of methane in large cages, and the small cages were almost fully occupied by methane. From the limited data available for sII hydrate samples, no distinct conclusions could be drawn on the effect of temperature on the IMLC/IMSC for sII hydrates, but it could be seen that there was a significant decrease in IMLC/IMSC, from 0.41 to 0.24, when the temperature changed from 278.15 to 288.15 K, which was probably caused by the decrease in cage occupancies for methane in small cages.
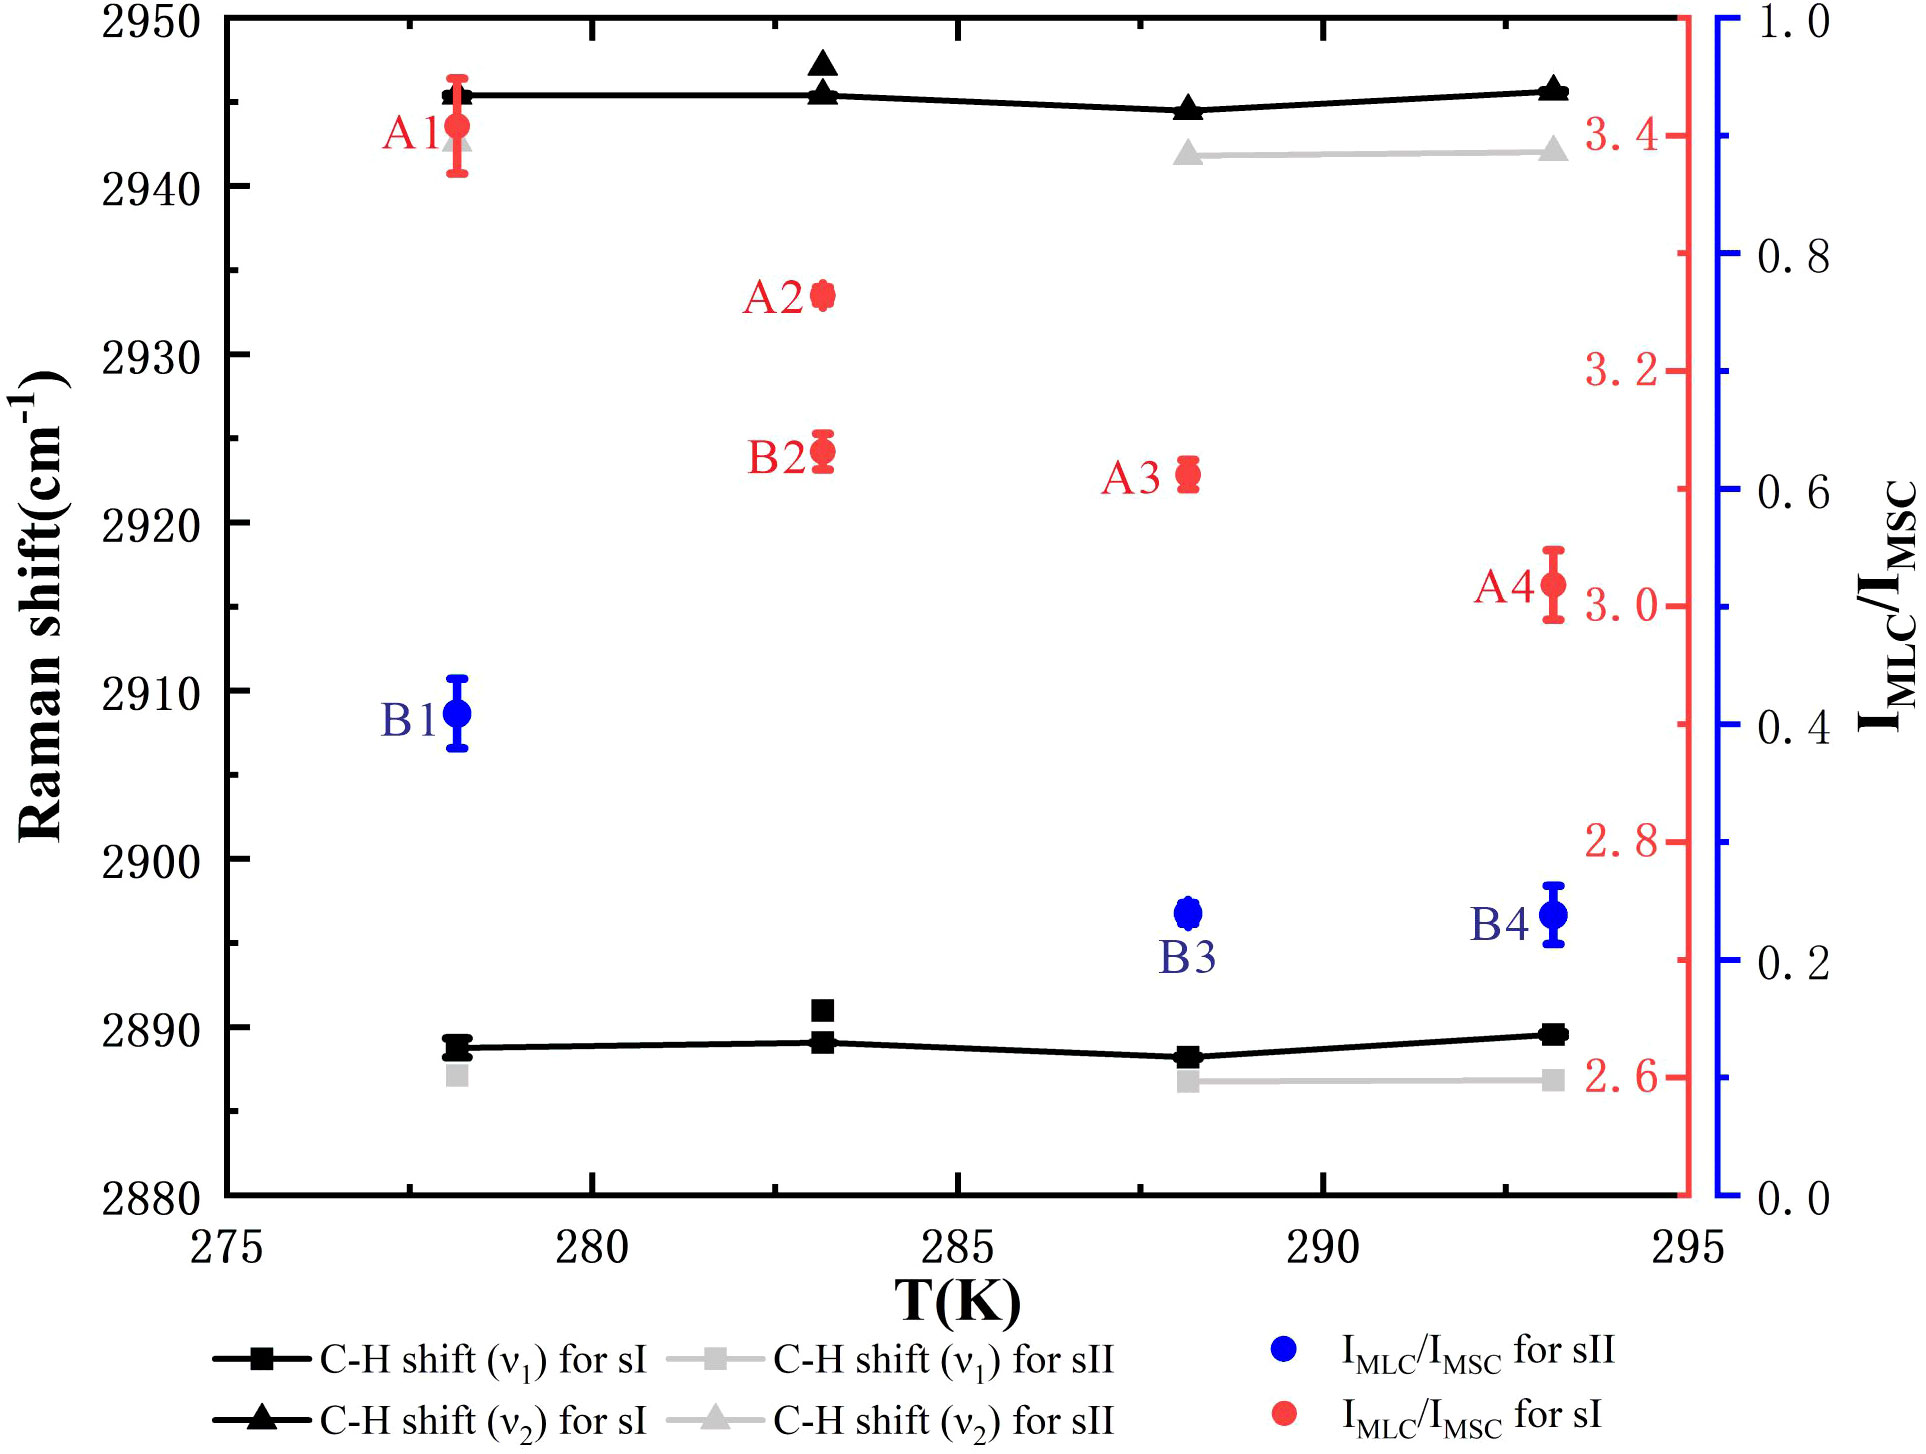
Figure 6 Raman spectra of the ν1 and ν2 C–H stretch of ethane for mixed hydrates and Raman peaks area intensity ratios (PARs) of CH4 in the large cages (LC) to small cages (SC) (IMLC/IMSC). Black points and line segments correspond to structure I (sI) hydrate samples A1, A2, A3, A4, and B2. Gray points and line segments correspond to structure II (sII) hydrate samples B1, B3, and B4, with lower wavenumbers. The red dots marked with the sample number correspond to the red coordinate axis on the right, and the blue dots marked with the sample number correspond to the blue coordinate axis on the right.
We calculated the cage occupancies of hydrates and hydration numbers (Table 3) using Raman spectroscopic analysis (Sum et al., 1997; Subramanian et al., 2000; Kumar et al., 2008). The calculated hydration numbers are in agreement with previously reported values, which range from 5.8 to 6.3 (Ripmeester and Ratcliffe, 1988).

Table 3 | The experimental pressure and temperature, feed gas composition, hydrate structure, hydrate composition, cage occupancies, and hydration number of hydrates in this work.
In theory, CH4 can occupy all the large cavities in all hydrate structures (Sum et al., 1997) whereas C2H6 molecules can be included only in large cages (Uchida et al., 2007). In the sI hydrate samples A1–A4 and B2, θL–M,sI (CH4 cage occupancies for sI LC) was equal to, or was close to, θS–M,sI (CH4 cage occupancies for sI SC) and was higher than θL–M,sII (CH4 cage occupancies for sII LC) in sII hydrate samples B1, B3, and B4, which indicated that CH4 had an advantage over C2H6 in the competition for inclusion in the large cage for sI hydrates. In sII hydrate samples B1, B3, and B4, the small cages were almost fully occupied by CH4, and θS–M,sII (CH4 cage occupancies for sII SC) was higher than θS–M,sI. Meanwhile, the cage occupancies of C2H6 for the sII hydrates samples suggested that θL–E,sII (C2H6 cage occupancies for sII LC) was also higher than that for sI hydrates, which might be the reason for the weak Raman peaks (ν1 and ν2) for C2H6 in sI hydrates. This cage occupancies phenomenon could reasonably be explained by the guest-to-cavity ratio proposed by Lederhos et al. (Lederhos et al., 1993). As temperatures increased, the cage occupancies of C2H6 gradually increased; the cage occupancies of CH4 in large cages were the opposite, which can be attributed to the contribution of ethane to cavity stabilization.
Under the dissolution–migration–hydration processes, the feeding gas source components affect both the composition and structure of the hydrates. The sII hydrates were formed only in the experiment in which the feed gas components contained at least 20.12 mol% C2H6. With this composition of feed gas, sample B2 formed sI hydrate, and other samples, B1, B3, and B4, all formed sII hydrate. At a constant temperature and pressure, we found that the higher the proportion of C2H6 in the feed gas, the higher the concentration of C2H6 in the hydrates (Table 3).
An important discovery was that the C2H6 concentration in hydrate formed at 30 MPa was depleted compared with the feed gas. For example, in samples A1–A4 and B1–B4, the proportion of C2H6 in the hydrates was lower than that in feed gas; methane-to-ethane ratios (C1/C2) in hydrates formed in the dissolution–migration–hydration processes were 1.2 to 2.1 times that of the gas source; this contrasts with the findings of previous studies reporting heavy hydrocarbon enrichment in hydrates crystallized directly from free gases (Kumar et al., 2008; Seo et al., 2009).
Under the dissolution–migration–hydration processes, temperature has a significant effect on hydrate composition. For example, by comparing sI hydrate samples A1 (hydrated at 278 K) and A4 (hydrated at 293 K), and sII hydrates B1 (hydrated at 278 K), B3 (hydrated at 288 K), and B4 (hydrated at 293 K), we found that the proportion of C2H6 in sI hydrate and sII hydrates increased with temperature by 49.6% and 24.6%, respectively (Table 3). The trend of the proportion of C2H6 in hydrate increasing with temperature is consistent with the core data, where temperature increases with the depth under geothermal gradients. For example, core data from samples from the South China Sea show that the C1/C2 ratio in hydrates gradually tends toward a low value with depth (Paganoni et al., 2016), and core data in many ocean drilling programs (ODP)/International Ocean Discovery Program (IODP) sites (Milkov et al., 2004).
As the core geochemical data indicated (Milkov et al., 2004; Paganoni et al., 2016), an abrupt decrease in C1/C2+ ratios in headspace gas in sediments occurred around the BSR, and C1/C2+ ratios in the hydrates, sampled at the South China Sea (Zhang et al., 2019; Wei et al., 2021), tended to be lower at greater depth. Previous researchers have suggested two possible mechanisms to explain this phenomenon. One possible mechanism is the biodegradation of heavy hydrocarbons by microorganisms as sediment depth decreases (Pape et al., 2010), and the other is the addition of content of heavy hydrocarbons in the deep strata (Sassen et al., 2001). Neither mechanism can explain why there was an abrupt decrease in C1/C2+ ratios in headspace gas in sediments occurring around the BSR. There should be a specific process only near the depth around the BSR, and the process should be related to the BGHSZ, the boundary of the hydrate-occurring zone, and the free gas zone. According to our experimental observation, the molar fraction of C2H6 in hydrate is depleted compared with gas sources. Gases partitioning occurred throughout the reaction transport process. We propose that the dissolution–migration–hydration of gases is the mechanism that enriches ethane near the BSR.
Paull (Paull et al., 1993) proposed a mechanism by which gas could be concentrated by recycling at the BGHSZ. Progressive burial and subsidence through geologic time shifts the BGHSZ upward, such that deep-seated hydrate decomposes and the free gas zone also shifts upward. Some free gas could rise buoyantly upward (permeating fissures in the overlying hydrate stability layer) and be incorporated into the hydrate layer (Cheng et al., 2020; Bello-Palacios et al., 2022). However, as proposed by Brown (Brown et al., 1996), significant residual free gas remains below the gas hydrate stability zone (GHSZ), trapped there by capillary forces. The bubbles in the lower portion of the free gas zone must continually dissolve, and methane and ethane must be transported in pore fluids. Our experimental observations show that gas fractionation occurred between the hydrate and the gas source under “dissolution–migration–hydration” processes. This may cause a larger C1/C2+ ratio in gas hydrates relative to the residual free gas below the BGHSZ, which causes the abrupt decrease in C1/C2+ ratios in headspace gas in sediments occurring around the BSR.
To test the “dissolution–migration mechanism” and its links to the enrichment of ethane near the BSR and increasing upward C1/C2 ratios in the hydrate-occurring zone, our experimental observation simulated these processes in a limited time and space. However, dissolved gas migration and gas hydrate formation in marine sediment usually take place over days, or even hundreds to thousands of years. To study the gas fractionation mechanism during the dissolution–migration–hydration processes, and extend our knowledge to a geologic time and space scale, we first compared the dissolution and diffusion properties of methane and ethane at the typical temperatures and pressures in the GHSZ (Table 4). We then simulated the fractionation during the dissolution–diffusion processes (Figure 7) and at last discussed the fractionation during the hydration.
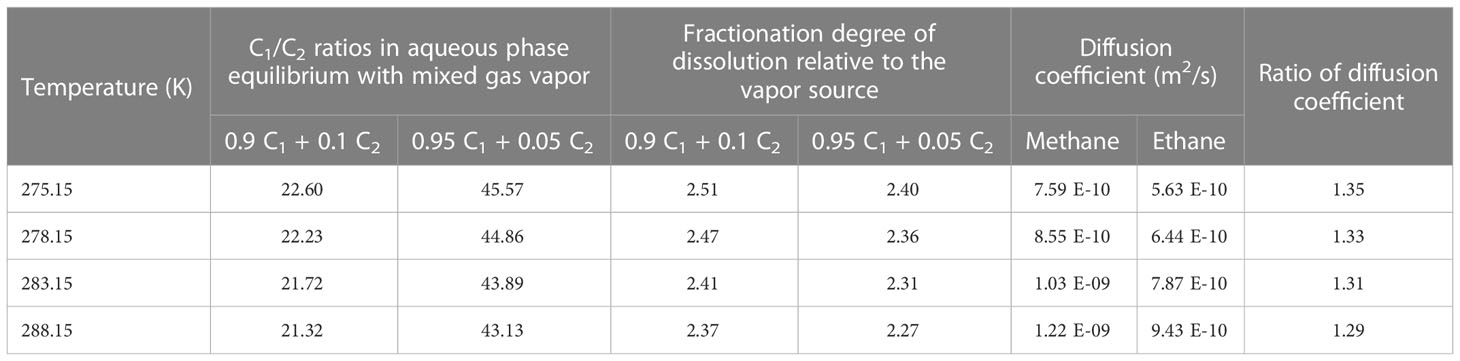
Table 4 Dissolution behavior of gas mixture and diffusion properties of methane and ethane under the typical temperatures in GHSZ.
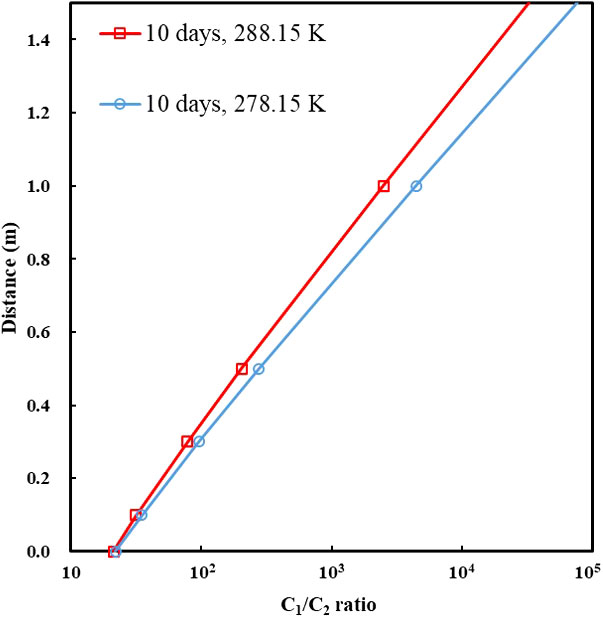
Figure 7 The C1/C2 ratio along the depth of around 1 m above the bottom-simulating reflector (BSR) under the dissolution–diffusion process of a methane–ethane mixture (90% CH4 + 10% C2H6) at 278.15 and 288.15 K. Diffusion coefficients of gases are listed in Table 4. The entire duration of the numerical simulation was 10 days.
Dissolution can cause gas fractionation in underwater conditions. Ethane is less soluble than methane at the same temperature and pressure; for example, at 283.15 K and 30 MPa, the solubility of methane and ethane (the mole fraction of gases in the water) is 0.00417 and 0.00132, respectively (Li et al., 2015), which indicates that in the same conditions methane is around 3.2 times more soluble than ethane. For binary-component gas mixtures, the phase equilibrium data and models are very limited. We calculated the C1/C2 ratio of methane and ethane in an aqueous solution after dissolution at 30 MPa and at different temperatures with a thermodynamic model (Li et al., 2015): the results show that the C1/C2 ratios increased by around 2.3 to 2.5 times in the aqueous solution (Table 4). From these calculations and comparisons, we can see that, under submerged conditions, dissolution causes gas fractionation and increases the C1/C2 ratio in aqueous solution approximately 2.3 to 3.2 times relative to the vapor gas source.
Diffusion is a dominated process that causes gas fractionation in the geological system. The dissolution–diffusion of gas in the aqueous phase can be treated as a one-dimensional diffusion process because the gas migrates up from the bottom along the long fluid migration pathway. For ideal solutions, the variation of concentration with time is subject to Fick’s second law. The bottom gas concentration, near the BSR, in the aqueous phase is constant (theoretically equal to the solubility of the gas in the water at the specific temperature and pressure). Under infinite boundary conditions along the diffusion path, the dissolution–migration of gas can be calculated by the diffusion model (Lu et al., 2006; Guo et al., 2013). We simulated the dissolution–migration process of a methane–ethane mixture (C1 = 90%, C2 = 10%), and calculated the C1/C2 ratio at a depth of around 1 m above the BSR under dissolution–diffusion processes at 30 MPa, and 278.15 and 288.15 K. The entire duration of the numerical simulation was 10 days. Figure 7 shows that the dissolution–diffusion process can produce significant ethane depletion compared with the gas source; this results in the ratio of C1/C2 increasing by several orders of magnitude with distance upward. Decreasing temperature increases the difference in diffusion coefficient between methane and ethane (Table 4), and increases gas fractionation during the dissolution–migration processes (Figure 7); the numerical simulation results are generally consistent with our experimental observations. Advection of methane-bearing fluids is an important means of gas migration in hydrate-occurring zones. When the pore is under low fluid flux, diffusion is the dominant mechanism that causes gas fractionation, and can be further enhanced by advection. Multi-component, multi-phase transport–reaction processes related to the hydrate formation are a complex issue; we will investigate the effect of such processes (as well as advection) on hydrate formation and gas fractionation in the near future.
Hydration is also a process that causes gas fractionation. Hydrates grown from aqueous solutions usually enrich ethane relative to methane, as well as in submarine conditions. Data from ODP site 1245 show that the C1/C2 ratios in the pore solution are around 3.3 to 4.4 times higher than the C1/C2 ratios in hydrates for the samples at the depths of 50 to 100 mbsf (Milkov et al., 2004). It is clear that gas fractionation between the aqueous and hydrate phases is affected by the temperature–pressure–salinity conditions and dissolved gas composition. For example, the thermodynamic model developed by Velaga (Velaga et al., 2016) for predicting the aqueous solubility of hydrocarbon mixtures at the two-phase hydrate–liquid water equilibrium shows that the presence of propane in the mixture affects the aqueous solubility of hydrocarbon mixtures at the two-phase hydrate–liquid water equilibrium. More experiments are needed to verify such models.
Our study shows that gas fractionation occurring between the hydrate and the gas source under “dissolution–migration–hydration” processes may cause larger C1/C2+ ratios in gas hydrates relative to the residual free gas below the BGHSZ. Such processes cause the abrupt decrease in C1/C2+ ratios in headspace gas in sediments that occur around the BSR (Figure 8).
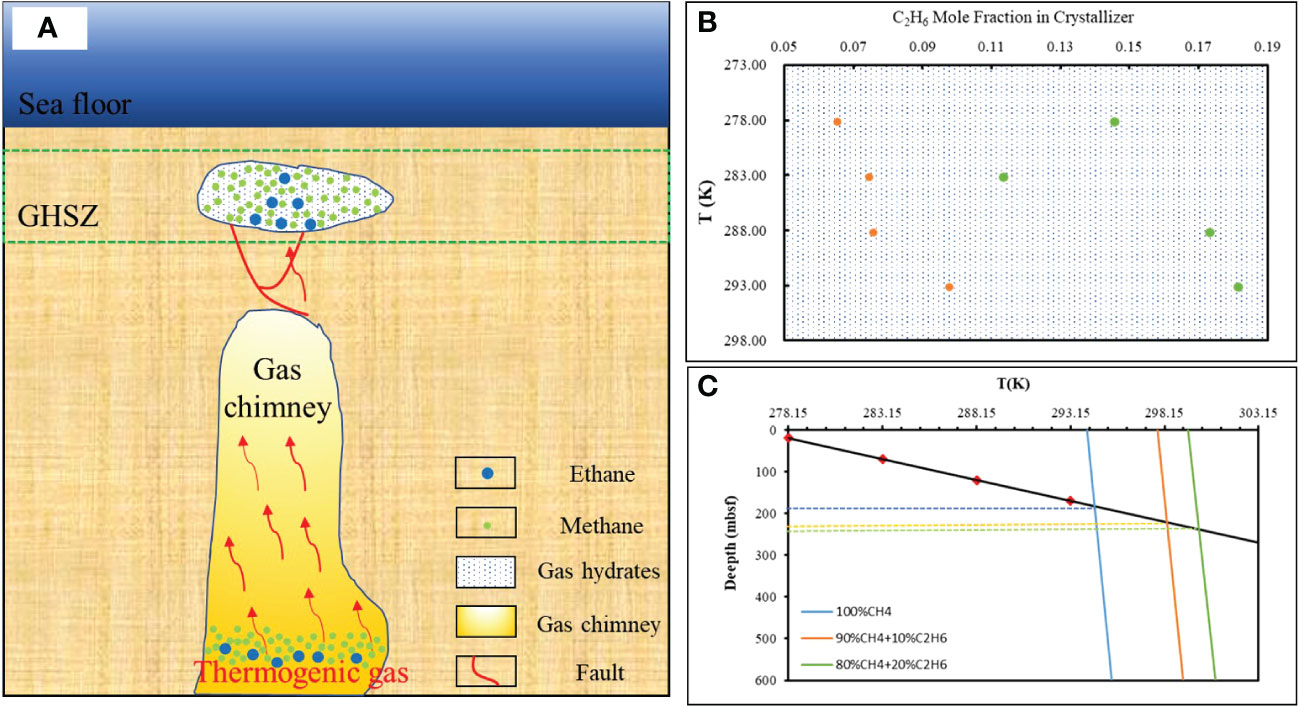
Figure 8 A proposed simplified model of the thermogenic dissolved gas hydrate accumulation mechanism. (A) Red arrow represents thermogenic gases, red lines indicate faults tectonic, and white represents hydrates. (B) The proportion of ethane in hydrates varies with temperature. Orange represents the gas source composition of 90% CH4 + 10% C2H6, green represents the gas source composition of 80% CH4 + 20% C2H6. (C) The base of the gas hydrate stability zones was calculated by pure methane, and methane and ethane gases used in this study. The geothermal gradient is calculated by 100°C/km, an average value measured using the Guangzhou Marine Geological Survey (GMGS5) Site W9 (GMGS5-W9) hydrate system with gas chimneys (Liang et al., 2019).
Hydrate accumulations originating from thermogenic gases containing heavier hydrocarbons have been found in many regions around the world (Hillman et al., 2017; Plaza-Faverola et al., 2017; Thiagarajan et al., 2020). Under the effect of the formation pressure, the thermogenic gas sources with higher-order hydrocarbons gradually migrate upward into the hydrate stability zones through the preferential transport pathway, which includes gas chimneys, unconformity surfaces, faults, fractures, and sandstone channels, and then form a hydrate layer at the suitable pore sizes (Panieri et al., 2017; Portnov et al., 2021; Liang et al., 2022).
However, not all free gas can be transported into the hydrate stability zone. When the gas pressure cannot overcome the capillary pressure, the gas phase will be trapped in sediments in the free gas zone, and must continually dissolve and be transported upward in solution to be incorporated into the hydrate layer. Our experiments of gas hydrate formation in capillary tubes are highly analogous to the process of natural gas hydration in the pore space in submarine sediments. Gas dissolves and migrates along the capillary pore space through short or long distances, and then forms hydrates. Such “dissolution–migration–hydration” processes result in the percentage of ethane in the hydrate increasing with temperature and depth (Figure 8), especially in sites where thermogenic gas is rapidly transported along a gas chimney and the local geothermal gradient is increased by the warm fluids.
Previously, the amount of carbon contained in hydrates formed from heavy hydrocarbons, such as ethane, was ignored, resulting in a significant underestimation of the number of carbon resources. Essentially, the estimated amounts of carbon in gas hydrates are constrained by the volume of pore space available for hydrate formation and the gas composition in the hydrate phase (Dickens, 2011; Wallmann et al., 2012), and 1 m3 of ethane hydrate contains twice the amount of carbon in a similar volume of methane hydrate (Plaza-Faverola et al., 2017).
Dissolution–migration of gas near the BSR enriches ethane near the GHSZ; such changes in gas composition could affect the depth of the GHSZ. Our calculation indicates that an increase of 10% in the mole fraction of ethane could deepen the GHSZ thickness by at least 37 m (compared with pure methane hydrate; Figure 8). The higher the proportion of heavier hydrocarbons, the deeper the bottom boundary of the gas hydrate stability zone (Figure 8). Our experiments indicated that the proportion of heavy hydrocarbon in the bottom hydrate (9.77% at 293 K; Table 3) is 49.6% higher than the proportion of heavy hydrocarbon in the top hydrate layer (6.53% at 278 K; Table 3). Assuming 6.53% ethane in the hydrate, this could lead to the amount of carbon per 1 m3 being underestimated by at least 2.42-fold (considering the 37 m deep thickness of the GHSZ, and comparing with hydrate accumulated from pure methane).
We tested the “dissolution–migration mechanism” and its links to the enrichment of ethane near the BSR and increasing upward C1/C2 ratios in the hydrate-occurring zone, performed experimental simulations on the gas dissolution–migration–hydration processes, and investigated the effects the composition of feeding gases and temperatures on the composition of hydrates the grown. The main conclusions can be summarized as follows:
Owing to the dissolution–migration–hydration processes, the composition of hydrates differs greatly from the initial supplying gas. Regardless of whether they are type I or II hydrates, the content of methane in hydrates was enriched compared with the gas source, and the proportion of ethane in hydrates was deficient compared with the free gas source. We proposed that the dissolution–migration–hydration of gases is the mechanism that enriches ethane near the BSR, causing the abrupt decrease in C1/C2+ ratios in sediments occurring around the BSR.
Temperature has a significant effect on the composition of hydrates. With the same supply of gas (i.e., the gas source composition remains constant), the proportion of ethane in the hydrates decreased gradually with decreasing temperature, which may cause the spatial variation of hydrate composition within the hydrate stability zone. The ratio of C1/C2 in hydrates also increased with decreasing temperature from the base of the gas hydrate stability zone to the seafloor.
Inputs of ethane or heavier hydrocarbons into the gas sources, and the dissolution–migration–hydration mechanism that enriches ethane near the BSR, can increase the depth of the GHSZ. The amount of carbon resources contained in hydrates formed from heavy hydrocarbons, such as ethane, has been significantly underestimated.
The original contributions presented in the study are included in the article/supplementary material. Further inquiries can be directed to the corresponding authors.
Original draft preparation, HL. Experimental work, HL, XL, TL, and WW. Revision, LW, and WL. Conception and supervision, WL and YC. All authors contributed to the article and approved the submitted version.
This work was partly supported by the National Natural Science Foundation of China (41876069 and 92058208), and the National Key Research and Development Program of China (2018YFC0310006–04).
We are grateful to two reviewers, for their critical reviews and thoughtful comments on the manuscript.
The authors declare that the research was conducted in the absence of any commercial or financial relationships that could be construed as a potential conflict of interest.
All claims expressed in this article are solely those of the authors and do not necessarily represent those of their affiliated organizations, or those of the publisher, the editors and the reviewers. Any product that may be evaluated in this article, or claim that may be made by its manufacturer, is not guaranteed or endorsed by the publisher.
Bello-Palacios A., Fotland P., Ersland G. (2022). Modeling the effects of sedimentation on natural occurrences of CH4 hydrates in marine sediments. Energy Fuels 36, 3778–3787. doi: 10.1021/acs.energyfuels.1c03611
Brown K. M., Bangs N. L., Froelich P. N., Kvenvolden K. A. (1996). The nature, distribution, and origin of gas hydrate in the Chile triple junction region. Earth Planet. Sci. Lett. 139, 471–483. doi: 10.1016/0012-821X(95)00243-6
Caumon M.-C., Robert P., Laverret E., Tarantola A., Randi A., Pironon J., et al. (2014). Determination of methane content in NaCl–H2O fluid inclusions by raman spectroscopy. calibration and application to the external part of the central Alps (Switzerland). Chem. Geol. 378-379, 52–61. doi: 10.1016/j.chemgeo.2014.03.016
Cheng C., Jiang T., Kuang Z. G., Yang C. Z., Zhang C., He Y. L., et al. (2020). Characteristics of gas chimneys and their implications on gas hydrate accumulation in the shenhu area, northern south China sea. J. Natural Gas Sci. Eng. 84, 103629. doi: 10.1016/j.jngse.2020.103629
Dickens G. R. (2011). Down the rabbit hole: toward appropriate discussion of methane release from gas hydrate systems during the Paleocene-Eocene thermal maximum and other past hyperthermal events. Climate Past 7, 831–846. doi: 10.5194/cp-7-831-2011
Guo H. R., Chen Y., Lu W. J., Li L. L., Wang M. H. (2013). In situ raman spectroscopic study of diffusion coefficients of methane in liquid water under high pressure and wide temperatures. Fluid Phase Equilibria 360, 274–278. doi: 10.1016/j.fluid.2013.09.051
Hester K. C., Dunk R. M., White S. N., Brewer P. G., Peltzer E. T., Sloan E. D. (2007). Gas hydrate measurements at hydrate ridge using raman spectroscopy. Geochimica Cosmochimica Acta 71, 2947–2959. doi: 10.1016/j.gca.2007.03.032
Hester K. C., White S. N., Peltzer E. T., Brewer P. G., Sloan E. D. (2006). Raman spectroscopic measurements of synthetic gas hydrates in the ocean. Mar. Chem. 98, 304–314. doi: 10.1016/j.marchem.2005.09.006
Hillman J. I. T., Cook A. E., Daigle H., Nole M., Malinverno A., Meazell K., et al. (2017). Gas hydrate reservoirs and gas migration mechanisms in the terrebonne basin, gulf of Mexico. Mar. Petroleum Geol. 86, 1357–1373. doi: 10.1016/j.marpetgeo.2017.07.029
Khlystov O., De Batist M., Shoji H., Hachikubo A., Nishio S., Naudts L., et al. (2013). Gas hydrate of lake baikal: Discovery and varieties. J. Asian Earth Sci. 62, 162–166. doi: 10.1016/j.jseaes.2012.03.009
Kida M., Suzuki K., Kawamura T., Oyama H., Nagao J., Ebinuma T., et al. (2009). Characteristics of natural gas hydrates occurring in pore-spaces of marine sediments collected from the Eastern nankai trough, off Japan. Energy Fuels 23, 5580–5586. doi: 10.1021/ef900612f
Klapp S. A., Bohrmann G., Kuhs W. F., Murshed M. M., Pape T., Klein H., et al. (2010a). Microstructures of structure I and II gas hydrates from the gulf of Mexico. Mar. Petroleum Geol. 27, 116–125. doi: 10.1016/j.marpetgeo.2009.03.004
Klapp S. A., Murshed M. M., Pape T., Klein H., Bohrmann G., Brewer P. G., et al. (2010b). Mixed gas hydrate structures at the chapopote knoll, southern gulf of Mexico. Earth Planet. Sci. Lett. 299, 207–217. doi: 10.1016/j.epsl.2010.09.001
Kumar R., Linga P., Moudrakovski I., Ripmeester J. A., Englezos P. (2008). Structure and kinetics of gas hydrates from methane/ethane/propane mixtures relevant to the design of natural gas hydrate storage and transport facilities. AIChE J. 54, 2132–2144. doi: 10.1002/aic.11527
Lederhos J. P., Christiansen R. L., Sloan E. D. (1993). A first order method of hydrate equilibrium estimation and its use with new structures. Fluid Phase Equilibria 83, 445–454. doi: 10.1016/0378-3812(93)87049-7
Liang J., Meng M., Liang J., Ren J., He Y., Li T., et al. (2022). Drilling cores and geophysical characteristics of gas hydrate-bearing sediments in the production test region in the shenhu sea, south China sea. Front. Earth Sci. 10, 911123. doi: 10.3389/feart.2022.911123
Liang J., Zhang W., Lu J.a., Wei J., Kuang Z., He Y. (2019). Geological occurrence and accumulation mechanism of natural gas hydrates in the eastern qiongdongnan basin of the south China Sea: Insights from site GMGS5-W9-2018. Mar. Geol. 418, 106042. doi: 10.1016/j.margeo.2019.106042
Liu S., Jiang Z., Liu H., Pang S., Xia Z., Jin Z., et al. (2016). The natural-gas hydrate exploration prospects of the nayixiong formation in the kaixinling-wuli permafrost, qinghai-Tibet plateau. Mar. Petroleum Geol. 72, 179–192. doi: 10.1016/j.marpetgeo.2016.01.022
Liu C. L., Meng Q. G., He X. L., Li C. F., Ye Y. G., Zhang G. X., et al. (2015). Characterization of natural gas hydrate recovered from pearl river mouth basin in south China Sea. Mar. Petroleum Geol. 61, 14–21. doi: 10.1016/j.marpetgeo.2014.11.006
Li J., Zhang Z., Luo X., Li X. (2015). Modelling of phase equilibria in CH4–C2H6–C3H8–nC4H10–NaCl–H2O systems. Appl. Geochem. 56, 23–36. doi: 10.1016/j.apgeochem.2015.02.006
Lu W. J., Chou I. M., Burruss R. C. (2008). Determination of methane concentrations in water in equilibrium with sI methane hydrate in the absence of a vapor phase by in situ raman spectroscopy. Geochimica Cosmochimica Acta 72, 412–422. doi: 10.1016/j.gca.2007.11.006
Lu W. J., Chou I. M., Burruss R. C., Song Y. C. (2007). A unified equation for calculating methane vapor pressures in the CH4-H2O system with measured raman shifts. Geochimica Cosmochimica Acta 71, 3969–3978. doi: 10.1016/j.gca.2007.06.004
Lu W. J., Chou I. M., Burruss R. C., Yang M. Z. (2006). In situ study of mass transfer in aqueous solutions under high pressures via raman spectroscopy: A new method for the determination of diffusion coefficients of methane in water near hydrate formation conditions. Appl. Spectrosc. 60, 122–129. doi: 10.1366/000370206776023278
Lu W. J., Guo H. R., Chou I. M., Burruss R. C., Li L. L. (2013). Determination of diffusion coefficients of carbon dioxide in water between 268 and 473 K in a high-pressure capillary optical cell with in situ raman spectroscopic measurements. Geochimica Cosmochimica Acta 115, 183–204. doi: 10.1016/j.gca.2013.04.010
Lu Z. Q., Zhu Y. H., Zhang Y. Q., Wen H. J., Li Y. H., Liu C. L. (2011). Gas hydrate occurrences in the qilian mountain permafrost, qinghai province, China. Cold Regions Sci. Technol. 66, 93–104. doi: 10.1016/j.coldregions.2011.01.008
Milkov A. V., Claypool G. E., Lee Y.-J., Torres M. E., Borowski W. S., Tomaru H., et al. (2004). Ethane enrichment and propane depletion in subsurface gases indicate gas hydrate occurrence in marine sediments at southern hydrate ridge offshore Oregon. Organic Geochem. 35, 1067–1080. doi: 10.1016/j.orggeochem.2004.04.003
Murshed M. M., Kuhs W. F. (2009). Kinetic studies of methane-ethane mixed gas hydrates by neutron diffraction and raman spectroscopy. J. Phys. Chem. B 113, 5172–5180. doi: 10.1021/jp810248s
Ou W. J., Geng L. T., Lu W. J., Guo H. R., Qu K., Mao P. X. (2015). Quantitative raman spectroscopic investigation of geo-fluids high-pressure phase equilibria: Part II. accurate determination of CH4 solubility in water from 273 to 603 K and from 5 to 140 MPa and refining the parameters of the thermodynamic model. Fluid Phase Equilibria 391, 18–30. doi: 10.1016/j.fluid.2015.01.025
Ou W., Lu W., Qu K., Geng L., Chou I. M. (2016). In situ raman spectroscopic investigation of flux-controlled crystal growth under high pressure: A case study of carbon dioxide hydrate growth in aqueous solution. Int. J. Heat Mass Transf. 101, 834–843. doi: 10.1016/j.ijheatmasstransfer.2016.05.082
Paganoni M., Cartwright J. A., Foschi M., Shipp R. C., Van Rensbergen P. (2016). Structure II gas hydrates found below the bottom-simulating reflector. Geophys. Res. Lett. 43, 5696–5706. doi: 10.1002/2016GL069452
Panieri G., Bünz S., Fornari D. J., Escartin J., Serov P., Jansson P., et al. (2017). An integrated view of the methane system in the pockmarks at vestnesa ridge, 79°N. Mar. Geol. 390, 282–300. doi: 10.1016/j.margeo.2017.06.006
Pape T., Bahr A., Rethemeyer J., Kessler J. D., Sahling H., Hinrichs K. U., et al. (2010). Molecular and isotopic partitioning of low-molecular-weight hydrocarbons during migration and gas hydrate precipitation in deposits of a high-flux seepage site. Chem. Geol. 269, 350–363. doi: 10.1016/j.chemgeo.2009.10.009
Paull C. K., Ussler W., III and Borowski W. S. (1993). Sources of biogenic methane to form marine gas hydrates: In situ production or upward migration? Ann. New York Acad. Sci. 175, 392–409. doi: 10.2172/10185837
Plaza-Faverola A., Vadakkepuliyambatta S., Hong W. L., Mienert J., Bunz S., Chand S., et al. (2017). Bottom-simulating reflector dynamics at Arctic thermogenic gas provinces: An example from vestnesa ridge, offshore west Svalbard. J. Geophys. Res. Solid Earth 122, 4089–4105. doi: 10.1002/2016JB013761
Portnov A., Cook A. E., Vadakkepuliyambatta S. (2021). Diverse gas composition controls the moby-dick gas hydrate system in the gulf of Mexico. Geology 49, 1446–1451. doi: 10.1130/G49310.1
Ripmeester J. A., Ratcliffe C. I. (1988). Low-temperature cross-polarization/magic angle spinning carbon-13 NMR of solid methane hydrates: structure, cage occupancy, and hydration number. J. Phys. Chem. - 92, 337–339. doi: 10.1021/j100313a018
Sassen R., Losh S. L., Cathles L., Roberts H. H., Whelan J. K., Milkov A. V., et al. (2001). Massive vein-filling gas hydrate: relation to ongoing gas migration from the deep subsurface in the gulf of Mexico. Mar. Petroleum Geol. 18, 551–560. doi: 10.1016/S0264-8172(01)00014-9
Seo Y., Kang S.-P., Jang W. (2009). Structure and composition analysis of natural gas hydrates: 13C NMR spectroscopic and gas uptake measurements of mixed gas hydrates. J. Phys. Chem. A 113, 9641–9649. doi: 10.1021/jp904994s
Sloan E. D. (2003). Fundamental principles and applications of natural gas hydrates. Nature 426, 353–359. doi: 10.1038/nature02135
Sloan E. D. (2008). Clathrate hydrates of natural gases. Fuel 87, 3158–3158. doi: 10.1016/j.fuel.2008.03.028
Subramanian S., Kini R. A., Dec S. F., Sloan E. D. (2000). Evidence of structure II hydrate formation from methane+ethane mixtures. Chem. Eng. Sci. 55, 1981–1999. doi: 10.1016/S0009-2509(99)00389-9
Sum A. K., Burruss R. C., Sloan E. D. (1997). Measurement of clathrate hydrates via raman spectroscopy. J. Phys. Chem. B 101, 7371–7377. doi: 10.1021/jp970768e
Thiagarajan N., Kitchen N., Xie H., Ponton C., Lawson M., Formolo M., et al. (2020). Identifying thermogenic and microbial methane in deep water gulf of Mexico reservoirs. Geochimica Cosmochimica Acta 275, 188–208. doi: 10.1016/j.gca.2020.02.016
Uchida T., Takeya S., Kamata Y., Ikeda I. Y., Nagao J., Ebinuma T., et al. (2002). Spectroscopic observations and thermodynamic calculations on clathrate hydrates of mixed gas containing methane and ethane: determination of structure, composition and cage occupancy. J. Phys. Chem. B 106, 12426–12431. doi: 10.1021/jp025884i
Uchida T., Takeya S., Kamata Y., Ohmura R., Narita H. (2007). Spectroscopic measurements on binary, ternary, and quaternary mixed-gas molecules in clathrate structures. Ind. Eng. Chem. Res. 46, 5080–5087. doi: 10.1021/ie070153w
Velaga S. C., Levine J. S., Warzinski R. P., Anderson B. J. (2016). A thermodynamic model to predict the aqueous solubility of hydrocarbon mixtures at two-phase hydrate-liquid water equilibrium. Fluid Phase Equilibria 414, 75–87. doi: 10.1016/j.fluid.2015.12.049
Wallmann K., Pinero E., Burwicz E., Haeckel M., Hensen C., Dale A., et al. (2012). The global inventory of methane hydrate in marine sediments: A theoretical approach. Energies 5, 2449–2498. doi: 10.3390/en5072449
Wei J., Wu T., Zhu L., Fang Y., Liang J., Lu H., et al. (2021). Mixed gas sources induced co-existence of sI and sII gas hydrates in the qiongdongnan basin, south China Sea. Mar. Petroleum Geol. 128, 105024. doi: 10.1016/j.marpetgeo.2021.105024
Whiticar M. J., Hovland M., Kastner M., Sample J. C. (1995). Organic geochemistry of gases, fluids, and hydrates at the cascadia margin accretionary margin. Proc. Ocean Drilling Program Sci. Results, 146 385–397. doi: 10.2973/odp.proc.sr.146-1.247.1995
Keywords: gas hydrate composition, gas source, methane and ethane, gas fractionation, Raman spectroscopy
Citation: Li H, Lu X, Wang L, Wang W, Li T, Lu W and Chen Y (2023) Dissolution migration of gas, a mechanism to enrich ethane near the BSR and increase upwardly C1/C2 ratios in the hydrate-occurring zones: Insight from pore-scale experimental observation. Front. Mar. Sci. 10:1091549. doi: 10.3389/fmars.2023.1091549
Received: 07 November 2022; Accepted: 02 January 2023;
Published: 03 February 2023.
Edited by:
Dong Feng, Shanghai Ocean University, ChinaReviewed by:
Junxi Feng, Guangzhou Marine Geological Survey, ChinaCopyright © 2023 Li, Lu, Wang, Wang, Li, Lu and Chen. This is an open-access article distributed under the terms of the Creative Commons Attribution License (CC BY). The use, distribution or reproduction in other forums is permitted, provided the original author(s) and the copyright owner(s) are credited and that the original publication in this journal is cited, in accordance with accepted academic practice. No use, distribution or reproduction is permitted which does not comply with these terms.
*Correspondence: Wanjun Lu, d2psdUBjdWcuZWR1LmNu; Yong Chen, eW9uZ2NoZW56eUB1cGMuZWR1LmNu
Disclaimer: All claims expressed in this article are solely those of the authors and do not necessarily represent those of their affiliated organizations, or those of the publisher, the editors and the reviewers. Any product that may be evaluated in this article or claim that may be made by its manufacturer is not guaranteed or endorsed by the publisher.
Research integrity at Frontiers
Learn more about the work of our research integrity team to safeguard the quality of each article we publish.