 Laura Casas
 Fran Saborido-Rey
- Institute of Marine Research, Spanish National Research Council (IIM-CSIC), Vigo, Spain
Knowing the number of individuals in a population is fundamental for the sustainable management of exploited marine resources but estimating this parameter is often extremely challenging, especially in large, highly mobile and dispersed populations. Abundance estimation traditionally relies on multiple data types that include the relationship between fishery catches and effort (Catch Per Unit Effort or CPUE), scientific research surveys and demographic models that are developed to estimate past and current stock dynamics, but uncertainty is often high. Close-kin mark-recapture (CKMR) is an alternative method for estimating abundance and other demographic parameters (e.g. population trend, survival rates, connectivity), using kinship relationships determined from genetic samples. This methodology is based on a simple concept - the larger the population the less likely to find relatives and vice versa - and was proposed two decades ago although regained considerable attention recently. Refinements in the statistical methodology and advances in high throughput sequencing methods have boosted the efficiency of genomic analysis, promising to revolutionize the field of fisheries stock assessments. In theory, it can be applied to almost any species, provided that there is sufficient information about the life-history/biology of the organism and that the populations are not so small as to be almost extinct or so large that finding relatives becomes extremely difficult. Thus, it has the potential to provide baseline data for the many exploited fish stocks that remain largely unassessed and to reduce uncertainty in those that are regularly evaluated. Here, we provide an overview of the method in the context of fisheries assessments, analyze the advances and synthetize the field studies published in the last five years. Moreover, we evaluate the readiness, viability and maturity of the method to infer demographic parameters in species spanning diverse life histories. We evaluate technical considerations and requirements for a successful application and analyze the main challenges and limitations preventing a broader implementation.
1 Introduction
The status of marine fish stocks needs to be assessed to ensure fishing practices that exploit the populations at sustainable levels. Stock assessments are based on multiple data types that include catch data, monitoring of fishery landings, biological observers and scientific research surveys. The latter provide critical fishery-independent information of fish stocks that is subsequently utilized for estimating key population demographic parameters such as biomass, abundance, fecundity, recruitment and mortality. These parameters are not only crucial to guarantee the effective management of the stocks but also to understand their recent evolutionary history (Swain, 2011; Kindsvater et al., 2016).
Despite their critical importance, scientific research surveys used to assess fish stocks present recognized shortfalls (Maunder and Piner, 2015). These include a slow progress coupled with high economic costs and complex logistics, that often results in sparse data with limited coverage in space and time (Stamatopoulos, 2002, Pennino et al., 2016). Moreover, the data obtained is not always accurate and the elevated costs prevent the assessment of many exploited stocks that remain data limited or, directly, unassessed, representing a major conservation concern.
The emergence of novel genomic techniques together with the plummeting sequencing costs have provided novel means to improve the cost-efficiency of fisheries research surveys, reduce bias and uncertainty of fish stocks assessments and expand the range of assessed species.
In this review, we focus particularly on the method of close-kin mark-recapture (CKMR), based on an idea founded nearly two decades ago (Nielsen et al., 2001; Skaug, 2001) that resurfaced recently as a promising tool to estimate key demographic parameters, through genotyping and the identification of close-kin using modern genomic methods (Bravington et al., 2016b). CKMR can be used to estimate abundance or biomass among other demographic parameters, which are especially challenging to infer in many marine species, characterized by large, highly mobile and dispersed populations.
This methodology has gathered considerable attention as it has important advantages over classical mark-recapture (MR), which requires capture, physical marking and recapture of individuals, who must remain alive, in multiple sampling events. In contrast, CKMR can be applied to samples collected during a unique sampling event as well as to dead specimens (Wacker et al., 2021). Besides, CKMR overcomes many of the challenges inherent to traditional MR modelling, as it does not suffer from the effects that can occur after initial capture, such as trap shyness or tag-loss (Marcy-Quay et al., 2020). Advances in high-throughput sequencing technologies, enable today the fast and accurate genotyping of large numbers of samples across many loci to identify close-kin with precision.
Despite its potential, the successful application of the method is yet very restricted, as it has been used to assess only a handful of species (Delaval et al., 2022). The broad applicability of CKMR to fish populations and, therefore, its usefulness for fisheries assessments has yet to be demonstrated. Here, we provide an overview of the method, together with guidance for its application, which includes crucial information that is scattered across grey-literature (mostly non-peer reviewed reports, including technical, workshop and project reports). Bravington et al. (2016b) lays the foundation of the method detailing the mathematical and statistical framework, assumptions and conditions needed for its application whereas Waples and Feutry (2022) compare the methodology with kin-based methods to estimate effective population size using analytical models. In contrast, here, we provide a deliberately oversimplified description of the statistical framework and use an accessible terminology to reach potential users alike – fisheries scientist and managers with no expertise in genomics and geneticists unfamiliar with modelling, respectively. We review the methodology in the context of fisheries assessments focusing on practical aspects and technical considerations. We analyze all CKMR studies applied to fish species published to date, discuss the readiness, viability, maturity and limitations of the method and issue recommendations for its uptake in stock assessments.
2 The basics of close-kin mark-recapture
2.1 What is CKMR?
CKMR is a method for estimating abundance and other demographic parameters (e.g. survival rates, fecundity, selectivity) from kinship relationships determined from genetic samples. It uses modern genetics to identify close relatives amongst large sample sizes of fish, and then makes demographic inferences about the adult stock from the number and pattern of pairs found (Bravington et al., 2015; Bravington et al., 2016a). The likelihood of a specimen being a close relative of the rest of the individuals can be calculated by comparing the genetic make-up of fish from a population and accounting for their life-history information (e.g. year of birth). CKMR offers a direct methodology to assess wild fish stocks that is fishery‐independent of commercial catch per unit effort (CPUE) and total catch data so crucially, does not suffer from errors in catch reporting and other potential sources of bias associated with more traditional fishery-dependent data. This methodology can provide estimates of key population parameters from relatively short studies (over a few years, e.g. Wacker et al., 2021) and therefore, has the potential to be widely deployed for routine assessments of fisheries resources (Rodriguez-Ezpeleta et al., 2020).
It has been nearly two decades since the use of individual genotypes as genetic tags was first proposed in the literature (Nielsen et al., 2001; Skaug, 2001). At the time, genetic data were in short supply, and it was necessary to make allowances to handle the substantial uncertainty regarding inferred kin relationships. Today, advances in sequencing technologies, especially their increasing throughput, have made CKMR projects feasible in a number of different contexts, as several degrees of kinship can be determined with enough accuracy.
CKMR is based on the principles of DNA-based kinship as it uses the unique DNA profiles of the individuals to determine if they are related or not. An specimen is considered “tagged” by its presence in a sample, and “recaptured” by the occurrence of one or more close relatives in the sample (Bravington et al., 2016b; Seber and Schofield, 2019). Molecular tags pass automatically from generation to generation, as a consequence of inheritance, and the probability of detecting relatives is directly linked to population size. Naturally, finding relatives is more likely to occur in smaller populations, so the number of “recaptures” can be used to infer abundance (Bravington et al., 2016b).
The first applications of CKMR were based solely on the identification of Parent-Offspring Pairs (POPs) (Figure 1) (e.g. (Bravington et al., 2016a, southern bluefin tuna) although novel high throughput sequencing methods allow also inferring more distant kinship relationship accurately and thus, second-order (e.g. half-sibling) relatives have also been incorporated in posterior CKMR studies. This extended kinship methodology is especially relevant in the context of fisheries management for two reasons. First, it widens the scope of applicability of CKMR studies enabling the study of species characterized by ontogenetic shifts in habitat use without implying complex sampling designs. Many fish species occupy coastal shallow areas as juveniles and move to deeper, more diverse habitats as adults (Cheminée et al., 2021). Collecting both components complicates sampling logistics and can be extremely challenging for large, solitary species like sharks, where adults are mostly found dispersed across huge areas of deep offshore open ocean waters (Ramírez-Macías et al., 2017; Hoffmayer et al., 2021). Second, the use of second-order kinship allows the estimation of additional population parameters, such adult mortality, which cannot be inferred using solely first-order kinship (Davies et al., 2015; Maunder et al., 2021). Estimates of kinship derived from genetic data, together with life-history traits such as maturation schedules and reproductive output (fecundity, reproductive behaviour, egg/larval quality, offspring survival rate), along with stock structure information (age, growth and length-weight relationships, all potentially estimated by sex), are modelled to obtain abundance and other demographic parameters. These can be integrated into stock assessment models to assist management procedures.
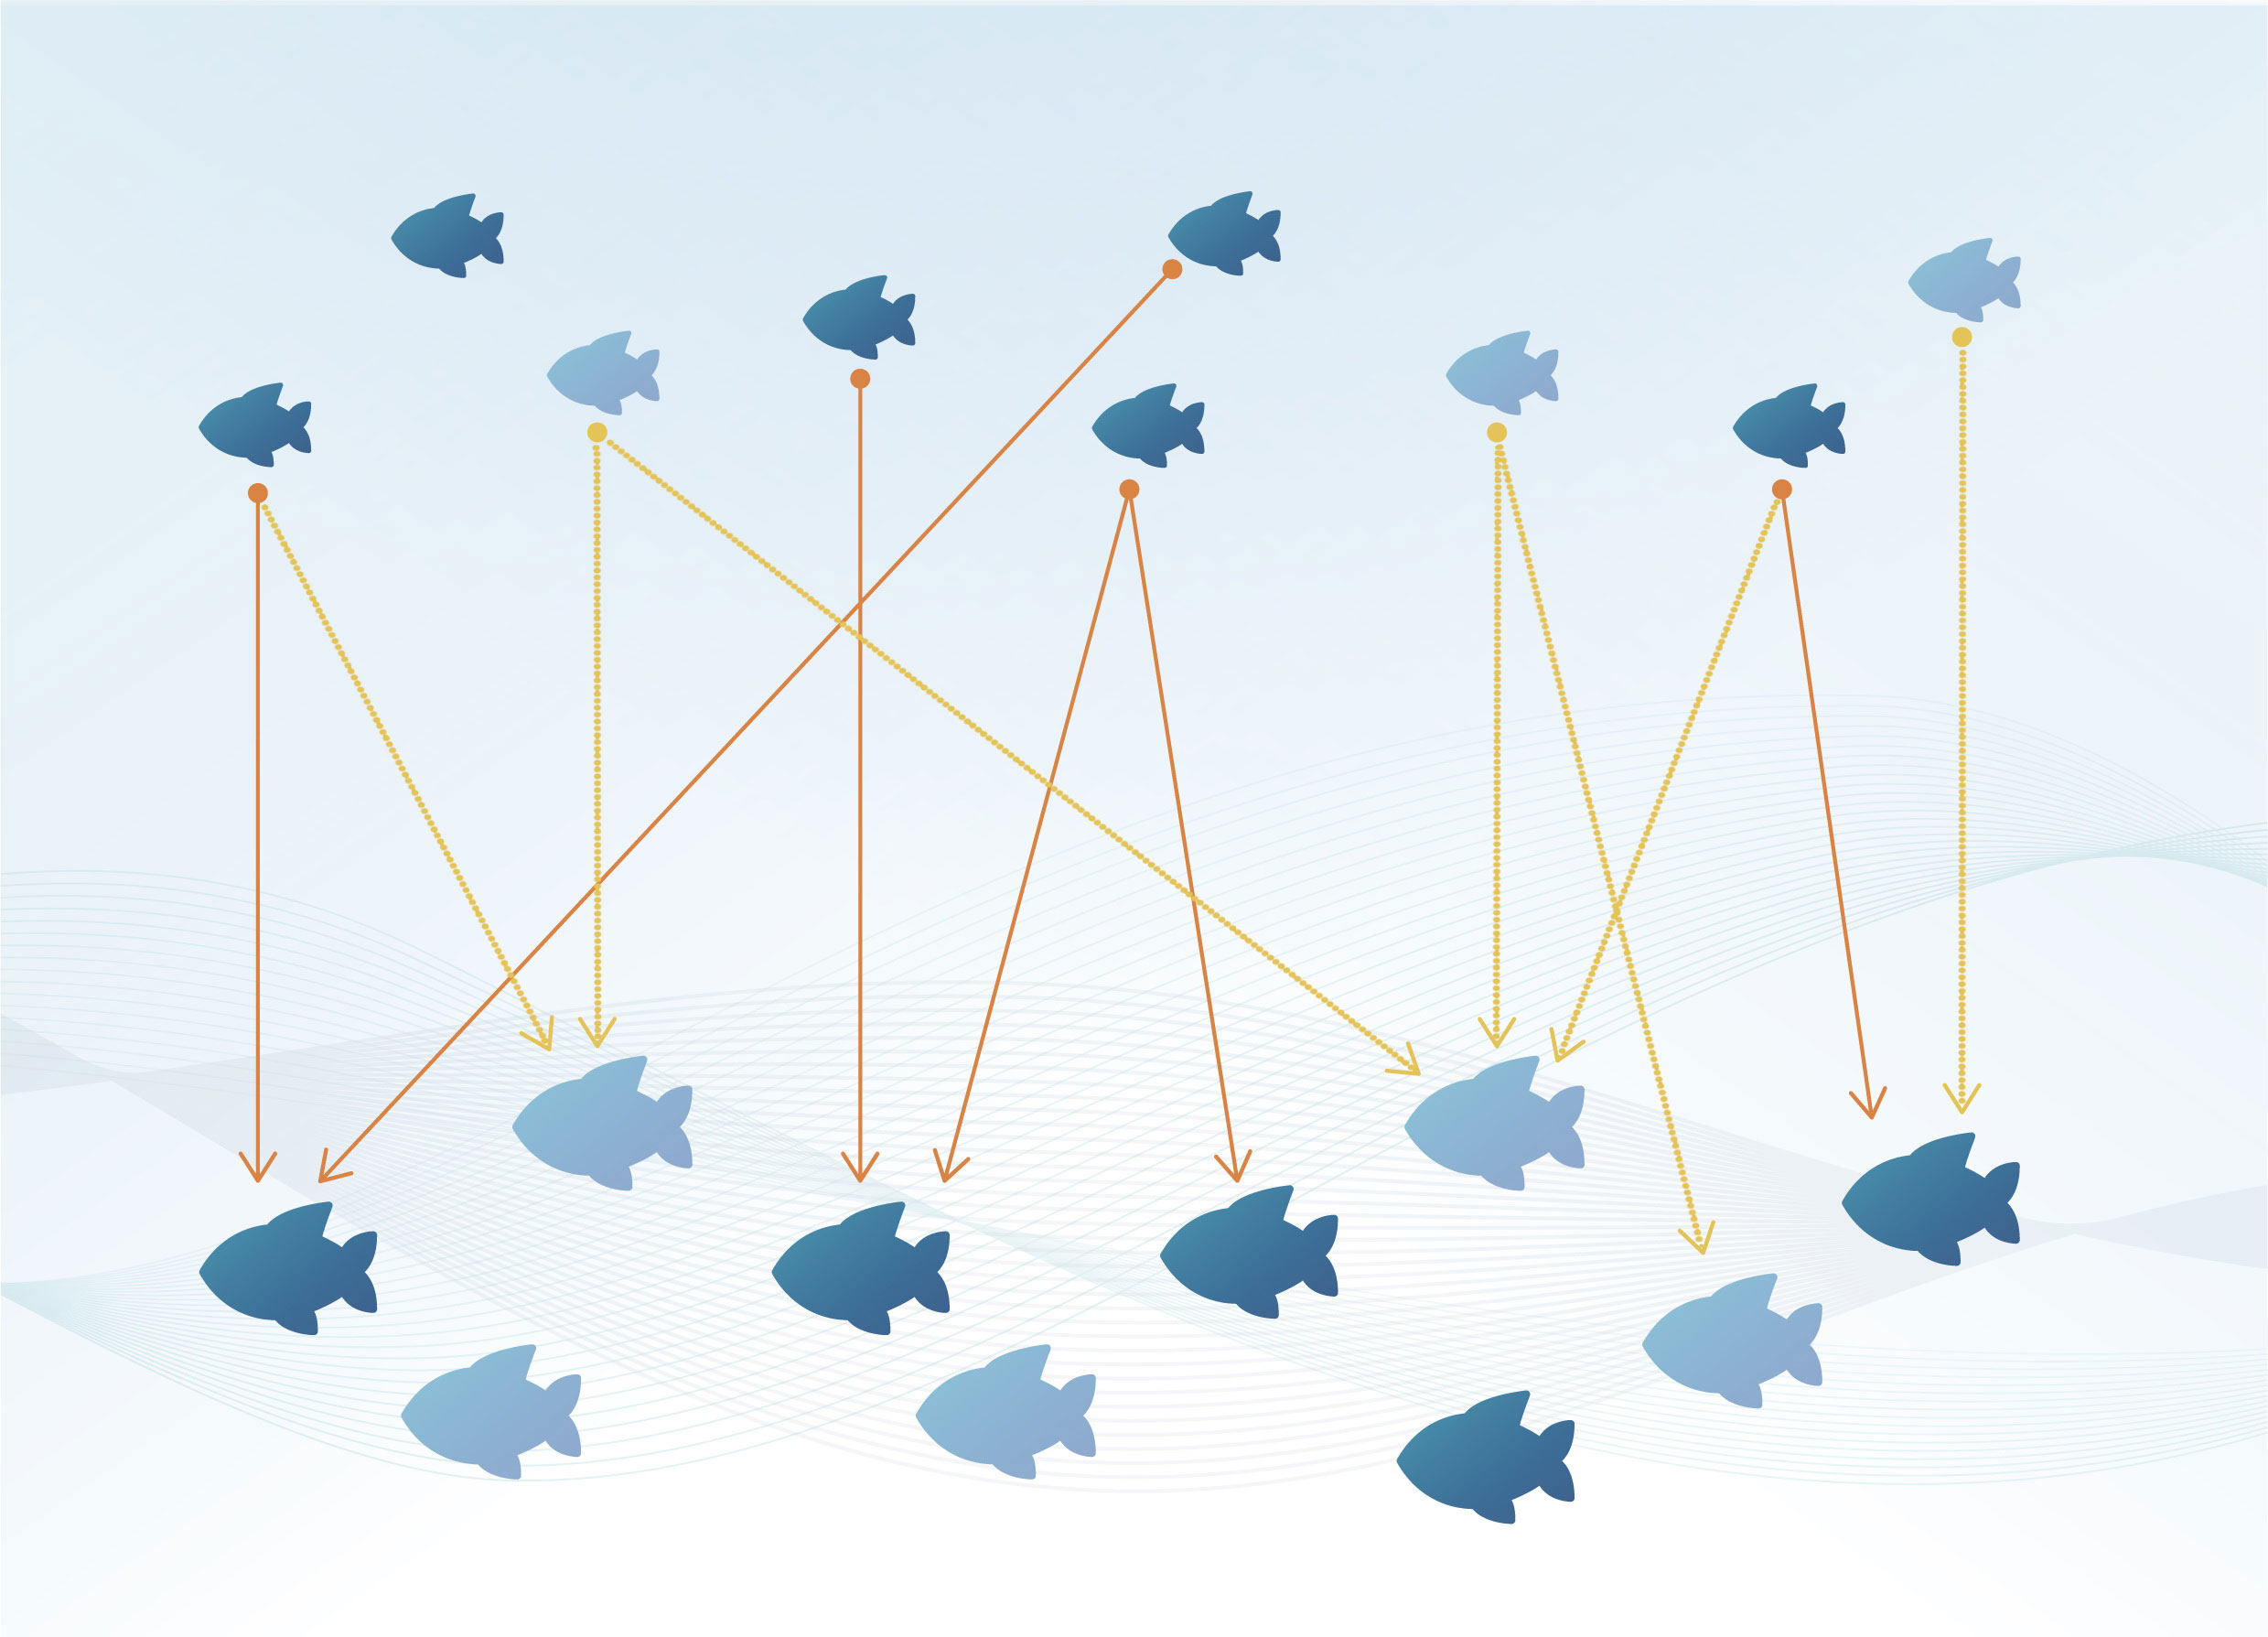
Figure 1 Illustration of the CKMR principle; adults (big fish) and juveniles (small fish) are sampled (dark blue) from the total population (dark and light blue). Each juvenile “tags” two fish: each of its parents (orange and yellow lines) in the adult population; but only sampled fish provide kinship information – POPs (orange lines). The absolute abundance of adults (10) can be estimated from the number of sampled adults and juveniles (5 and 6 respectively) and the number of POPs found (6), using the formula: (2x5x6)/6 = 10 (see section 2.2); Figure redrawn from (Bravington et al., 2016b).
2.2 Theory and assumptions behind close-kin abundance estimation
For an in-depth view of the statistical underpinnings of CKMR, the interested reader is referred to (Bravington et al., 2016a; Bravington et al., 2016b). Here, we aim to provide a simplified overview into the basic theoretical foundation behind close-kin abundance estimation. In its simplest version, the method is based on POPs and rests on two notions: i) each juvenile has two parents and ii) genomic information allows establishing accurately if two fish constitute a POP. Thus, each juvenile is an offspring that genetically “tags” its two adult parents among the adult population of size Nadult. The probability of a sampled juvenile being the offspring of a randomly sampled adult is 2/Nadult. It is important to note here that Nadult is the number of adults alive when the juveniles were born, and thus, the method serves to estimate adult abundance retroactively. This parameter, Nadult, can be calculated based on the genotypes of sampled adults and juveniles (mA and mJ), by examining all possible pairwise comparisons, and counting the number of POPs found (P), using the following formula (Bravington and Grewe, 2007; Bravington et al., 2016a):
Therefore, the observed total of POPs provides a natural estimate of absolute abundance of the adult population that is directly analogous to a Lincoln–Petersen abundance estimate in standard mark-release recapture (Bravington et al., 2016a).
The derivation of an unbiased estimate of requires the random sampling of adults and collecting the juveniles independently of adults (e.g. the method cannot be applied to adults and offspring sampled concurrently when parental care is ongoing) (Bravington and Grewe, 2007). Failing to comply with these two requirements would increment artificially the probability of finding a POPs, resulting in a negatively biased estimation of adult abundance.
The alternative version of CKMR based on half-siblings conforms to three principles: i) given any pair of juveniles, each of them has one mother and one father; ii) assuming a balanced adult sex ratio, the chance that they share the same mother is 1 over the number of female adults, i.e. 2/Nadult and iii) the chance that they have the same father is 2/Nadult. Thus, for a given pair of juveniles, the overall chance that they constitute an HSP is 4/Nadult. Making all mJ pairwise comparisons, gives /2 “non-double-counted” comparisons, and can be used, with the number of half-siblings detected (H) to estimate Nadult using the following equation (Bravington, 2014):
The observed number of HSPs provides an estimate that is independent of the POP-based estimation and reflects the effective breeding population abundance, or the effective number of breeders in one year, Nb (Davies et al., 2020; Waples and Feutry, 2022). If a substantial proportion of the adults do not contribute to produce offspring, they are invisible to a sibling-based approach. Skip-spawning, maternal effects, variation in reproductive potential and other mechanisms are some of the causes producing different reproductive success among individuals (Lowerre-Barbieri, 2009). Thus, the use of POPs (Eq. 1) provides the total number of adults in the population, an essential parameter in fisheries stock assessment. The use of HSPs (Eq. 2) estimates, instead, the number of adults that have effectively contributed to produce offspring, a parameter that is not currently used in stock assessment and fisheries management. If all or most of the adults have equal reproductive success, and there is an even sex ratio in the population, both estimators yield similar results. However, most of the exploited teleost species show very large fecundity and variation in reproductive success (Wright and Trippel, 2009). Nonetheless, for simplicity, we hereafter use the term “adult abundance” for both approaches (POP and HSP-based)). The differences and commonalities between them are reviewed by Waples and Feutry (2022).
2.3 Adjusting the simple estimators to the specific biology of the species under study
Both simple estimators provide accurate inferences if strong assumptions are made, including the absence of temporal variation in life history traits (fecundity, survival rate, migration), the random sampling of a balanced number of adults and/or juveniles showing a homogeneous distribution during a unique sampling event, and other standard population genetics assumptions, i.e. Hardy-Weinberg equilibrium, linkage equilibrium and random mating. However, such assumptions cannot be made for the vast majority of the fish populations as they display variations in maturation, fecundity, spawning dynamics, survival rate, migration and other factors that can affect the probability of finding close-kin matches, potentially causing a strong bias of the simple estimators (Bravington and Grewe, 2007; Bravington et al., 2016b). Below, we review the most important parameters that can affect the probability and therefore, require attention when applying CKMR.
2.3.1 Population substructure
In the presence of population substructure, the basic method remains unbiased if sampling is proportional to abundance across either the sub-population of adults or the sub-population of juveniles. Planning such sampling strategy requires previous knowledge, however, genetic data generated for CKMR can be used to detect substructure and determine the adequacy of sampling a posteriori. Spatial patterns in close-kin distribution can inform about population subdivision and even an exploratory rough sampling design should be enough to reveal substructuring when is strong enough to affect CKMR estimates (Wang, 2014; Feutry et al., 2017; Conn et al., 2020; Waples and Feutry, 2022).
2.3.2 Sex-specific life history characteristics
Many species show biased sex-ratios, some across the whole adult population while others display a balanced number of males and females that becomes skewed during certain periods of the year (e.g. during breeding or feeding season). This situation would, generally, require independent estimates of the adult male and female abundances ( and ), using the male and female adult samples, respectively. Nonetheless, if adults have unequal sex ratios but the sampling holds the same sex bias, the POP-based estimator would be unaffected (Bravington and Grewe, 2007). Demographic modelling should consider the existence of strong sexual dimorphism in growth rates, fecundity-at-age, hermaphroditism, and different catchability between sexes (gear selectivity pattern) among other particularities (Trenkel et al., 2022).
2.3.3 Sampling delays
The abundance estimate derived from the CKMR method is retrospective, i.e., is the number of adults that were alive when the juveniles were born, rather than when the juveniles were sampled (Bravington and Grewe, 2007; Bravington et al., 2012). Thus, comparing each offspring only against their “parental-cohort-group” would require knowing the age of all the fish and that the fish would mature at the same length/age. In realistic CKMR settings, this is almost never the case. Most studies are based on samples collected years after the birth of juveniles, and thus, comparisons between juvenile and adults to estimate kinship necessarily involve a high proportion of “impostor” adults that could not have been parents as they were immature at the time (Figure 2) (Bravington et al., 2014). Ignoring these time lags and the differential probability of an adult being the parent of a juvenile in each comparison would lead to a high bias of the simple estimator for POPs. Sibling-based analysis also require to assign accurately the cohort year of each specimen as not all types of siblings are useful in CKMR studies (see section 3.2.2). This problem can be tackled by recording the age of all the individuals included in the analysis (Bravington and Grewe, 2007). The preferred source is always a direct and precise age estimation based on hard structures such as otoliths, scales or vertebrae, among others. Nonetheless, this is not always possible as these methods often require the sacrifice of the specimens and are not always reliable (e.g. otolith-based ageing in European hake (de Pontual et al., 2006)). In the absence of direct age determination, a length cut-off can be used to assign the birth year through growth curves but this alternative requires knowledge on growth rates and associated uncertainty in the age estimate. For species displaying considerable variability in length-at-age, this uncertainty needs to be accounted for in the CKMR model and might even prevent the use of a considerable percentage of informative kinship pairs in a sample (Rodriguez-Ezpeleta et al., 2020; Trenkel et al., 2022). Additionally, other stock parameters such as rates of adult mortality, age at maturity and knowledge of whether the reproductive output is dependent on size need to be also considered as they can heavily affect the probability of finding kinship matches of both, POPs and HSPs.
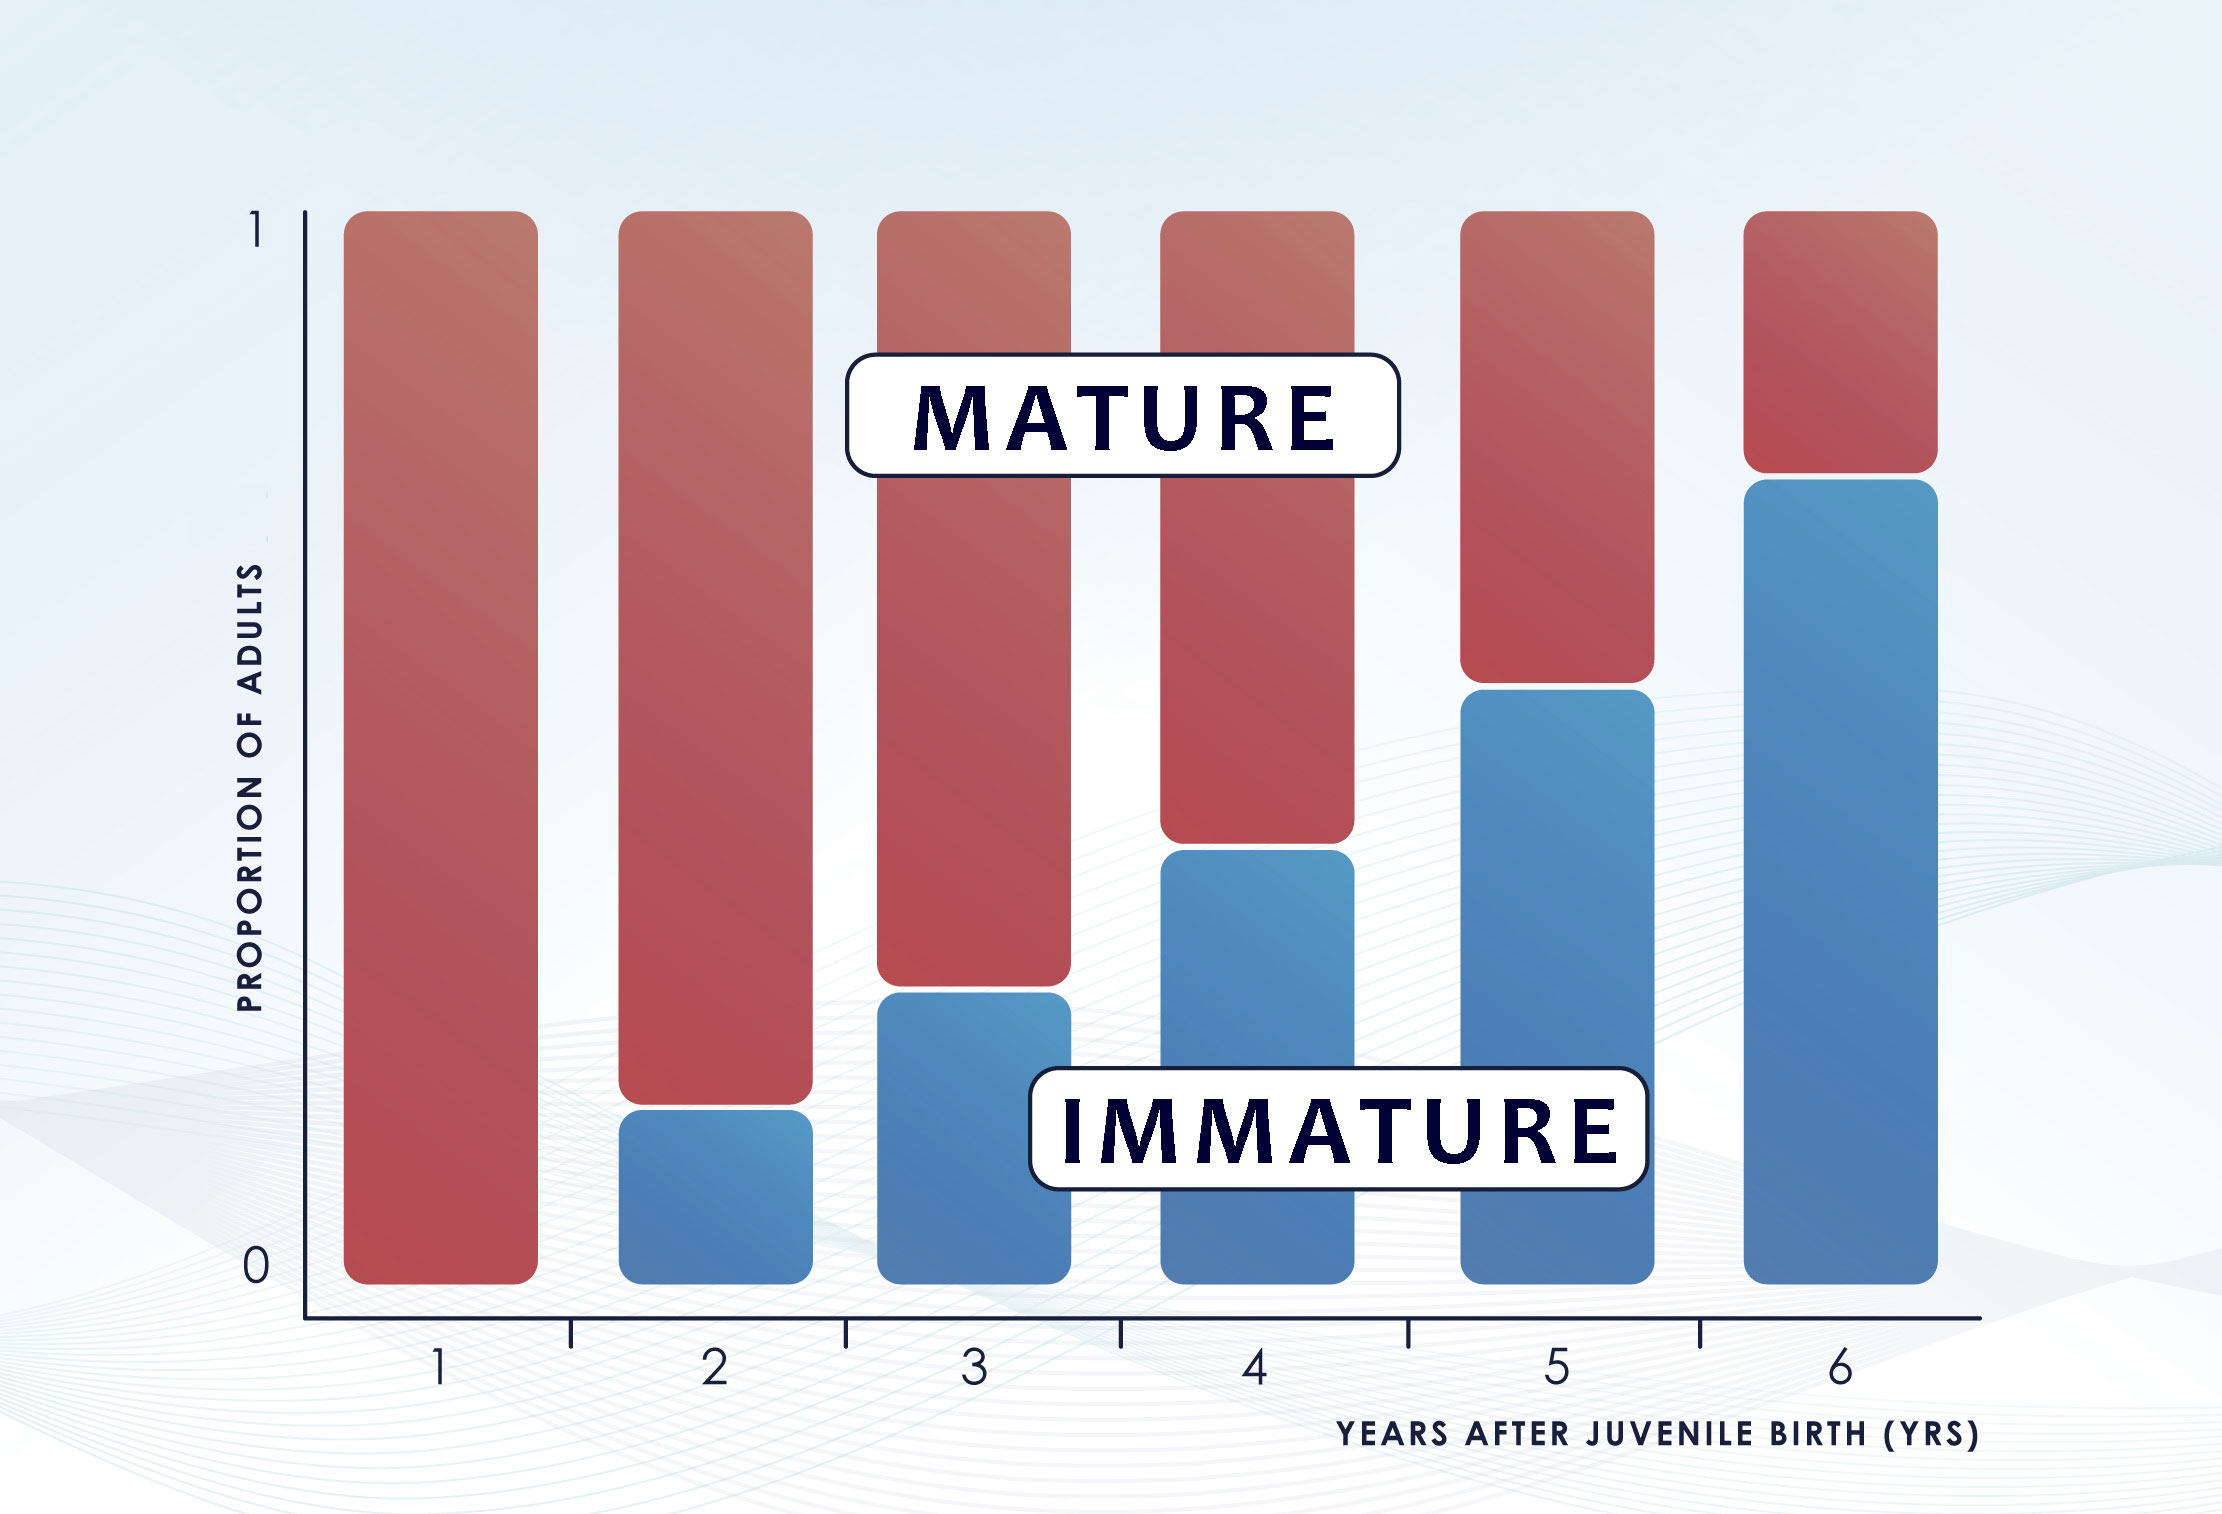
Figure 2 Effect of the incoming recruitment on the original parent-cohort group. The time gap between juvenile birth and sampling determines the number of immature specimens that enters the “adult” group but could not have been parents at the time the juveniles were born as they were immature. Figure redrawn from (Bravington et al., 2014).
2.3.4 Multi-year sampling
A similar problem arises if the experimental design implies multi-year samplings, since for a given cohort of juveniles, their potential parents will be sampled across several years, rather than in one year (Bravington et al., 2014). Therefore, the sample will contain multiple cohorts of juveniles. Moreover, for many species there might be a general delay of several years before the potential parents of a given juvenile cohort are sampled, during which some of the parents will die. Again, it is essential to consider both, the birth-year of the juveniles and the sampling-year of the adults to restrict the pairwise comparisons to those individuals that were mature in the birth-year. Also, when comparing offspring from different cohorts it is paramount to account these delays as they can greatly affect the probability of kinship matches (Waples and Feutry, 2022). Although certain species can benefit from the use of pre-existing archived DNA samples, very old specimens may not be relevant for the estimation of the current stock parameters as the cohorts that produced them will have died out. Since any CKMR analysis reflects the abundance of the adult stock in the birth year of the collected specimens, in case of very long intervening periods or of late-maturing species, the stock abundance might have change considerably (Rodriguez-Ezpeleta et al., 2020).
2.3.5 Reproductive variability
The basic method can also produce skewed estimates if variation in reproductive potential is not considered. Most fish species show a gradual maturation (not all fish mature at the same length or age) and an increase in fecundity and offspring quality with age/size (Saborido-Rey and Kjesbu, 2005). Accordingly, large/old fish produce more offspring with increased viability, i.e. more “tags” per capita. If adult sampling is strongly selective towards large specimens, each tag would be more likely to be “recaptured”. This can lead to an underestimation of as each comparison would be more likely to yield a POP than would a comparison with a randomly chosen adult (Figure 3, right panel). Likewise, there are temporal variations in maturation schedules and fecundity that are also important to consider in CKMR analyses. If only POPs are analyzed, fluctuations in reproductive output among years due to variation in reproductive potential (which in teleosts it is well known to occur), do not bias the simple estimator but affect its precision (Figure 3) (Bravington, 2014). In contrast, random within year fluctuations (due to e.g. sweepstake reproduction) would produce large numbers of within-year full-sibs and half-sibs that, if accounted for, would affect independence of samples leading to overdispersion in the close-kin data (Maunder et al., 2021). Thus, variation in the reproductive potential is even more relevant in HSP-based studies as it could directly affect the number of pairs found within each sampled cohort of juveniles, requiring the exclusion of within-cohort comparisons (see section 3.2.2 for further information).
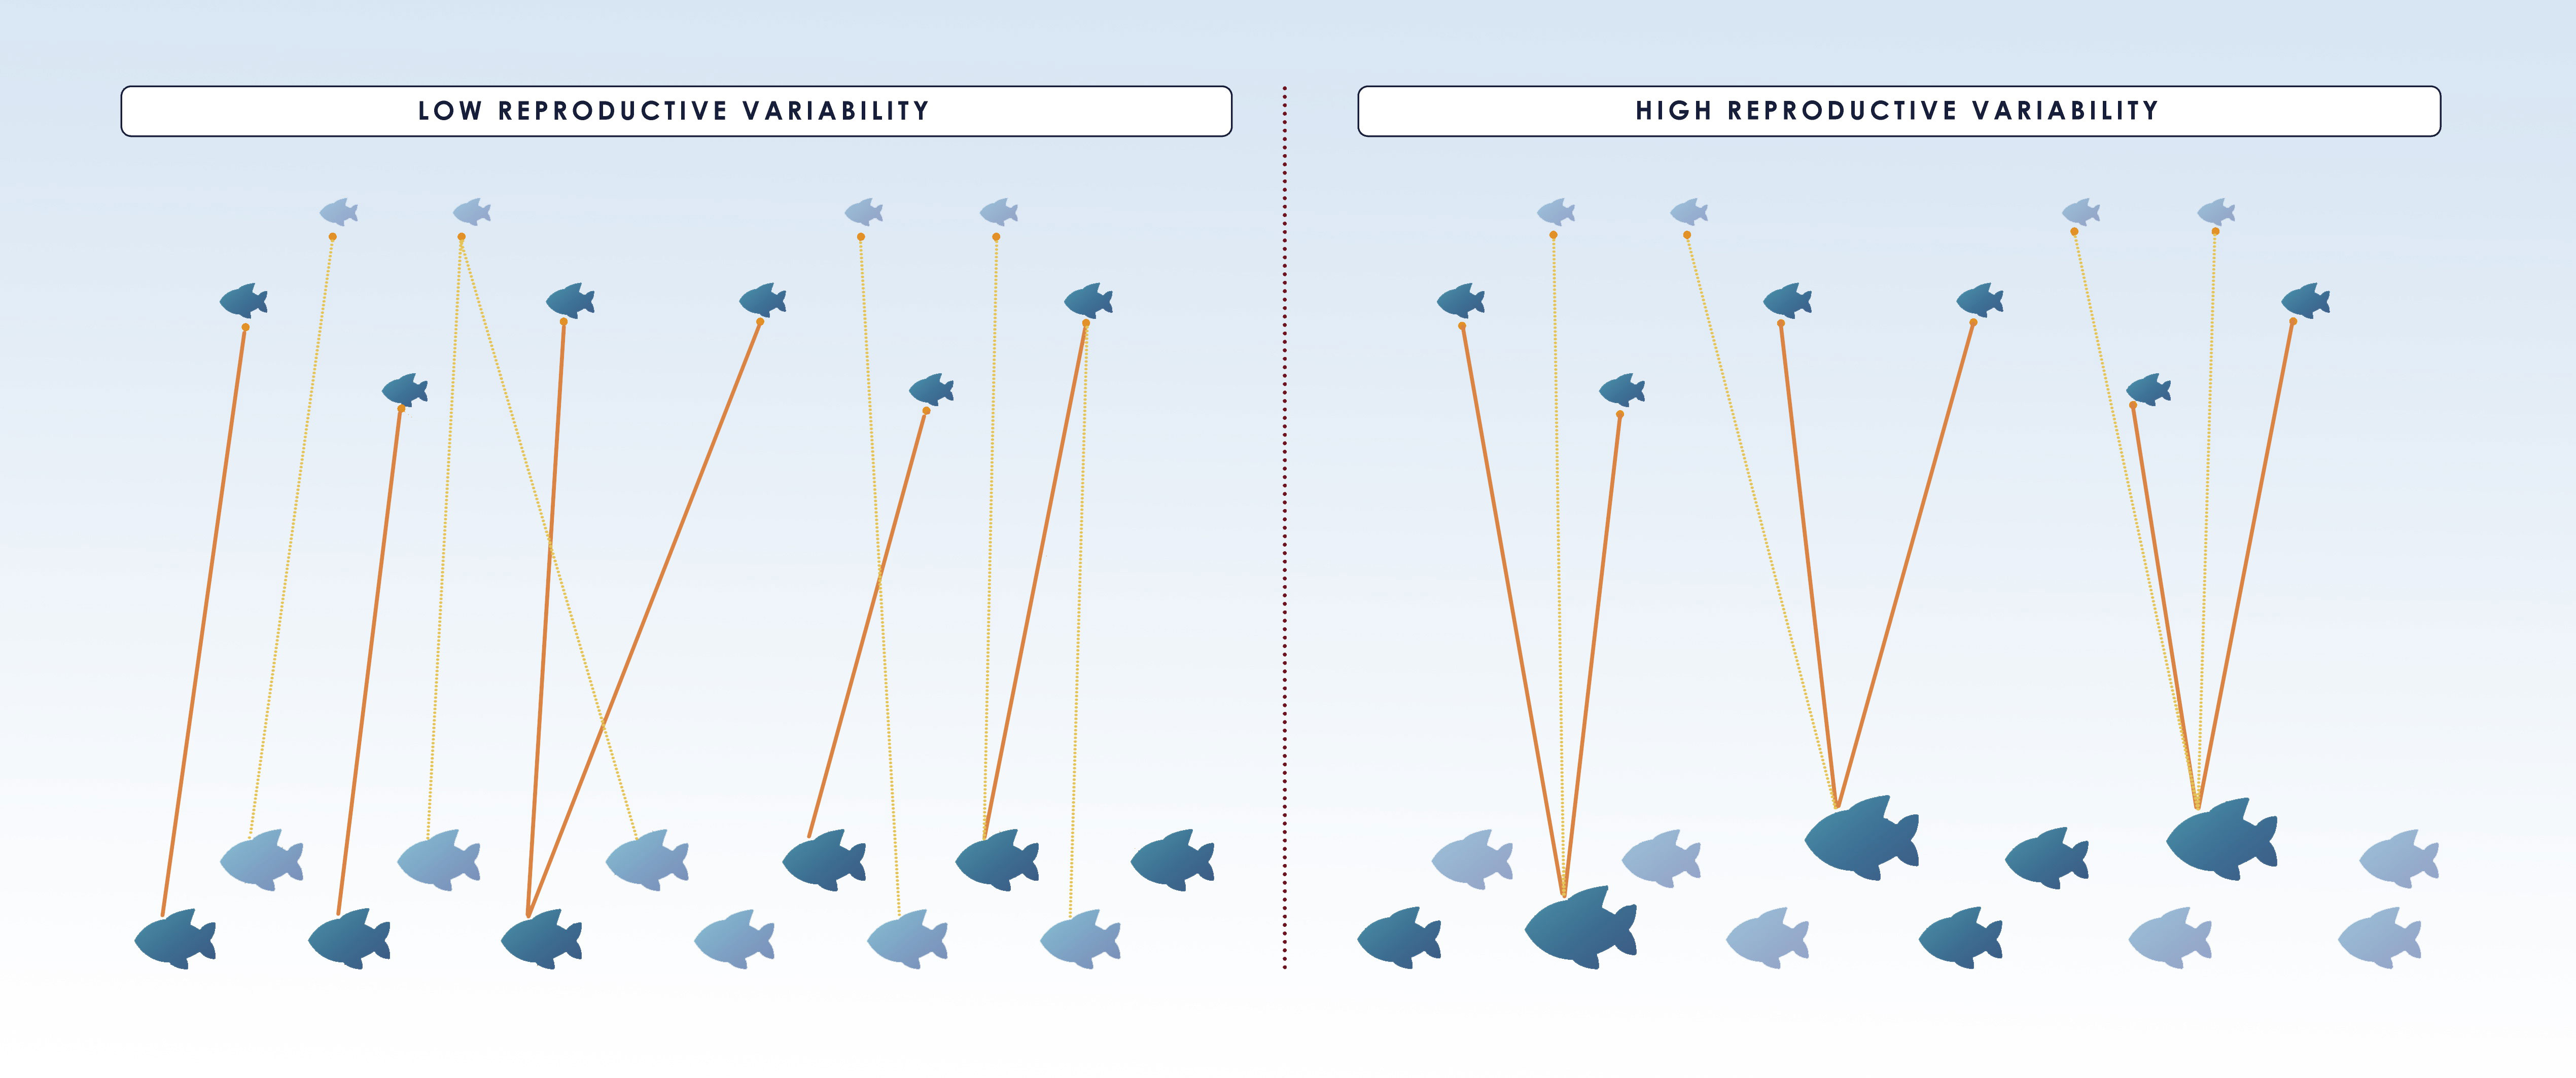
Figure 3 Illustration displaying the effect of reproductive variability (high variability on the right and low on the left) on close-kin abundance estimate and its coefficient of variation (CV). Small fish on the top of the figure correspond to juveniles whereas adults are the bigger fish below and only the dark colored ones from both groups are sampled. The same number of matches (indicated by the orange lines between dark colored adults and juveniles) is found in both situations and hence they produce the same number of POPs. Nonetheless, for species with high reproductive variability, the matches involve fewer adults and thus, a low precision of the estimate (i.e. larger CV), as it is disproportionately affected by the number of sampled “super-parents”. In the figure, 6 out of 10 and 6 out of 12 juveniles and adults, respectively, are sampled in both situations, and 6 POPs are found, resulting in the same =6*6*(2/6)= 12. However, if bigger specimens are more fecund and also more likely to be caught as in the right panel, and only the large individuals are sampled, will be underestimated, unless selectivity is accounted for. Figure redrawn from (Bravington et al., 2014).
3 Planning a CKMR study
3.1 Considerations for experimental design and sampling
Before embarking on a CKMR project, a careful evaluation of the sampling, sequencing and modelling needs, together with their associated costs is indispensable to assess the feasibility of the method for our case study. Proceeding without a clear understanding of requirements is likely to lead to either wrong conclusions or unsuccessful studies (Rodriguez-Ezpeleta et al., 2020). An essential requirement for the successful implementation of CKMR is prior knowledge on the biology of the species. Although CKMR can be applied to a variety of species and life histories, its actual implementation in terms of sampling design, data requirements and analysis, requires tailored refinements.
Particularities related to the biology of species require attention as they can potentially lead to biased CKMR estimates, as introduced in the previous section. For example, the study of sequentially hermaphroditic species (e.g. Asian seabass or groupers (Bayona-Vásquez et al., 2019)), species showing unbalanced sex ratios due to geographical segregation of the sexes (e.g. shortfin mako (Mucientes et al., 2009)), or due to ontogenetic shifts (e.g. common octopus (Alonso-Fernández et al., 2017)), introduces important considerations in terms of experimental design and might even prevent the application of the method. In fact, the life-history of some aquatic organisms make them ill-suited to CKMR. Facultative parthenogenesis (i.e. the occurrence of asexual reproduction in otherwise sexually producing species) prevents the application of the method. This type of reproduction has been described in at least 20 species of fish, all freshwater and brackish water species not targeted by fisheries (e.g. spined loaches Cobitis spp., Amazon molly Poecilia formosa), but also in elasmobranchs. Semelparous species (breed-once-then-die) that cannot be sampled as adults, including octopus, squid and eels, prevent the analysis of CKMR as they only allow the sampling of a single cohort. Moreover, species with very long lifespans that cannot be sampled young, such as the orange roughy that lives over 100 years (Andrews et al., 2009) are unlikely candidates for CKMR because estimates are back-dated to juvenile birth and would have a high uncertainty.
Biological knowledge about population or stock structure, habitat use and patterns of social structure (random or nonrandom association of individuals) is also important for sampling design. This is because the estimation of demographic parameters using CKMR requires the assumption that sampling is random with respect to kin, and this may not be satisfied if these aspect are ignored (Carroll et al., 2018). Thus, sampling should consider the existence of spatio-temporal differences in the distribution due to ontogeny, seasonal patterns, or regime shifts among other causes.
Collection of both, adults and juveniles, is highly recommended as the combination of both types of close-kin analysis is more powerful than either alone (Bravington, 2014). POPs and HSPs provide independent estimates of adult abundance, more close-kin pairs per sample and also allow the estimation of structural parameters than cannot be calculated from either directly, such as age/size-specific fecundity, selectivity, survival and mortality (see section 3.3. for further details) (Bravington, 2014; Rodriguez-Ezpeleta et al., 2020). Nonetheless, both components are not always essential, as sampling of just one might be adequate for species with fecundity that does not change with age (e.g. sharks, Hillary et al., 2018).
In principle, the whole spatial range of the stock of interest should be sampled, to ensure enough coverage to uncover potential spatial heterogeneity (Maunder et al., 2021). Nonetheless, it has been shown that low to moderate bias in spatial sampling does not greatly affect CKMR estimates, provided that sample sizes are large enough (Conn et al., 2020; Trenkel et al., 2022). However, the demographic composition of the sample can affect the precision of the CKMR estimates and needs to include a range of birth years (cohorts), especially for medium and long-lived species (Trenkel et al., 2022). For parents, the age at sampling informs on their age at maturation while for juveniles, the age at sampling informs on their year of birth. As specimens grow older, both reference years are further in the past and the associated uncertainty in the estimates of maturity rate and age increases significantly (Trenkel et al., 2022). Since CKMR models are built around the conception of adult population size at time of juvenile birth, obtaining reliable information on the age of sampled individuals is vital for the success of CKMR studies. Likewise, the selectivity of sampling gear is an important factor that may bias the age composition of the sample and has to be carefully considered.
Summarizing, studies that collect sufficient auxiliary data of sampled individuals and target species for which a deep biological knowledge is available (including life-history traits, reproductive biology, structure and habitat use), lead to more robust CKMR models.
Nonetheless, in most study cases, at least some of the biological parameters are unknown, requiring inevitably some assumptions. Natural mortality, for instance, is difficult to estimate and often not known in fish, but, for many species, it may be a valid assumption that it has little variation after maturity. Constant mortality rates over the period of juvenile birthdates can be assumed in these species, when several cohorts are included in a CKMR study, if collection of auxiliary data is not possible. Predicting other parameters such as the relationship between age, fecundity and catchability, for instance, is more complicated in the absence of direct evidence. In such cases, it is essential to make biologically reasonable assumptions according to the species under study. Although any assumption necessarily entails some level of undefined uncertainty, it can be reduced, or at least assessed, through an adequate sampling design.
Besides the importance of the particularities of the species and the amount biological information available, to achieve a representative and suitable CKMR sampling design, another crucial consideration to assess the feasibility of any CKMR project, is the sample size needed to produce precise and accurate parameter estimations. CKMR estimates rely on finding reasonable rates of “recaptures” or kin pairs. Assuming the collection of an equal number of juveniles and adults mJ=mA, is easily derived from Eq. 1 that the sample size requirements scale with . While bigger populations demand bigger sample sizes in absolute terms, the sample size relative to abundance is actually lower (Bravington et al., 2016a). Nonetheless, most fishes are characterized by large populations of mobile and dispersed specimens, and, therefore, still require extensive efforts to obtain sufficient recaptures. This is one of the greatest challenges for the application of CKMR to exploited teleost populations. The use of early developmental stage individuals (larvae) might have the potential to alleviate this problem to a certain extent. However, caution is needed since high levels of sibship among larval samples, which could be originated by the formation of kin-aggregations or by reproductive hyperallometry (i.e., when fecundity increases disproportionately to mass and only a few large individuals capitalize reproduction), could bias CKMR estimations (Selwyn et al., 2016; Marshall et al., 2021; Barry et al., 2022). McDowell et al. (2022) tested this hypothesis in Atlantic bluefin tuna and found that the levels of sibship detected were not enough to cause severe problems for CKMR based on POPs. Although this might not be true for other fish species, it might be worth exploring this alternative source to increment sample collection. Moreover, the use of larvae provides up-to-date estimates of CKMR abundance as these are intrinsically back-dated to the birth-years of the juvenile samples.
Given some a priori notion of Nadult, the formula 10* provides a crude approximation of the sample size needed in POP-based studies to obtain an accurate parameter estimation (≈15% coefficient of variation), assuming a single sampling event and a balanced number of juveniles and adults (Bravington et al., 2016b). Nonetheless, the authors highlight that this multiplier 10 is not universal and remark that a serious approximation should consider, at least, the expected number of comparisons and the likely probabilities of kinship to determine the number of samples required to obtain a reasonably precise estimation of abundance (see (ICES, 2016; ICES, 2017) for an example). This level of precision is usually expressed via the coefficient of variation (CV) of the abundance estimate as follows, where m is the combined sample size of adults and juveniles (distributed equally 50:50 for optimality) (Bravington and Grewe, 2007):
For commercially targeted species, the output of stock assessments based on CPUE data can be used as a starting point for the calculation and should aim at a small coefficient of variation (CV≈0.15) (Bravington et al., 2016a).
The R package CKMRpop offers the possibility of simulating pedigrees within age-structured populations under different life-history scenarios to assess the feasibility and potential accuracy of a CKMR approach (Anderson, 2022). Simulations can be performed in silico for a variety of sampling schemes targeting the collection of a distinct fraction of individuals in the population, and the software reports the expected number of kinship pairs and their distribution. Previous knowledge of basic life-history parameters of the species of interest are useful to narrow down the possible scenarios of the simulations.
3.2 Genetic identification of close-kin pairs
If the feasibility assessment reveals the adequacy of the method to the case study of interest, the next decision involves the genetic identification of close-kin pairs. Two key aspects that concern the type of both, marker and kinship to be applied in the analysis, need to be decided.
3.2.1 Selecting the markers for kin pair finding
Two types of markers have been used in CKMR studies to date, microsatellites and SNPs, each with its own characteristics that are out of the scope of this revision (but see (Flanagan and Jones, 2019) for an overview). Considering the resolving power of both markers in a kinship context, together with the large number of techniques that can be used to scan across genomes in search of polymorphisms at an affordable price, SNPs would be the natural choice for any project initiating today. Nonetheless, this has to be evaluated on a case-by-case basis depending on the prior knowledge of markers available for the organism of interest, the researcher´s skills, the laboratory infrastructure available and the project´s budget.
Independently of the marker of choice, it is essential to select a marker set that allows an accurate estimation of kinship pairs, avoiding false genetic associations. False-positives arise when an unrelated pair shares alleles by chance. They are especially problematic in CKMR studies since these generally involve a very large number of comparisons to detect a small number of kin pairs. The inclusion of spurious kin (false-positives) can, therefore, have large effects on the estimates (Bravington et al., 2016a; Bravington et al., 2017; Rodriguez-Ezpeleta et al., 2020). The probability of false-positives can be assessed in advance from the allele frequencies, and this step is essential in determining whether enough loci are being used. Accurate kinship analyses require large numbers of markers and is infrequent to score successfully all loci across all samples. In comparisons involving less loci, the false-positive probability might increase substantially. False-negatives, on the contrary, are the result of true kinship pairs appearing not to share one or more alleles that are actually common. This could rarely arise through mutation or more often through scoring errors, whereby the true alleles are incorrectly recorded. Scoring errors can be kept at minimum controlling the quality of the DNA, a careful selection of loci and robust protocols.
The expected number of false-positives generated by both type of errors will be negligible compared to the number of true positives if enough number of loci are used, the loci meet the quality requirements and fulfill regular population genetic assumptions (no linkage, etc.).
3.2.2 Selecting the type of kinship
Similarly, studies of CKMR published so far have analyzed either first or second-degree relationships, or a combination of both. The simplest form of CKMR is based on the identification of first-order kin relations (POPs). Every diploid animal has two alleles at each locus, one inherited from each parent and thus, a POP must share, at least, one allele at every locus (Städele and Vigilant, 2016). This allele sharing pattern can occur, by chance, between non-POP individuals but this probability can be decreased by increasing the number and variability of loci examined (Bravington et al., 2012). There are several analytical approaches that can be used to assign parentage and they can be grouped into three broad categories: exclusion-based, relatedness-based and likelihood-based methods (Huisman, 2017). Exclusion methods follow the principle of treating a pair as a POP if, and only if, the two animals share, at least, one allele at every loci, although normally allow some genotyping errors to avoid the exclusion of “true” POPs. Methods in the second category, estimate pairwise relatedness or kinship coefficients while the last group of methods assess likelihood ratios, being the most powerful of all but computationally more demanding (Städele and Vigilant, 2016).
The genetic identification of Full Sibling Pairs (FSPs, share both parents) and Half Sibling Pairs (HSPs, share only one parent) is more complicated. Detecting genetically more distant relationships is more demanding than detecting POPs (Maunder et al., 2021). FSPs share, on average, the same amount of DNA as a POP (50%), but with a different inheritance pattern, while HSPs, share, on average, only 25% of their DNA, although due to the random recombination process, this percentage varies among half-sibs (Figure 4) (Städele and Vigilant, 2016).
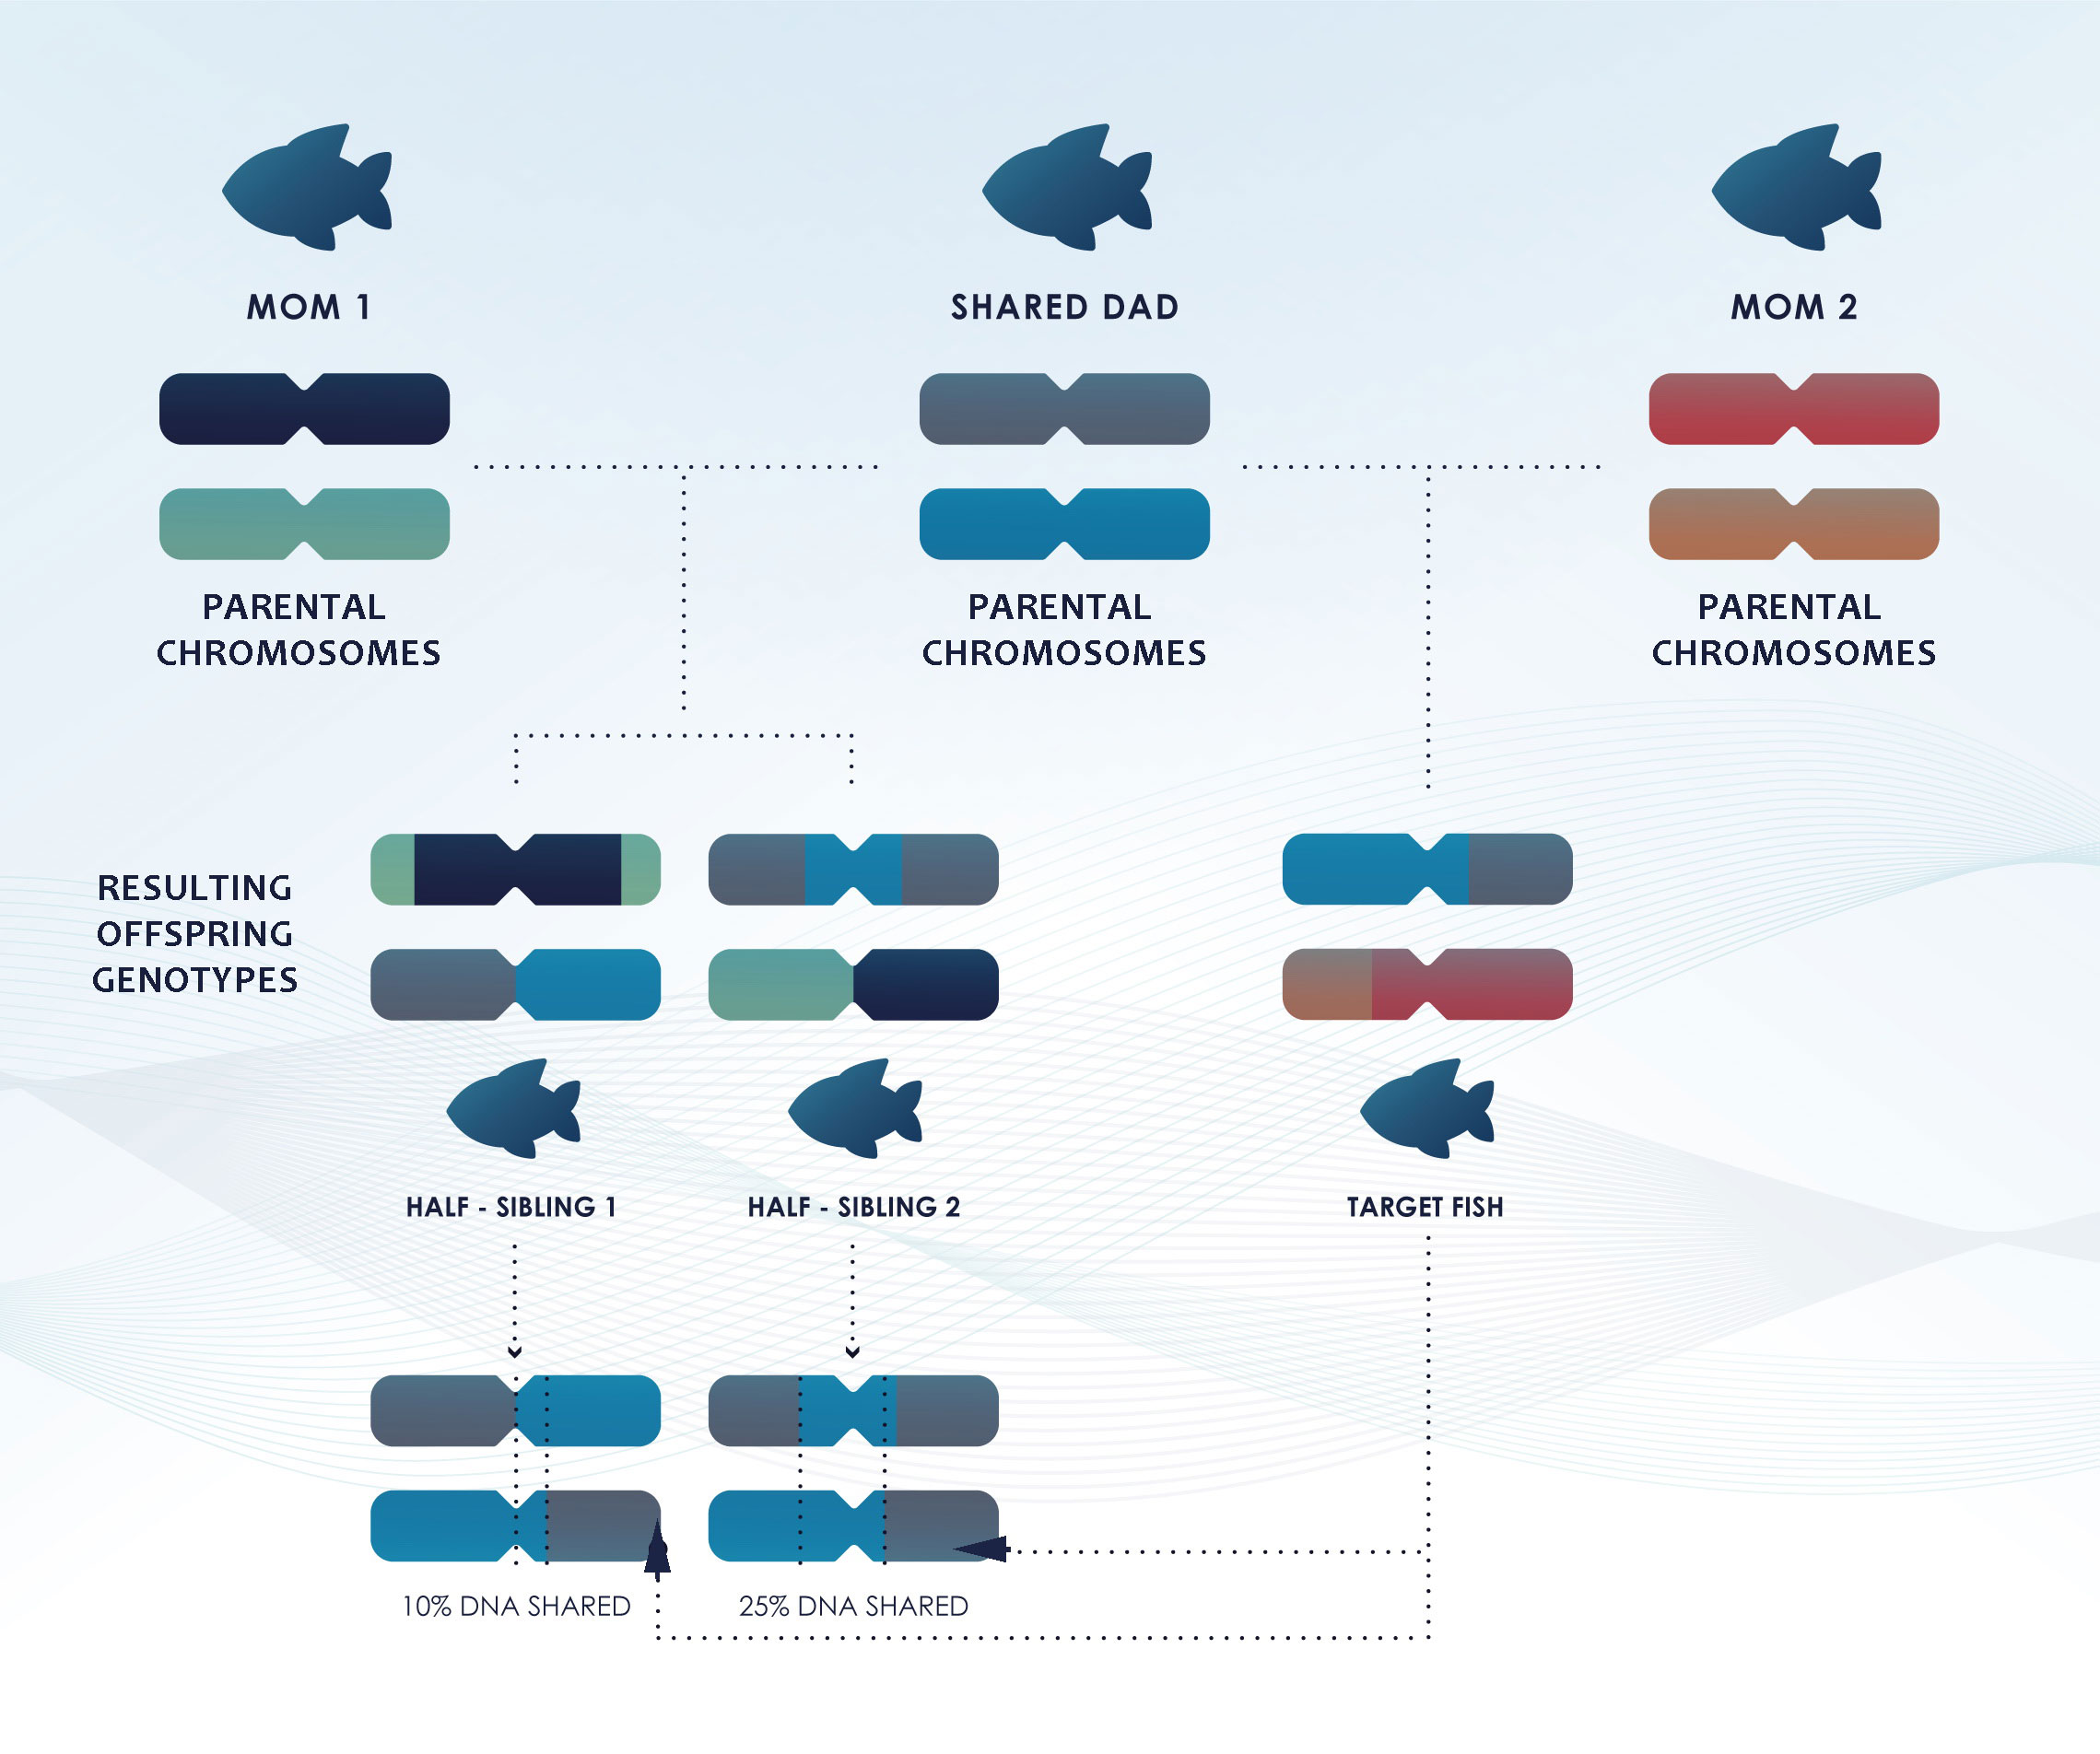
Figure 4 Simplified diagram illustrating that while half-siblings share, on average, 25% of their DNA, the recombination process shuffles de DNA differently for each offspring and can result in higher or lower proportions of DNA shared among siblings and half-siblings.
Finding half-siblings requires many more SNPs and as the number of locus increases so does the possibility of linkage among them (coinheritance). However, in theory, having a genome assembly or a linkage map could provide information about the physical linkages between genetic markers (i.e. whether they are on the same chromosome and how close together they are, allowing assessment of likely linkage disequilibrium). Sets of markers that are close together on the genome are more likely to be shared by siblings than by pairs with more distant antecedents. Thus, information on linkage disequilibrium may allow for better discrimination between HSPs and more distant relatives but also for differentiation from other second-degree relatives (Bradford et al., 2018). Half-siblings share an identical percentage of the genome, 25%, on average, than avuncular (e.g., aunt-niece) and grandparent-grandchild relationships, but their patterns of inheritance of genome segments overlap little (Qiao et al., 2021). Thus, it should be evaluated whether considering HSPs might introduce kinship assignment errors, depending on the samples collected, the auxiliary data available for them (mainly age), and the biology of the species.
Teleosts exhibit a wide array of reproductive strategies but most of the exploited species are largely characterized by large numbers of tiny offspring with a very variable survival (Murua and Saborido-Rey, 2003; Anderson and Gillooly, 2021). Strong variations in larval survival from offspring-to-offspring or from “litter-to-litter”, to follow Bravington et al., 2016b notation, cause a systematic over-representation of within-cohort half siblings due to the “lucky litter effect” (large survival of individuals from the same spawning/birthing event) (Bravington et al., 2016a; Bravington, 2019; Rodriguez-Ezpeleta et al., 2020; Maunder et al., 2021). This can affect independence of samples and requires filtering out within-cohort pairs as it could lead to a negative bias in CKMR estimates (Hillary et al., 2018; Maunder et al., 2021). Elasmobranch species display a lower fecundity and might, accordingly, be less affected by these within-cohort effects. However, CKMR-based estimations in these animals also requires the exclusion of same-cohort half-siblings (Hillary et al., 2018, for further information see appendix there).
Moreover, as most teleost species are promiscuous, it is extremely rare to find full-sibs across cohorts in random-mating populations with millions of adults and thus, FSP are normally not considered (Davies et al., 2020). This might not be true for other species of potential interest in fisheries, such as rays and sharks, as females of certain species have the ability to store sperm and thus, commonly produce cross-cohort FSPs (Trenkel et al., 2022). Still, this type of sibship should not be considered for the analysis as only cross-cohort half-sibling comparisons are suitable for estimating abundance (Hillary et al., 2018; Waples and Feutry, 2022). However, they might be useful to recognize sweepstake reproductive events which occur in highly fecund populations when only a small number of parents contribute to the next cohort as most adults do not successfully reproduce (Christie, 2010; Vendrami et al., 2021). If the sibship incidence is very high, it might be an indication of an infeasible close-kin project (Bravington et al., 2014). In studies where cohorts are easily distinguishable (i.e. their size distribution barely overlaps), FSPs can also be used to compare known-same-cohort-individuals to study variability in length-at-age in the absence of age data (Bravington et al., 2019).
Analyses using HSPs are based on an offspring-centric view of relatedness that calculates the probability of two randomly chosen juveniles in a sample having the same parent. Although the HSPs themselves only involve juvenile fish, HSP-based CKMR still provides information only about adults (Bravington, 2014). HSPs can be the result of sharing either the mother (maternal HSP) or the father (paternal HSP) and discrimination among both can be achieved by analyzing the mitochondrial DNA (mtDNA), always inherited from the mother, of identified HSPs. The comparison of maternal and paternal HSP provides insights into differences in how fecundity varies with age between males and females, and on the sex ratio of adults (Davies et al., 2018; Thompson et al., 2020).
For some species such as sharks, characterized by a significantly different reproductive biology compared to teleosts with much lower fecundity, and often little lifetime change in fecundity after maturity, it is feasible to base CKMR analysis in HSPs alone. However, for teleosts is almost always necessary to include POPs as they enable disentangling the effects of increasing fecundity in adult life (Davies et al., 2015).
Including both types of kinship relationships, POPs and HSPs, is advisable whenever possible, as is more powerful than either one alone (Bravington et al., 2015). Additionally, provides more information on the population as it may allow estimating additional (adult) parameters (see next section). On the other hand, considering two kinship categories instead of one increases the probability of finding kin pairs. This results in an improvement of the statistical power, addressing one of the main limitations on CV (coefficient of variation) of CKMR estimates, leads to more robust CKMR modelling and lowers sample size requirements (Bravington et al., 2015).
The use of more distant kin relationships (half-first cousins or great uncles, for instance) would decrease further the demanding requirements of CKMR, in terms of number of samples. In the near future, it might become possible to assign reliably these more distant kin pairs, allowing their use in a CKMR framework, as long as their frequency of occurrence can be also predicted (Anderson, 2022).
3.3 Population parameters that can be estimated via CKMR
CKMR provides a fishery-independent tool for monitoring of adult or spawning stock biomass and key biological parameters of adult population dynamics relevant for the management of exploited populations. The experimental design, biology of the species and the ancillary data collected for the specimens (length, age, etc) determines the population parameters that can be estimated using this tool.
3.3.1 Abundance
Reliable estimations of population abundance are paramount for assessing the status and trends of exploited fish populations. The CKMR methodology provides estimates of recent absolute adult abundances (Nadult) based on kinship relationships (POPs and/or HSPs). POPs allow estimation of total adult abundance irrespective of an individual’s contribution to reproductive output while HSPs permit inference of the number of breeding adults (Bradford et al., 2018). Nonetheless, the incidence of siblings is also a widely-used method to estimate the unrelated genetic concept of effective population size (Ne) (Wang, 2009; Waples et al., 2018). Although both are underpinned by genetics, CKMR is based on mark-recapture principles rather than population genetics theory (Bravington and Grewe, 2007). Therefore, it is essential to identify conditions under which CKMR methods based on siblings estimate , when they estimate Ne, effective number of breeders per year (Nb) and when they estimate something else altogether. A key factor is whether the siblings are from the same or different cohorts. A good overview is provided by (Waples and Feutry, 2022).
The CKMR approach is also capable of detecting temporal trends in adult abundance when the time span of samples covers a sufficiently long period, which duration depends on the lifespan of the species (Bruce et al., 2018) and/or sufficient number of offspring cohorts are sampled.
3.3.2 Adult mortality rates
Mortality rates of fishes are also crucial inputs for stock assessments as they are directly related to the sustainable yield of a fishery. The estimation of adult mortality rates cannot rely alone on annual age and length compositions because of statistical confounding with fishery selectivity (Bravington et al., 2016a). CKMR studies based on POPs can provide additional relevant data about mortality as the average interval between juvenile birth and adult ‘recapture’ is negatively correlated with the adult mortality. Nonetheless, estimating adult mortality rate from POPs alone is not possible without auxiliary data on female fecundity, if fecundity varies through adult´s life, because the same reproductive output can be produced by a small number of high fecundity or a larger number of low-fecundity adults (Bravington et al., 2016a; Trenkel et al., 2022). CKMR studies based on HSPs over multiple cohorts permit a direct estimate of adult survival in species for which fecundity does not change across the lifespan, and in combination with catch data, can be used to separate natural from fishing mortality (Bravington et al., 2017; Rodriguez-Ezpeleta et al., 2020; Maunder et al., 2021). The presence of HSPs from different cohorts in a sample “marks” the shared parent and, at the same time, informs that the parent was alive at the time of birth of each sibling. The larger the age gap between the sibling cohorts, the longer the parent had to survive. As the difference in age increases, the rate of HSPs decreases and this rate of decline is related to adult survival. Nonetheless, data from HSPs alone is insufficient in teleosts as it does not provide any information of fecundity-size relationship (Figure 5). Variable fecundity-at-size (or age) implies that large specimens produce disproportionately more progeny than newly matured individuals and therefore have a higher probability of producing HSPs. In the absence of further data sources is not possible to disentangle mortality from the extent of such variation in fecundity from HSPs alone (Trenkel et al., 2022). Information on maturity at age might be sufficient for some teleost, for which is reasonable to assume a reproductive output proportional to age/size/weight (Maunder et al., 2021). However, in most fishes, an accurate estimation of adult mortality requires having both, POPs and HSPs together with length/age-compositions, to estimate how reproductive success changes with age and separate it from adult mortality (Maunder et al., 2021). In general, it is better to collect both, juveniles and adults, and estimate POPs and HSPs whenever possible.
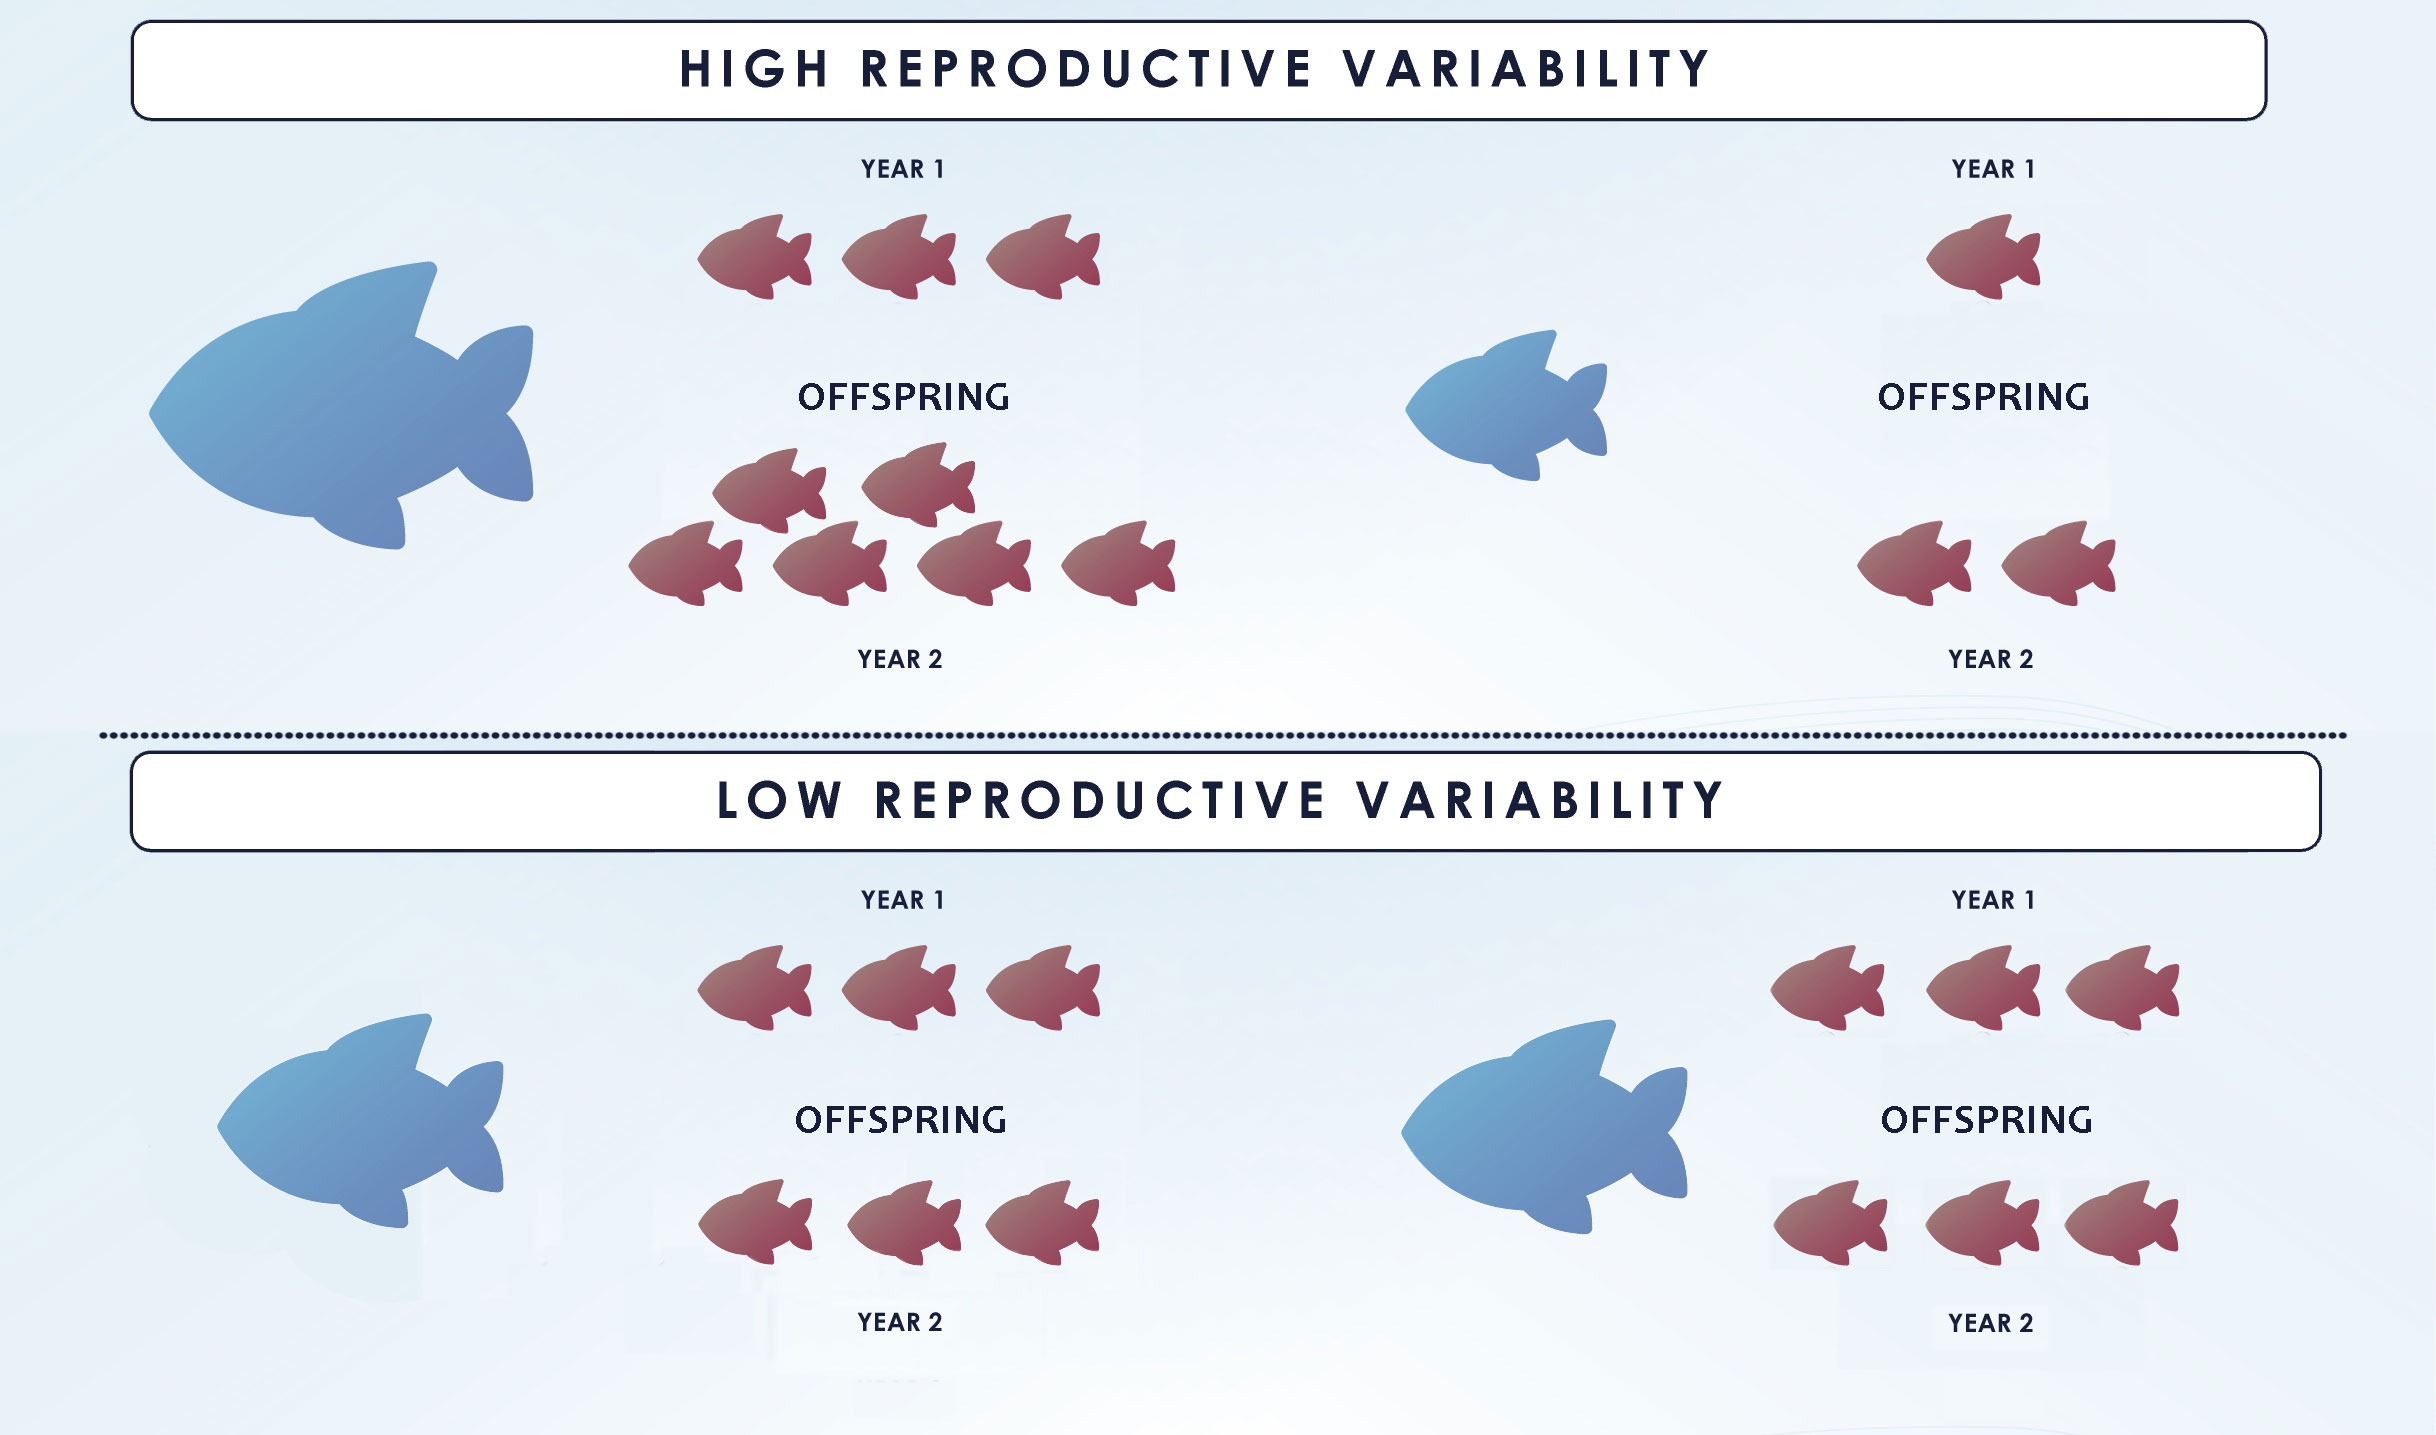
Figure 5 Impact of reproductive variability on HSP-based CKMR. Parents are represented in blue while offspring is coloured in red. The figure displays a variable fecundity scenario on top and a constant fecundity scenario below. The upper and lower sets of offspring within each scenario represent different cohorts. The upper scenario is by far more common in teleosts and entails a higher probability of producing HSPs for large individuals as they have disproportionately more progeny than newly matured fish. Figure redrawn from (Bravington et al., 2014).
3.3.3 Size-specific fecundity (when length data are available)
Knowledge of fish fecundity is required for estimating the stock reproductive potential, for understanding the relationship between adult or spawning stock biomass and recruitment and hence for building suitable statistical models for assessing sustainable catch levels (Pérez-Rodríguez et al., 2010).
Assuming that ancillary length and/or age data has been recorded and that fecundity depends on size/age, CKMR based on POPs can provide information on this parameter through the analysis of differences in numbers of POPs found among parents of different sizes/ages (Bravington et al., 2016a). Fecundity-at-size/age can be inferred by comparing the length/age distributions of adult females vs. identified mothers. Both distributions are similarly influenced by (i) selectivity; and (ii) total mortality but the latter is also weighted by fecundity-at-size/age (Bravington et al., 2016a). This is the main determinant of the reproductive output, which is higher in larger/older females that are tagged more often by the offspring, affecting the number of POPs (Bravington et al., 2016a). So, by “dividing” the two distributions, is possible to estimate relative fecundity-at-age (Davies et al., 2015).
Studies based on HSPs, on the contrary, are not useful to obtain any information on size-specific fecundity, because HSPs give no information on which adults were responsible for them.
3.3.4 Selectivity
Selectivity determines the probability of extraction of fish individuals and results in a specific distribution of fishing mortality across components of a population. The interpretation of kinship (the number of kinship pairs found, and their patterns with age and time) in a CKMR study is affected not just by adult abundance, mortality and fecundity, but also by the complication of adult selectivity.
On the one hand, as animals age, the chances of finding kinship diminishes at the mortality rate because the parent might die, and also diminishes at the population rate of increase because the proportion of non-Parents and non-Half-Siblings increases with time. On the other hand, when a juvenile is born, assuming that the parent does survive and is still around to be captured and/or to reproduce, for POP-based studies of teleosts, the parent becomes more catchable each year because of increasing selectivity with age. For HSPs-based studies, more half-sibs are available for capture each year, because the parent becomes more fecund over time. These trends in probability determine the mean time gap for POPs and for HSPs. The difference between the mean gaps for both types of kinship can be used to disentangle age-specific selectivity and fecundity (Bravington et al., 2015).
3.3.5 Other parameters
Throughout the CKMR literature, kin pair data has been also useful to provide qualitative information on several other parameters, which are normally not included in assessment models but are essential to assess population dynamics. Although CKMR has been mostly applied in single, well-mixed populations, it can also be useful within fragmented or different populations. Akita (2022) developed an extension of CKMR, based on POPs and HSPs, to estimate migration number or rate of adults between two populations in iteroparous species. The author formulates the probabilities of kinship pairs and provides two estimators that only require genetic data, as they are (approximately) independent of the reproductive potential. Information on animal movements and demographic connectivity can be alternatively obtained from the spatial distribution of close relatives (Delaval et al., 2022; Patterson et al., 2022). In addition, CKMR studies have the potential to provide insight into the breeding dynamics and the structure of a population (Feutry et al., 2017; Feutry et al., 2020; Patterson et al., 2022).
4 Case studies - from teleosts to elasmobranchs
The method of CKMR offers great promise for the estimation of population parameters often difficult to infer by other methodologies. Nonetheless, few practical applications of CKMR across aquatic animals have been published to date. Here, we provide an overview of the most important aspects highlighted by studies involving teleosts and elasmobranchs (skates, rays and sharks) (Table 1) and analyze their relevance in a framework of fisheries assessments.
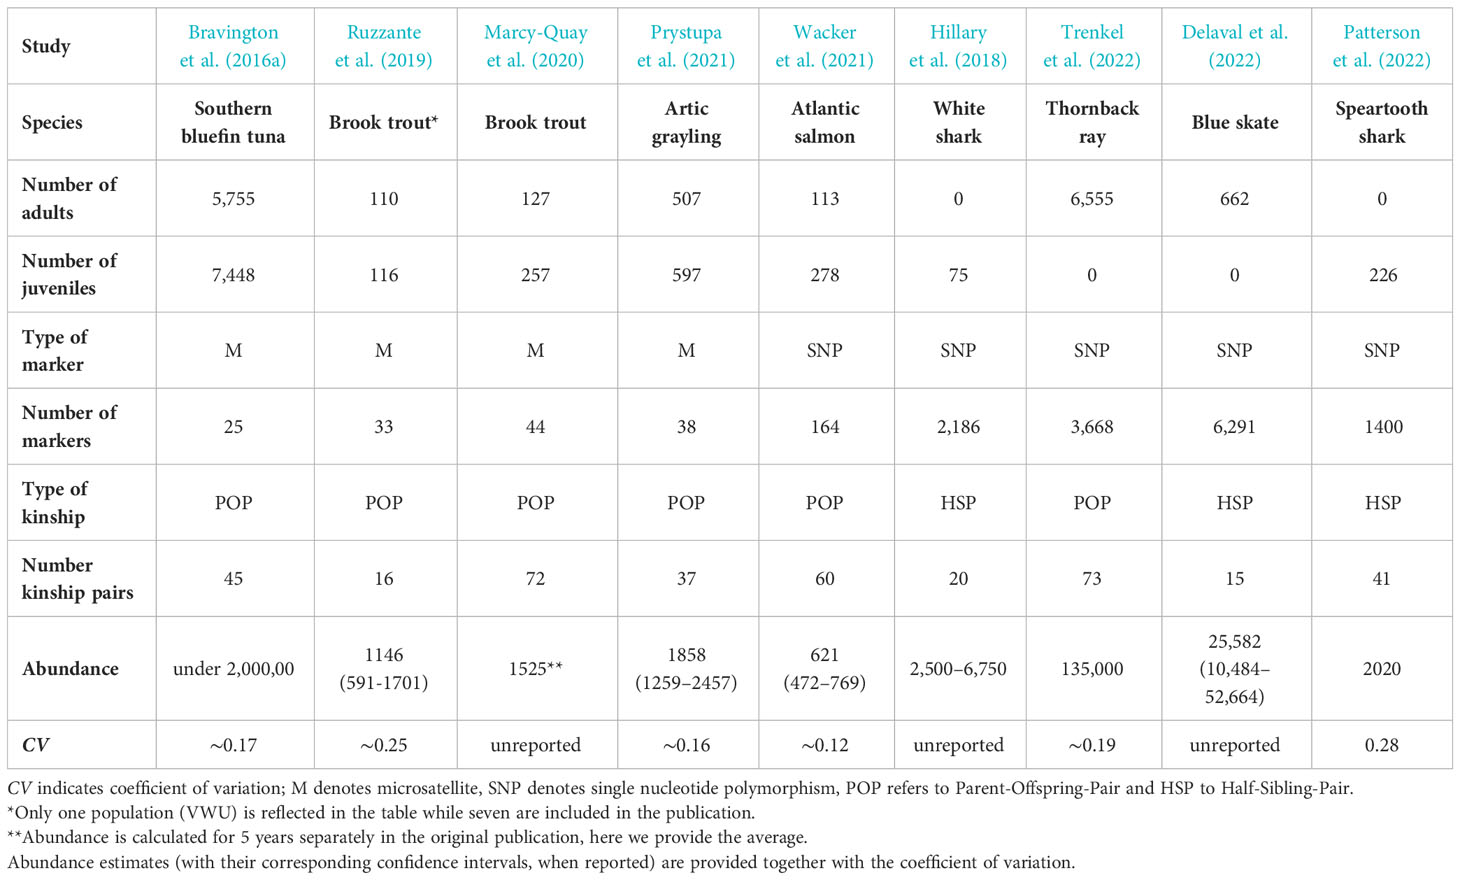
Table 1 Summary table of CKMR studies involving fish species published to date in peer-reviewed journals, detailing the number of juvenile and adult individuals, type and number of markers, type and number of kinship used in the study, the estimation of abundance reported and the corresponding coefficient of variation.
The first full application of the CKMR method was a study on the southern bluefin tuna (SBT), a heavily exploited marine species (FAO, 2022). This study, published in 2016, sparked great interests in the methodology (Bravington et al., 2016a). SBT fulfills a series of characteristics that facilitates the experimental design and sampling, making it an ideal target for close-kin studies. These, include an extensive biological knowledge of the species, absence of population structure, a single spawning site and availability of a large number of samples collected across several years. The stock is severely depleted after an intense exploitation for decades but a large uncertainty remains about its absolute abundance and the level of depletion of its reproductive component (Kolody et al., 2008; Kurota et al., 2010). Using CKMR, the authors assessed abundance of SBT, with 25 microsatellite markers that were used to genotype ~14,000 tissue samples of juvenile and adult tuna individuals. Kinship inference revealed 45 POPs that were subsequently used to infer absolute adult abundance and adult survival. Resulting estimates revealed a less depleted and more productive stock than previously suggested by traditional stock assessments. Interestingly, the methodology provided evidence of a strong nonlinear relationship between fecundity and weight. Big females have a much larger reproductive contribution than expected from their bodyweight, a highly relevant information for the productivity and resilience of the species, largely reported in the literature from life-history analyses and maternal effects (Green, 2008; Marshall, 2009). Thus, CKMR was able to provide an independent check of the assessment model in SBT, reducing the uncertainty and has been incorporated into current management procedures.
This CKMR study remains the more relevant in the context of fisheries assessments among those involving teleosts as most other applications to date have targeted much smaller populations. Ruzzante et al. (2019) analyzed seven populations of brook trout inhabiting coastal streams along the shore of Nova Scotia. These authors used in parallel CKMR and standard mark-recapture (MR) to compare their respective estimates of population abundance. Using 33 microsatellite markers, a number of POPs ranging from ≈8 to ≥ 50, depending on the population, were detected among 2,400 individuals. These kinship pairs were used to infer CKMR-derived abundances that proved to be statistically indistinguishable from those obtained by standard MR. This is the first study that validates CKMR estimates, but is important to emphasize that population structure and life history of this species is unusually simple. Moreover, confidence intervals of the estimations were wide in most populations, indicating the need of a significant increase of the sampling effort to achieve precision levels similar to those obtained for SBT (i.e., CV≈0.15) (Bravington et al., 2016a). Based on their results, the authors conclude that the method is unlikely to be applicable to stocks with tens of millions of individuals or larger due to the dependence of the sample size requirements on population size (Ruzzante et al., 2019). Another study of brook trout from the Honnedaga lake (New York) used 44 microsatellites to genotype 304 individuals, identifying 72 POPs that allowed the estimation of population abundance (Marcy-Quay et al., 2020). The authors compared the values obtained with abundance estimates from classical MR, finding a good agreement between both. The CKMR approach was also used to infer the abundance of the Arctic Grayling at the Lubbock system river in Yukon (Canada). A total of 967 specimens (split approximately equally between adults and juveniles), were collected and genotyped at 38 microsatellites, revealing 37 POPs that served to estimate adult population abundance with reasonable precision (CV ≈0.16) (Prystupa et al., 2021). In addition, Wacker et al. (2021) compared the estimates of spawner abundance of adult Atlantic salmon in a Norwegian river using three methods; conventional surveys, CKMR and CKMR combined with tagging. A total of 278 juveniles and 113 adults were genotyped at 164 SNP loci, revealing 80 POPs that allowed the estimation of CKMR abundances. CKMR estimates were considerably higher than those obtained in conventional surveys, and these, in turn, were smaller than those obtained by the combination of CKMR with tagging.
The results of these teleosts studies provide essential information for their management, however, they also highlight that most applications to date have targeted small populations inhabiting rivers, as this feature facilitates reaching the demanding requirements, in terms of sample sizes, needed to find relevant numbers of kinship pairs to produce estimates with reasonable precision. Also, most of these populations can be considered “closed” (low migration, high self-recruitment), making assumptions more straightforward. Furthermore, although few studies compare abundance estimates obtained from classical methods with those produced by CKMR, not all find a good agreement, highlighting the need for further studies to understand the biases that affect each of them.
The generally smaller population sizes of elasmobranchs compared to teleosts together with a poor conservation status and a lack of any abundance estimates affecting many species has made them also a frequent choice in CKMR studies. The first study that applied a CKMR framework to estimate the population of an elasmobranch targeted white sharks in eastern Australia and New Zealand (Hillary et al., 2018). This analysis was based solely on HSPs due to the unfeasibility of sampling adults in useful numbers. Genetic sampling of juveniles is easier as there are known aggregation sites. In this study, a total of 75 juveniles were genotyped using 2,186 SNPs, revealing 20 HSPs used to estimate population size. Kinship also served to produce estimates of adult survival rates and to inform of adult sex ratios. Despite the low precision of the results, acknowledged by the authors, mainly due to the small sample size and the limited range of sampled cohorts, the estimates obtained are highly valuable, given the lack of data for this population, as they provide crucial data for assessing its status. This data deficiency is common in elasmobranchs, with many populations considered severely depleted and endangered worldwide (Juan-Jordá et al., 2022), urging the application of methodologies like CKMR to assess their conservation status and protect them.
The abundance of the thornback ray in the Bay of Biscay was assessed by genotyping over 6,500 specimens using 3,668 SNPs. The analysis revealed 73 “usable” POPs and 431 FSPs that could not be considered for abundance calculations due to the lack of biological data (particularly, age) and the limited knowledge on population structure available for the species. The large number of specimens analyzed still permitted the estimation of adult abundance with reasonable precision (CV=0.19). The authors provide a good overview of practical lessons learned from the application of CKMR to their case study, worth to be considered by anyone intending to apply the CKMR method for abundance estimation (Trenkel et al., 2022).
A CKMR study of the blue skate in the Celtic Sea assessed its abundance using over 6,000 SNPs to genotype 662 specimens collected across four years (Delaval et al., 2022). The results revealed 15 cross-cohort half-sibling pairs while no POPs were detected, possibly due to a limitation in the number of cohorts sampled as samples mostly comprised young adults. The authors inferred abundance and annual adult survival rate but due to the small number of kinship pairs detected the estimates involved a large uncertainty. Interestingly, the authors compared the CKMR estimated abundance with CPUE-based estimates. Although the latter reflects the abundance of all the individuals in a population, not just the breeders, a good general agreement was found. Both approaches indicated a stable, possibly expanding population of blue skate in the Celtic Sea during the analyzed period.
Finally, Patterson et al. (2022) used CKMR to assess abundance and connectivity in a critically endangered euryhaline elasmobranch, the speartooth shark (Glyphis glyphis). The analysis involved only juveniles as finding mature individuals is extremely difficult, similarly to other elasmobranchs. With only three encounters of adults in over seven years in Australian waters, the abundance was unknown. A total of 226 juveniles collected in two Australian river systems across four years were genotyped using 1,400 SNPs revealing the presence of 21 and 41 full- and half-siblings, respectively. The authors also used information from the mitogenomes to determine whether the inferred HSPs share the mother or the father. These relationships served to calculate the total adult abundance of the whole population and at each river system but also to estimate other parameters, including sex-specific connectivity and annual survival as well as to infer several aspects of the reproductive dynamics of this critically endangered species. This study demonstrates that the method is capable of providing essential parameters in a short period of time for a long-lived species, even when the collection of auxiliary data (age) involved a substantial uncertainty (Patterson et al., 2022). Nonetheless, it also highlights a remarkable complication that derives from the difficulties in assigning age accurately in elasmobranchs, which often requires lethal sampling to obtain vertebral growth readings. As this is not possible for many protected species, the potential of sample collection is extremely reduced but the alternative non-lethal sampling entails a high uncertainty in cohort assignment that can significantly lower the number of usable kinship pairs. Thus, even when using a large number of markers for genotyping that allows the inclusion of second-degree relationships (HSP), lack of accurate biological ancillary data can undermine the power of a CKMR study. Nonetheless, these elasmobranch studies, also reveal the potential of the methodology for inferring abundance in species spanning a large variety of life-histories, even when sampling and background biological knowledge are scarce, conditional on the model being tailored to each species-specific characteristics (Rodriguez-Ezpeleta et al., 2020).
5 Discussion
Unbiased and precise estimates of demographic parameters are essential to ensure the sustainable exploitation of fish stocks. Reliable estimates of abundance and life history traits (e.g., fecundity, mortality) are central components of population models, but often extremely difficult to obtain, as they must rely on data that is often scarce and suffer from recognized biases (Bradshaw et al., 2007; Schmidt et al., 2015; Hoenig et al., 2016).
Close‐kin mark–recapture (CKMR) has recently emerged as a promising technique for estimating some of these parameters in animal populations from the frequency, and the distribution in space and time of kinship relationships observed in genetic samples (Davies et al., 2015). This alternative has potentially several advantages over traditional methods, such as the use of data from CPUE, scientific surveys or tagging experiments, as it does not suffer from many of the potential sources of bias affecting these (Rodriguez-Ezpeleta et al., 2020). CKMR can be applied to tissue samples from live or dead animals and although it could be theoretically used with any set of individuals that can be divided into “parents” and “juveniles, most applications have shown the importance of specimen´s ancillary data and sampling design considerations (e.g. Trenkel et al., 2022). Life histories of most species determines the coexistence of several cohorts for most fish stocks, requiring a precise assignment of the time of birth to take full advantage of the method. In some cases, accurate length estimates can be used for this purpose but most case studies highly benefit from accurate age information of the specimens (Coggins et al., 2013; Patterson et al., 2022). If age data is available, it becomes possible to extend the basic method (POPs) to more distant kinship (HSP) and use a short-term, cross-sectional sample of a population to produce reliable estimations, opposite to traditional methods that require decades-long datasets (Bravington et al., 2016b).
Therefore, CKMR might have the potential to become more informative, robust and cost-efficient than current methods for estimating demographic parameters. Nonetheless, the use of this new genetic tool in fisheries science is still in its infancy. The theory and promise of close‐kin analysis beyond the target species of CKMR studies published so far - mostly characterized by relatively small population sizes and high uncertainty in abundance estimation by traditional means - still needs to be demonstrated and validated by further studies (Friedman et al., 2022). In this regard, it is crucial to validate the method in stocks with good quality estimations of abundance based in well-established stock assessment models.
The method in its current form has several limitations. First, it is not suited to all fish populations as it relies on being able to differentiating parental and offspring generations and also requires the independent sampling of the different cohorts. To fulfill these requirements, knowledge of the biology of the species, especially life-history strategies and reproductive biology as well as of the patterns of social structure and habitat-use, is needed, but these parameters are unknown for a vast number of species.
Even when an in-deep biological knowledge is accessible, there are some aquatic organisms for which CKMR is unlikely to produce reliable estimations. These, include species with very long lifespans and those displaying semelparity or facultative parthenogenesis (Bravington et al., 2016b). The latest has been described in, at the minimum, six species of sharks and rays, which have shown the ability to reproduce asexually in the absence of males (hammerhead shark (Chapman et al., 2007), blacktip shark (Chapman et al., 2008), zebra shark (Robinson et al., 2011), bamboo shark (Feldheim et al., 2010), white tip reef shark (Portnoy et al., 2014), small tooth sawfish (Fields et al., 2015) and spotted eagle ray (Harmon et al., 2016)). Although it is unknown how frequently parthenogenesis occurs in elasmobranchs in the wild, it has been proposed to be facultative in situations where females have difficulty encountering suitable mates. As elasmobranchs numbers decline worldwide the difficulty of finding mates increases, possibly promoting parthenogenesis (Bernal et al., 2015). This should be taken into account when applying CKMR to this group of animals, preferentially targeted in the studies published so far due to their low population densities that are, in many cases, exacerbated by overexploitation (e.g. Hillary et al., 2018; Patterson et al., 2022). It is essential to pay special attention to low genetic diversity and significant homozygosity all across the genome in order to avoid wrong estimations of abundance with CKMR.
Nonetheless, the major drawback of the method affects generally all species and is linked to the number of samples required for the analysis, which is proportional to the square root of the true population abundance (Bravington et al., 2013; Bravington et al., 2014). In large populations, entails the collection of a substantial number of samples to ensure the detection of sufficient numbers of kinship pairs, implying high effort and high costs (Casey et al., 2016). A simulation exercise (ICES, 2017) estimated that, for a species with an estimated adult population of ~1.5 million individuals, a sample size of ~17 000 individuals and 70 POPs would be required to obtain reliable estimates of abundance (CV =10%). Many commercially relevant fish species exceed these abundances by several orders of magnitude and thus, adhering to these standards would be economically daunting even without considering the sampling costs (ICES, 2017). Super-abundant species, such as krill, would possibly never be a candidate for CKMR studies as they require colossal sample sizes, even taking into account that this number is proportional to rather than to Nadult itself (Bravington et al., 2016b). On the other hand, applying CKMR to very small populations would imply little cost but requires the collection of an impractically high fraction of the population to yield a useful number of kin pairs, particularly in marine ecosystems that are characterized by few physical barriers to dispersal (Bravington et al., 2016b).
The method has other important drawbacks for its application in the context of fisheries. CKMR is not able to provide precise estimates of abundance-at-age for the whole population, a required parameter to be used in age-structured stock assessment models, widely used to provide scientific advice in fisheries management. Another important limitation is that it provides information only for the adult component of the stock, as is not able to produce any estimates on recruitment or juvenile abundance. This prevents to forecast stock abundance at mid- and long-term. More importantly, the large economic and sampling requirements of CKMR are too demanding to produce annual estimates of stock abundance to be used in stock assessment models (irrespective of the models being age-structured or not) for most exploited species. In its current state, CKMR cannot replace the estimation of abundance based in research surveys and analytical stock assessment models. Another technical challenge is that close-kin mark-recapture analysis requires specialized knowledge that is usually outside of the experience of population geneticists who have the skills to generate and analyze the genetic data. Besides the population genetics knowledge, expertise in statistics and mathematics to develop statistical mark-recapture and population-dynamic models is considered essential to perform this type of studies (Ovenden et al., 2015; Bravington et al., 2016a). It is imperative to build bridges across these disciplines to promote advances in the methodology.
Despite the challenges, we believe that the method can bring enormous advancements to the field of fisheries management. We foresee several topics where CKMR may contribute importantly in scientific advice.
First, creating or modifying Biological Reference Points (BRP). These are standardized stock indicators used to compare stock status and inform fisheries managers about stock’s status relative to various management objectives. Therefore, they are key components in scientific advice and management as they establish limits - mostly based in mortality and/or biomass - above or below which stock sustainability is jeopardized. The estimation of BRPs is subject to important uncertainties very much depending on the model used to estimate them, but often leading to a loss of fishing yield to avoid the risk of overexploitation (Mildenberger et al., 2022). CKMR outputs, particularly abundance and mortality, should help in understanding how accurate are the defined BRPs, even if CKMR is not applied annually, and contribute to adjust current BRPs or to build new ones during stock benchmarking. For example, the first CKMR study on bluefin tuna (Bravington et al., 2016a) revealed a significantly higher abundance of adult abundance than that estimated by the Operating Model (OM) used to assess this stock. The method was subsequently implemented and has been used to observe trends in abundance in combination with other indexes based on surveys or fisheries CPUE. The abundance estimates from CKMR should allow to define a new BRP or modify the target reference points used in many stock assessments. This is a field that should be further explored and it is very much linked with the need of establishing dynamic reference points that cope with ecosystem changes (Berger, 2019).
Second, stock-recruitment relationship is a cornerstone in fisheries management. It is the basis to define some of the BRPs used in fisheries management and is also used to predict future recruitment and forecast stock abundance for different management options (catch projections). However, stock-recruitment relationships are normally poor, impeding the ability to predict recruitment. One of the reasons for this is the use of spawning stock biomass (SSB), which does not consider variations in the stock reproductive potential (Saborido-Rey and Trippel, 2013) and specifically patterns of variation in individual reproductive success, i.e. the probability that an adult will produce offspring (recruitment) differs within and across-years. CKMR based on HSPs can inform about the effective number of breeders per year, Nb (Waples and Feutry, 2022), and has the potential to improve stock-recruitment relationships, especially when combined with CKMR adult abundance estimations. Although the importance of Nb in fisheries management has been diminished (Hillary et al., 2018), it is actually a relevant parameter.
Finally, there is a range of situations where CKMR estimations of abundance can be very valuable. For many populations, bottom trawl research surveys are not able to provide realistic estimates of abundance due to low catchability, either because of low abundance, or to low/null accessibility (e.g. coastal and littoral species, species inhabiting rocky areas, river streams or vulnerable ecosystems). The vast majority of these are data-limited stocks that lack complex stock assessments or forecasts (Rosenberg et al., 2014). The stock size of many pelagic species is assessed based on acoustic surveys, which still contain uncertainty in spite of the huge advances in technology. CKMR may contribute to reduce uncertainty, although the size of some stocks (especially small pelagic stocks like sardines, anchovies, herrings, mackerels) would require extremely large sample sizes. However, for widely distributed stocks (redfishes, i.e. Atlantic Sebastes spp.), or large pelagic fish stocks (sharks, tunas, billfishes) the application of CKMR seems to be more feasible and might provide valuable information as estimations of abundance by traditional research surveys are limited. The method has the potential to offer as well a better understanding of stocks productivity, the relative importance of different age classes to total stock reproductive potential of stocks and more generally, a better understanding of the biology of exploited species (e.g. Bravington et al., 2016a, Patterson et al., 2022). Moreover, CKMR can also inform about parameters often ignored in stock assessments, like connectivity and migration in iteroparous species (Akita, 2022; Patterson et al., 2022). This information is normally not included due to the lack of data but can lead to biased estimates of population parameters (Van Beveren et al., 2019) and is essential to understand population dynamics as well as to identify appropriate management units (Goethel et al., 2012).
The major impediment on the application of CKMR outputs as stock indicators is still the quantification of the uncertainty and its impact in scientific advice and the subsequent management options that can easily lead to stock overexploitation. However, in stocks where there is lack of data to build proper stock indicators (as BRPs), CKMR outputs may provide valuable information for stock benchmarking if used with caution.
Integrating the collection of tissues (finclips) for genetic analysis into the regular scientific fisheries surveys has little cost, and would be a framework that provides, at the same time, the specimen´s biological information (e.g.: age from the otoliths, sex or maturity stage) needed for the application of CKMR. Pilot studies could start in parallel with regular assessments to maintain the long time-series datasets and facilitate validation of the CKMR methodology. The implementation of CKMR into assessment programs will clearly depend on its capacity to reduce uncertainty and contribute to establishing or modifying BRPs but its potential uptake would also be promoted if fisheries scientist become familiar with the methodology. Finally, CKMR can be crucial to determine the status of data-limited stocks since a single CKMR study can be adequate to estimate abundance and other population parameters. If an appropriate sampling scheme can be maintained over time, the time series of abundance could be used to establish harvest rates in species that lack a full stock assessment (Maunder et al., 2021).
Author’s note
The information and views set out in this manuscript are based on scientific data and information collected under Service Contract “Improving cost-efficiency of fisheries research surveys and fish stocks assessments using next-generation genetic sequencing methods EMFF/2018/015” signed with the European Climate, Infrastructure and Environment Executive Agency CINEA and funded by the European Union. The information and views set out in this publication are those of the authors and do not necessarily reflect the official opinion of CINEA or of the European Commission. Neither CINEA nor the European Commission can guarantee the accuracy of the scientific data/information collected under the above Specific Contract or the data/information included in this publication. Neither CINEA nor the European Commission or any person acting on their behalf may be held responsible for the use which may be made of the information contained therein.
Author contributions
All authors contributed to the article and approved the submitted version.
Funding
The information and views set out in this manuscript are based on scientific data and information collected under Service Contract “Improving cost-efficiency of fisheries research surveys and fish stocks assessments using next-generation genetic sequencing methods [EMFF/2018/015]” signed with the European Climate, Infrastructure and Environment Executive Agency (CINEA) and funded by the European Union.
Acknowledgments
The authors would like to express their gratitude to Gary Carvalho, Laszlo Orban and Allan Tucker for their advice and expert revision of the State of the Art review in which this manuscript is based on. We would also wish to thank the reviewers for their critical reading of the manuscript, as their inputs have led to significant improvements.
Conflict of interest
The authors declare that the research was conducted in the absence of any commercial or financial relationships that could be construed as a potential conflict of interest.
Publisher’s note
All claims expressed in this article are solely those of the authors and do not necessarily represent those of their affiliated organizations, or those of the publisher, the editors and the reviewers. Any product that may be evaluated in this article, or claim that may be made by its manufacturer, is not guaranteed or endorsed by the publisher.
References
Akita T. (2022). Estimating contemporary migration numbers of adults based on kinship relationships in iteroparous species. Mol. Ecol. Resour. 22, 3006–3017. doi: 10.1111/1755-0998.13682
Alonso-Fernández A., Otero J., Bañón R., Campelos J. M., Santos J., Mucientes G. (2017). Sex ratio variation in an exploited population of common octopus: ontogenic shifts and spatio-temporal dynamics. Hydrobiologia 794, 1–16. doi: 10.1007/s10750-016-3065-3
Anderson E. C. (2022). CKMRpop: forward-in-time simulation and tabulation of pairwise kin relationships in age-structured populations. Mol. Ecol. Resour. 22, 1190–1199. doi: 10.1111/1755-0998.13513
Anderson D. M., Gillooly J. F. (2021). Evaluating the tradeoff between offspring number and survivorship across fishes, amphibians, reptiles and mammals. Oikos 130, 798–807. doi: 10.1111/oik.07569
Andrews A. H., Tracey D. M., Dunn M. R. (2009). Lead–radium dating of orange roughy (Hoplostethus atlanticus): validation of a centenarian life span. Can. J. Fish. Aquat. Sci. 66, 1130–1140. doi: 10.1139/F09-059
Barry P., Broquet T., Gagnaire P. (2022). Age-specific survivorship and fecundity shape genetic diversity in marine fishes. Evol. Lett. 6, 46–62. doi: 10.1002/evl3.265
Bayona-Vásquez N. J., Glenn T. C., Kieran T. J., Pierson T. W., Hoffberg S. L., Scott P. A., et al. (2019). Adapterama III: quadruple-indexed, double/triple-enzyme RADseq libraries (2RAD/3RAD). PeerJ 7, e7724. doi: 10.7717/peerj.7724
Berger A. M. (2019). Character of temporal variability in stock productivity influences the utility of dynamic reference points. Fish. Res. 217, 185–197. doi: 10.1016/j.fishres.2018.11.028
Bernal M. A., Sinai N. L., Rocha C., Gaither M. R., Dunker F., Rocha L. A. (2015). Long-term sperm storage in the brownbanded bamboo shark chiloscyllium punctatum. J. Fish Biol. 86, 1171–1176. doi: 10.1111/jfb.12606
Bradford R. W., Thomson R., Bravington M., Foote D., Gunasekera R., Bruce B. D., et al. (2018). A close-kin mark-recapture estimate the population size and trend of east coast grey nurse shark. Rep. to Natl. Environ. Sci. Program, Mar. Biodivers. Hub. CSIRO Ocean. Atmos, Hobart, Australia. 44pp. doi: 10.13140/RG.2.2.26338.58560
Bradshaw C. J. A., Mollet H. F., Meekan M. G. (2007). Inferring population trends for the world’s largest fish from mark-recapture estimates of survival. J. Anim. Ecol. 76, 480–489. doi: 10.1111/j.1365-2656.2006.01201.x
Bravington M. V. (2014). Close-kin mark-recapture for SBT: options for the longer term. Consult. Rep. CCSBT. CSIRO Ocean. Atmos, Hobart, Australia. 28pp. Available at: https://www.ccsbt.org/system/files/ESC22_BGD12_CCSBT_CkgSBT_LongTerm_Rev1.pdf.
Bravington M. (2019). Shortfin mako sharks in the Atlantic: outline design for close-kin mark-recapture.
Bravington M. V., Eveson J. P., Grewe P. M., Davies C. R. (2015). SBT close-kin mark-recapture: options for the medium term. Contract Rep. CCSBT. CSIRO Ocean. Atmos, Hobart, Australia. 38pp. Available at: https://www.ccsbt.org/system/files/resource/en/55c99097e8e7b/ESC20_19_CCSBT_SBTCKMR_LongTerm_2015.pdf.
Bravington M. V., Eveson J. P., Grewe P. M., Davies C. R. (2017). SBT close-kin mark-recapture with parent-offspring and half-sibling pairs: update on genotyping, kin-finding and model development. CSIRO CCSBT-ESC/ 29pp. Available at: https://www.ccsbt.org/system/files/ESC22_12_AU_CKMR_POP_HSP.pdf
Bravington M., Feutry P., Pillans R. D., Hillary R., Johnson G., Saunders T., et al. (2019). Close-kin mark-recapture population size estimate of Glyphis garricki in the Northern Territory. Rep. to Natl. Environ. Sci. Program Mar. Biodiversity Hub. CSIRO Oceans & Atmosphere, Hobart. 31 pp. Available at: https://www.nespmarine.edu.au/system/files/Bravingtonetal_GlyphisgarrickiCKMRpopulationestimate_FINAL_4Dec19.pdf.
Bravington M. V., Grewe J. P. (2007). A method for estimating the absolute spawning stock size of SBT, using close-kin genetics. CCSBT-ESC/0709/18. CSIRO, Hobart, Australia. 25pp. Available at: https://www.ccsbt.org/ja/system/files/resource/ja/4d93fe45b53f2/18.pdf.
Bravington M., Grewe. P., Davies C. (2012). Report of the close-kin project: estimating the absolute spawning stock size of SBT using genetics. CCSBT-ESC/1208/19. CSIRO, Hobart, Australia. 39pp. Available at: https://www.ccsbt.org/system/files/resource/ja/502c7824304e8/ESC17_19-_AU_Close_kin.pdf.
Bravington M., Grewe P., Davies C. (2013). Available at: https://www.ccsbt.org/system/files/resource/ja/521ebb122ae21/ESC18_BGD03_Australia_Close_kin.pdf.
Bravington M. V., Grewe P. G., Davies C. R. (2014). “Fishery-independent estimate of spawning biomass of southern bluefin tuna through identification of close-kin using genetic markers,” in FRDC report 2007/034 (CSIRO, Australia), 147pp. Available at: https://www.researchgate.net/publication/261835492_Fishery-independent_estimate_of_spawning_biomass_of_Southern_Bluefin_Tuna_through_identification_of_close-kin_using_genetic_markers
Bravington M. V., Grewe P. M., Davies C. R. (2016a). Absolute abundance of southern bluefin tuna estimated by close-kin mark-recapture. Nat. Commun. 7, 1–8. doi: 10.1038/ncomms13162
Bravington M. V., Skaug H. J., Anderson E. C. (2016b). Close-kin mark-recapture. Stat. Sci. 31, 259–274. doi: 10.1214/16-STS552
Bruce B., Bradford R., Bravington M., Feutry P., Grewe P., Gunasekera R., et al. (2018). “A national assessment of the status of white sharks,” in National environmental science programme (Marine Biodiversity Hub, CSIRO, Australia), 64pp. Available at: https://www.nespmarine.edu.au/system/files/NESP-A3-A_national_assessment_of_the_status_of_white_sharks_Feb_2018.pdf.
Carroll E. L., Bruford M. W., DeWoody J. A., Leroy G., Strand A., Waits L., et al. (2018). Genetic and genomic monitoring with minimally invasive sampling methods. Evol. Appl. 11, 1094–1119. doi: 10.1111/eva.12600
Casey J., Jardim E., Martinsohn J. T. (2016). The role of genetics in fisheries management under the E.U. common fisheries policy. J. Fish Biol. 89, 2755–2767. doi: 10.1111/jfb.13151
Chapman D. D., Firchau B., Shivji M. S. (2008). Parthenogenesis in a large-bodied requiem shark, the blacktip carcharhinus limbatus. J. Fish Biol. 73, 1473–1477. doi: 10.1111/j.1095-8649.2008.02018.x
Chapman D. D., Shivji M. S., Louis E., Sommer J., Fletcher H., Prodöhl P. A. (2007). Virgin birth in a hammerhead shark. Biol. Lett. 3, 425–427. doi: 10.1098/rsbl.2007.0189
Cheminée A., Le Direach L., Rouanet E., Astruch P., Goujard A., Blanfuné A., et al. (2021). All shallow coastal habitats matter as nurseries for Mediterranean juvenile fish. Sci. Rep. 11, 14631. doi: 10.1038/s41598-021-93557-2
Christie M. R. (2010). Parentage in natural populations: novel methods to detect parent-offspring pairs in large data sets. Mol. Ecol. Resour. 10, 115–128. doi: 10.1111/j.1755-0998.2009.02687.x
Coggins L. G., Gwinn D. C., Allen M. S. (2013). Evaluation of age–length key sample sizes required to estimate fish total mortality and growth. Trans. Am. Fish. Soc 142, 832–840. doi: 10.1080/00028487.2013.768550
Conn P. B., Bravington M. V., Baylis S., Ver Hoef J. M. (2020). Robustness of close-kin mark–recapture estimators to dispersal limitation and spatially varying sampling probabilities. Ecol. Evol. 10, 5558–5569. doi: 10.1002/ece3.6296
Davies C. R., Bravington M. V., Eveson J. P., Lansdell M., Aulich J., Grewe P. M. (2020). “Next-generation close-kin mark recapture: using SNPs to identify half- sibling pairs in southern bluefin tuna and estimate abundance, mortality and selectivity,” in FRDC project no 2016-044 (CSIRO Australia, Australia), 63pp. Available at: https://www.frdc.com.au/sites/default/files/products/2016-044-DLD.pdf.
Davies C. R., Bravington M. V., Grewe P. D., Eveson P. J., Lansdell M., Hill P., et al. (2018) Close-kin project report. Available at: https://www.ccsbt.org/ja/system/files/ESC23_14_AU_CloseKinProjectReport_0.pdf.
Davies C., Bravington M. V., Thomson R. (2015). Advice on close-kin mark-recapture for estimating abundance of eastern Atlantic blue n tuna: a scoping study. GBYP 07c/201. CSIRO, Hobart, Australia. 34pp. Available at: https://www.iccat.int/GBYP/Docs/Close_Kin_Mark_Recapture_Phase_6_Scoping_Study.pdf
Delaval A., Bendall V., Hetherington S. J., Skaug H. J., Frost M., Jones C. S., et al. (2022). Evaluating the suitability of close-kin mark-recapture as a demographic modelling tool for a critically endangered elasmobranch population. Evol. Appl. 16(2):461–473. doi: 10.1111/eva.13474
de Pontual H., Groison A. L., Piñeiro C., Bertignac M. (2006). Evidence of underestimation of European hake growth in the bay of Biscay, and its relationship with bias in the agreed method of age estimation. ICES J. Mar. Sci. 63, 1674–1681. doi: 10.1016/j.icesjms.2006.07.007
FAO. (2022). The State of World Fisheries and Aquaculture 2022. Towards Blue Transformation. Rome, FAO. doi: 10.4060/cc0461en
Feldheim K. A., Chapman D. D., Sweet D., Fitzpatrick S., Prodohl P. A., Shivji M. S., et al. (2010). Shark virgin birth produces multiple, viable offspring. J. Hered. 101, 374–377. doi: 10.1093/jhered/esp129
Feutry P., Berry O., Kyne P. M., Pillans R. D., Hillary R. M., Grewe P. M., et al. (2017). Inferring contemporary and historical genetic connectivity from juveniles. Mol. Ecol. 26, 444–456. doi: 10.1111/mec.13929
Feutry P., Devloo-Delva F., Tran Lu Y A., Mona S., Gunasekera R. M., Johnson G., et al. (2020). One panel to rule them all: DArTcap genotyping for population structure, historical demography, and kinship analyses, and its application to a threatened shark. Mol. Ecol. Resour. 20, 1470–1485. doi: 10.1111/1755-0998.13204
Fields A. T., Feldheim K. A., Poulakis G. R., Chapman D. D. (2015). Facultative parthenogenesis in a critically endangered wild vertebrate. Curr. Biol. 25, R446–R447. doi: 10.1016/j.cub.2015.04.018
Flanagan S. P., Jones A. G. (2019). The future of parentage analysis: from microsatellites to SNPs and beyond. Mol. Ecol. 28, 544–567. doi: 10.1111/mec.14988
Friedman K. J., Bartley D. M., Rodríguez-Ezpeleta N., Mair G. C., Ban N., Beveridge M., et al. (2022). Current and future genetic technologies for fisheries and aquaculture: implications for the work of FAO (Rome: FAO). doi: 10.4060/cc1236en
Goethel D. R., Kerr L. A., Cadrin S. X. (2012). Incorporating spatial population structure in stock assessment models of marine species. ICES CM 2012/N:03, Bergen, Norway, 14pp. Available at: http://ices.dk/sites/pub/CMDoccuments/CM-2012/N/N0312.pdf.
Green B. S. (2008). Maternal effects in fish populations. Adv. Mar. Biol. 54, 1–105. doi: 10.1016/S0065-2881(08)00001-1
Harmon T. S., Kamerman T. Y., Corwin A. L., Sellas A. B. (2016). Consecutive parthenogenetic births in a spotted eagle ray aetobatus narinari. J. Fish Biol. 88, 741–745. doi: 10.1111/jfb.12819
Hillary R. M., Bravington M. V., Patterson T. A., Grewe P., Bradford R., Feutry P., et al. (2018). Genetic relatedness reveals total population size of white sharks in eastern Australia and new Zealand. Sci. Rep. 8, 2661. doi: 10.1038/s41598-018-20593-w
Hoenig J. M., Then A. Y.-H., Babcock E. A., Hall N. G., Hewitt D. A., Hesp S. A. (2016). The logic of comparative life history studies for estimating key parameters, with a focus on natural mortality rate. ICES J. Mar. Sci. J. du Cons. 73, 2453–2467. doi: 10.1093/icesjms/fsw089
Hoffmayer E. R., McKinney J. A., Franks J. S., Hendon J. M., Driggers W. B., Falterman B. J., et al. (2021). Seasonal occurrence, horizontal movements, and habitat use patterns of whale sharks (Rhincodon typus) in the gulf of Mexico. Front. Mar. Sci. 7. doi: 10.3389/fmars.2020.598515
Huisman J. (2017). Pedigree reconstruction from SNP data: parentage assignment, sibship clustering and beyond. Mol. Ecol. Resour. 17, 1009–1024. doi: 10.1111/1755-0998.12665
ICES (2016). Interim report of the working group on application of genetics in fisheries and mariculture (WGAGFM), 11–13 May 2016, Belfast, UK. ICES CM2016/SSGEPI:15. 41 pp. Available at: https://ices-library.figshare.com/ndownloader/files/33392261.
ICES (2017). Report of the working group on the application of genetics in fisheries and mariculture (WGAGFM), 2–5 May 2017, Olhão, Portugal. ICES CM 2017/SSGEPI:13. 75 pp. Available at: https://ices-library.figshare.com/ndownloader/files/33393416
Juan-Jordá M. J., Murua H., Arrizabalaga H., Merino G., Pacoureau N., Dulvy N. K. (2022). Seventy years of tunas, billfishes, and sharks as sentinels of global ocean health. Science, 378(6620):eabj0211. doi: 10.1126/science.abj0211
Kindsvater H. K., Mangel M., Reynolds J. D., Dulvy N. K. (2016). Ten principles from evolutionary ecology essential for effective marine conservation. Ecol. Evol. 6, 2125–2138. doi: 10.1002/ece3.2012
Kolody D., Polacheck T., Basson M., Davies C. (2008). Salvaged pearls: lessons learned from a floundering attempt to develop a management procedure for southern bluefin tuna. Fish. Res. 94, 339–350. doi: 10.1016/j.fishres.2008.08.016
Kurota H., Hiramatsu K., Takahashi N., Shono H., Itoh T., Tsuji S. (2010). Developing a management procedure robust to uncertainty for southern bluefin tuna: a somewhat frustrating struggle to bridge the gap between ideals and reality. Popul. Ecol. 52, 359–372. doi: 10.1007/s10144-010-0201-1
Lowerre-Barbieri S. K. (2009). “Reproduction in relation to conservation and exploitation of marine fishes,” in Reproductive biology and phylogeny of fishes (Agnathans and bony fishes) Science Publishers, Enfield, CT. Ed. Jamieson B. G. M. (CRC Press), 371–394. doi: 10.13140/2.1.2048.0643
Marcy-Quay B., Sethi S. A., Therkildsen N. O., Kraft C. E. (2020). Expanding the feasibility of fish and wildlife assessments with close-kin mark–recapture. Ecosphere 11(10):e03259. doi: 10.1002/ecs2.3259
Marshall C. T. (2009). “Mplementing information on stock reproductive potential in fisheries management: the motivation, challenges and opportunities,” in Fish reproductive biology: implications for assessment and management. Eds. Jakobsen T., Fogarty M. J., Megrey B. A., Moksness E. (Oxford, UK: Wiley-Blackwell), 395–420. doi: 10.1002/9781444312133.ch11
Marshall D. J., Bode M., Mangel M., Arlinghaus R., Dick E. J. (2021). Reproductive hyperallometry and managing the world’s fisheries. Proc. Natl. Acad. Sci. U. S. A. 118, e2100695118. doi: 10.1073/PNAS.2100695118
Maunder M. N., Lennert-Cody C. E., Aires-da-Silva A. M., Xu H. (2021) Considerations for conducting close kin mark recapture of stocks managed by the IATCC. Available at: https://www.iattc.org/GetAttachment/ddc8410e-4de7-401c-87a9-73fb33090f23/SAC-12-14_Considerations-for-conducting-Close-Kin-Mark-Recapture-of-stocks-managed-by-IATTC.pdf.
Maunder M. N., Piner K. R. (2015). Contemporary fisheries stock assessment: many issues still remain. ICES J. Mar. Sci. 72, 7–18. doi: 10.1093/icesjms/fsu015
McDowell J. R., Bravington M., Grewe P. M., Lauretta M., Walter J. F., Baylis S. M., et al. (2022). Low levels of sibship encourage use of larvae in western Atlantic bluefin tuna abundance estimation by close-kin mark-recapture. Sci. Rep. 12, 18606. doi: 10.1038/s41598-022-20862-9
Mildenberger T. K., Berg C. W., Kokkalis A., Hordyk A. R., Wetzel C., Jacobsen N. S., et al. (2022). Implementing the precautionary approach into fisheries management: biomass reference points and uncertainty buffers. Fish Fish. 23, 73–92. doi: 10.1111/faf.12599
Mucientes G. R., Queiroz N., Sousa L. L., Tarroso P., Sims D. W. (2009). Sexual segregation of pelagic sharks and the potential threat from fisheries. Biol. Lett. 5, 156–159. doi: 10.1098/rsbl.2008.0761
Murua H., Saborido-Rey F. (2003). Female reproductive strategies of marine fish species of the north Atlantic. J. Northwest Atl. Fish. Sci. 33, 23–31. doi: 10.2960/J.v33.a2
Nielsen R., Mattila D. K., Clapham P. J., Palsbøll P. J. (2001). Statistical approaches to paternity analysis in natural populations and applications to the north Atlantic humpback whale. Genetics 157, 1673–1682. doi: 10.1093/genetics/157.4.1673
Ovenden J. R., Berry O., Welch D. J., Buckworth R. C., Dichmont C. M. (2015). Ocean’s eleven: a critical evaluation of the role of population, evolutionary and molecular genetics in the management of wild fisheries. Fish Fish. 16, 125–159. doi: 10.1111/faf.12052
Patterson T. A., Hillary R. M., Kyne P. M., Pillans R. D., Gunasekera R. M., Marthick J. R., et al. (2022). Rapid assessment of adult abundance and demographic connectivity from juvenile kin pairs in a critically endangered species. Sci. Adv. 8(51):eadd1679. doi: 10.1126/sciadv.add1679
Pérez-Rodríguez A., Morgan M., Rideout R., Domínguez-Petit R., Saborido-Rey F. (2010). Study of the relationship between total egg production, female spawning stock biomass, and recruitment of Flemish cap cod (Gadus morhua). Cienc. Mar. 37, 675–687. doi: 10.7773/cm.v37i4B.1785
Pennino M. G., Conesa D., López-Quílez A., Muñoz F., Fernández A., Bellido J. M. (2016). Fishery-dependent and -independent data lead to consistent estimations of essential habitats. ICES J Mar Sci 73, 2302–2310. doi: 10.1093/icesjms/fsw062
Portnoy D. S., Hollenbeck C. M., Johnston J. S., Casman H. M., Gold J. R. (2014). Parthenogenesis in a whitetip reef shark triaenodon obesus involves a reduction in ploidy. J. Fish Biol. 85, 502–508. doi: 10.1111/jfb.12415
Prystupa S., McCracken G. R., Perry R., Ruzzante D. E. (2021). Population abundance in arctic grayling using genetics and close-kin mark-recapture. Ecol. Evol. 11, 4763–4773. doi: 10.1002/ece3.7378
Qiao Y., Sannerud J. G., Basu-Roy S., Hayward C., Williams A. L. (2021). Distinguishing pedigree relationships via multi-way identity by descent sharing and sex-specific genetic maps. Am. J. Hum. Genet. 108, 68–83. doi: 10.1016/j.ajhg.2020.12.004
Ramírez-Macías D., Queiroz N., Pierce S. J., Humphries N. E., Sims D. W., Brunnschweiler J. M. (2017). Oceanic adults, coastal juveniles: tracking the habitat use of whale sharks off the pacific coast of Mexico. PeerJ 5, e3271. doi: 10.7717/peerj.3271
Robinson D. P., Baverstock W., Al-Jaru A., Hyland K., Khazanehdari K. A. (2011). Annually recurring parthenogenesis in a zebra shark stegostoma fasciatum. J. Fish Biol. 79, 1376–1382. doi: 10.1111/j.1095-8649.2011.03110.x
Rodriguez-Ezpeleta N., Patterson T. A., Pereda I., Grande M., Davies C. R., Lezama-Ochoa N., et al. (2020). Feasibility study on applying close-kin mark recapture abundance estimates to Indian ocean tuna commission shark species. Final Report to IOTC. San Sebastian, Spain: AZTI; 2020. csiro:EP2022-2718. Available at: http://hdl.handle.net/102.100.100/442298?index=1
Rosenberg A. A., Fogarty M. J., Cooper A. B., Dickey-Collas M., Fulton E. A., Gutiérrez N. L., et al. (2014). “Developing new approaches to global stock status assessment and fishery production potential of the seas,” in FAO Fisheries and Aquaculture Circular No. 1086(Rome: FAO). Available at: http://www.fao.org/fi/oldsite/eims_search/1_dett.asp?calling=simple_s_result&lang=en&pub_id=314932.
Ruzzante D. E., McCracken G. R., Førland B., MacMillan J., Notte D., Buhariwalla C., et al. (2019). Validation of close-kin mark–recapture (CKMR) methods for estimating population abundance. Methods Ecol. Evol. 10, 1445–1453. doi: 10.1111/2041-210X.13243
Saborido-Rey F., Kjesbu O. S. (2005). Growth and maturation dynamics (CSIC), 26pp. Available at: http://hdl.handle.net/10261/47150.
Saborido-Rey F., Trippel E. A. (2013). Fish reproduction and fisheries. Fish. Res. 138, 1–4. doi: 10.1016/j.fishres.2012.11.003
Schmidt J. H., Johnson D. S., Lindberg M. S., Adams L. G. (2015). Estimating demographic parameters using a combination of known-fate and open n -mixture models. Ecology 96, 2583–2589. doi: 10.1890/15-0385.1
Seber G. A. F., Schofield M. R. (2019). “Tagging methods and tag loss,” in Capture-recapture: parameter estimation for open animal populations. Statistics for Biology and Health (Cham: Springer), 13–37. doi: 10.1007/978-3-030-18187-1_2
Selwyn J. D., Hogan J. D., Downey-Wall A. M., Gurski L. M., Portnoy D. S., Heath D. D. (2016). Kin-aggregations explain chaotic genetic patchiness, a commonly observed genetic pattern, in a marine fish. PloS One 11, e0153381. doi: 10.1371/journal.pone.0153381
Skaug H. J. (2001). Allele-sharing methods for estimation of population size. Biometrics 57, 750–756. doi: 10.1111/j.0006-341X.2001.00750.x
Städele V., Vigilant L. (2016). Strategies for determining kinship in wild populations using genetic data. Ecol. Evol. 6, 6107–6120. doi: 10.1002/ece3.2346
Stamatopoulos C. (2002). “Sample-based fishery surveys,” in A technical handbook (FAO Fisheries Technical Paper) 425. Available at: http://www.fao.org/documents/card/en/c/b8a043cb-4537-5ce6-bc9f-14fe84d689df/.
Swain D. P. (2011). Life-history evolution and elevated natural mortality in a population of Atlantic cod ( gadus morhua ). Evol. Appl. 4, 18–29. doi: 10.1111/j.1752-4571.2010.00128.x
Thompson R. B., Bravington M. V., Feutry P., Gunasekera R., Grewe P. (2020) Close kin mark recapture for school shark in the SESSF. Available at: https://www.frdc.com.au/sites/default/files/products/2014-024-DLD.pdf.
Trenkel V. M., Charrier G., Lorance P., Bravington M. V. (2022). Close-kin mark–recapture abundance estimation: practical insights and lessons learned. ICES J. Mar. Sci. 79, 413–422. doi: 10.1093/icesjms/fsac002
Van Beveren E., Duplisea D. E., Brosset P., Castonguay M. (2019). Assessment modelling approaches for stocks with spawning components, seasonal and spatial dynamics, and limited resources for data collection. PloS One 14, e0222472. doi: 10.1371/journal.pone.0222472
Vendrami D. L. J., Peck L. S., Clark M. S., Eldon B., Meredith M., Hoffman J. I. (2021). Sweepstake reproductive success and collective dispersal produce chaotic genetic patchiness in a broadcast spawner. Sci. Adv. 7(37):eabj4713. doi: 10.1126/sciadv.abj4713
Wacker S., Skaug H. J., Forseth T., Solem Ø., Ulvan E. M., Fiske P., et al. (2021). Considering sampling bias in close-kin mark–recapture abundance estimates of Atlantic salmon. Ecol. Evol. 11, 3917–3932. doi: 10.1002/ece3.7279
Wang J. (2009). A new method for estimating effective population sizes from a single sample of multilocus genotypes. Mol. Ecol. 18, 2148–2164. doi: 10.1111/j.1365-294X.2009.04175.x
Wang J. (2014). Estimation of migration rates from marker-based parentage analysis. Mol. Ecol. 23, 3191–3213. doi: 10.1111/mec.12806
Waples R. S., Feutry P. (2022). Close-kin methods to estimate census size and effective population size. Fish Fish. 23, 273–293. doi: 10.1111/faf.12615
Waples R. S., Grewe P. M., Bravington M. W., Hillary R., Feutry P. (2018). Robust estimates of a high n e / n ratio in a top marine predator, southern bluefin tuna. Sci. Adv. 4, eaar7759. doi: 10.1126/sciadv.aar7759
Keywords: CKMR, kinship, abundance, mortality, fisheries assessments, fisheries stock benchmarking
Citation: Casas L and Saborido-Rey F (2023) A review of an emerging tool to estimate population parameters: the close-kin mark-recapture method. Front. Mar. Sci. 10:1087027. doi: 10.3389/fmars.2023.1087027
Received: 01 November 2022; Accepted: 15 May 2023;
Published: 11 July 2023.
Edited by:
Francisco Vargas-Albores, National Council of Science and Technology (CONACYT), MexicoReviewed by:
Einar Eg Nielsen, Technical University of Denmark, DenmarkTetsuya Akita, Japan Fisheries Research and Education Agency, Japan
Aurelien Delaval, Norwegian Institute of Marine Research (IMR), Norway
Copyright © 2023 Casas and Saborido-Rey. This is an open-access article distributed under the terms of the Creative Commons Attribution License (CC BY). The use, distribution or reproduction in other forums is permitted, provided the original author(s) and the copyright owner(s) are credited and that the original publication in this journal is cited, in accordance with accepted academic practice. No use, distribution or reproduction is permitted which does not comply with these terms.
*Correspondence: Laura Casas, bGF1cmFjYXNhc0BpaW0uY3NpYy5lcw==; Fran Saborido-Rey, ZnJhbkBpaW0uY3NpYy5lcw==