 Olga M. Żygadłowska1*
 Jessica Venetz2
 Robin Klomp1,2
 Wytze K. Lenstra1
 Niels A. G. M. van Helmond1,2
 Thomas Röckmann3
 Anna J. Wallenius2
 Paula Dalcin Martins2,4
 Annelies J. Veraart5
 Mike S. M. Jetten2
 Caroline P. Slomp1,2
- 1Department of Earth Sciences - Geochemistry, Utrecht University, Utrecht, Netherlands
- 2Department of Microbiology, Radboud Institute for Biological and Environmental Sciences, Radboud University, Nijmegen, Netherlands
- 3Institute for Marine and Atmospheric Research Utrecht, Utrecht University, Utrecht, Netherlands
- 4Department of Microbial Ecology, University of Groningen, Groningen, Netherlands
- 5Department of Aquatic Ecology and Environmental Biology, Radboud Institute for Biological and Environmental Sciences, Radboud University, Nijmegen, Netherlands
Methane (CH4) is a key greenhouse gas. Coastal areas account for a major proportion of marine CH4 emissions. Eutrophication and associated bottom water hypoxia enhance CH4 production in coastal sediments. Here, we assess the fate of CH4 produced in sediments at a site in a seasonally anoxic eutrophic coastal marine basin (Scharendijke, Lake Grevelingen, the Netherlands) in spring (March) and late summer (September) in 2020. Removal of CH4 in the sediment through anaerobic oxidation with sulfate is known to be incomplete in this system, as confirmed here by only slightly higher values of δ13C-CH4 and δD-CH4 in the porewater in the shallow sulfate-methane-transition zone (~5-15 cm sediment depth) when compared to deeper sediment layers. In March 2020, when the water column was fully oxygenated, CH4 that escaped from the sediment was at least partially removed in the bottom water through aerobic oxidation. In September 2020, when the water column was anoxic below ~35 m water depth, CH4 accumulated to high concentrations (up to 73 µmol L-1) in the waters below the oxycline. The sharp counter gradient in oxygen and CH4 concentrations at ~35 m depth and increase in δ13C-CH4 and δD-CH4 above the oxycline indicate mostly aerobic water column removal of CH4. Water column profiles of particulate and dissolved Fe and Mn suggest redox cycling of both metals at the oxycline, pointing towards a potential role of metal oxides in CH4 removal. Water column profiles of and indicate removal of both solutes near the oxycline. Analyses of 16S rRNA gene sequences retrieved from the water column reveal the presence of aerobic CH4 oxidizing bacteria (Methylomonadaceae) and anaerobic methanotrophic archaea (Methanoperedenaceae), with the latter potentially capable of and/or metal-oxide dependent CH4 oxidation, near the oxycline. Overall, our results indicate sediment and water column removal of CH4 through a combination of aerobic and anaerobic pathways, which vary seasonally. Some of the CH4 appears to escape from the surface waters to the atmosphere, however. We conclude that eutrophication may make coastal waters a more important source of CH4 to the atmosphere than commonly assumed.
1 Introduction
Methane (CH4) is a greenhouse gas, generating 35 times more radiative forcing than carbon dioxide over a 100 year time horizon (IPCC, 2007). The present-day concentration of CH4 (1901 ppb; NOAA, 2022) in the atmosphere is 2.5 times higher than that before the industrial era (Blasing and Smith, 2016). The global ocean is responsible for between 2 and 12% of natural CH4 emissions (Saunois et al., 2016). Coastal regions account for up to 75% of total marine CH4 emissions and hence are one of the major marine sources of CH4 to the atmosphere (Borges & Abril, 2011; Borges et al., 2016; Rosentreter et al., 2021)
Most CH4 in marine environments originates from anaerobic degradation of organic matter in sediments through methanogenesis (Froelich et al., 1979). Methanogens produce CH4, using H2 and CO2, methylated compounds or acetate as substrates, when electron acceptors such as O2, , Mn and Fe oxides or are not available (Whiticar, 1999; Welte, 2018). In marine sediments, CH4 is commonly produced when is depleted (Martens and Berner, 1974).
Typically, a major proportion of the CH4 produced in the sediment diffuses upward and undergoes anaerobic oxidation of CH4 with sulphate (S-AOM) via a consortium of anaerobic methanotrophic archaea (ANME) and sulphate reducing bacteria. In marine sediments, S-AOM is thought to account for >90% of CH4 removal (Knittel and Boetius, 2009). Anaerobic oxidation of methane in sediments may also be coupled to iron or manganese oxide reduction (Beal et al., 2009; Sivan et al., 2011; Egger et al., 2015; Ettwig et al., 2016) and reduction (Ettwig et al., 2009; Haroon et al., 2013; Welte et al., 2016), although the role of these pathways in removing CH4 from marine sediments is not well known. When CH4 meets oxygen, it is generally efficiently removed via aerobic oxidation by methanotrophic bacteria (Reeburgh et al., 1991; Reeburgh, 2007). CH4 can also bypass the oxidation filter provided by and oxygen in the sediment, especially at sites with high sedimentation rates. This has been attributed to a short residence time of methanotrophs in the zone of S-AOM and hence, too little time to build up sufficient biomass (Thang et al., 2013; Egger et al., 2016; Wallenius et al., 2021). Some of the CH4 can be released as bubbles when net gas production rates exceed the diffusive flux from the sediments and porewaters become oversaturated with CH4 (Schmid et al., 2017). When the bubbles leave the sediment and travel upward through the water column, they may either dissolve again (Gentz, 2013; Myhre et al., 2016) or escape to the atmosphere. The latter process is termed “ebullition” (McGinnis et al., 2006) and while it has been shown to be important in fresh water systems (Aben et al., 2017), its role in coastal systems is still unclear.
Eutrophication and hypoxia are increasing in coastal bottom waters worldwide due to increased nutrient inputs from land and rising global temperatures (Breitburg et al., 2018). This can lead to a shoaling of the zone of methanogenesis in coastal sediments (Egger et al., 2016; Gelesh et al., 2016) and increased escape of CH4 to overlying waters and, potentially, to the atmosphere. Increased water column CH4 concentrations were indeed reported in summer for, for example, the seasonally hypoxic Chesapeake Bay (Gelesh et al., 2016) and seasonally anoxic Saanich Inlet (Capelle et al., 2019). However, water column records for CH4 and oxygen for Eckenfjorde Bay in the Baltic Sea for 2006-2017 do not show a link between the two parameters, emphasizing that CH4 dynamics in coastal waters are affected by a complex interplay of biogeochemical and physical processes (Bange et al., 2010; Ma et al., 2020). In this context, the efficiency of CH4 removal in the water column is of specific relevance. If methanotrophy in the water column of the future ocean can keep up with increased CH4 inputs, drastic changes in CH4 emissions to the atmosphere are not expected upon continued climate change (Naqvi et al., 2010). If, however, CH4 removal in the water column becomes less efficient, this could further increase the role of the coastal ocean as a source of CH4 (Borges and Abril, 2011; Borges et al., 2016).
Most CH4 removal in coastal waters is thought to be mediated by aerobic methane-oxidizing bacteria (Reeburgh, 2007; Steinle et al., 2017). In coastal systems with a partially anoxic water column, anaerobic CH4 removal could contribute as well. A recent study for the Danish Mariager Fjord reported both aerobic and anaerobic removal of CH4 potentially mediated by members of the Methylococcales, with the anoxic removal being linked to partial denitrification (Steinsdóttir et al., 2022). Other potential pathways and responsible microorganisms for CH4 removal from coastal waters include oxidation of CH4 coupled to reduction performed by “Candidatus Methanoperedens” (ANME2d; family Methanoperedenaceae; Haroon et al., 2013) and/or CH4 oxidation coupled to nitrite reduction mediated by “Ca. Methylomirabilis” bacteria affiliated to the NC10 clade (Ettwig et al., 2010). The presence of nitrite-dependent CH4 oxidizers of the NC10 clade in waters of oceanic Oxygen Minimum Zones show that the nitrogen and CH4 cycles in marine systems may indeed be linked (Padilla et al., 2016; Chronopoulou et al., 2017; Thamdrup et al., 2019). A role for Methanoperedenaceae in the removal of CH4 from coastal or other marine waters has not been demonstrated to date, however. Oxidized forms of iron (Fe) and manganese (Mn) can also potentially act as an electron acceptor in CH4 oxidation in coastal waters, as suggested for freshwater lakes (Oswald et al., 2016).
In this study, we assess the potential role of aerobic and anaerobic removal pathways for CH4 in the sediment and water column of a seasonally anoxic eutrophic coastal marine lake (Lake Grevelingen, the Netherlands). We present results of chemical analyses of the porewater, sediment and water column, focusing on key potential electron acceptors for CH4 oxidation, which we combine with CH4 isotope signatures and analyses of the microbial community in the water column via 16S rRNA gene sequencing. We focus on results for spring (March 2020), when the water column was oxygenated and fully mixed, and the end of summer (September 2020), when the water column was stratified and the deeper waters were anoxic. We find a distinct seasonal contrast in the role of aerobic and anaerobic pathways in removing CH4 in the water column, with potential coupling of nitrogen cycling and removal of CH4.
2 Materials and methods
2.1 Study area
Lake Grevelingen is a coastal marine lake located in the south-west of the Netherlands (Supplementary Figure 1; Hagens et al., 2015; Sulu-Gambari et al., 2017). The lake is a former estuary that was dammed on the landward side in 1964 and on the seaward side in 1971. The lake has a surface area of 115 km2 and average water depth of 5.1 m but is intersected by several former, deep tidal channels with a maximum depth of 45 m. Since 1978, a sluice in the dam on the seaward side of the lake allows for exchange of water with the North Sea, explaining the relatively constant salinity of the lake water of ~29-33. The main former tidal channel of the lake experiences stratification in summer with bottom waters becoming either hypoxic or anoxic since at least 1978 (Wetsteijn, 2011; Hagens et al., 2015; Sulu-Gambari et al., 2017).
Here, we focus on the deepest part of the lake, the Scharendijke basin (Supplementary Figure 1), located in the main channel (45 m water depth; 51.742°N, 3.849°E). Because of its depth the basin is only representative for the deeper part of the lake. In Scharendijke basin, an oxic-anoxic interface (oxycline) typically is present in the water column in summer following an increase in surface water temperatures in spring (Supplementary Figure 2). Stratification and anoxia persist in the main channel throughout the summer, typically ending in early autumn when atmospheric temperatures decrease and the water column mixes (Hagens et al., 2015). Such seasonal stratification and anoxia is common in many coastal systems worldwide (e.g. Kemp et al., 2009). The sediments in Scharendijke basin are characterized by an unusually high sedimentation rate of ~13 cm yr-1 (Egger et al., 2016). Rates of organic carbon input, as estimated from a reactive transport model applied to a geochemical dataset, are also exceptionally high at ~250 mmol C m-2 d-1. The elevated input of organic matter supports high rates of reduction and methanogenesis near the sediment-water interface, with CH4 by-passing the sulfate-methane-transition-zone (SMTZ) as described previously (Egger et al., 2016). The sediment in the Scharendijke basin is therefore a source of methane to the water column. In this study we assess if the removal processes in the water column are efficient enough to prevent methane emissions to the atmosphere.
In the current study, we sampled both the sediment and the water column in Scharendijke basin during two cruises with RV Navicula in March and September 2020. Depth profiles of dissolved oxygen, temperature and salinity in the water column during 19 monitoring cruises between January and December in 2020 were obtained from the Dutch Ministry of Infrastructure and the Environment (https://waterberichtgeving.rws.nl/monitoring/tso-metingen/grevelingenmeer). Depth profiles of dissolved oxygen, temperature and salinity in the water column were additionally obtained with a CTD (Seabird SBE 911 plus) equipped with a Seabird oxygen sensor (SBE43) during the cruise with RV Navicula in September 2020. Most oxygen sensors, including the SBE43, suffer from a background signal in the absence of oxygen. Since Winkler titrations also suffer from artefacts at low oxygen concentrations, these cannot be used for calibration (Grégoire et al., 2021). Here, we assume that oxygen was absent from the water when oxygen concentrations were low and the profile became a vertical line.
2.2 Sediment and porewater collection
A total of four sediment cores was collected in March and September 2020 with a UWITEC gravity corer using transparent PVC core liners of 120 cm length (6 cm inner diameter). Samples for porewater CH4 and its isotopic composition were collected from the first core directly after collection using a liner with holes predrilled at 5 cm intervals that were covered with tape prior to coring. From each depth, 10 mL of sediment was sampled with a plastic syringe, previously cut to remove its top part, and directly transferred into 65 mL glass prefilled with saturated NaCl solution. Subsequently, the bottles were topped up with NaCl solution, to ensure no air bubbles remained inside, and closed with rubber stoppers and aluminum caps and stored upside down until analysis. Note that during sampling, CH4 can degas from cores while collecting sediment, leading to underestimations of methane concentrations. This degassing effect intensifies with increasing CH4 concentrations (Egger et al., 2017; Jørgensen et al., 2019). While the degassing impacts CH4 concentrations it does not significantly affect its isotopic composition (e.g. Wallace et al., 2000; Egger et al., 2017). Samples for porewater and solid-phase analysis were collected from a second sediment core, which was sectioned in a glovebag under a nitrogen atmosphere in a temperature-controlled laboratory on board ship at in-situ temperature. The core was sliced at a depth resolution of 1 cm. The slices were placed in 50 mL centrifuge tubes. The tubes for selected samples (each sample for the 0-10 cm interval, every second sample for the 10-50 cm interval and every fifth sample for the 50-90 cm interval) were then removed from the glove bag, centrifuged at 4500 rpm for 20 minutes to extract porewater and then returned to the glovebag. The supernatant was subsampled for analysis of H2S, , , , dissolved Fe and Mn (d Fe and d Mn, respectively), and alkalinity. Samples for H2S analysis (0.5 mL) were stored in a glass vial with a 2% zinc acetate solution (2 mL) at 4°C. All other samples were stored in polypropylene vials. Samples for , and , were stored at -20°C. Samples for d Fe and d Mn were acidified with 35% suprapur HCl (10 µL of acid per mL of sample) and stored at 4°C. Samples for and alkalinity were stored at 4°C. All sediment samples were stored at -20°C in an aluminum gas tight bag under a nitrogen atmosphere. A third sediment core was sectioned at a resolution of one centimeter to determine the porosity. A fourth core was used to determine high-resolution depth profiles of oxygen in the porewater using microelectrodes (50 µm tip diameter, detection limit<1 µmol L-1) operated with a motorized micromanipulator (Unisense, A.S. Denmark) directly on board. Calibrations were performed as described in Sulu-Gambari et al. (2016).
2.3 Water column sampling
Water samples from discrete depths (1-5 m depth resolution) were collected directly from a 10 L Niskin bottle during the RV Navicula cruises in both March 2020 and September 2020. Samples were obtained for total dissolvable metals and dissolved metals (March and September), CH4 and its isotopic composition and , and (September). No samples for H2S were collected but there was a strong smell of H2S during sampling of the water from 37 m downwards in September. Depth trends in dissolved Mo are used as an additional indicator for the presence of H2S here, since Mo drawdown in an anoxic water column points towards scavenging by H2S (e.g. Helz and Vorlicek, 2019). CH4 samples were collected in 125 mL serum bottles, closed with butyl rubber stoppers, crimped with aluminum caps, poisoned with 1 mL of saturated ZnCl2 solution and stored upside down in the dark. Samples for , and analysis were filtered through 0.2 µm nylon filters and stored at -20°C. Samples for total dissolvable metals (Fe, Mn and Mo) and dissolved metals (d Fe, d Mn and d Mo) were collected in 250 mL acid-washed LDPE Nalgene bottles using Tygon 5000 acid-washed tubing. The samples for dissolved metals were filtered through a 0.2 µm nylon filter (in March) and through a 0.2 µm Sartobran 300 cartridge (in September). Tests in our laboratory show no difference between metal concentrations in water filtered with these two types of filters. All metal samples were acidified with concentrated ultrapure HCl (200 µL of acid per 100 mL of sample). The difference between total dissolvable and dissolved metal was termed particulate metal.
2.4 Chemical analysis of porewater and water samples
Prior to analysis of CH4, a headspace of 5 mL (water samples) or 10 mL (sediment samples) of nitrogen was added to each bottle while allowing the same volume of liquid to escape. After equilibration of the gas and water phase (>2h for water column samples, 7 days for sediment samples), CH4 concentrations were measured with a Thermo Finnigan Trace™ gas chromatograph (Flame Ionization Detector; limit of detection 0.02 µmol L-1). The isotopic composition of CH4 (δ13C–CH4 and δD–CH4) was analyzed by Continuous Flow Isotope Ratio Mass Spectrometry (CF-IRMS) as described in detail in Brass and Röckmann (2010) and Sapart et al. (2011). Insufficient sample was available to determine the δD–CH4 in the bottom water in March.
Porewater H2S was measured spectrophotometrically using the phenylenediamine and ferric chloride method (Cline, 1969). Concentrations of were determined using the indophenol blue method (Solorzano, 1969). and were determined with a Gallery™ Automated Chemistry Analyzer type 861 (Thermo Fisher Scientific, USA). SO42- was determined with ion chromatography (detection limit<50 µmol L-1). Alkalinity was measured through titration with 0.01 M HCl within 24 h of sampling. Dissolved Fe and Mn in the porewater were determined by Inductively Coupled Plasma Optical Emission Spectroscopy (ICP-OES, Perkin-Elmer Avio 500; detection limit 0.1 ± 0.04 µmol L-1 and 0.03 ± 0.01 µmol L-1 and recovery rate of 101% and 99% for Fe and Mn, respectively). Water column dissolved and particulate Fe, Mn and Mo were measured by ICP mass spectrometry (ICP-MS, Nexion (Perkin Elmer)). The water column samples were concentrated and the seawater matrix was removed using a SC-DX SeaFAST S2 (Elemental Scientific) prior to analysis (Lenstra et al., 2022). Samples acidified to pH 2 were buffered with 4.8 M glacial acetic acid 99.7% (Baseline, Seastar) and 4.1 M ammonium hydroxide 29% (Baseline, Seastar) and subsequently loaded onto the pre-concentration column for 20 seconds (Lagerström et al., 2013). The analyte was injected directly into the device and measured online. The average limit of detection, calculated as the standard deviation of the analysis of oligotrophic seawater with known trace metal concentrations, multiplied by 3, was 0.2 ± 0.06, 0.03 ± 0.01 and 8.47 ± 2.82 nmol L-1 and the recovery was 101%, 101% and 99% for Fe, Mn and Mo, respectively.
2.5 Sediment analyses
Freeze-dried sediment samples were ground using an agate mortar under a nitrogen atmosphere. To determine the organic C content around 300 mg of the powdered material was decalcified with 1 M HCl (2-step wash) (Van Santvoort et al., 2002), dried, weighed and powdered. A subsample was analyzed with an elemental analyzer (Fisons Instruments NA 1500 NCS) and the organic C was calculated after correction for the weight loss due to decalcification. The accuracy and precision of the analyses was determined based on measurements of the internationally certified soil standard IVA2. The certified value for IVA2 is 0.732 wt.% C. The mean value that was obtained in this study for IVA2 (n=24) was 0.722 wt.% C, with a standard deviation of 0.009 wt.% C. The analytical uncertainty based on duplicates (n=15) was 0.11 wt.% C for organic C. A second subsample (between 50 and 100 mg) of the powdered material was subjected to a 5-step sequential extraction procedure to determine the Mn (Lenstra et al., 2021) and Fe speciation (combined methods of Raiswell et al. (2010) and Claff et al. (2010)). The extraction steps were as follows: (1) 0.057 M ascorbic acid, 0.17 M sodium citrate and 0.6 M sodium bicarbonate (pH 7.5) which extracts easily reducible Fe and Mn oxides, (2) 1 M HCl which extracts reducible crystalline Fe oxides, Fe carbonate, FeS and Mn carbonate, (3) 0.35 M acetic acid, 0.2 M Na citrate and 50 g L−1 Na dithionite, pH 4.8, which extracts crystalline Fe and Mn oxides, (4) 0.2 M ammonium oxalate and 0.17 M oxalic acid which extracts recalcitrant Fe oxides and non-reactive Mn phases (5) 65% HNO3 which extracts pyrite and Mn associated with pyrite. Fe and Mn in the solutions of step 1 and 5 was measured by Inductively Coupled Plasma Optical Emission Spectroscopy (ICP-OES, Perkin-Elmer Avio 500; with a detection limit of 0.1 µmol L-1 and 0.02 µmol L-1 for Fe and Mn, respectively). The average recovery for Fe and Mn was 106% and 100%, respectively and the average analytical uncertainty based on duplicates (n=16) was 3.2% and 2.6%, respectively. Fe in the solutions of step 2, 3 and 4 was determined colorimetrically using the phenanthroline method (APHA, 2005). Average analytical uncertainty based on duplicates (n=16) was< 13.4% for all fractions of the three sequential extraction procedures. The sum of the Fe extracted in steps 1, 3 and 4 is assumed to represent Fe oxides. We exclude step (2) as a contributor to the Fe oxide pool since analysis of selected samples showed that nearly all Fe in the HCl solutions at this site was present as Fe(II). The Mn extracted in step 1 is used as a measure of reactive Mn oxides.
2.6 DNA extractions and 16S rRNA analysis
Water samples were filtered through 0.22 µm Supor PES filters using a vacuum pump within one day after sampling and stored at -80°C. DNA was extracted from the filters following the protocol of the DNeasy Power water DNA Isolation kit (Qiagen, Venlo, the Netherlands). For a further description of the data acquisition and analysis we refer to Venetz et al. (2022).
2.7 Reactive transport modeling of CH4 dynamics
A 1-dimensional multicomponent reactive transport model, modified from that of Egger et al. (2016), was used to investigate the production and removal of CH4 in the sediment at our Scharendijke site. The model describes the transport and reaction of 12 solutes and 9 solids (Supplementary Table 1). Here, we focus specifically on modeling the depth trends in porewater O2, d Mn, d Fe, SO4, H2S, , CH4 and alkalinity and sediment organic C and Mn and Fe oxides. All profiles were used to fit the model to the data. Depth trends in , SO42- and alkalinity in particular provide a strong constraint on CH4 production and removal in the sediment. Since bubble formation is not included in the model, our CH4 concentrations at depth in the sediment may be overestimates. To estimate alkalinity, we use modeled dissolved inorganic carbon (DIC). We assume the modeled DIC are similar to those of alkalinity which at high bicarbonate concentrations is a reasonable assumption. Solutes and solids are transported by advection (burial). Solutes are additionally transported by molecular diffusion. Biogeochemical reactions implemented in the model and their respective rate laws are given in Supplementary Tables 2, 3. Parameter values were taken from the literature or constrained using the model (Supplementary Tables 4, 6). The model was written in R (version 3.6.2.) and makes use of the marelac (Soetaert and Meysman, 2012) and reactran (Soetaert et al., 2010) packages for chemical and physical constants and the calculation of transport coefficients, respectively. The model describes the upper 100 cm of the sediment, which is divided into 1000 model layers. The boundary conditions at the sediment-water interface for solutes and solids are defined as concentrations and fluxes, respectively (Supplementary Table 5). The model was run with fixed boundary conditions for 60 years until steady state was reached, as in Egger et al. (2016) for the same site. The model was then run for 20 additional years in a scenario in which the bottom water O2 concentration and input of organic matter, Mn oxides and Fe oxides as well as the sedimentation rate were varied following a seasonal cycle (Supplementary Figure 3). The key purpose of the model application was to assess the production and (potential) removal pathways of CH4 in the sediment and estimate the diffusive release to the overlying water. Given the complexity of the system and strong temporal dynamics, a perfect fit of the model to the data is not expected.
2.8 Flux calculations for the water column and atmosphere
Vertical fluxes of O2, , , CH4 and at the oxycline in the water column were calculated using the following equation:
Where Fz is the vertical flux of each solute in mmol m-2 d-1, Kz represents the vertical eddy diffusivity in m2 d-1 and dC/dz is the concentration gradient in mmol L-1 m-1. Depth profiles of Kz were estimated as follows (Gargett, 1984; Lewis and Landing, 1991):
where a0 is a system-specific constant related to the internal wave energy in m2 d-1, g is the gravitational constant in m2 d-1, ρz is the density at depth z in kg m-3 and dρ/dz is the density gradient in kg m-4. Here, we estimate a0 based on Equation 2 using an averaged Kz value for Lake Grevelingen (van Haren, 2019) assuming that a0 remains constant with time. The vertical fluxes of electron acceptors (O2, , , Fe and Mn oxides) were calculated based on the downward concentration gradient (negative), towards the oxycline while the vertical fluxes of electron donors (CH4, Mn2+, ) were calculated based on the upward concentration gradient (positive), towards the oxycline. The downward fluxes of particles (Fe and Mn oxides) were calculated as follows (Neretin et al., 2003):
where Fpart is the downward vertical flux of particles in mmol m-2 d-1, ω is the sinking speed of particles in m d-1 and C is the measured concentration of particulate Fe or Mn at 30 m depth in mmol L-1. The upward and downward vertical fluxes were summed in order to determine the electron balance and to evaluate the roles of different electron donors and acceptors at the oxycline.
The flux of methane at the water-atmosphere interface was calculated using the following equation (Barber et al., 1988):
where Fatm is the flux of methane at the water-atmosphere interface in mmol m-2 d-1, KL is the gas exchange coefficient in m d-1, CW is the concentration of methane dissolved in the surface water (1 m depth) in µmol L-1 and CO is the calculated methane concentration in equilibrium with the atmosphere in µmol L-1. The KL value was estimated based on the wind speed according to Barber et al. (1988). The values of the minimum and maximum wind speed for the day of sampling (6th of September 2020) were obtained from The Royal Netherlands Meteorological Institute data base (https://www.knmi.nl/nederland-nu/klimatologie/daggegevens) and were used to calculate the range of Fatm.
The fractionation factor for the water column samples was derived from the equation as described in Grant and Whiticar (2002):
Where δ13C-CH4 is the isotopic signature of the methane, α is the fractionation factor, f is the fraction of methane remaining and (δ13C-CH4)0 is the isotopic composition of methane before oxidation. The parameter f was calculated based on the concentrations of methane at depth 35 m (before oxidation) and 25 m (after oxidation).
3 Results
3.1 Water column salinity, temperature and oxygen
Salinity showed relatively little change with water depth in Lake Grevelingen in 2020. Overall, salinity varied between 30 and 33 with a trend towards highest values (>32) from August onwards (Figure 1A). This temporal trend is likely indicative of increased inflow of North Sea water into the lake in the late summer and fall (Hagens et al., 2015). While in January surface water temperatures were lower than bottom water temperatures (6.1 vs. 7.3°C, Figure 1B), in March, a constant lake temperature of 7.2°C was observed, indicative of a fully mixed water column. Warming of the surface water in spring led to stratification that persisted throughout the summer, with a thermocline that gradually deepened from 20 m to 35 m. The water column fully mixed again after our sampling in September. In October, water column temperatures were constant at around 15°C. Temperatures then gradually decreased to 8°C in December. The temperature-induced stratification strongly impacted water column oxygen concentrations. While the water column was fully oxygenated from January to March, bottom waters were depleted in oxygen in May (Figure 1C). The oxycline stabilized at a depth of around 20 m until July, followed by a deepening of the oxycline to a depth of 35 m, linked to the downward movement of the thermocline. Upon mixing in the fall, the water column became fully oxygenated again.
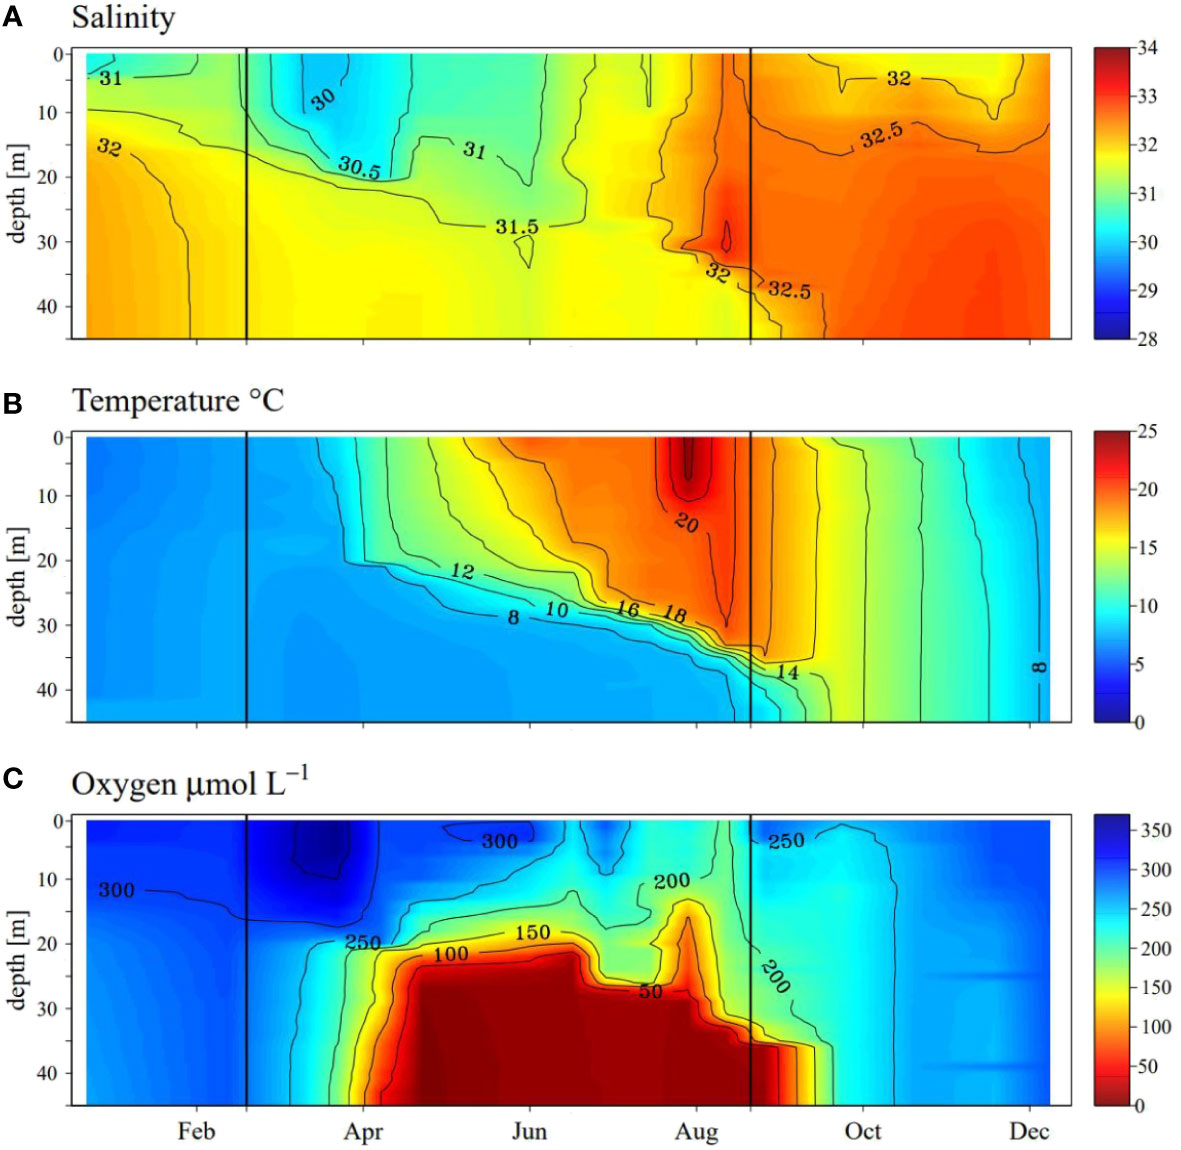
Figure 1 Seasonal dynamics of (A): salinity, (B): temperature and (C): oxygen in the water column between January and December 2020 in the Scharendijke basin (Lake Grevelingen) in 2020. Data obtained from monitoring by Rijkswaterstaat (Directorate-General for Public Works and Water Management of the Netherlands. The observations were carried out every two weeks to one month, giving a total of 19 time points in 2020. Black vertical lines indicate the dates that the water column was sampled with RV Navicula (March and September 2020).
3.2 Porewater profiles
In March, oxygen penetrated into the sediment to a depth of 0.5 cm (Figure 2A). In September, in contrast, the bottom water and hence, also the sediment was completely anoxic. A distinct seasonality was observed in dissolved Mn and Fe in the upper 15 cm of the sediment, with high concentrations near the sediment water interface in March and low concentrations in September (Figures 2A, B). Sulfate concentrations rapidly decreased with depth in the sediment in both seasons, with the strongest decrease in September (Figure 2C). While in March porewater H2S concentrations reached a maximum at a depth of 15 cm (~2 mmol L-1), much higher concentrations of H2S (~5 mmol L-1) were observed near the sediment-water interface in September (Figure 2D). Porewater and alkalinity both increased with depth, and profiles showed higher values (up to 2 and 17 mmol L-1, respectively) in the upper 15 cm of the sediment in September when compared to March (Figures 2E, F).
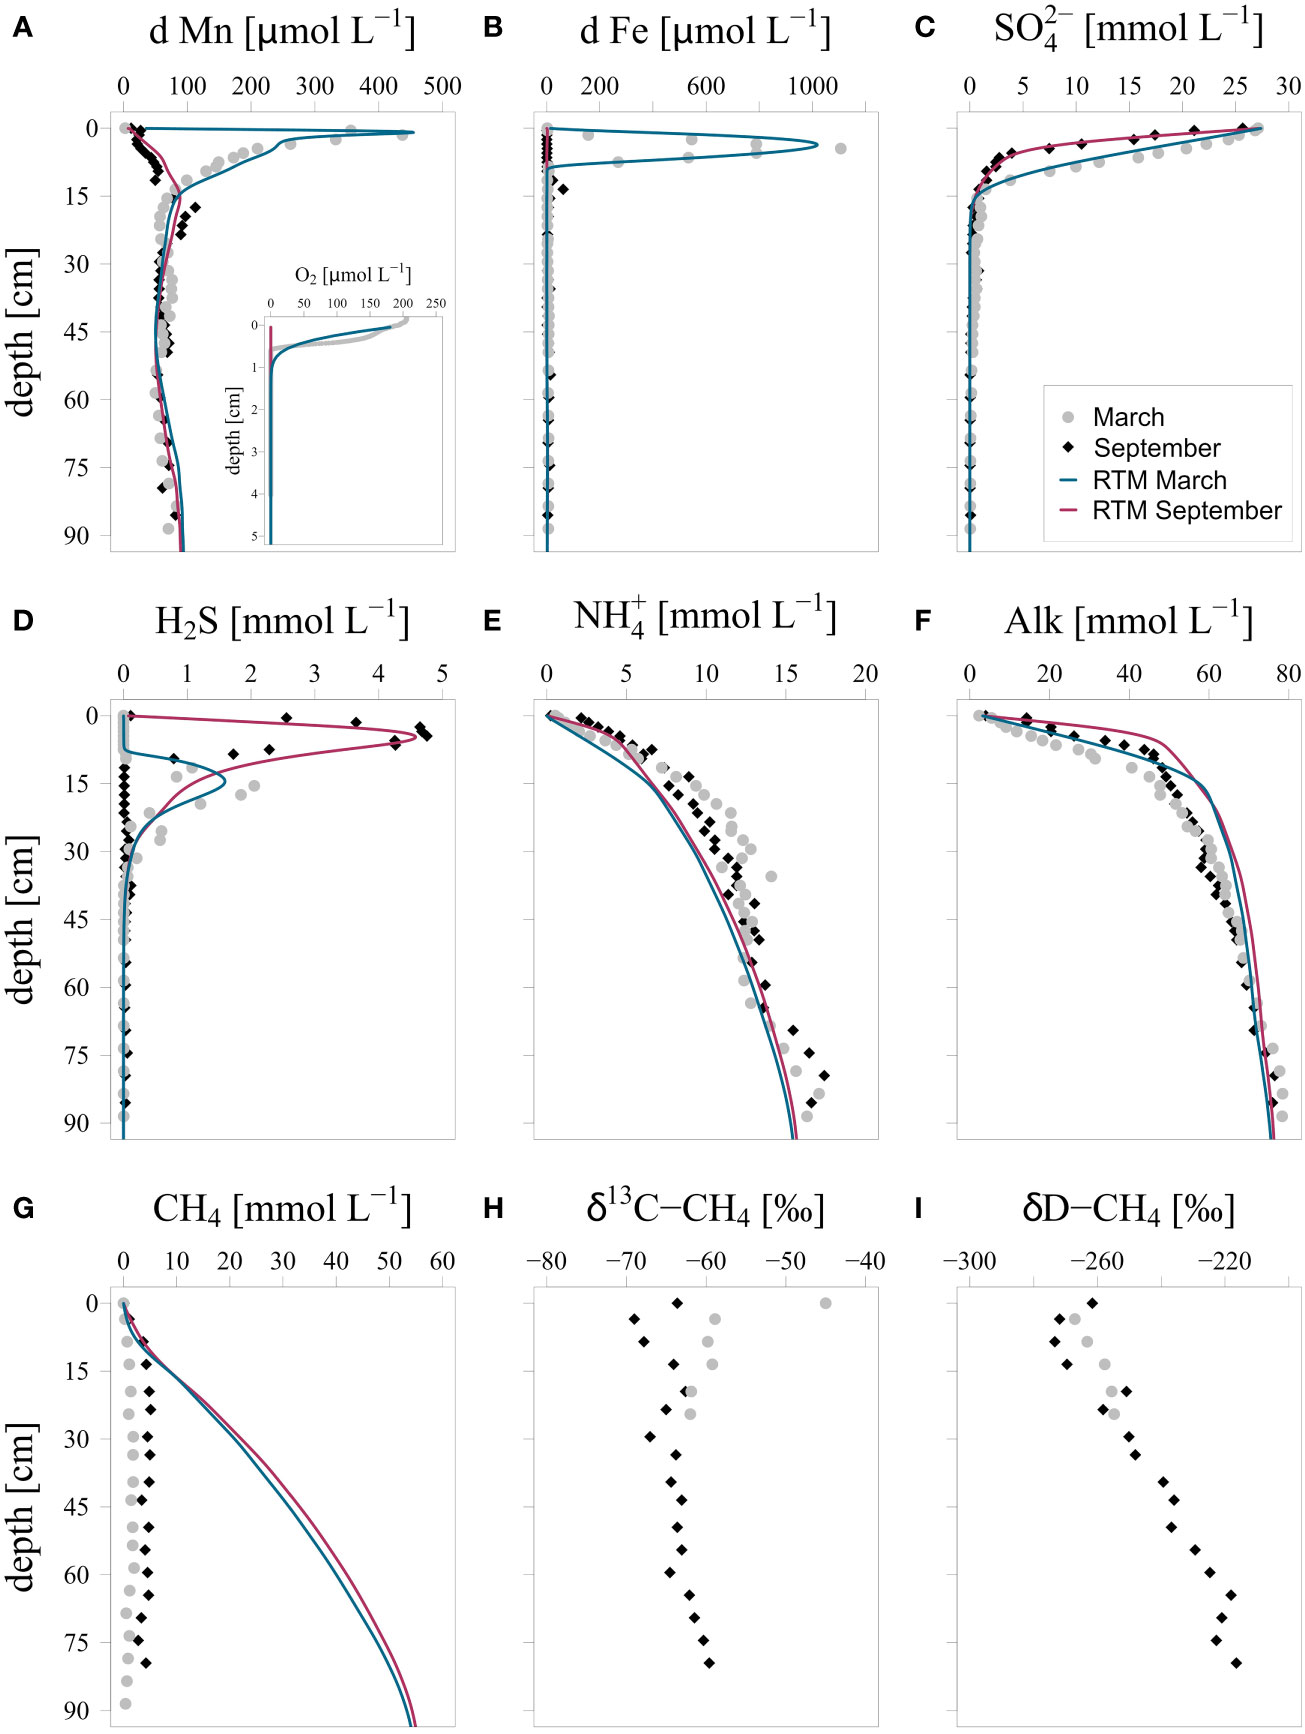
Figure 2 Porewater depth profiles of measured and modeled (A): O2 and d Mn, (B): d Fe, (C): , (D): H2S, (E): , (F): alkalinity, (G): CH4, (H): δ13C-CH4 and (I): δD-CH4. δ13C-CH4 values are given in ‰ vs. VPDB (Vienna Pee Dee Belemnite) and δD-CH4 values are given in ‰ vs. V-SMOW (Vienna Standard Mean Ocean Water). d Mn and d Fe refer to dissolved Fe and Mn (< 0.45 µm filter). Blue and red lines indicate results of the reactive transport model (RTM) for March and September 2020. Note that the data point for a depth of 0 cm refers to bottom water.
High porewater CH4 concentrations were observed in the sediment in both March and September (Figure 2G). However, both profiles are strongly affected by degassing of CH4 during sampling and concentrations are therefore underestimated. Methane near the sediment water interface in March was enriched in 13C (Figure 2H). In September, in contrast, a distinct minimum in δ13C-CH4 was seen in the surface sediment and a small enrichment in 13C of CH4 was only observed in the bottom water. A decrease in δD-CH4 values was found near the sediment water interface in both months (Figure 2I).
3.3 Sediment Fe, Mn and organic C profiles
The upper 10 cm of the sediment was enriched in organic C and depleted in Fe oxides and Mn oxides in September when compared to March (Figures 3A–C). A seasonal pattern of higher and lower organic C content is preserved at depth. While Fe and Mn oxide contents also show such variations at depth, they are no longer out of phase with those of organic C because of diagenesis as shown previously for this site (Egger et al., 2016).
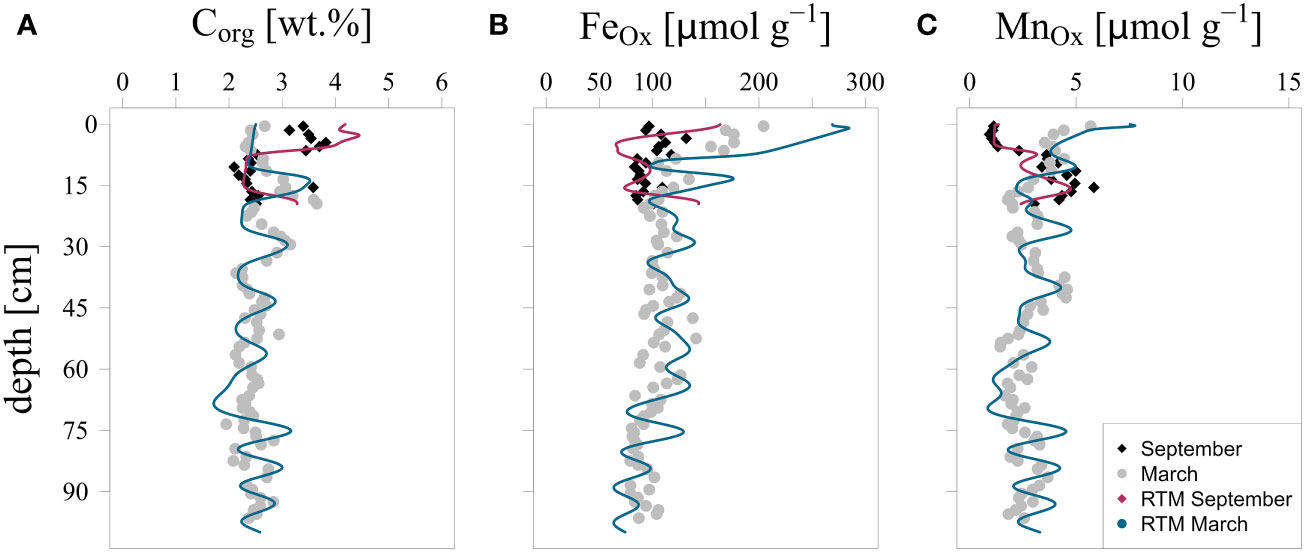
Figure 3 Measured and modeled depth profiles of (A): organic carbon (Corg), (B): Fe oxides and (C): Mn oxides in the sediment in March and September 2020.
3.4 Water column profiles
In March the water column was fully oxygenated, while in September dissolved oxygen became depleted at 35 m (Figures 1C, 4A). In September, and profiles only showed minor changes with depth (Figures 4B, C; no data for March). Dissolved and particulate Mn concentrations showed little change with depth in March (Figures 4D, E). In September, dissolved Mn accumulated in the anoxic bottom waters, while a maximum in particulate Mn was observed above the oxycline. In March, dissolved Fe was not detectable in the water column whereas in September concentrations of 0.7 µmol L-1 were observed below 30 m (Figure 4F). Particulate Fe concentrations gradually increased with depth in both months, with an especially sharp increase below the oxycline in September (Figure 4G). In March, dissolved Mo remained constant throughout the water column (Figure 4H), whereas in September a depletion in dissolved Mo was observed from 32 m downwards, which indicates the presence of H2S in the deeper water (Helz and Vorlicek, 2019). In September, and CH4 accumulated in the anoxic bottom waters with the concentrations near the sediment-water interface reaching 73 and 227 µmol L-1, respectively (Figures 4I, J; no data for March). Both solutes strongly decreased in concentration towards the oxycline. Above the oxycline, CH4 concentrations were ~0.2 µmol L-1 while remained present at concentrations between 25 and 50 µmol L-1 throughout the water column. A strong increase in δ13C-CH4 from -63.2 to -32.4 ‰ and in δD-CH4 from -276.8 to 15.7 ‰ was observed between 35 and 25 m (Figures 4K, L).
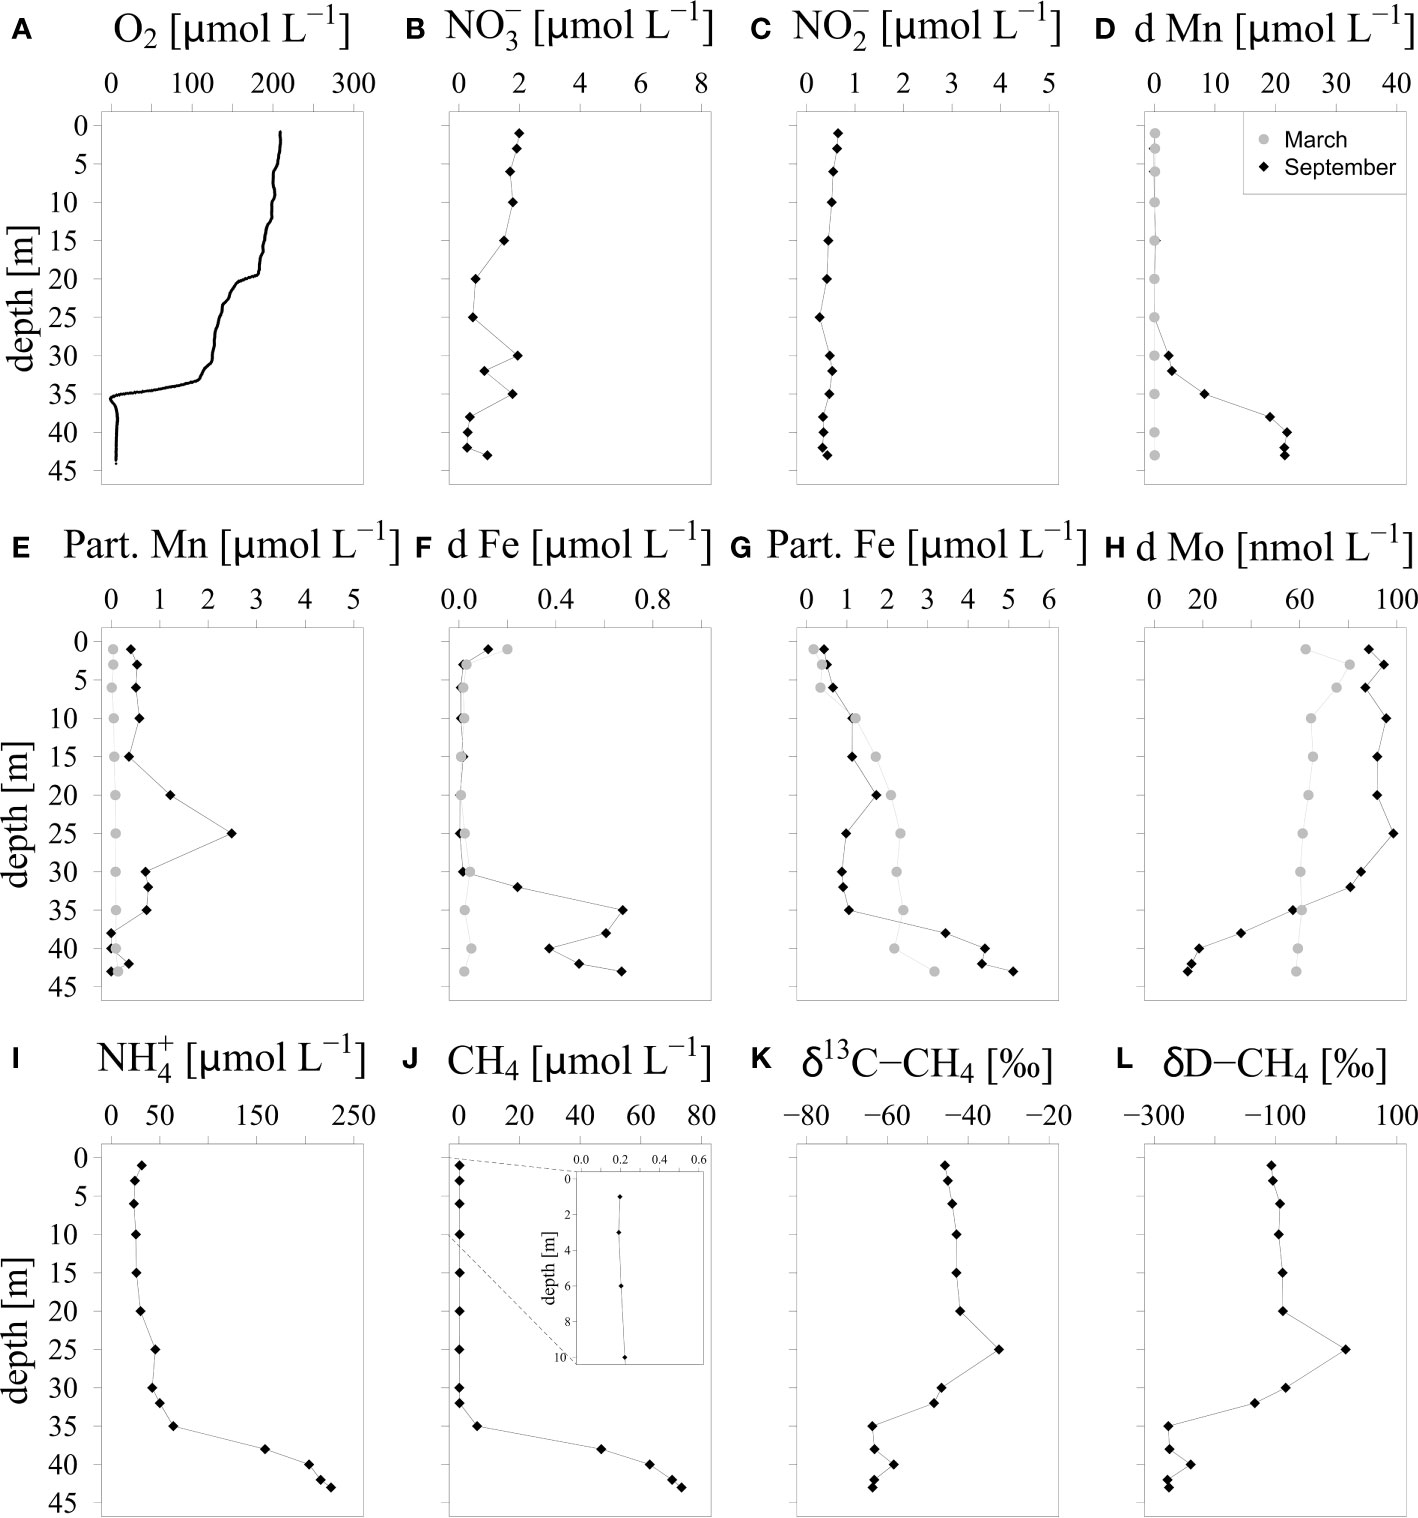
Figure 4 Water column depth profiles of (A): O2, (B): nitrate, (C): nitrite, (D): dissolved and (E): particulate Mn (d Mn, Part. Mn), (F): dissolved and (G): particulate Fe (d Fe, Part. Fe), (H): dissolved Mo (d Mo), (I): , (J): CH4, (K): δ13C-CH4 and (L): δD-CH4. δ13C-CH4 values are given in ‰ vs. VPDB (Vienna Pee Dee Belemnite) and δD-CH4 values are given in ‰ vs. V-SMOW (Vienna Standard Mean Ocean Water).
Calculated vertical fluxes of key solutes and solids (Table 1) indicate that oxygen was the main electron acceptor at the oxycline. Sinking Mn and Fe oxides also contribute substantially to the electron budget. Given that the profiles of and do not show a gradient and that these solutes may be directly removed through denitrification, we cannot estimate their contribution. The main electron donors at the oxycline were and CH4, with a lesser role for dissolved Mn2+. Our results indicate a deficiency of electron acceptors relative to electron donors, which likely is even larger than calculated here since we cannot include H2S in the budget due to lack of data. The flux of methane from the surface water to the atmosphere, as calculated with Equation 4, ranges from 0.09 to 0.37 mmol m-2 d-1 considering the minimum and maximum wind speed above the water surface.
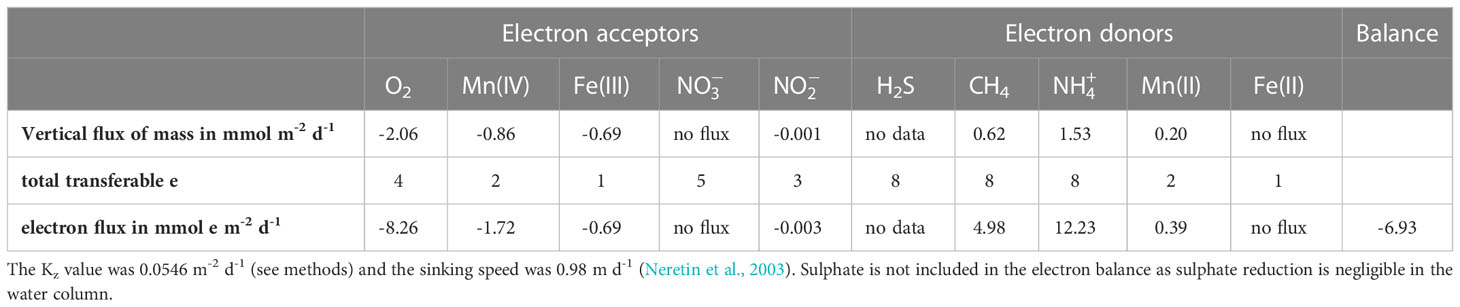
Table 1 Downward vertical fluxes of electron acceptors (oxidants) and upward vertical fluxes of electron donors (reductants) at the oxycline (35 m) in September 2020.
3.5 Water column microbial abundance
Amplicon sequencing of bacterial and archaeal 16S rRNA genes indicated that aerobic methanotrophs of the Methylomonadaceae family were present throughout the water column, with the highest relative abundance at the oxycline (35 m; Figure 5A). Importantly, Methylomonadaceae were also present in the anoxic and sulfidic waters below the oxycline (Figure 5B). Anaerobic archaeal methanotrophs of the Methanoperedenaceae family were mostly present at and below the oxycline.
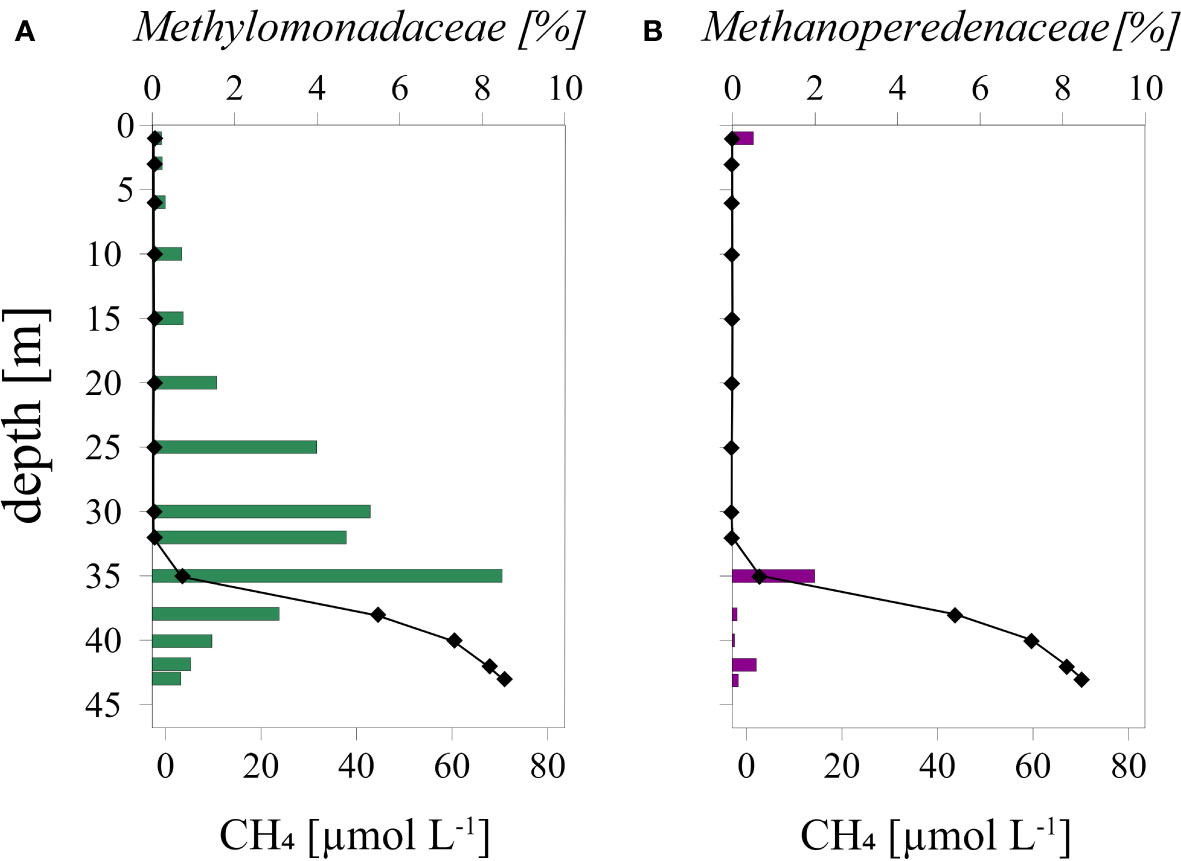
Figure 5 Relative abundance of (A): Methylomonadaceae and (B): Methanoperedenaceae and CH4 concentrations in the water column in September 2020 at Scharendijke. The abundance of Methylomonadaceae is relative to the total abundance of all bacteria and the abundance of Methanoperedenaceae is relative to the total abundance of all archaea.
3.6 Reactive transport modeling of CH4 dynamics
The modeled porewater and sediment profiles generally correspond well with the measured data (Figures 2, 3). Key exceptions are the CH4 profile which is affected by degassing during sampling and the Fe oxide profiles at depth where the amplitude of change is overestimated. We note that the and alkalinity profiles are also not modeled perfectly. This could be related to temporal variations in parameters that are not included in the model (e.g. C/N ratios). However, for our purposes here, i.e. obtaining first-order estimates of the production and removal rates of methane in the sediment, the current approach is appropriate. The model results illustrate that actual CH4 concentrations in both months were much higher than those measured. Model-calculated rates of organic matter degradation coupled to reduction integrated over the upper 100 cm of the sediments are higher in September than in March (Table 2). Depth-integrated rates of CH4 production show little change. However, the model results do suggest an upward shift in the zone of methanogenesis from March to September and a decreased removal of the CH4 in the sediment through anaerobic oxidation coupled to reduction (Figure 2, Table 2; Supplementary Data). In the model, the contribution of other electron acceptors than (i.e. O2, , , Fe and Mn oxides) to CH4 removal in the sediment is negligible. (e.g. 0.005 mmol m-2 d-1 for aerobic oxidation of CH4 in March). Model calculated rates of CH4 diffusion across the sediment-water interface are 1.1 mmol m-2 d-1 and 2.7 mmol m-2 d-1 in March and September, respectively.
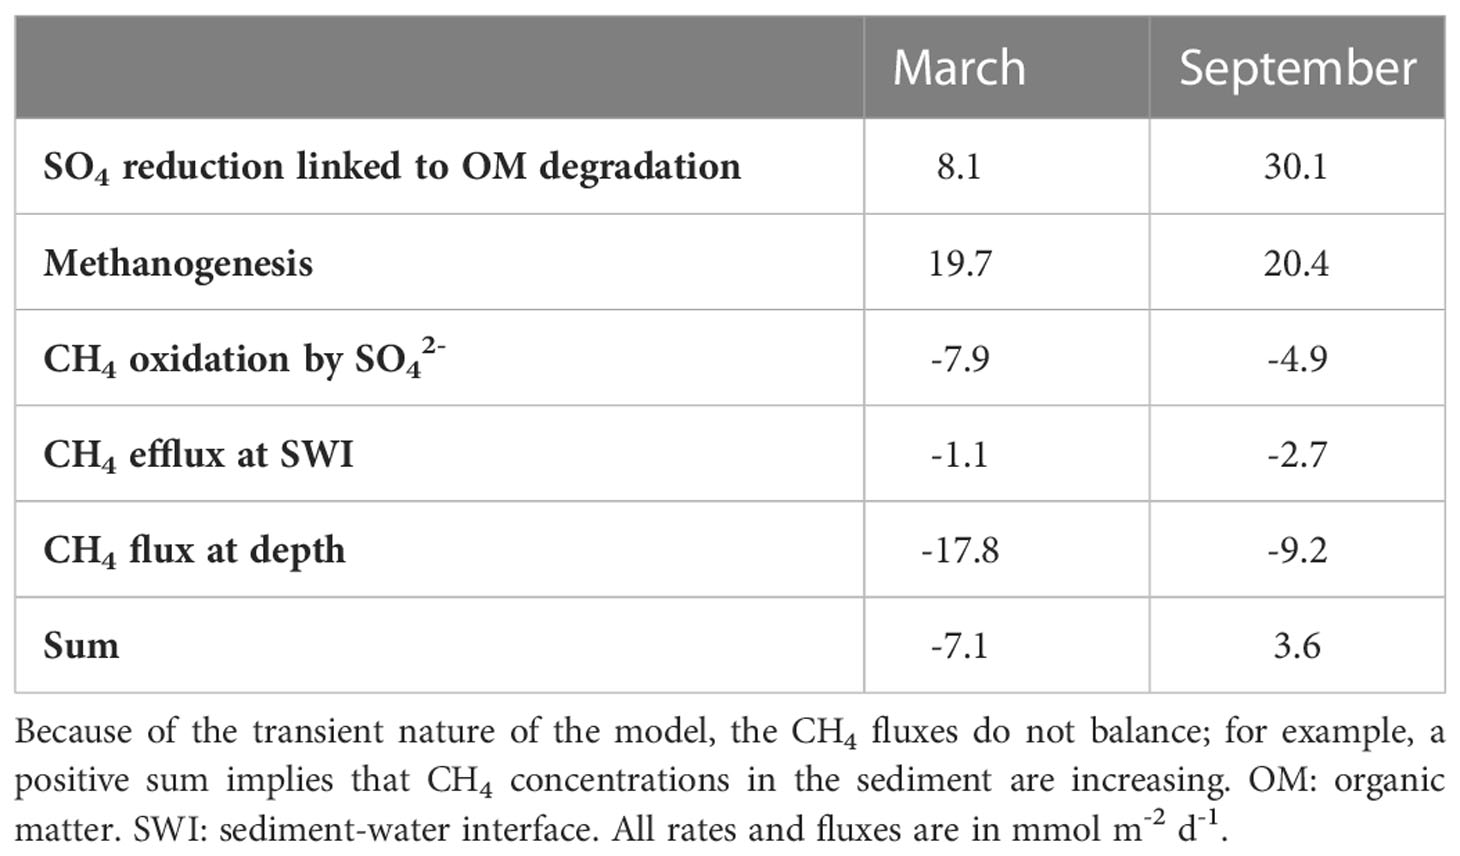
Table 2 Depth-integrated rates of SO4 reduction coupled to organic matter degradation and mass balance for CH4 for the upper 100 cm of the sediment for March and September 2020 as calculated with the model.
4 Discussion
4.1 Sediment methane dynamics
Eutrophication in coastal systems can lead to a shoaling of the zone of methanogenesis and SMTZ, thereby increasing the chance of release of CH4 to the water column (Egger et al., 2015). This CH4 release is exacerbated in systems that suffer from seasonal hypoxia (Gelesh et al., 2016). At our study site in Lake Grevelingen, a coastal marine system subject to both eutrophication and seasonal hypoxia, we find a very shallow SMTZ at a sediment depth of ~15 cm. While the depth of the SMTZ does not differ between March and September, changes in the curvature of the and profiles in the porewater point towards higher rates of organic matter degradation coupled to reduction in September when compared to March (Figures 2C–E; Table 2). We attribute this to an increased input of organic matter in summer linked to the increase in primary production in the lake and increased inputs of algae, likely mostly Phaeocystis, from the North Sea during the same period (Hagens et al., 2015; Sulu-Gambari et al., 2018).
Rates of methanogenesis are apparently less sensitive to the changes in organic matter input and remain high throughout the year. The CH4 produced by methanogenesis in porewater is usually depleted in 13C and D (Whiticar, 1999), with the various pathways of microbial CH4 formation producing characteristic isotopic signatures in δ13C and δD. This can be visualized in a so-called co-isotope plot (Figure 6). In our case, the isotopic signature of the CH4 suggests that methanogenesis occurs both via carbonate reduction and utilization of methyl-type substrates such as acetate (Whiticar, 1999). Methanotrophy typically results in a gradual increase in δ13C-CH4 and δD-CH4 due to preferential oxidation of CH4 that is isotopically light (Whiticar, 1999; Reeburgh, 2007). We see little evidence for substantial CH4 oxidation in the sediment at Scharendijke from the isotopic signatures (Figures 2H, I, 6). The minor increase in δ13C-CH4 in the upper 20 cm of the sediment in March indicates that there is some removal of CH4, but a clear isotopic signal of removal is only observed in the bottom water. We attribute this to aerobic oxidation of CH4 near the sediment-water interface in March. The decrease in δ13C-CH4 in the upper 15 cm of the sediment in September is likely the result of an increase in methanogenesis relative to methanotrophy linked to slow growth of ANME as proposed earlier for this location (Egger et al., 2016) and other sites (Knab et al., 2009; Egger et al., 2015).
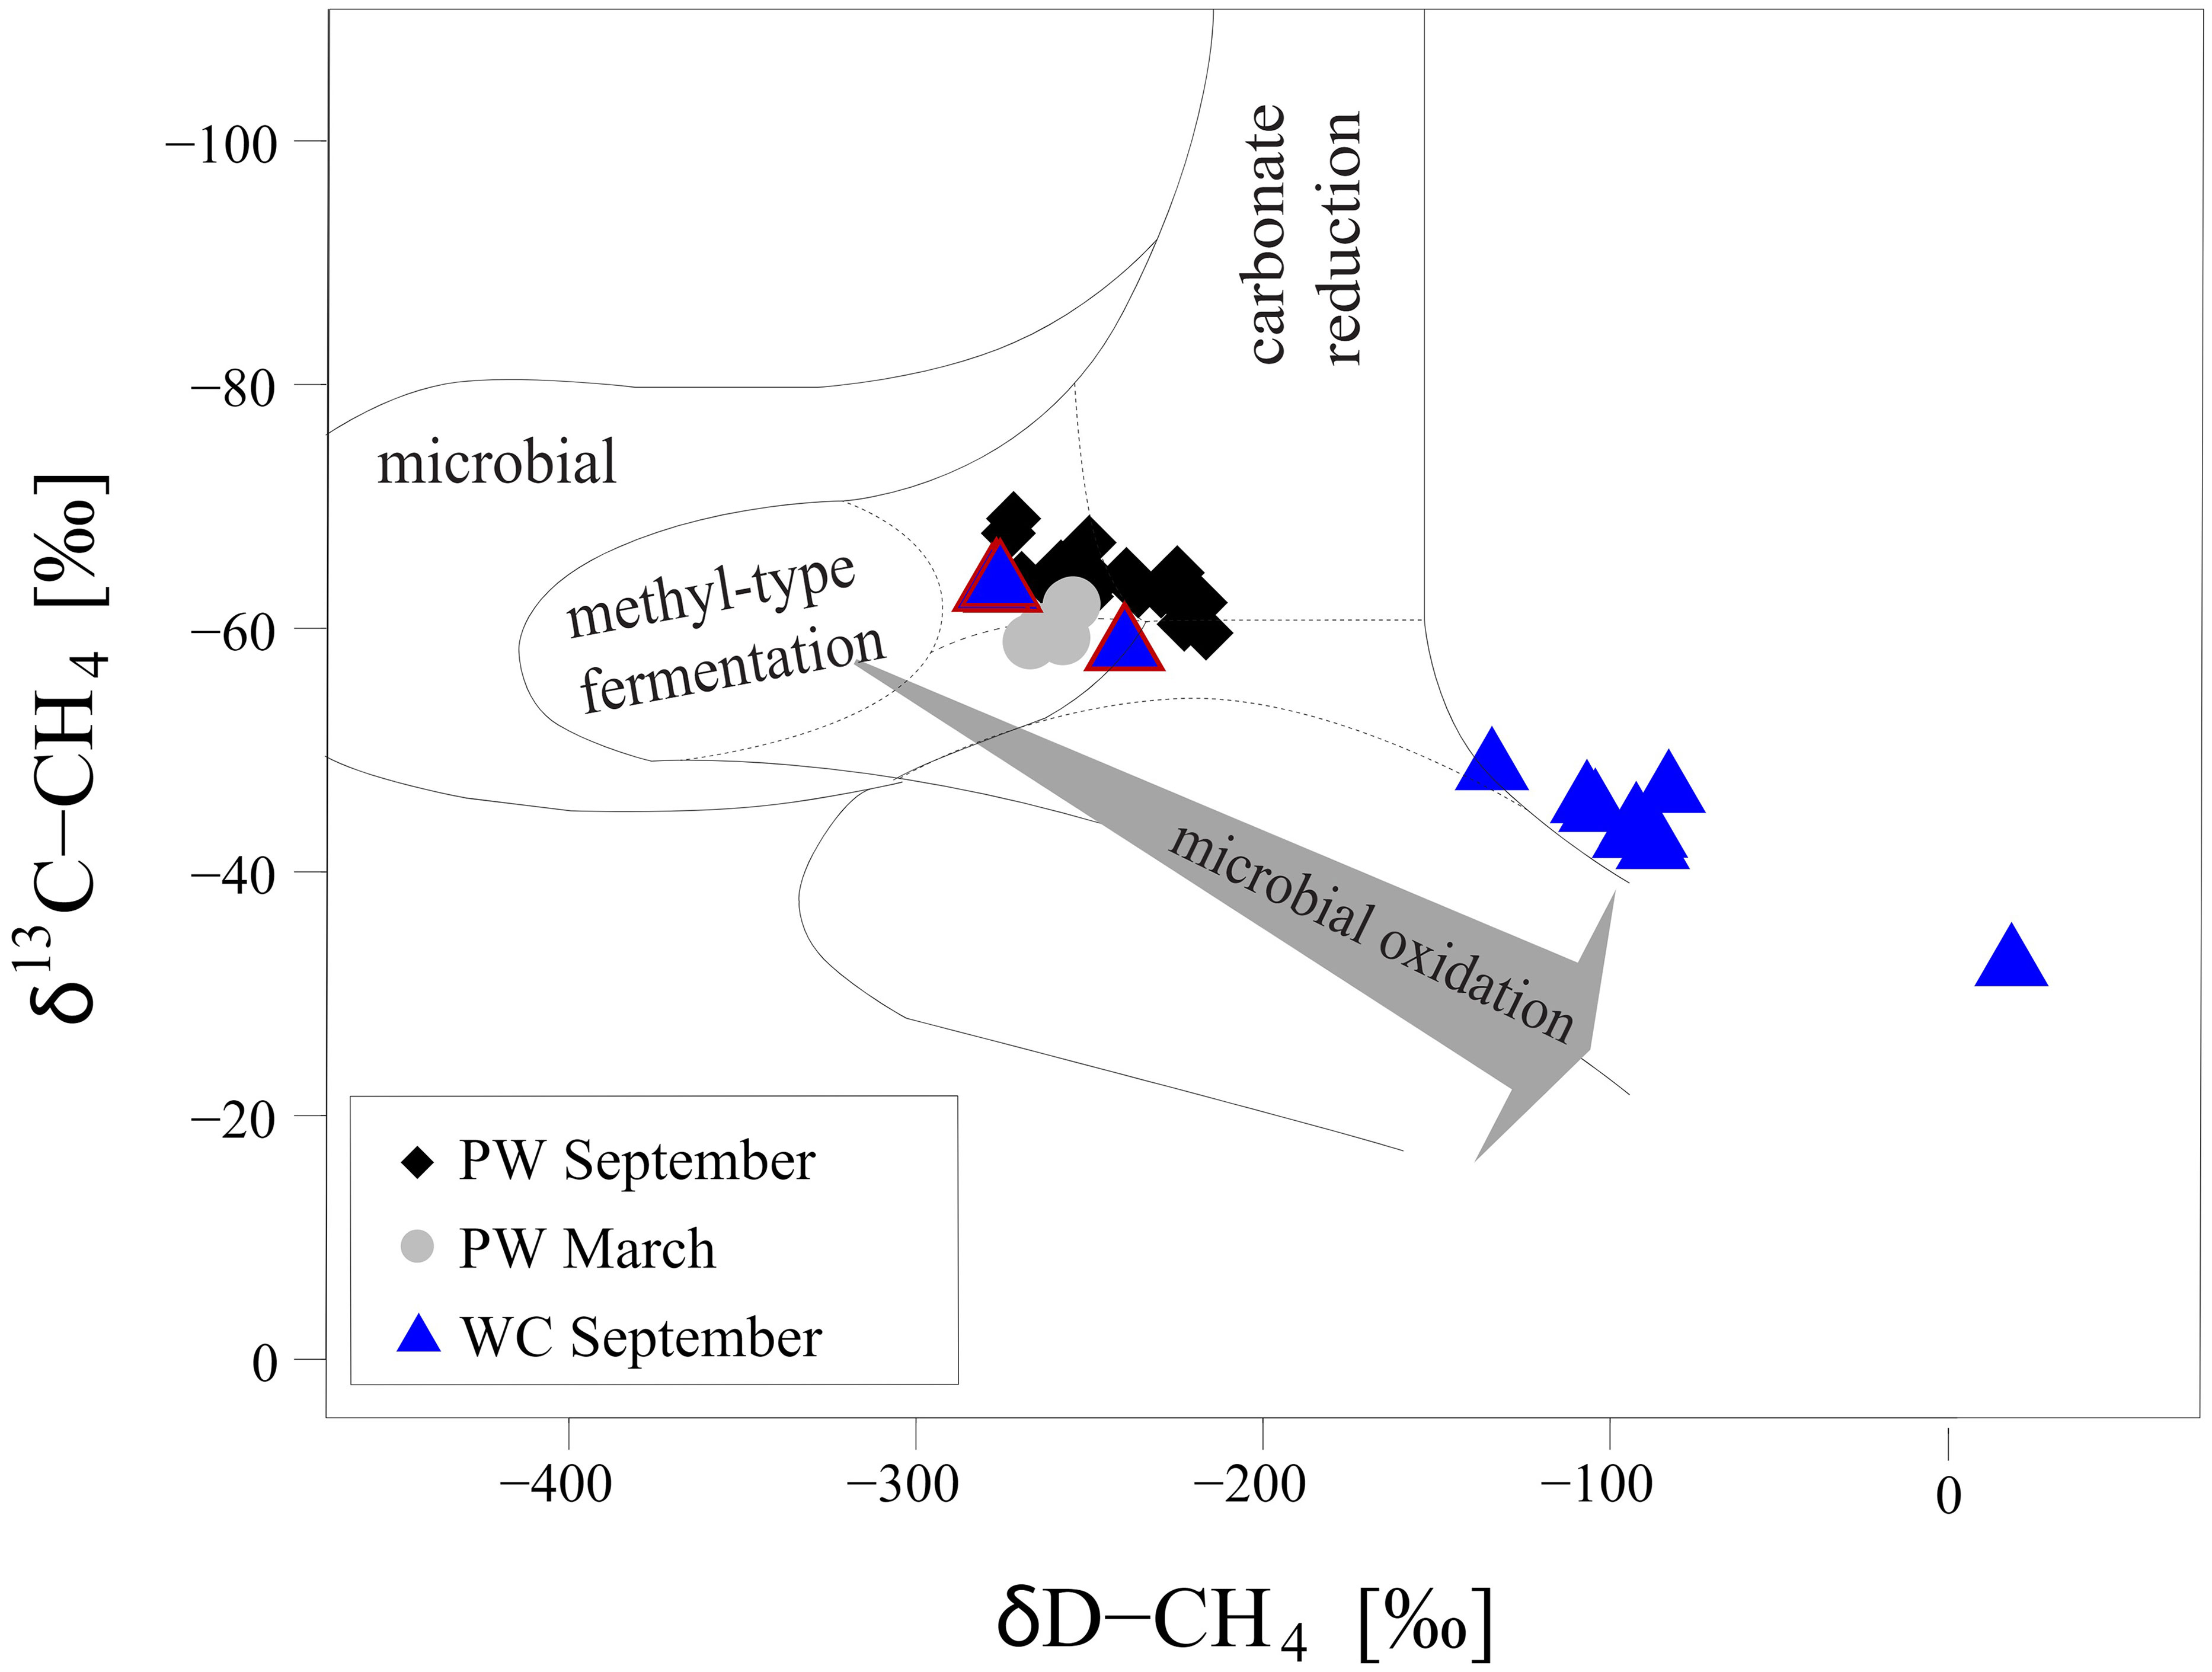
Figure 6 Classification of the sources of CH4 based on the CH4 isotopic composition (δ13C-CH4 and δD-CH4) modified after (Whiticar, 1999; Egger et al., 2017). Grey circles indicate data for the porewater from March 2020. Black diamonds represent samples from the porewater in September 2020. Blue triangles show the isotopic composition of the water column samples in September 2020. The triangles outlined in red indicate samples taken below the oxycline (including the sample at the oxycline, from 35m). The grey arrow indicates the direction of the shift in isotopic composition due to microbial CH4 oxidation (Whiticar, 1999).
The combination of high rates of CH4 production and inefficient CH4 oxidation leads to release of CH4 into the water column in both March and September. Our calculated benthic release rates of CH4 (1.1 and 2.7 mmol m-2 d-1) for these two months are in line with the values of 0.6 - 2.2 mmol m-2 d-1 previously calculated for Scharendijke (Egger et al., 2016) and are higher than the average diffusive flux of methane from inner shelf sediments determined in a recent data compilation (0.57 mmol m-2 d-1; Egger et al., 2018). Methane also will have escaped from the sediment via ebullition. We base this on the fact that the porewaters were strongly oversaturated with CH4 (Figure 2G) and on visual observations of the emergence of bubbles in the surface water during sampling, especially in September.
4.2 Dynamics of CH4 in the water column
The fate of the CH4 in the water column depends strongly on the extent of stratification of the water column and the resulting oxygen dynamics. In March, when the water column was fully mixed and oxygenated, CH4 was removed aerobically near the sediment-water interface, likely both in the surface sediment and bottom water. In September, when the water column was stratified, CH4 diffused out of the sediment and accumulated in the anoxic bottom waters to concentrations of ~73 µmol L-1 (Figure 4J). These values are at the high end of the range of concentrations observed in waters of other eutrophic coastal environments. For example, maximum CH4 concentrations of only ~1.5 µmol L-1 and 0.3 µmol L-1 were recently reported for bottom waters in Mariager Fjord and in Boknis Eck, respectively (Steinle et al., 2017; Steinsdóttir et al., 2022). In Chesapeake Bay, however, bottom water CH4 concentrations are more comparable at values of ~ 40 µmol L-1 (Gelesh et al., 2016). Importantly, the bottom water salinity at Scharendijke is much higher than that at the sites mentioned above (~31 versus 20-24). Thus, even in coastal areas with high sulphate concentrations, intense eutrophication can lead to a strong accumulation of CH4 in stratified water columns.
Water column CH4 can be removed through aerobic and anaerobic oxidation. At our study site, we found a distinct increase in δ13C-CH4 and δD-CH4 between 35 and 25 m in September (Figures 4K, L) pointing towards intense CH4 oxidation near the oxycline (Figure 6). The strong decrease in oxygen concentrations in this zone suggests that substantial CH4 removal occurred via aerobic pathways. The isotopic fractionation factor (α) calculated for this zone assuming Rayleigh distillation was 1.008, which falls within the range reported for aerobic CH4 oxidation (1.002 – 1.035; Grant and Whiticar, 2002). These results imply that 98% of methane is oxidized in the water column. However, we note that the isotopic signature of methane may be affected by ebullition and bubble dissolution. Hence the calculated fractionation factor and removal efficiency should be seen as approximations only. Importantly, removal also occurred near the oxycline, presumably through nitrification. However, no accumulation of was observed near the oxycline, which is likely due to its immediate reduction via denitrification (Venetz et al., 2022). Nitrate removal could also potentially be linked to anaerobic CH4 oxidation as the zone of decreasing CH4 concentrations overlaps with the zone where is removed and, hence, where is produced and reduced. The profiles of particulate Fe and Mn suggest that both Fe and Mn oxides are present in the zone of CH4 removal and hence could contribute to CH4 oxidation as well. Where metal oxides meet H2S, Fe and Mn reduction coupled to CH4 oxidation will be limited because of rapid metal oxide reduction with H2S. Particulate Fe below the oxycline presumably consists mostly of FeS2.
The mass balance calculations at the oxycline show that the downward flux of electron acceptors is lower than the upward flux of electron donors (Table 1). This imbalance must be even larger as the calculations do not include two other electron donors: hydrogen sulfide and sinking organic matter. Such an imbalance could indicate an upward movement of the oxycline in the water column. However, the annual trends in water column oxygen (Figure 1C) show an opposite trend with a deepening of the oxycline in September followed by its disappearance in October when the water column becomes fully mixed. Hence, the most likely explanation is an underestimation of the downward flux of key electron acceptors, in this case, oxygen and metal oxides. For oxygen, occasional lateral influxes of more saline oxygenated waters from the North Sea (e.g. Hagens et al., 2015) or periods of more intense vertical mixing could play a role. Furthermore, we may have underestimated the sinking speed of the Fe and Mn oxides, since this is strongly dependent on the diameter and density of the particles and hence can strongly vary between systems (Neretin et al., 2003). In this case, a 4-fold higher sinking speed could explain the current imbalance in the budget. This also implies that there is potential for metal oxide reduction in CH4 oxidation in the water column.
The strong oxidation signal in the CH4 isotopes and decrease in CH4 concentrations around the oxycline in September point to CH4 removal. However, not all the CH4 is removed since we find a diffusive flux of CH4 to the atmosphere in a range of 0.09 to 0.37 mmol m-2 d-1. This atmospheric CH4 flux range is higher than the range reported for the Boknis Eck (0.0025 – 0.0062 mmol m-2 d-1 in September 2014; Steinle et al., 2017) but is comparable to that observed in the Belgian coastal zone in summer and fall (0.43 mmol m-2 d-1 and 0.07 mmol m-2 d-1, respectively; Borges et al., 2016). In addition to the diffusive flux, CH4 is transported to the atmosphere via ebullition. Bubbles reaching the surface were frequently observed during the September sampling trip. Hence, the elevated concentrations of methane and slight depletion in δ13C and δD in the upper 6 m of the water column could be a result of bubble dissolution, although we cannot completely rule out an additional contribution from aerobic production of methane by phytoplankton (e.g. Karl et al., 2008). Regardless of the mechanism, we conclude that seasonally stratified, eutrophic coastal marine waters may be more important as potential sources of CH4 to the atmosphere than generally thought (Naqvi et al., 2010; Steinsdóttir et al., 2022). Since eutrophication is increasingly leading to anoxia in coastal systems worldwide (Breitburg et al., 2018), further research on their role as a source of methane to the atmosphere is warranted.
4.3 Microbiological evidence for methane oxidation
Methylomonadaceae (Figure 5A) were most abundant near the oxycline indicating that these microorganisms could remove CH4 at the expense of oxygen or other electron acceptors. In the upper and lower parts of the oxycline one would expect Methylomonadaceae with a high affinity to CH4 and oxygen, respectively. In the middle of the oxycline, more versatile and flexible Methylomonadaceae would likely be dominant with intermediate affinity to both O2 and CH4 (Steinsdóttir et al., 2022). In all cases, the methanotrophs would have to compete with heterotrophs for available electron acceptors. Below the oxycline, the methanotrophs could switch to other modes of metabolism using or metal-oxides as terminal electron acceptors, reserving the limiting amounts of oxygen to activate CH4 to methanol (Kits et al., 2015; Zheng et al., 2020). Methanol or other fermentative products could serve as an electron donor for respiration either in full or partial denitrification. Hence, aerobic methanotrophs could be involved both in CH4 and removal near the oxycline.
Despite the presence of at some depths, no 16S rRNA gene sequences of the intra-aerobic Methylomirabilis were detected although their presence in the water column of marine oxygen minimum zones has been reported (Padilla et al., 2016; Thamdrup et al., 2019). At and below the oxycline, however, 16S rRNA gene sequences of archaeal methanotrophs (Methanoperedenaceae) were identified (Figure 5B), indicating that in the anoxic waters, CH4 removal might be coupled to reduction of or Fe and/or Mn oxides, although the contribution to total CH4 removal is likely small. Some of the produced and/or might be used by anammox bacteria, although only a few 16S rRNA sequences of anammox were recovered in the amplicon set (Venetz et al., 2022). To our knowledge this is the first report of Methanoperedenaceae in marine waters in a zone of CH4 oxidation. The source of CH4 in the water column, the pathways of CH4 removal and key microorganisms involved, namely Methylomonadaceae and Methanoperedenaceae, are summarized in a schematic (Figure 7).
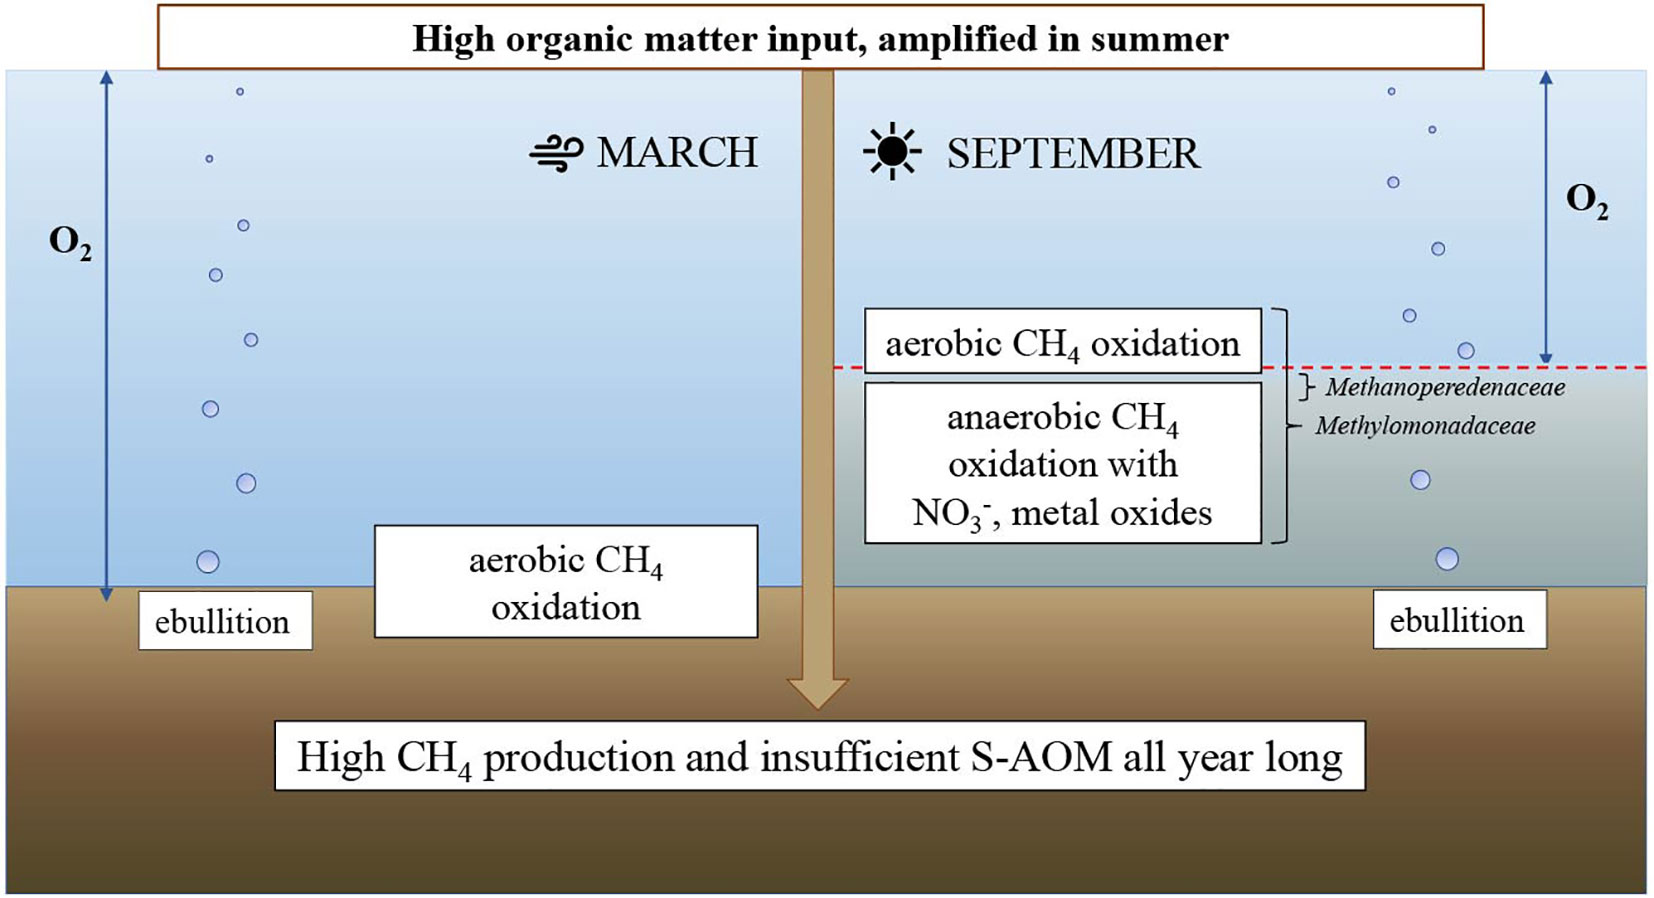
Figure 7 Schematic of seasonal changes in methane dynamics at Scharendijke in 2020.
5 Conclusions
Here, we show that the sediments from a site (water depth of 45 m) in eutrophic, seasonally anoxic marine Lake Grevelingen act as a major source of CH4 to the overlying waters, both in March and September 2020. The limited oxidation signal in porewater δ13C-CH4 and δD-CH4 profiles for spring and the end of summer confirms release of CH4 to the water column through by-passing of the shallow sulfate-methane-transition-zone (SMTZ; ~5-15 cm depth). In March 2020, most of this CH4 was removed aerobically near the sediment-water interface. In September, however, CH4 accumulated in the stratified, anoxic bottom waters and a strong counter gradient with oxygen developed around 35 m depth. Depth profiles of , and dissolved and particulate Fe and Mn point towards active nitrogen and metal cycling near the oxycline. Increased values of δ13C-CH4 and δD-CH4 in the same depth zone, relative to those in the bottom water, indicate oxidative removal of the CH4. Based on 16S rRNA gene data we conclude that aerobic CH4 oxidizers (Methylomonadaceae) are likely involved in this removal, and possibly also contribute to low rates of anaerobic removal below the oxycline. The presence of anaerobic archaea (Methanoperedenaceae) also indicate anaerobic removal near the oxycline, possibly through and/or metal-oxide dependent CH4 oxidation. Importantly, CH4 concentrations in the surface waters are relatively high (~0.2 µmol L-1 CH4), which suggests a diffusive flux of CH4 to the atmosphere. Visual observations of bubbles in the surface waters point towards a possible additional flux of CH4 to the atmosphere via ebullition. Our study shows that eutrophic seasonally anoxic coastal systems may release CH4 to the atmosphere, despite active microbial filtering through aerobic and anaerobic pathways. Since eutrophication and seasonal anoxia are increasingly impacting coastal environments worldwide, the role of these systems as a source of CH4 deserves further attention.
Data availability statement
The data presented in the study are deposited in the Zenodo repository, doi: 10.5281/zenodo.7548161. Sequence data has been submitted to ENA under accession number PRJEB57287.
Author contributions
OZ, CS, NvH, and MJ designed the research and wrote the paper with comments provided by all authors. OZ, NvH, and WL performed the sampling and geochemical analyses. JV and AW performed microbiological analyses with support from PD, AV, and MJ. RK and WL wrote the reactive transport model code and performed the model simulations. OZ, RK, NvH, WL, CS, MJ, and JV interpreted the data. All authors contributed to the article and approved the submitted version.
Funding
This research was financially supported by ERC Synergy grant MARIX (8540088). PD acknowledges support from NWO (VI.Veni.212.040). This work was carried out under the program of the Netherlands Earth System Science Center (NESSC 024002001) and SIAM (024002002), financially supported by the Ministry of Education, Culture and Science (OCW).
Acknowledgments
We thank the captain and crew of the R/V Navicula and A. Tramper for their support during the sampling campaigns. We are also grateful to J. Visser, H. de Waard, T. Claessen, C. van der Veen, K. Nierop and C. Mulder for analytical assistance in Utrecht.
Conflict of interest
The authors declare that the research was conducted in the absence of any commercial or financial relationships that could be construed as a potential conflict of interest.
Publisher’s note
All claims expressed in this article are solely those of the authors and do not necessarily represent those of their affiliated organizations, or those of the publisher, the editors and the reviewers. Any product that may be evaluated in this article, or claim that may be made by its manufacturer, is not guaranteed or endorsed by the publisher.
Supplementary material
The Supplementary Material for this article can be found online at: https://www.frontiersin.org/articles/10.3389/fmars.2023.1085728/full#supplementary-material
References
Aben R. C. H., Barros N., Van Donk E., Frenken T., Hilt S., Kazanjian G., et al. (2017). Cross continental increase in methane ebullition under climate change. Nat. Commun. 8, 1–8. doi: 10.1038/s41467-017-01535-y
APHA (2005). APHA, (2005), standard methods for the examination of water and wastewater. 21th ed (Washington DC: American Public Health Association).
Bange H. W., Bergmann K., Hansen H. P., Kock A., Koppe R., Malien F., et al. (2010). Dissolved methane during hypoxic events at the boknis eck time series station (Eckernförde bay, SW Baltic Sea). Biogeosciences 7, 1279–1284. doi: 10.5194/bg-7-1279-2010
Barber T. R., Burke R. A. Jr., Sackett W. M. (1988). Diffusive flux of methane from warm wetlands. Global Biogeochem. Cycles 2, 411–425. doi: 10.1029/GB002i004p00411
Beal E. J., House C. H., Orphan V. J. (2009). Manganese-and iron-dependent marine methane oxidation. Science 325, 184–187. doi: 10.1126/science.1169984
Blasing T. J., Smith K. (2016). “Recent greenhouse gas concentrations,” in Carbon dioxide information analysis center (Oak Ridge National Laboratory, U.S. Department of Energy). doi: 10.3334/CDIAC/atg.032
Borges A., Abril G. (2011). 5.04-carbon dioxide and methane dynamics in estuaries. Treatise Estuar. Coast. Sci. 4, 119–161. doi: 10.1016/B978-0-12-374711-2.00504-0
Borges A. V., Champenois W., Gypens N., Delille B., Harlay J. (2016). Massive marine methane emissions from near-shore shallow coastal areas. Sci. Rep. 6, 2–9. doi: 10.1038/srep27908
Brass M., Röckmann T. (2010). Continuous-flow isotope ratio mass spectrometry method for carbon and hydrogen isotope measurements on atmospheric methane. Atmos. Meas. Tech. 3, 1707–1721. doi: 10.5194/amt-3-1707-2010
Breitburg D., Levin L. A., Oschlies A., Grégoire M., Chavez F. P., Conley D. J., et al. (2018). Declining oxygen in the global ocean and coastal waters. Science 359, eaam7240. doi: 10.1126/science.aam7240
Capelle D. W., Hallam S. J., Tortell P. D. (2019). Time-series CH4 measurements from saanich inlet, BC, a seasonally anoxic fjord. Mar. Chem. 215, 103664. doi: 10.1016/j.marchem.2019.103664
Chronopoulou P. M., Shelley F., Pritchard W. J., Maanoja S. T., Trimmer M. (2017). Origin and fate of methane in the Eastern tropical north pacific oxygen minimum zone. ISME J. 11, 1386–1399. doi: 10.1038/ismej.2017.6
Claff S. R., Sullivan L. A., Burton E. D., Bush R. T. (2010). A sequential extraction procedure for acid sulfate soils: partitioning of iron. Geoderma 155, 224–230. doi: 10.1016/j.geoderma.2009.12.002
Cline J. D. (1969). Spectrophotometric determination of hydrogen sulfide in natural waters 1. Limnol. Oceanogr. 14, 454–458. doi: 10.4319/lo.1969.14.3.0454
Egger M., Hagens M., Sapart C. J., Dijkstra N., van Helmond N. A. G. M., Mogollón J. M., et al. (2017). Iron oxide reduction in methane-rich deep Baltic Sea sediments. Geochim. Cosmochim. Acta 207, 256–276. doi: 10.1016/j.gca.2017.03.019
Egger M., Lenstra W., Jong D., Meysman F. J. R., Sapart C. J., van der Veen C., et al. (2016). Rapid sediment accumulation results in high methane effluxes from coastal sediments. PloS One 11, 1–22. doi: 10.1371/journal.pone.0161609
Egger M., Rasigraf O., Sapart C. J., Jilbert T., Jetten M. S. M., Rockmann T., et al. (2015). Iron-mediated anaerobic oxidation of methane in brackish coastal sediments. Environ. Sci. Technol. 49, 277–283. doi: 10.1021/es503663z
Egger M., Riedinger N., Mogollón J. M., Jørgensen B. B. (2018). Global diffusive fluxes of methane in marine sediments. Nat. Geosci. 11, 421–425. doi: 10.1038/s41561-018-0122-8
Ettwig K. F., Butler M. K., Le Paslier D., Pelletier E., Mangenot S., Kuypers M. M. M., et al. (2010). Nitrite-driven anaerobic methane oxidation by oxygenic bacteria. Nature 464, 543–548. doi: 10.1038/nature08883
Ettwig K. F., Van Alen T., van de Pas-Schoonen K. T., Jetten M. S. M., Strous M. (2009). Enrichment and molecular detection of denitrifying methanotrophic bacteria of the NC10 phylum. Appl. Environ. Microbiol. 75, 3656–3662. doi: 10.1128/AEM.00067-09
Ettwig K. F., Zhu B., Speth D., Keltjens J. T., Jetten M. S. M., Kartal B. (2016). Archaea catalyze iron-dependent anaerobic oxidation of methane. Proc. Natl. Acad. Sci. U. S. A. 113, 12792–12796. doi: 10.1073/pnas.1609534113
Froelich P. N., Klinkhammer G. P., Bender M. L., Luedtke N. A., Heath G. R., Cullen D., et al. (1979). Early oxidation of organic matter in pelagic sediments of the eastern equatorial Atlantic: suboxic diagenesis. Geochim. Cosmochim. Acta 43, 1075–1090. doi: 10.1016/0016-7037(79)90095-4
Gargett A. E. (1984). Vertical eddy diffusivity in the ocean interior. J. Mar. Res. 42, 359–393. doi: 10.1357/002224084788502756
Gelesh L., Marshall K., Boicourt W., Lapham L. (2016). Methane concentrations increase in bottom waters during summertime anoxia in the highly eutrophic estuary, Chesapeake bay, U.S.A. Limnol. Oceanogr. 61, S253–S266. doi: 10.1002/lno.10272
Gentz T. (2013). Distribution and fate of methane released from submarine sources-results of measurements using an improved in situ mass spectrometer (Germany: University of Bremen), 173.
Grant N. J., Whiticar M. J. (2002). Stable carbon isotopic evidence for methane oxidation in plumes above hydrate ridge, cascadia Oregon margin. Global Biogeochem. Cycles 16, 71-1-71–13. doi: 10.1029/2001gb001851
Grégoire M., Garçon V., Garcia H., Breitburg D., Isensee K., Oschlies A., et al. (2021). A global ocean oxygen database and atlas for assessing and predicting deoxygenation and ocean health in the open and coastal ocean. Front. Mar. Sci. 8. doi: 10.3389/fmars.2021.724913
Hagens M., Slomp C. P., Meysman F. J. R., Seitaj D., Harlay J., Borges A. V., et al. (2015). Biogeochemical processes and buffering capacity concurrently affect acidification in a seasonally hypoxic coastal marine basin. Biogeosciences 12, 1561–1583. doi: 10.5194/bg-12-1561-2015
Haroon M. F., Hu S., Shi Y., Imelfort M., Keller J., Hugenholtz P., et al. (2013). Anaerobic oxidation of methane coupled to nitrate reduction in a novel archaeal lineage. Nature 500, 567–570. doi: 10.1038/nature12375
Helz G. R., Vorlicek T. P. (2019). Precipitation of molybdenum from euxinic waters and the role of organic matter. Chem. Geol. 509, 178–193. doi: 10.1016/j.chemgeo.2019.02.001
IPCC, Core Writing Team (2007). “Climate change 2007: Synthesis report,” in Contribution of working groups I, II and III to the fourth assessment report of the intergovernmental panel on climate change. Eds. Pachauri R. K., Reisinger A. (Switzerland: IPCC, Geneva), 104.
Jørgensen B. B., Beulig F., Egger M., Petro C., Scholze C., Røy H. (2019). Organoclastic sulfate reduction in the sulfate-methane transition of marine sediments. Geochim. Cosmochim. Acta 254, 231–245. doi: 10.1016/j.gca.2019.03.016
Karl D. M., Beversdorf L., Björkman K. M., Church M. J., Martinez A., Delong E. F. (2008). Aerobic production of methane in the sea. Nat. Geosci. 1, 473–478. doi: 10.1038/ngeo234
Kemp W. M., Testa J. M., Conley D. J., Gilbert D., Hagy J. D. (2009). Temporal responses of coastal hypoxia to nutrient loading and physical controls. Biogeosciences 6, 2985–3008. doi: 10.5194/bg-6-2985-2009
Kits K. D., Klotz M. G., Stein L. Y. (2015). Methane oxidation coupled to nitrate reduction under hypoxia by the gammaproteobacterium methylomonas denitrificans, sp. nov. type strain FJG1. Environ. Microbiol. 17, 3219–3232. doi: 10.1111/1462-2920.12772
Knab N. J., Cragg B. A., Hornibrook E. R. C., Holmkvist L., Pancost R. D., Borowski C., et al. (2009). Regulation of anaerobic methane oxidation in sediments of the black Sea. Biogeosciences 6, 1505–1518. doi: 10.5194/bg-6-1505-2009
Knittel K., Boetius A. (2009). Anaerobic oxidation of methane: progress with an unknown process. Annu. Rev. Microbiol. 63, 311–334. doi: 10.1146/annurev.micro.61.080706.093130
Lagerström M. E., Field M. P., Séguret M., Fischer L., Hann S., Sherrell R. M. (2013). Automated on-line flow-injection ICP-MS determination of trace metals (Mn, fe, Co, Ni, Cu and zn) in open ocean seawater: Application to the GEOTRACES program. Mar. Chem. 155, 71–80. doi: 10.1016/j.marchem.2013.06.001
Lenstra W. K., Klomp R., Molema F., Behrends T., Slomp C. P. (2021). A sequential extraction procedure for particulate manganese and its application to coastal marine sediments. Chem. Geol. 584, 120538. doi: 10.1016/j.chemgeo.2021.120538
Lenstra W. K., van Helmond N. A. G. M., Żygadłowska O. M., van Zummeren R., Witbaard R., Slomp C. P. (2022). Sediments as a source of iron, manganese, cobalt and nickel to continental shelf waters (Louisiana, gulf of Mexico). Front. Mar. Sci. 9. doi: 10.3389/fmars.2022.811953
Lewis B. L., Landing W. M. (1991). The biogeochemistry of manganese and iron in the black Sea. Deep Sea Res. Part A. Oceanogr. Res. Pap. 38, S773–S803. doi: 10.1016/S0198-0149(10)80009-3
Martens C. S., Berner R. A. (1974). Methane production in the interstitial waters of sulfate-depleted marine sediments. Science 185, 1167–1169. doi: 10.1126/science.185.4157.1167
Ma X., Sun M., Lennartz S. T., Bange H. W. (2020). A decade of methane measurements at the boknis eck time series station in eckernförde bay (southwestern Baltic Sea). Biogeosciences 17, 3427–3438. doi: 10.5194/bg-17-3427-2020
McGinnis D. F., Greinert J., Artemov Y., Beaubien S. E., Wüest A. (2006). Fate of rising methane bubbles in stratified waters: How much methane reaches the atmosphere? J. Geophys. Res. Ocean. 111, C09007. doi: 10.1029/2005JC003183
Myhre C. L., Ferré B., Platt S. M., Silyakova A., Hermansen O., Allen G., et al. (2016). Extensive release of methane from Arctic seabed west of Svalbard during summer 2014 does not influence the atmosphere. Geophys. Res. Lett. 43, 4624–4631. doi: 10.1002/2016GL068999
Naqvi S. W. A., Bange H. W., FarÃ-As L., Monteiro P. M. S., Scranton M. I., Zhang J. (2010). Marine hypoxia/anoxia as a source of CH 4 and n 2O. Biogeosciences 7, 2159–2190. doi: 10.5194/bg-7-2159-2010
National Oceanic and Atmospheric Administration (2022). Available at: https://www.noaa.gov/news-release/increase-in-atmospheric-methane-set-another-record-during-2021 (Accessed September 9, 2022).
Neretin L. N., Pohl C., Jost G., Leipe T., Pollehne F. (2003). Manganese cycling in the gotland deep, Baltic Sea. Mar. Chem. 82, 125–143. doi: 10.1016/S0304-4203(03)00048-3
Oswald K., Milucka J., Brand A., Hach P., Littmann S., Wehrli B., et al. (2016). Aerobic gammaproteobacterial methanotrophs mitigate methane emissions from oxic and anoxic lake waters. Limnol. Oceanogr. 61, S101–S118. doi: 10.1002/lno.10312
Padilla C. C., Bristow L. A., Sarode N., Garcia-Robledo E., Gómez Ramírez E., Benson C. R., et al. (2016). NC10 bacteria in marine oxygen minimum zones. ISME J. 10, 2067–2071. doi: 10.1038/ismej.2015.262
Raiswell R., Vu H. P., Brinza L., Benning L. G. (2010). The determination of labile fe in ferrihydrite by ascorbic acid extraction: methodology, dissolution kinetics and loss of solubility with age and de-watering. Chem. Geol. 278, 70–79. doi: 10.1016/j.chemgeo.2010.09.002
Reeburgh W. S. (2007). Oceanic methane biogeochemistry. Chem. Rev. 107, 486–513. doi: 10.1021/cr050362v
Reeburgh W. S., Ward B. B., Whalen S. C., Sandbeck K. A., Kilpatrickt K. A., Kerkhof L. J. (1991). Black Sea methane geochemistry. Deep Sea Res. Part A. Oceanogr. Res. Pap. 38, S1189–S1210. doi: 10.1016/S0198-0149(10)80030-5
Rosentreter J. A., Borges A. V., Deemer B. R., Holgerson M. A., Liu S., Song C., et al. (2021). Half of global methane emissions come from highly variable aquatic ecosystem sources. Nat. Geosci. 14, 225–230. doi: 10.1038/s41561-021-00715-2
Sapart C. J., van der Veen C., Vigano I., Brass M., van de Wal R. S. W., Bock M., et al. (2011). Simultaneous stable isotope analysis of methane and nitrous oxide on ice core samples. Atmos. Meas. Tech. 4, 2607–2618. doi: 10.5194/amt-4-2607-2011
Saunois M., Bousquet P., Poulter B., Peregon A., Ciais P., Canadell J. G., et al. (2016). The global methane budget 2000-2012. Earth Syst. Sci. Data 8, 697–751. doi: 10.5194/essd-8-697-2016
Schmid M., Ostrovsky I., McGinnis D. F. (2017). Role of gas ebullition in the methane budget of a deep subtropical lake: What can we learn from process-based modeling? Limnol. Oceanogr. 62, 2674–2698. doi: 10.1002/lno.10598
Sivan O., Adler M., Pearson A., Gelman F., Bar-Or I., John S. G., et al. (2011). Geochemical evidence for iron-mediated anaerobic oxidation of methane. Limnol. Oceanogr. 56, 1536–1544. doi: 10.4319/lo.2011.56.4.1536
Soetaert K., Meysman F. (2012). Reactive transport in aquatic ecosystems: Rapid model prototyping in the open source software r. Environ. Model. Software 32, 49–60. doi: 10.1016/j.envsoft.2011.08.011
Soetaert K., Petzoldt T., Setzer R. W. (2010). Solving differential equations in r: package deSolve. J. Stat. Software 33, 1–25. doi: 10.18637/jss.v033.i09
Solorzano L. (1969). Determination of ammonia in natural waters by the phenolhypochlorite method. Limnol. Oceanogr. 14, 799–801. doi: 10.4319/lo.1969.14.5.0799
Steinle L., Maltby J., Treude T., Kock A., Bange H. W., Engbersen N., et al. (2017). Effects of low oxygen concentrations on aerobic methane oxidation in seasonally hypoxic coastal waters. Biogeosciences 14, 1631–1645. doi: 10.5194/bg-14-1631-2017
Steinsdóttir H. G. R., Schauberger C., Mhatre S., Thamdrup B., Bristow L. A. (2022). Aerobic and anaerobic methane oxidation in a seasonally anoxic basin. Limnol. Oceanogr. 67, 1257–1273. doi: 10.1002/lno.12074
Sulu-Gambari F., Hagens M., Behrends T., Seitaj D., Meysman F. J. R., Middelburg J., et al. (2018). Phosphorus cycling and burial in sediments of a seasonally hypoxic marine basin. Estuaries Coasts 41, 921–939. doi: 10.1007/s12237-017-0324-0
Sulu-Gambari F., Roepert A., Jilbert T., Hagens M., Meysman F. J. R., Slomp C. P. (2017). Molybdenum dynamics in sediments of a seasonally-hypoxic coastal marine basin. Chem. Geol. 466, 627–640. doi: 10.1016/j.chemgeo.2017.07.015
Sulu-Gambari F., Seitaj D., Meysman F. J. R., Schauer R., Polerecky L., Slomp C. P. (2016). Cable bacteria control iron-phosphorus dynamics in sediments of a coastal hypoxic basin. Environ. Sci. Technol. 50, 1227–1233. doi: 10.1021/acs.est.5b04369
Thamdrup B., Steinsdóttir H. G. R., Bertagnolli A. D., Padilla C. C., Patin N. V., Garcia-Robledo E., et al. (2019). Anaerobic methane oxidation is an important sink for methane in the ocean’s largest oxygen minimum zone. Limnol. Oceanogr. 64, 2569–2585. doi: 10.1002/lno.11235
Thang N. M., Brüchert V., Formolo M., Wegener G., Ginters L., Jørgensen B. B., et al. (2013). The impact of sediment and carbon fluxes on the biogeochemistry of methane and sulfur in littoral Baltic Sea sediments (Himmerfjärden, Sweden). Estuaries Coasts 36, 98–115. doi: 10.1007/s12237-012-9557-0
van Haren H. (2019). Internal wave mixing in warming lake grevelingen. Estuar. Coast. Shelf Sci. 226, 106298. doi: 10.1016/j.ecss.2019.106298
Van Santvoort P. J. M., De Lange G. J., Thomson J., Colley S., Meysman F. J. R., Slomp C. P. (2002). Oxidation and origin of organic matter in surficial Eastern Mediterranean hemipelagic sediments. Aquat. Geochem. 8, 153–175. doi: 10.1023/A:1024271706896
Venetz J., Żygadłowska O. M., Lenstra W. K., Van Helmond N. A. G. M., Dalcin Martins P., Wallenius A. J., et al. (2022). Versatile methanotrophs form an active methane biofilter in the oxycline of a seasonally stratified coastal basin. bioRxiv 2022, 10.28.513710. doi: 10.1101/2022.10.28.513710
Wallace P. J., Dickens G. R., Paull C. K., Ussler W. (2000). Effects of core retrieval and degassing on the carbon isotope composition of methane in gas hydrate-and free gas-bearing sediments from the Blake ridge. in Proceedings of the ocean drilling program. Sci. Results 164, 101–112. doi: 10.2973/odp.proc.sr.164.209.2000
Wallenius A. J., Dalcin Martins P., Slomp C. P., Jetten M. S. M. (2021). Anthropogenic and environmental constraints on the microbial methane cycle in coastal sediments. Front. Microbiol. 12. doi: 10.3389/fmicb.2021.631621
Welte C. U. (2018). Revival of archaeal methane microbiology. mSystems 3, e00181-17. doi: 10.1128/msystems.00181-17
Welte C. U., Rasigraf O., Vaksmaa A., Versantvoort W., Arshad A., den Camp H. J. M., et al. (2016). Nitrate-and nitrite-dependent anaerobic oxidation of methane. Environ. Microbiol. Rep. 8, 941–955. doi: 10.1111/1758-2229.12487
Wetsteijn L. (2011). “Grevelingenmeer: meer kwetsbaar?,” in Een beschrijving van de ecologische ontwikkelingen voor de periode 1999 t/m 2008–2010 in vergelijking met de periode 1990 t/m 1998 (Lelystad, the Netherlands: RWS Waterdienst), 163.
Whiticar M. J. (1999). Carbon and hydrogen isotope systematics of bacterial formation and oxidation of methane. Chem. Geol. 161, 291–314. doi: 10.1016/S0009-2541(99)00092-3
Keywords: methane oxidation, coastal, nitrogen, iron, manganese, oxygen
Citation: Żygadłowska OM, Venetz J, Klomp R, Lenstra WK, van Helmond NAGM, Röckmann T, Wallenius AJ, Martins PD, Veraart AJ, Jetten MSM and Slomp CP (2023) Pathways of methane removal in the sediment and water column of a seasonally anoxic eutrophic marine basin. Front. Mar. Sci. 10:1085728. doi: 10.3389/fmars.2023.1085728
Received: 31 October 2022; Accepted: 11 January 2023;
Published: 26 January 2023.
Edited by:
Johan Schijf, University of Maryland, College Park, United StatesReviewed by:
Laura Lapham, University of Maryland, College Park, United StatesJohn Kessler, University of Rochester, United States
Sebastiaan van de Velde, Université, libre de Bruxelles, Belgium
Copyright © 2023 Żygadłowska, Venetz, Klomp, Lenstra, van Helmond, Röckmann, Wallenius, Martins, Veraart, Jetten and Slomp. This is an open-access article distributed under the terms of the Creative Commons Attribution License (CC BY). The use, distribution or reproduction in other forums is permitted, provided the original author(s) and the copyright owner(s) are credited and that the original publication in this journal is cited, in accordance with accepted academic practice. No use, distribution or reproduction is permitted which does not comply with these terms.
*Correspondence: Olga M. Żygadłowska, by5tLnp5Z2FkbG93c2thQHV1Lm5s