 Shan Liu
 Juncheng Zuo2,3
 Yeqiang Shu
 Qiyan Ji
 Jinglong Yao
95% of researchers rate our articles as excellent or good
Learn more about the work of our research integrity team to safeguard the quality of each article we publish.
Find out more
ORIGINAL RESEARCH article
Front. Mar. Sci. , 07 February 2023
Sec. Physical Oceanography
Volume 10 - 2023 | https://doi.org/10.3389/fmars.2023.1084189
This article is part of the Research Topic Variability of the Coupled Physical-Biogeochemical Processes in the South China Sea View all 4 articles
Using sea surface temperature (SST) data from satellite observations and reanalysis, we revealed the long-term trend of coastal upwelling in the South China Sea (SCS) during 1982–2020. An upwelling index (topographic position index, TPI), defined as the SST difference between the center cell and its neighbors, was used to quantify the upwelling intensity. There are three typical regions (eastern Guangdong, eastern Hainan, and eastern Vietnam) of coastal upwelling in the SCS, in which the upwelling intensity showed an increasing trend during 1982–2020. For all three regions, the upwelling intensity trend reached ~0.2 °C per 10 years in the past 40 years or so. A satellite wind dataset, CCMP, and reanalysis products, ERA5 and ORAS5, were used to discuss the causes of intensified upwelling. Based on the CCMP, the enhanced upwelling in eastern Guangdong and eastern Hainan may be more related to the strengthening of the wind stress curl. Both alongshore wind stress and wind stress curl contribute to the enhanced upwelling in southern Vietnam, and the increasing trend of upwelling in northern Vietnam is not significantly related to the wind field. This study could contribute to the understanding of coastal upwelling response to the long-term climate change in a marginal sea under the background of global warming.
Coastal upwelling is an important dynamic process in the marginal sea that transports low-temperature, high-salt, and high-nutrient subsurface water to the sea surface (García-Reyes and Largier, 2010; Shu et al., 2018a; Shu et al., 2018b). Upwelling is important for the global carbon cycle and has a significant impact on nearshore ecosystems and fisheries resources (Ryther, 1969; Barth et al., 2007; Shu et al., 2011; Lachkar, 2014). The South China Sea (SCS) is a semi-enclosed marginal sea in the northwestern Pacific Ocean, with a total area of 3.5 million km2 and an average depth of 2000 m. It is connected to the East China Sea to the northeast, the Pacific Ocean and the Sulu Sea to the east, and the Java Sea and the Indian Ocean to the southwest. There is a broad shelf in the SCS that depths shallower than 200m and isobaths roughly parallel to the continental coastline. The southwest monsoon during summer induces offshore transport in the northern and western SCS, driving upwelling in three typical areas, i.e., near the coast of southeast Vietnam, east of Hainan Island, and east of Guangdong province, China (Xie et al., 2003; Wang et al., 2020).
Wyrtki (1961) first noticed the coastal upwelling in the northern SCS (NSCS). A distinct area of low-temperature upwelling exists along the eastern coast of Guangdong (Figure 1, Box A). Southwesterly alongshore wind stress drives offshore Ekman transport and creates a pressure gradient perpendicular to the shore, resulting in a strong coastal current, bottom friction drives onshore movement and transports deep cold water upwards (Gan et al., 2009; Wang et al., 2012; Wang et al., 2013; Gan et al., 2015; Wang et al., 2015; Hu and Wang, 2016; Shu et al., 2018a). A positive local wind stress curl can lead to the enhancement of coastal upwelling in northern SCS (Jing et al., 2009; Xie et al., 2016; Hong and Zhang, 2021). The upwelling along the eastern of Guangdong (UEG) is also modulated by the Pearl River plume, which enhanced the upper off-shore current in the upper water column, thereby amplifying the inshore upwelling (Shu et al., 2011; Chen et al., 2019). The upwelling along the eastern coast of Hainan (UEH) is another typical coastal upwelling in the NSCS (Figure 1, Box B). During the upwelling season, as a result of the energetic offshore Ekman transport driven by the prevailing southwesterly monsoon, the coastal upwelling nearly completely dominates the area within 100km offshore of the east coast of Hainan Island (Xie et al., 2003; Jing et al., 2015; Lin et al., 2015). The upwelling along the southeastern coast of Vietnam (UEV)is located between 10–15° N along the WSCS coast (Figure 1, Box C1 and C2), and the main mechanism is also thought to be offshore Ekman transport induced by the southeasterly monsoon (Loick et al., 2007; Bombar et al., 2010; Loisel et al., 2017; Lu et al., 2018). Meanwhile, the Ekman pumping associated with an eastward wind jet also plays an important role in the upwelling cooling east of Vietnam (Xie et al., 2003). During summer monsoon season, abundant SST fronts contribute to the development of air-sea coupling and affects wind stress curl anomalies, which in turn influence SST and upwelling strength through Ekman pumping (Yu et al., 2020).
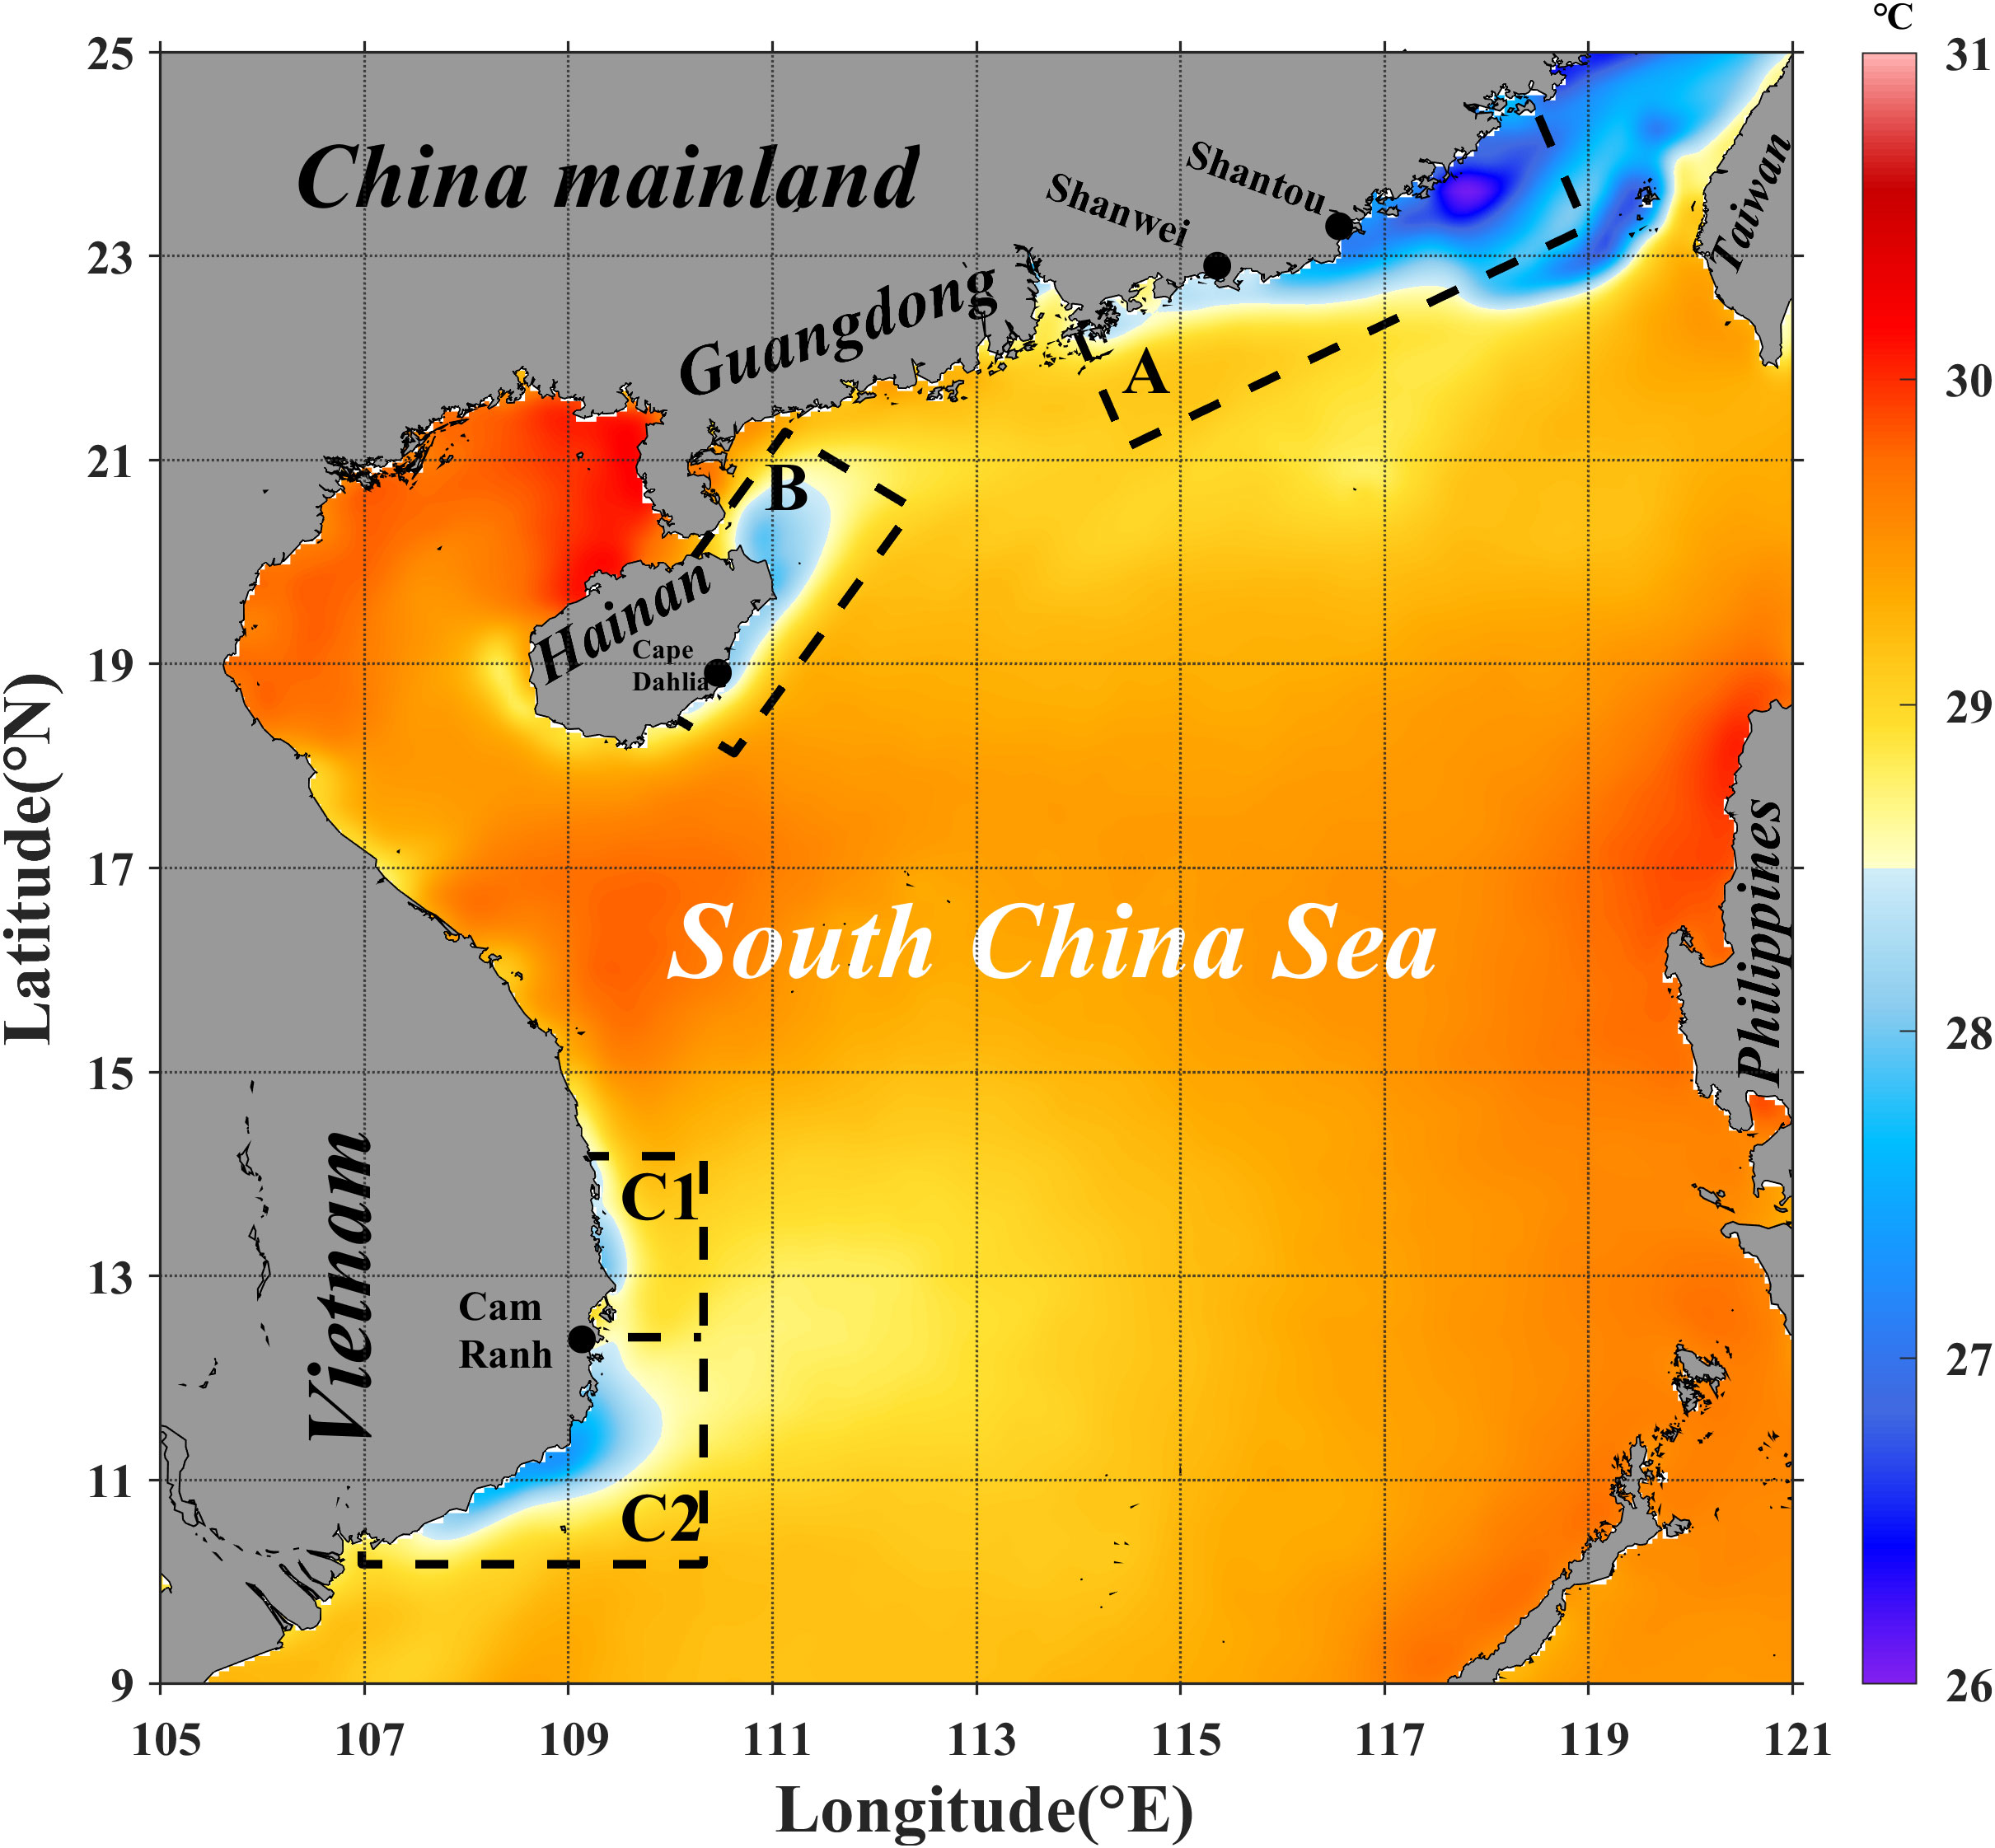
Figure 1 Time-averaged SST from OSTIA satellite data in June and July during 1982–2020 in the SCS. The black dashed boxes indicate the study areas, box A indicates the UEG area, box B indicates the UEH area, and boxes C1 and C2 indicate the northern and southern regions of the UEV (NUEV and SUEV), respectively.
There is significant interannual variability of coastal upwelling in the SCS, which is usually considered to be linked to the changes of atmospheric and oceanic circulation (Hu and Wang, 2016; Nadh et al., 2016). ENSO can largely impact on the interannual variability of mesoscale air-sea interaction, modifying local winds and thus modulating the upwelling intensity (Jing et al., 2011; Wang et al., 2012; Yang et al., 2015; Shen et al., 2018; Yu et al., 2020). In the region of UEG, alongshore wind stress is a major factor to the interannual variability of upwelling, and the large-scale current also plays an important role (Shu et al., 2018a). There is a 3-year cycle in the interannual variability of UEH (Xie et al., 2016). In addition to the Ekman transport caused by alongshore wind stress, previous studies have confirmed that wind stress curl significantly contributes to the interannual variability of UEH (Jing et al., 2011; Xie et al., 2012; Wang et al., 2013; Lin et al., 2015);. In WSCS, the interannual variabilities in the southern and northern UEV have different responses to the summer monsoon (Ngo and Hsin, 2021). Strengthening the northward monsoon is favorable to the southern UEV but suppresses the northern UEV (Thai et al., 2022).
After the 1980s, global warming entered an accelerated phase (Varela et al., 2016). In 1990, Bakun firstly proposed the hypothesis that increased thermal differences between land and sea will increase atmospheric pressure gradient forces and summer winds, thereby enhancing coastal upwelling in the eastern boundary areas, such as the coasts of California, Humboldt, Iberian/Canary, and Benguela (Bakun, 1990; Bakun et al., 2015). Previous studies have reported an overall increase in the upwelling intensity along the coast of the eastern boundary (Narayan et al., 2010; Seo et al., 2012; Sydeman et al., 2014; Varela et al., 2016; Wang et al., 2015; Quilfen et al., 2021);. The SCS is one of the sensitive regions in response to global warming (Fang et al., 2006; Park and Choi, 2017; Thompson et al., 2017; Liu et al., 2020). A positive trend of SST front has been found along the Chinese coast and the Vietnam coast (Yu et al., 2019), which may suggest an enhanced coastal upwelling. Coastal upwelling in the SCS has exhibited a significant long-term trend (Liu et al., 2009; Liu et al., 2013; Su et al., 2014; Xie et al., 2016; Hong and Zhang, 2021). Su et al. (2014) showed that the intensity of UEH weakened during 1960–2006. Using an upwelling index defined as the difference in sea surface temperature (SST) between offshore and nearshore waters, Xie et al. (2016) also found that the UEH weakened between 1982 and 2012. However, based on reconstructed SST data from 1906–1993, Liu et al. (2009) showed an intensified upwelling trend for UEH in the last century, which was consistent with the strengthened summer winds observed in the last hundred years. Hong and Zhang (2021) also suggested an intensified upwelling trend in UEG and UEH during 1979–2019 and thought that the wind stress curl was the main mechanism for the intensified upwelling. Therefore, the long-term trend of UEH is inconclusive and might be influenced by the length of time, the method of defining the upwelling index, and the chosen study area. Compared with the study in the UEH, fewer studies have been conducted on the long-term trends of UEG and UEV.
In this study, we used the SST-based topographic position index (TPI) to study coastal upwelling trends in the SCS from 1982–2020. The remaining paper is organized as follows. In Section 2, we describe the data and methods; Section 3 presents the long-term trends of the UEG, UEH, and UEV from 1982 to 2020; Section 4 discusses the potential mechanisms that cause upwelling trends, and Section 5 presents our conclusions.
OSTIA, CCMP and ERA5 have been widely used to study the long-term trend of SST or wind in coastal seas (Xie et al., 2016; Hong and Zhang, 2021; Quilfen et al., 2021; Yu and Yang, 2022), indicating that the datasets are suitable for investigating the long-term trend of the upwelling in the SCS. The SST data used in this study were derived from The Operational Sea Surface Temperature and Ice Analysis (OSTIA) system, ERA5, and Ocean Reanalysis System 5 (ORAS5), which are provided by the Met Office and European Centre for Mesoscale Weather Forecasting (ECWMF), respectively. For the calculation of alongshore wind and wind stress curl, we used the Cross-Calibrated Multi-Platform (CCMP) sea surface satellite wind data product and the same ERA5 and ORAS5 data as the SST dataset used in this study.
The OSTIA daily SST has a spatial resolution of 1/20° and can be download from https://www.ncei.noaa.gov/data/oceans/ghrsst/L4/GLOB/UKMO/OSTIA. The data is based on the UK Met Office’s Group for High Resolution Sea Surface Temperature (GHRSST), which merges AATSR, SEVIRI, AVHRR, AMSR, and TMI data using the optimal interpolation method. OSTIA SST has a root mean square error of less than 0.6°C (Donlon et al., 2012).
The CCMP contains synthetic wind field information obtained by cross-calibration and assimilation of satellite microwave remote sensing and instrumental observations of sea-surface wind data provided by NASA (http://data.remss.com/). The spatial resolution is 0.25° × 0.25° and the temporal resolution is 6h. (Atlas et al., 2011). The CCMP data is available from 1988.
ERA5 is the fifth generation ECWMF reanalysis dataset (https://cds.climate.copernicus.eu/). ERA5 uses several integrated forecasting systems developed for reanalysis, which improves the data accuracy and significantly increases the number of variables provided. The SST data has a spatial resolution of 0.125° × 0.125° and a temporal resolution of 1h and the wind field data has a spatial resolution of 0.25° × 0.25°.
ORAS5, provided by the ECMWF, offers a rich set of variables at a spatial resolution of 0.25° × 0.25° and a temporal resolution of 1 month. The SST and wind fields used in this study were downloaded from https://cds.climate.copernicus.eu/.
To remove the influence of low-frequency variability and long-term SST trends for the entire SCS, an SST-based TPI index was used to quantify the upwelling intensity and its spatial distribution (Jayaram and Kumar, 2018). The TPI is defined as the difference between a cell and the mean elevation of a cell within a predetermined radius and is calculated primarily based on the elevation value of a point and mean elevation within its neighborhood (Weiss, 2001; Huang and Feng, 2015; Shu et al., 2018b). In this study, TPI represents the difference between the central and neighboring cell SSTs. In contrast to using the SST index directly, TPI prevents the miscalculation of upwelling strength due to warming or cooling of the entire basin. The TPI can be expressed as follows:
with
where x and y are the positions of the central cell, W(x,y) is the window-averaged SST, and N is the window size. In this study, the window used for calculating the TPI value is a square neighborhood of 150 km (Shu et al., 2018b). That is, the TPI value on each cell point is its difference from the average of the surrounding cells. A positive TPI value indicates a higher SST than the surrounding sea and a negative value indicates a lower SST than the surrounding sea. Thus, a smaller TPI value indicates stronger upwelling.
The weighted cumulative topographic position index (WTPI) can further quantify changes in coastal upwelling intensity (Shu et al., 2018b). The WTPI takes into account the TPI values on each grid along with the size of the distribution of low TPI values, making it more physically meaningful when measuring upwelling intensity. As shown in the equation:
where Si is the grid area.
As coastal upwelling is typically characterized by low temperature and high salinity, SST anomalies can be important indicators of upwelling strength (Seo et al., 2012; Xie et al., 2012; Benazzouz et al., 2014). However, basin-scale SSTs exhibit significant interannual variability and long-term trends. The strengthening or weakening of basin-wide SSTs has an important impact on the determination of the upwelling strength. As shown in Figures 2A, B, in 2016, the SST off eastern Guangdong was strongly warmed by approximately 1°C higher than that in 2012 because of the super El Niño event that occurred in 2016. If the SST anomaly was used to represent upwelling intensity directly, a stronger upwelling in 2012 would be inferred. However, the strong warming over the entire basin indicates that this was not accurate (Figures 2A, B). Instead, we found that the TPI in 2016 was approximately 1°C lower than that in 2012 and the upwelling in eastern Guangdong in 2016 was stronger than that in 2012 (Figures 2C, D). We observed the same situations in the other two study areas. As shown in Figures 2E, F, I, J, the SST off the east of Hainan and east of Vietnam in 2016 was approximately 1°C higher than that in 2012, which was due to the basin-scale warming in the SCS in 2016. However, the TPIs were lower by 1 and 0.5°C off the east of Hainan and east of Vietnam, respectively (Figures 2G–K, 2H–L), indicating that the upwelling was stronger in 2016 than that in 2012 in both the east of Hainan and east of Vietnam. Therefore, the TPI was more appropriate for measuring the strength of upwelling than the SST. It is important to note that a lower TPI value indicates a stronger upwelling.
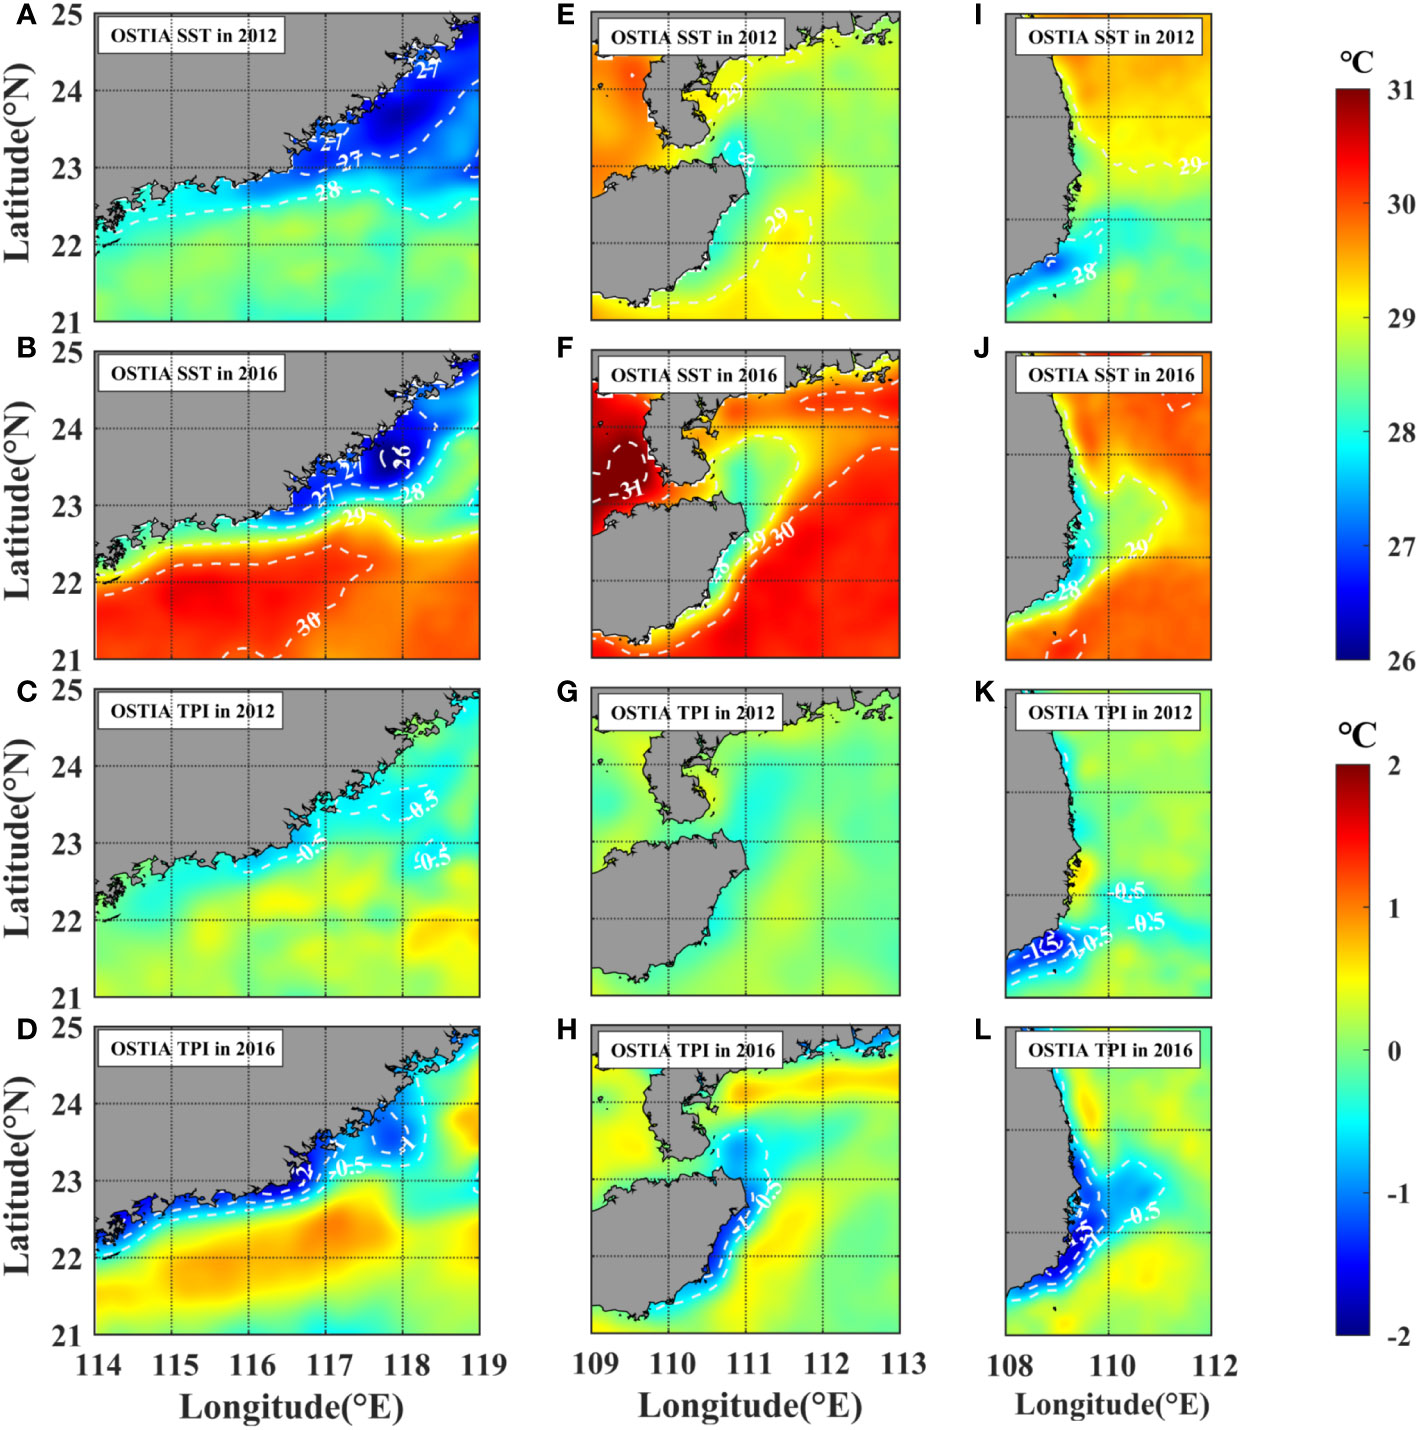
Figure 2 Comparison of the spatial distribution of SST and TPI calculated from the OSTIA data in three typical coastal upwelling regions in the SCS. The color-bar in the upper right panel corresponds to the SST in rows 1 to 2; and the color-bar in the lower right panel corresponds to the TPI in rows 3 to 4.
The climatologic TPI in the UEG, UEH, and UEV had a distribution similar to that of the low climatologic SST (Figures 3A–C and Figure 1), indicating that the upwelling areas could be well identified by the TPI. The UEG occurred mainly near Shantou and Shanwei, between 116–118.5° E, 22.6–24.1° N, with TPI values lower than −0.5°C. The UEG extended in a tongue-like pattern from southwest to northeast, with the lowest TPI values reaching −1.5°C (Figure 3A). By calculating the linear trend in TPI at each data grid, the UEG showed an intensified trend during 1982–2020 (Figure 3D), where the white scattered areas indicated a 95% significance. The largest trend occurred near the two centers of the UEG, with more than 0.1°C per decade in Shanwei and 0.2°C per decade in northeastern Shantou (Figure 3D). The climatologic TPI of the UEH was higher compared to that of the UEG, centered around 18.5–20.8° N and nearshore to the west of 111.4° E, indicating a relatively weaker upwelling in the eastern Hainan than that in east Guangdong (Figures 3A, B). The TPI distribution trend coincided roughly with that of the climatologic TPI. The strongest TPI trends occurred near 19° N, north of Cape Dahlia, reaching approximately 0.2°C per decade, and most of the other grid points at the center of the upwelling had TPI values lower than −0.1°C. The intensity and spatial scale of summer upwelling along the eastern coast of Vietnam were comparable to those of upwelling in the NSCS (Figures 3A–C). As shown in Figure 3C, the lowest TPI values were found south of Cam Ranh Bay at 10.5–12° N along the eastern coast of Vietnam, reaching −1.5°C in the central region, while TPI values also exceeded −0.5°C near 13–15°N in the north. Figure 3F shows that the spatial distribution of linear trends for UEV corresponds to the distribution of low TPI values, reaching an increase of 0.2°C per decade in the central region of upwelling in the south and lower than 0.1°C per decade in the north. Therefore, upwelling strengthened in all three regions from 1982 to 2020.
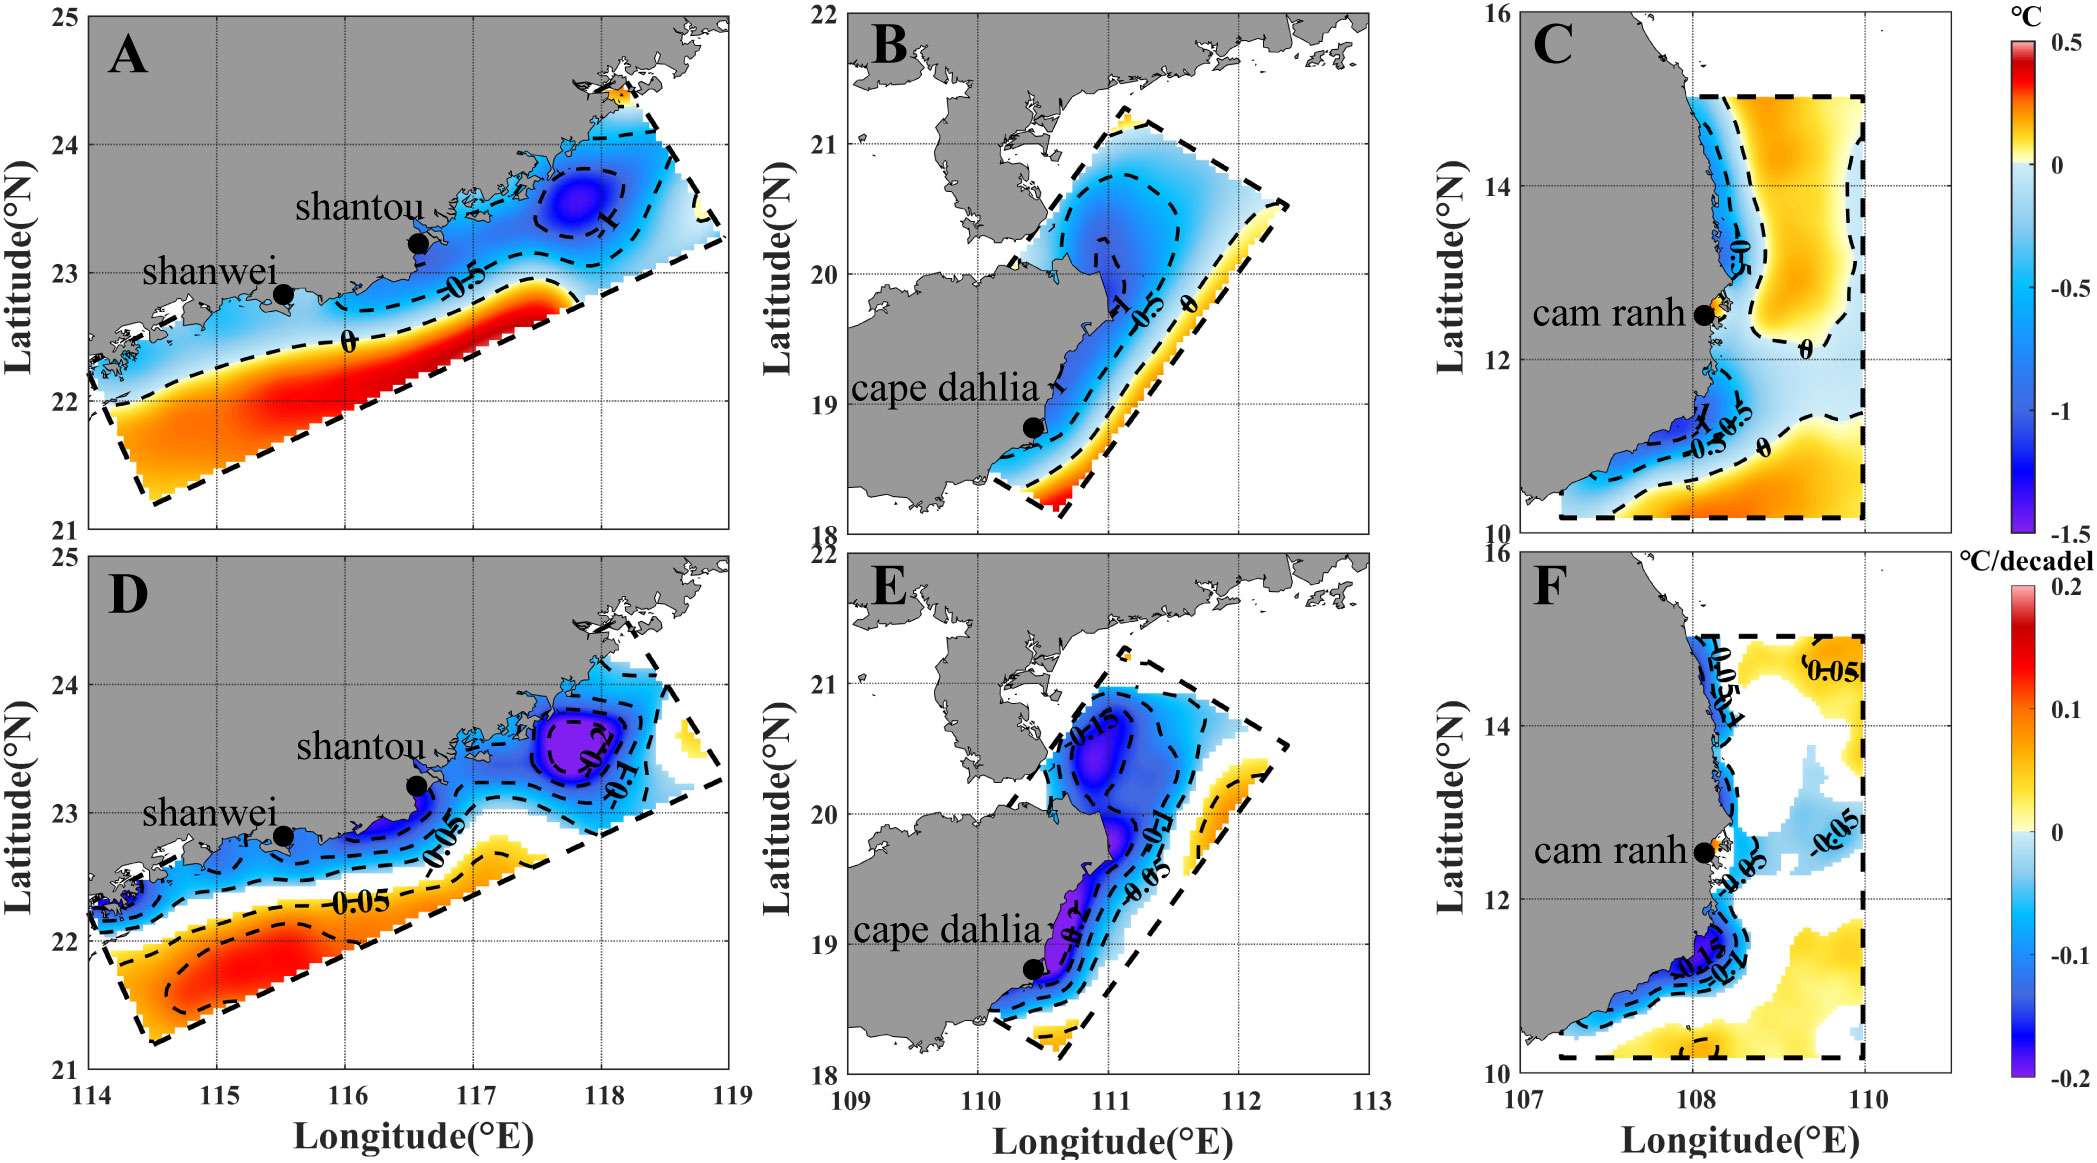
Figure 3 Spatial distribution of time-averaged TPI and trends calculated from OSTIA data in June and July during 1982–2020. Climatologic TPI of UEG (A), of UEH (B), and of UEV (C); TPI trend of UEG (D), of UEH (E), and of UEV (F). Only the area that passes the 95% significance test is shown in (D, E).
To further quantify the coastal upwelling trend in the SCS, we calculated the WTPI using the OSTIA, ERA5, and ORAS5 datasets. Meanwhlie, to remove the interannual variation signal, we did a 7-year low-pass filtering of the time series. All three datasets showed an increasing trend in the UEG over the last 40 years (Figures 4A1–A3). Among them, the strongest WTPI enhancement trends calculated by OSTIA, ERA5, and ORAS5 were −1.12 × 10⁵, −1.22 × 10⁴, and −4.04 × 10⁴°C km2 per 10 years, respectively. A similar intensifying trend in upwelling intensity also occurred in eastern Hainan and eastern Vietnam. All three datasets showed an increasing trend in UEH during 1982–2020 (Figures 4B1–B3). Although the overall intensity of the UEH was lower than that of the UEG (Figures 3A, B), a stronger trend was observed in the UEH compared with the UEG (Figures 3D, E). The WTPI enhancement trend calculated by OSTIA was −2.12 × 10⁴°C km2 per 10 years, which was higher than the two reanalysis datasets (with ERA5 of −6.22 × 10³°C km2 per 10 years and ORAS5 of −1.31 × 10⁴°C km2 per 10 years). The WTPI of UEV calculated from all three datasets also showed an intensifying trend during 1982–2020 (Figure 4C). The WTPI trend for the UEV was −1.03× 10⁵, −7.18× 10⁴, and −4.93 × 10⁴°C km2 per 10 years calculated from OSTIA, ERA5, and ORAS5 datasets, respectively. In the three datasets, the OSTIA SST showed a stronger trend than the ORAS5 and ERA5 in all three upwelling regions.
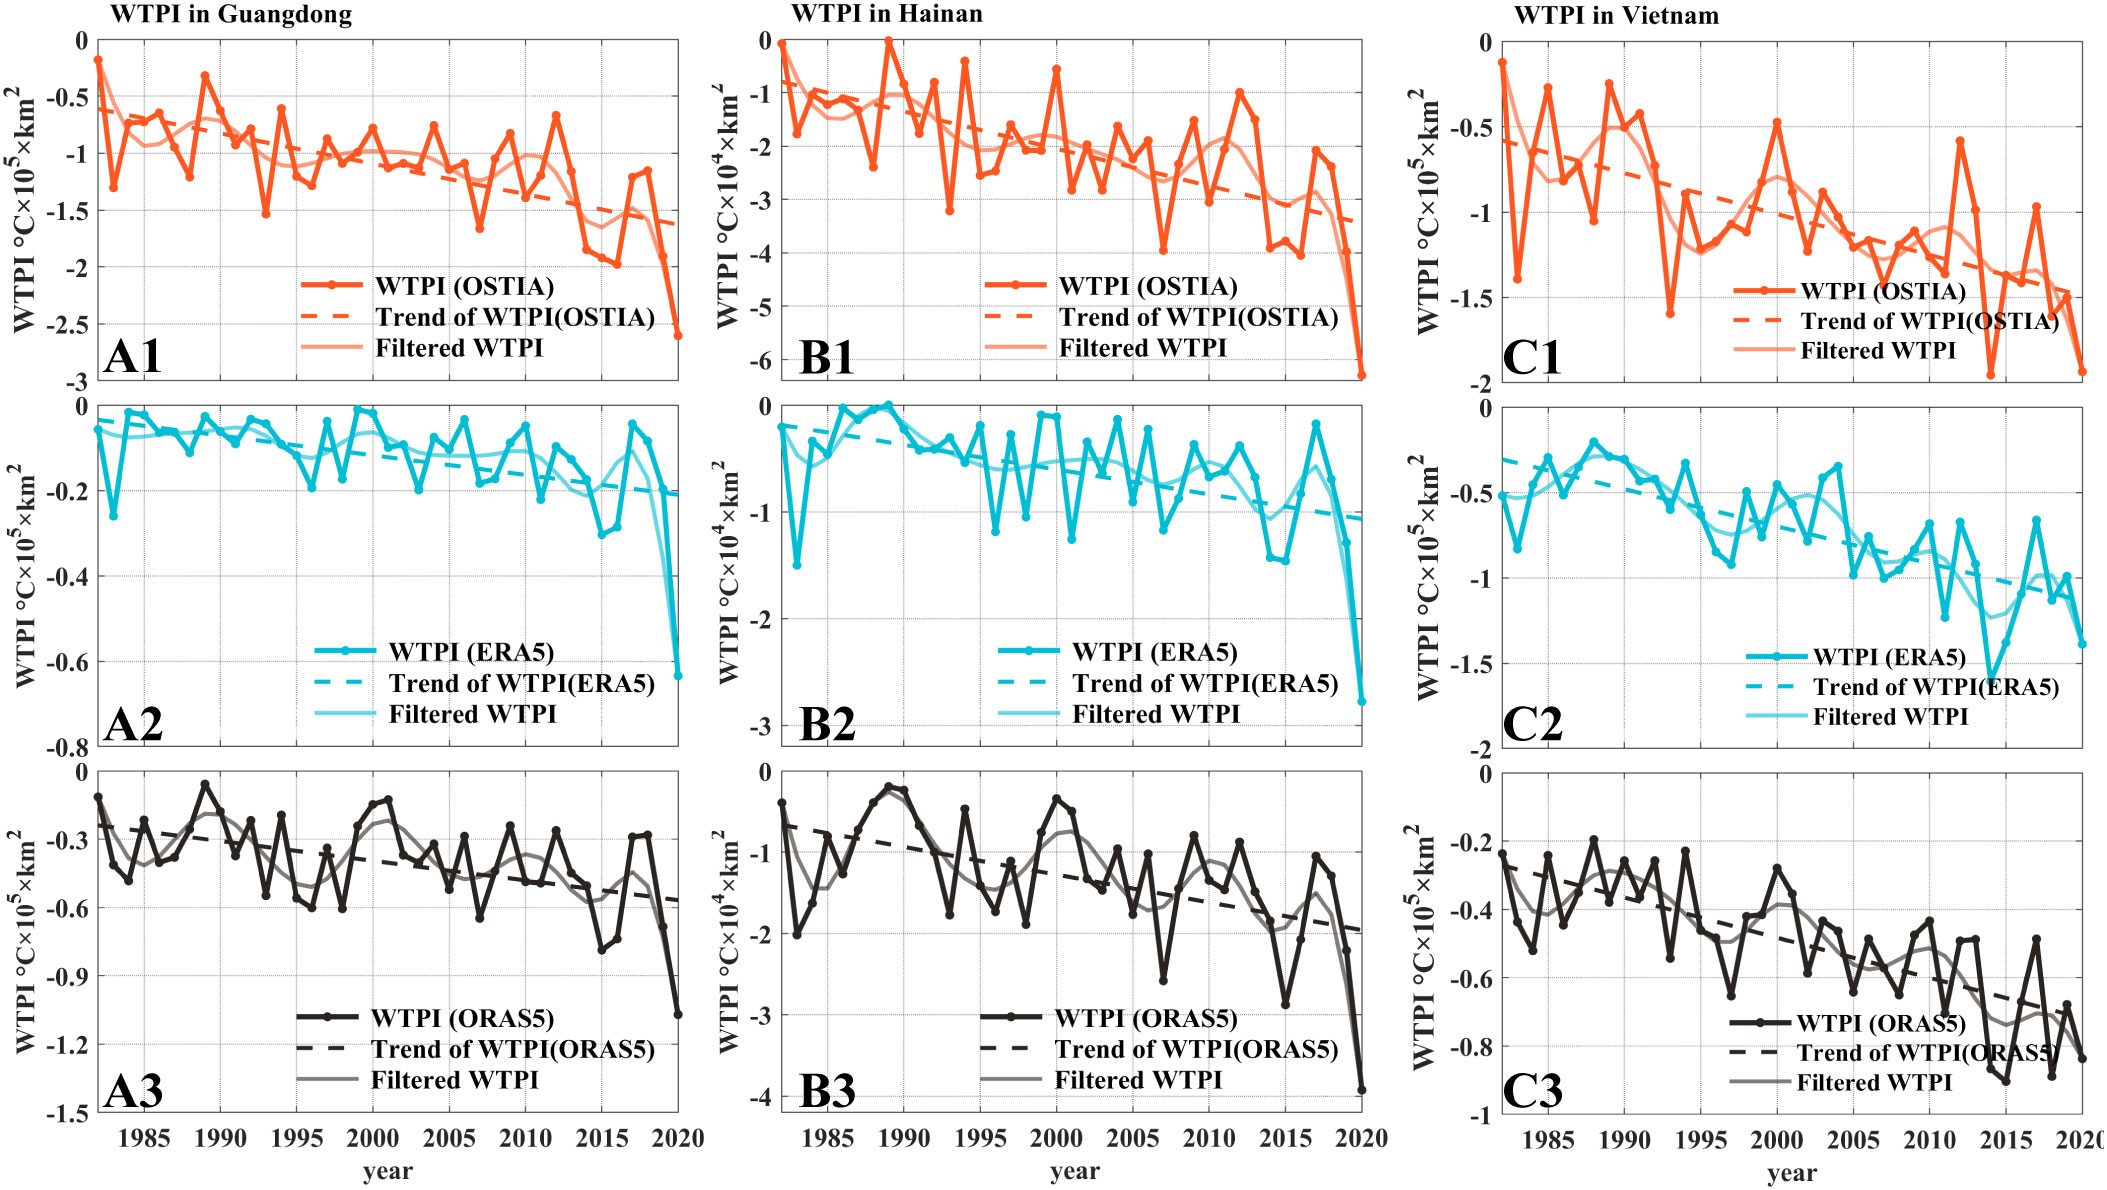
Figure 4 Time series (heavy solid lines), 7-year low-passed filtered time series (gray solid lines), and trends (dashed lines) of WTPI values for UEG from OSTIA (A1), ERA5 (A2) and ORAS5 (A3); for UEH from OSTIA (B1), ERA5 (B2) and ORAS5 (B3); and for UEV from OSTIA (C1), ERA5 (C2) and ORAS5 (C3).
To further assess the gaps between the different datasets when calculating the WTPI, we plotted Taylor diagrams using the WTPI time series of the three regions during 1982–2020 (Figure 5). The OSTIA data were used as a reference to compare the other two reanalysis datasets. The WTPI of the UEG correlation between the ORAS5 and OSTIA data was 0.92 and that between the ERA5 and OSTIA data was 0.87 (Figure 5A). The standard deviation (STD) of the UEG from OSTIA was the largest, whereas that from ERA5 was the smallest. The normalized root mean square differences (RMSD) value of WTPI for the UEG from ORAS5 was 0.64, and that of ERA5 data was 0.79. The correlation between the WTPI of UEH calculated by ERA5 and OSTIA was 0.92 and that between ORAS5 and OSTIA was 0.92 (Figure 5B). The distribution of both datasets was relatively low. The normalized RMSD of WTPI in UEH were 0.62 and 0.49 for ERA5 and ORAS5, respectively. For UEV, the WTPI correlation between ERA5 and OSTIA was 0.87, and between ORAS5 and OSTIA was 0.92 (Figure 5C). The STD of the WTPI in UEV derived from OSTIA was the largest, whereas that of ORAS5 was the smallest. The RMSD of the WTPI in the UEV from ERA5 was smaller than that from ORAS5. The results from all the aforementioned analyses showed that for all three typical upwelling areas, the ORAS5 reanalysis data was similar to the remote sensing data, OSTIA, rather than ERA5.
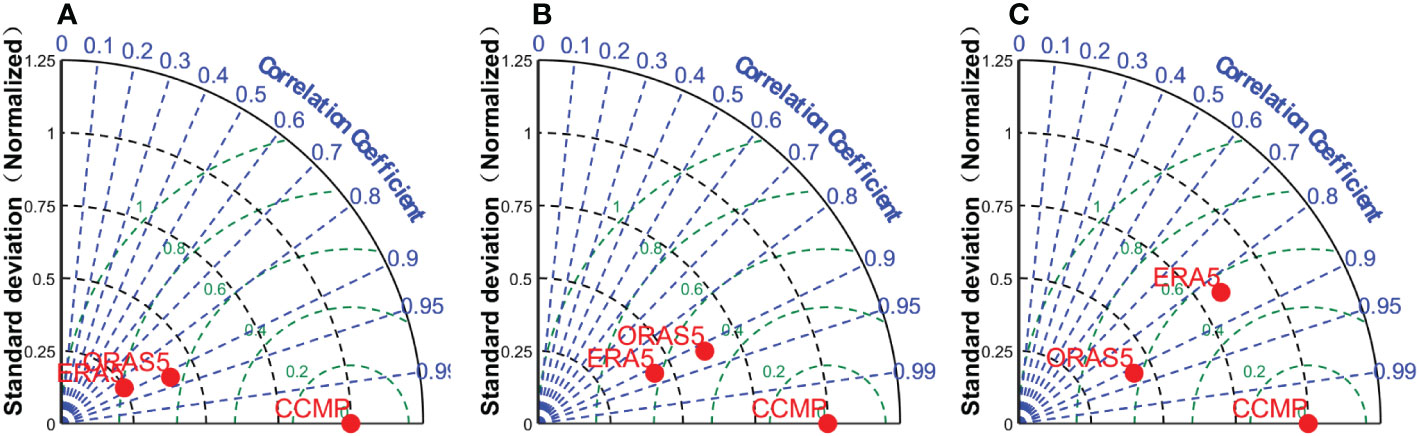
Figure 5 Taylor diagrams of 7 years lowpass filtered time series of WTPI in the UEG (A), UEH (B), and UEV (C), calculated from OSTIA, ERA5, and ORAS5, respectively. The radial axis represents the normalized standard deviation (STD), with the unit value referenced as the OSTIA STD; the root mean square differences (RMSD) with respect to the OSTIA data are represented by green dashed arcs and numbers; the correlation coefficients vary in the azimuthal direction as blue dashed-dotted lines and numbers.
Previous studies have shown that coastal upwelling in the SCS is closely related to the southwestern summer monsoon (Xie et al., 2003; Gan et al., 2009; Shu et al., 2018a; Shu et al., 2018b). In this study, we explored the potential causes of the enhanced upwelling along the coast of the SCS using wind data products from the CCMP, ERA5, and ORAS5. It should be noted the northern and southern regions of the UEV has opposite responses to summer winds (Thai et al., 2022). Therefore, we divided the UEV into two regions: southern UEV (SUEV) and northern UEV (NUEV). The correlation between the alongshore wind stresses from all three datasets (CCMP, ERA5, and ORAS5) and WTPI was approximately -0.3 in the region of NUEV, further confirming that local wind was not responsible for the NUEV.
Alongshore wind stress is thought to be the main mechanism driving coastal upwelling in the SCS (Shu et al., 2011; Wang et al., 2012; Hu and Wang, 2016; Shu et al., 2018a, Shu et al., 2018b). Figure 6 shows the long-term trends of coastal wind stress from CCMP, ERA5, and ORAS5 in four typical upwelling regions in the SCS from 1982 to 2020. The three wind datasets presented inconsistent trends along the coast of the SCS (Figure 6). The ORAS5 data showed an enhanced trend in coastal wind stress in all three upwelling regions, except NUEV (Figures 6A3, B3, and D3), which was consistent with the intensified upwelling in the SCS over the past 40 years (Figures 3, 4). The wind stress from CCMP had an increasing trend in the areas of SUEV, whereas it presented a decreasing trend was observed in the area of UEG and did not show a significant trend in the area of UEH (Figures 6A1, B1, D1). In other words, the alongshore wind stress from the CCMP can explain the intensified upwelling in the SUEV region. The long-term trends in alongshore wind stress from ERA5 increased slightly in the UEG region, whereas a slight decrease was observed in the UEH region and did not appear in the SUEV region (Figures 6A2, B2, D2). Thus, the long-term variability in alongshore wind stress from ERA5 did not support intensified upwelling during 1982–2020.
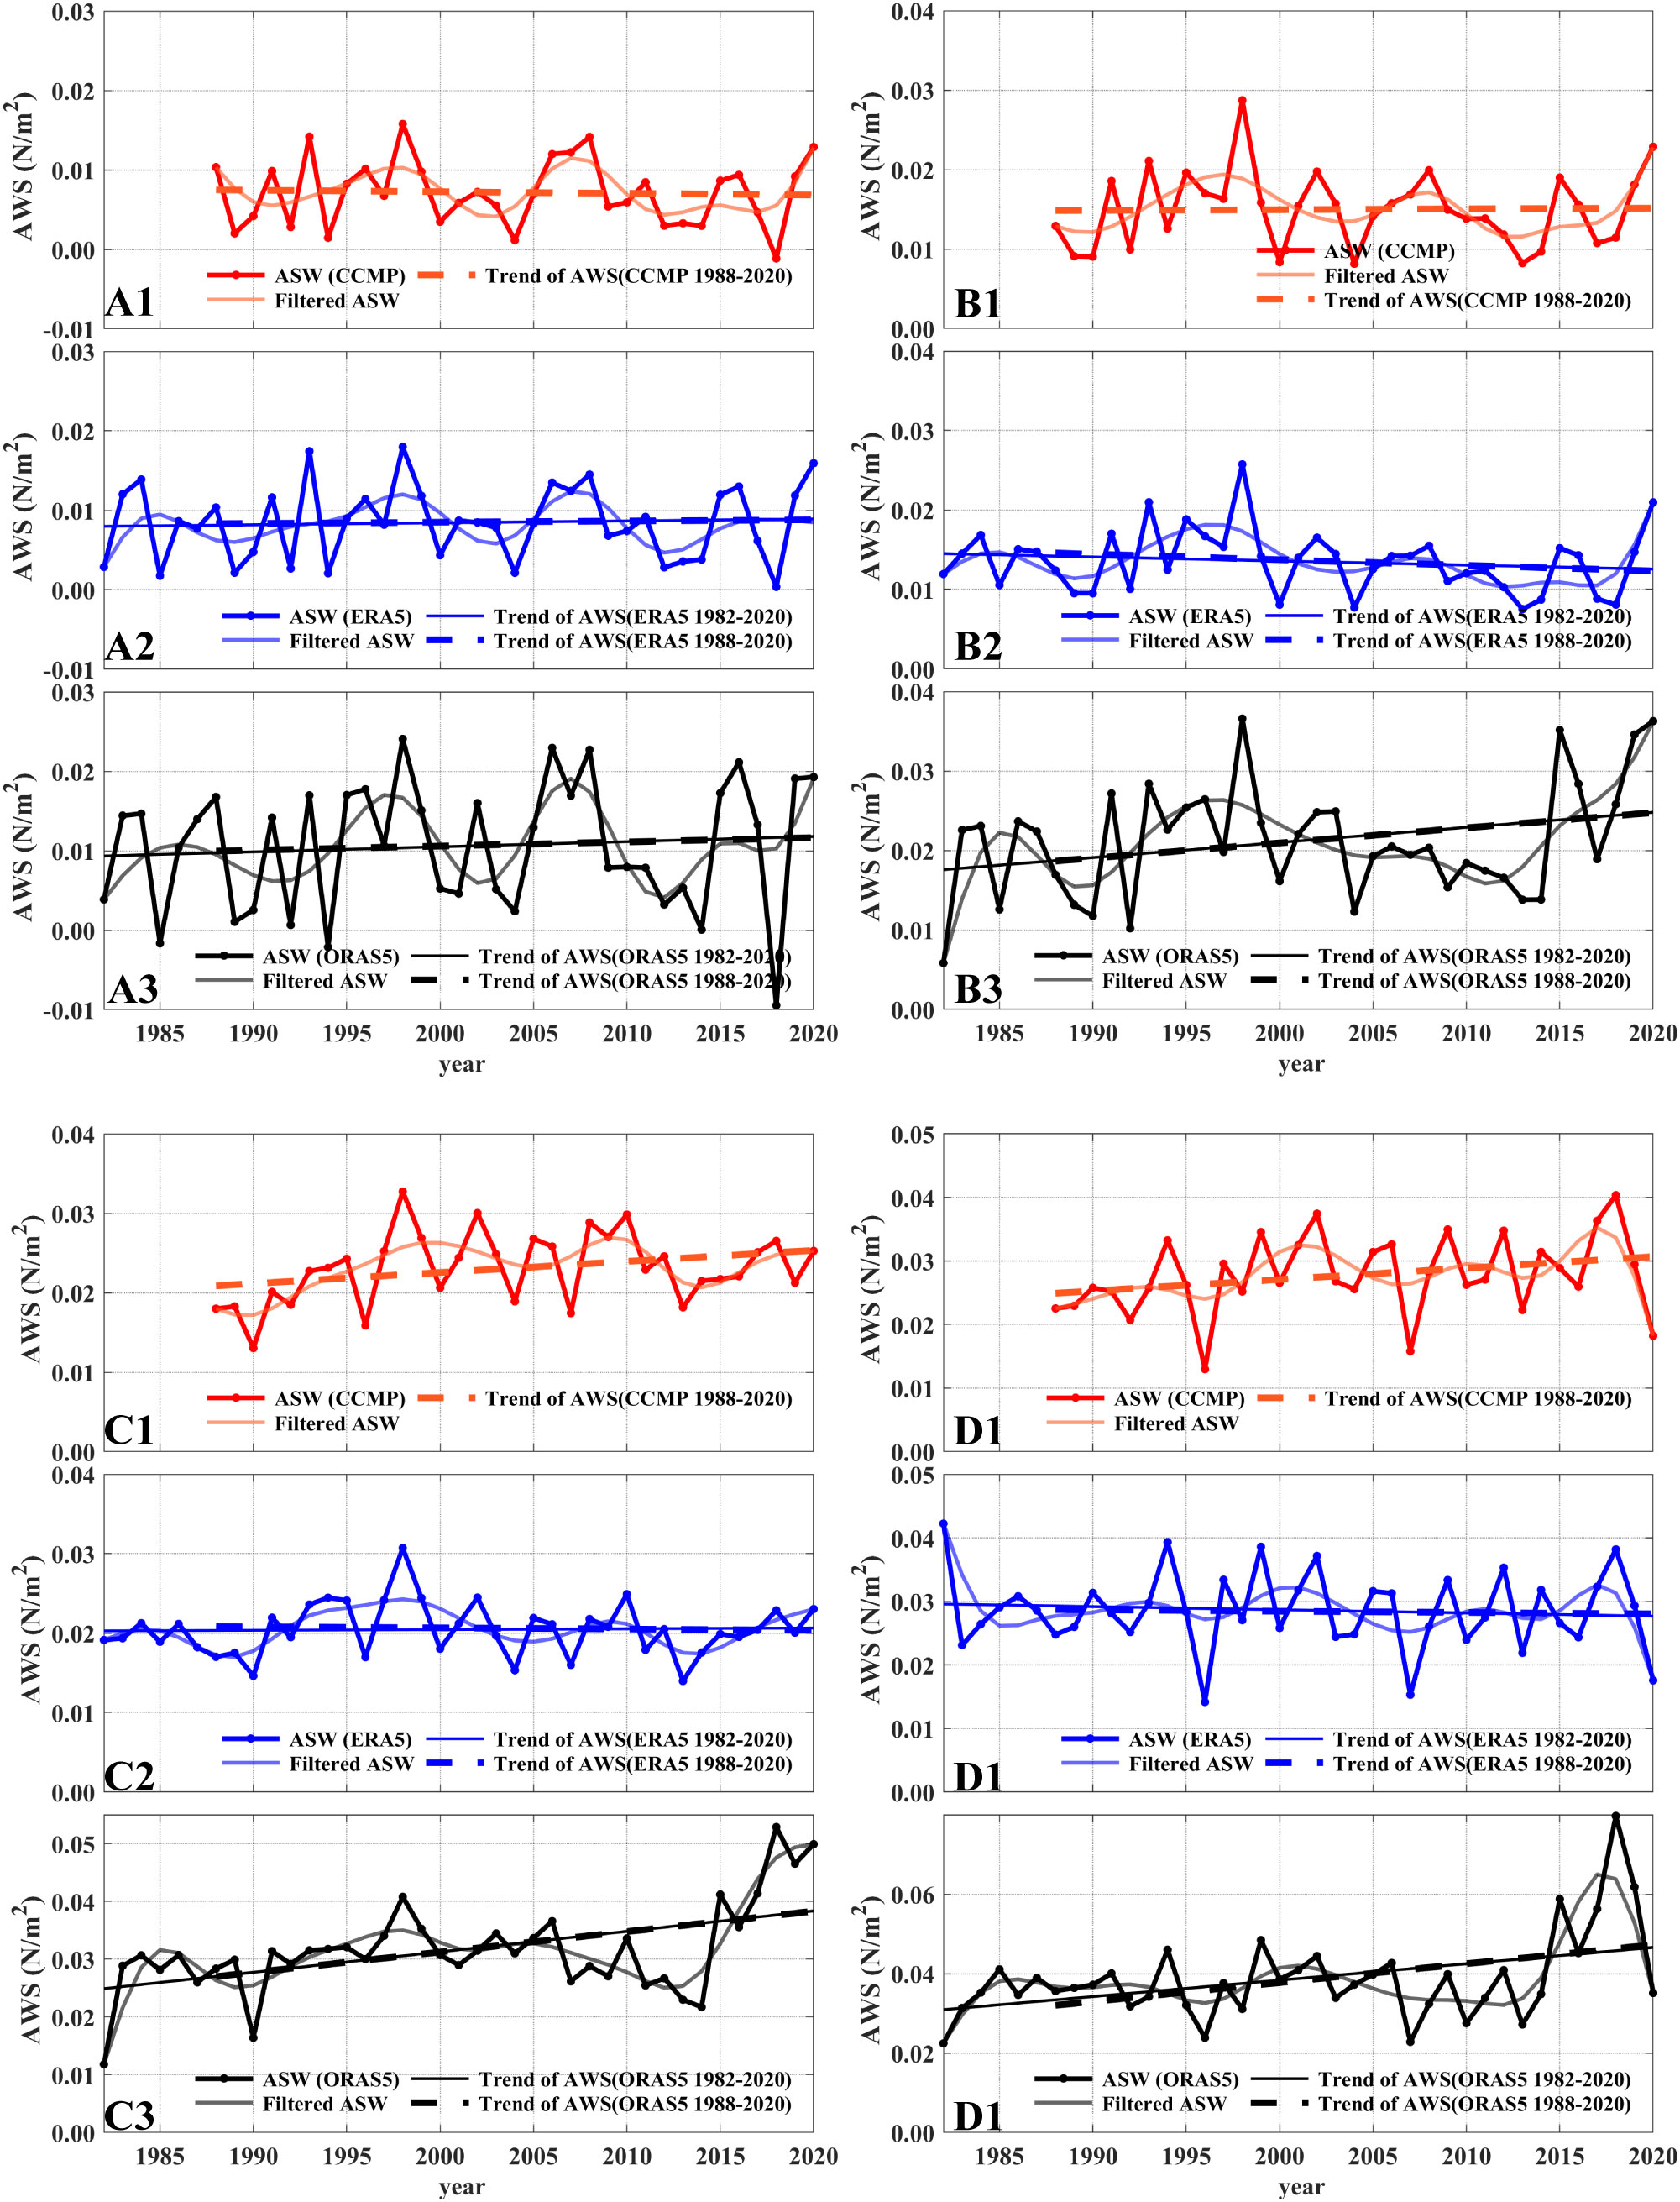
Figure 6 Time series (heavy solid lines), 7-year low-passed filtered time series (solid lines), and trends (dashed lines) of alongshore wind stress in the UEG region calculated from CCMP (A1), ERA5 (A2) and ORAS5 (A3); in the UEH region calculated from CCMP (B1), ERA5 (B2) and ORAS5 (B3); in the NUEV region calculated from CCMP (C1), ERA5 (C2) and ORAS5 (C3); and in the SUEV region from CCMP (D1), ERA5 (D2) and ORAS5 (D3).
Ekman pumping driven by wind stress curl is another important mechanism for coastal upwelling (Xie et al., 2003; Jing et al., 2009; Jing et al., 2011; Wang et al., 2013). In the UEG, UEH, and SUEV, the climatological wind stress curl was significantly positive. The SUEV is one order of magnitude larger than the UEG and UEH (Shen et al., 2018). Notably, around 13–14° N in the NUEV region, the CCMP, ERA5, and ORAS5 showed a negative wind stress curl (Figures 7A–C). The same decreasing trends were observed for all datasets that did not favour intensified NUEV (Figures 8C1–C3). The wind stress curl trend from ORAS5 supports upwelling enhancement in all three upwelling regions, except NUEV (Figures 8A3, B3, and D3). In agreement with the results obtained from ORAS5, the wind stress curl trend from CCMP was favourable to the upwelling enhancement in all three regions of the UEG, UEH, and SUEV (Figures 8A1, B1, D1). Therefore, the long-term trends in wind stress curl obtained by both ORAS5 and CCMP can explain the enhanced trends in the three typical coastal upwelling zones, except NUEV. In contrast, the wind stress curl from the ERA5 data did not show a significant supporting trend in any of the three regions to explain the long-term trend in upward flows.
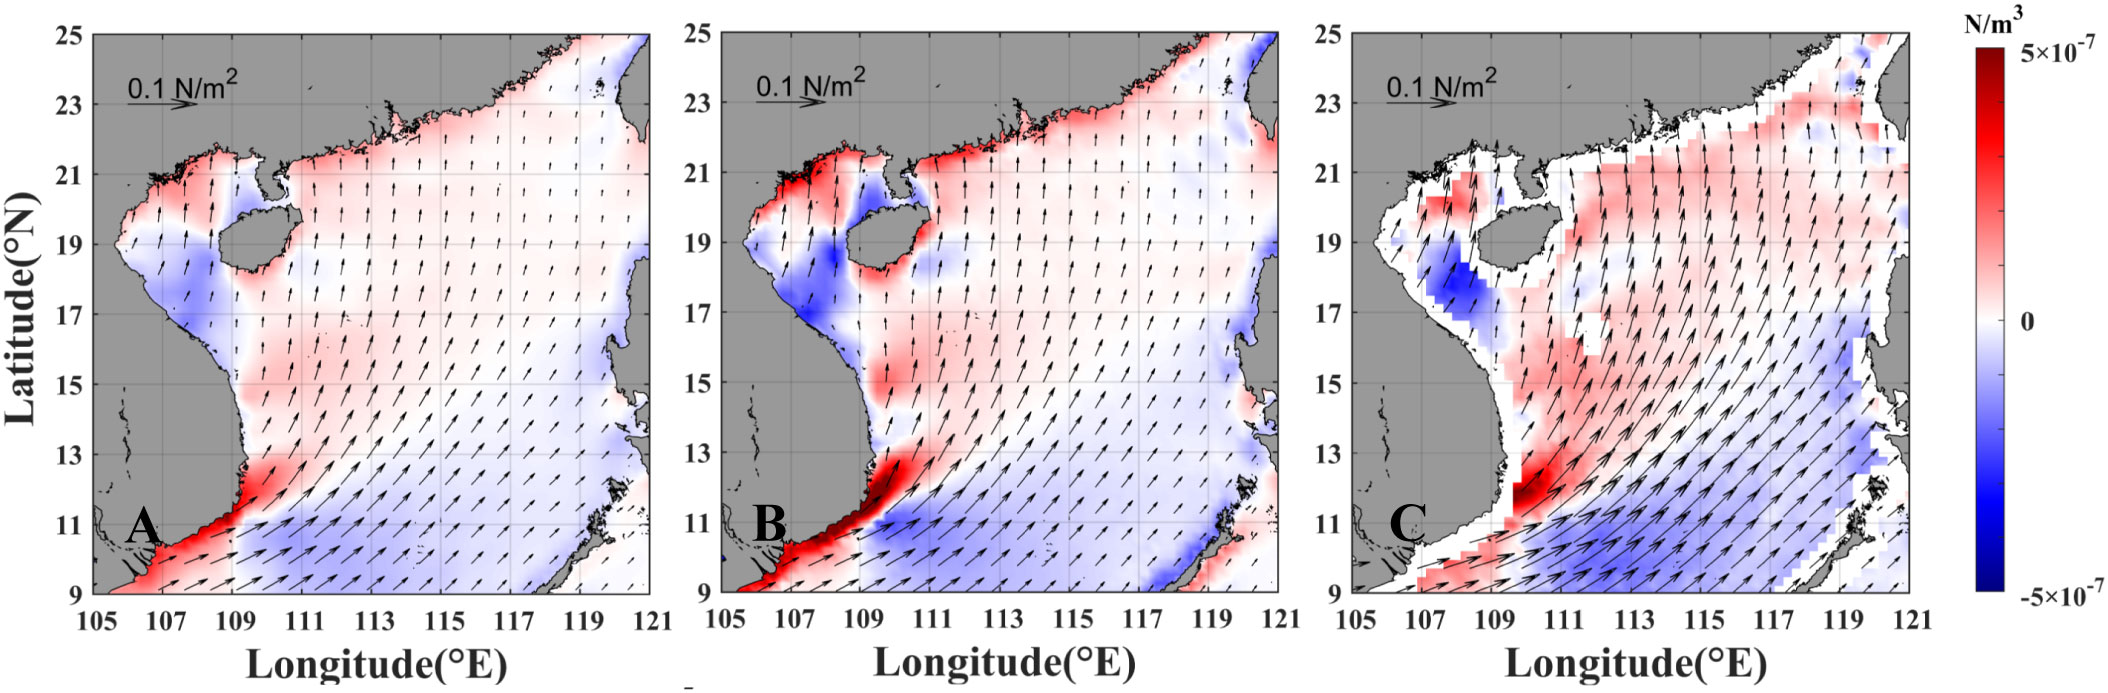
Figure 7 Spatial distribution of mean wind stress curl calculated from CCMP (A), ERA5 (B), and ORAS5 (C) for June and July during 1982–2020.
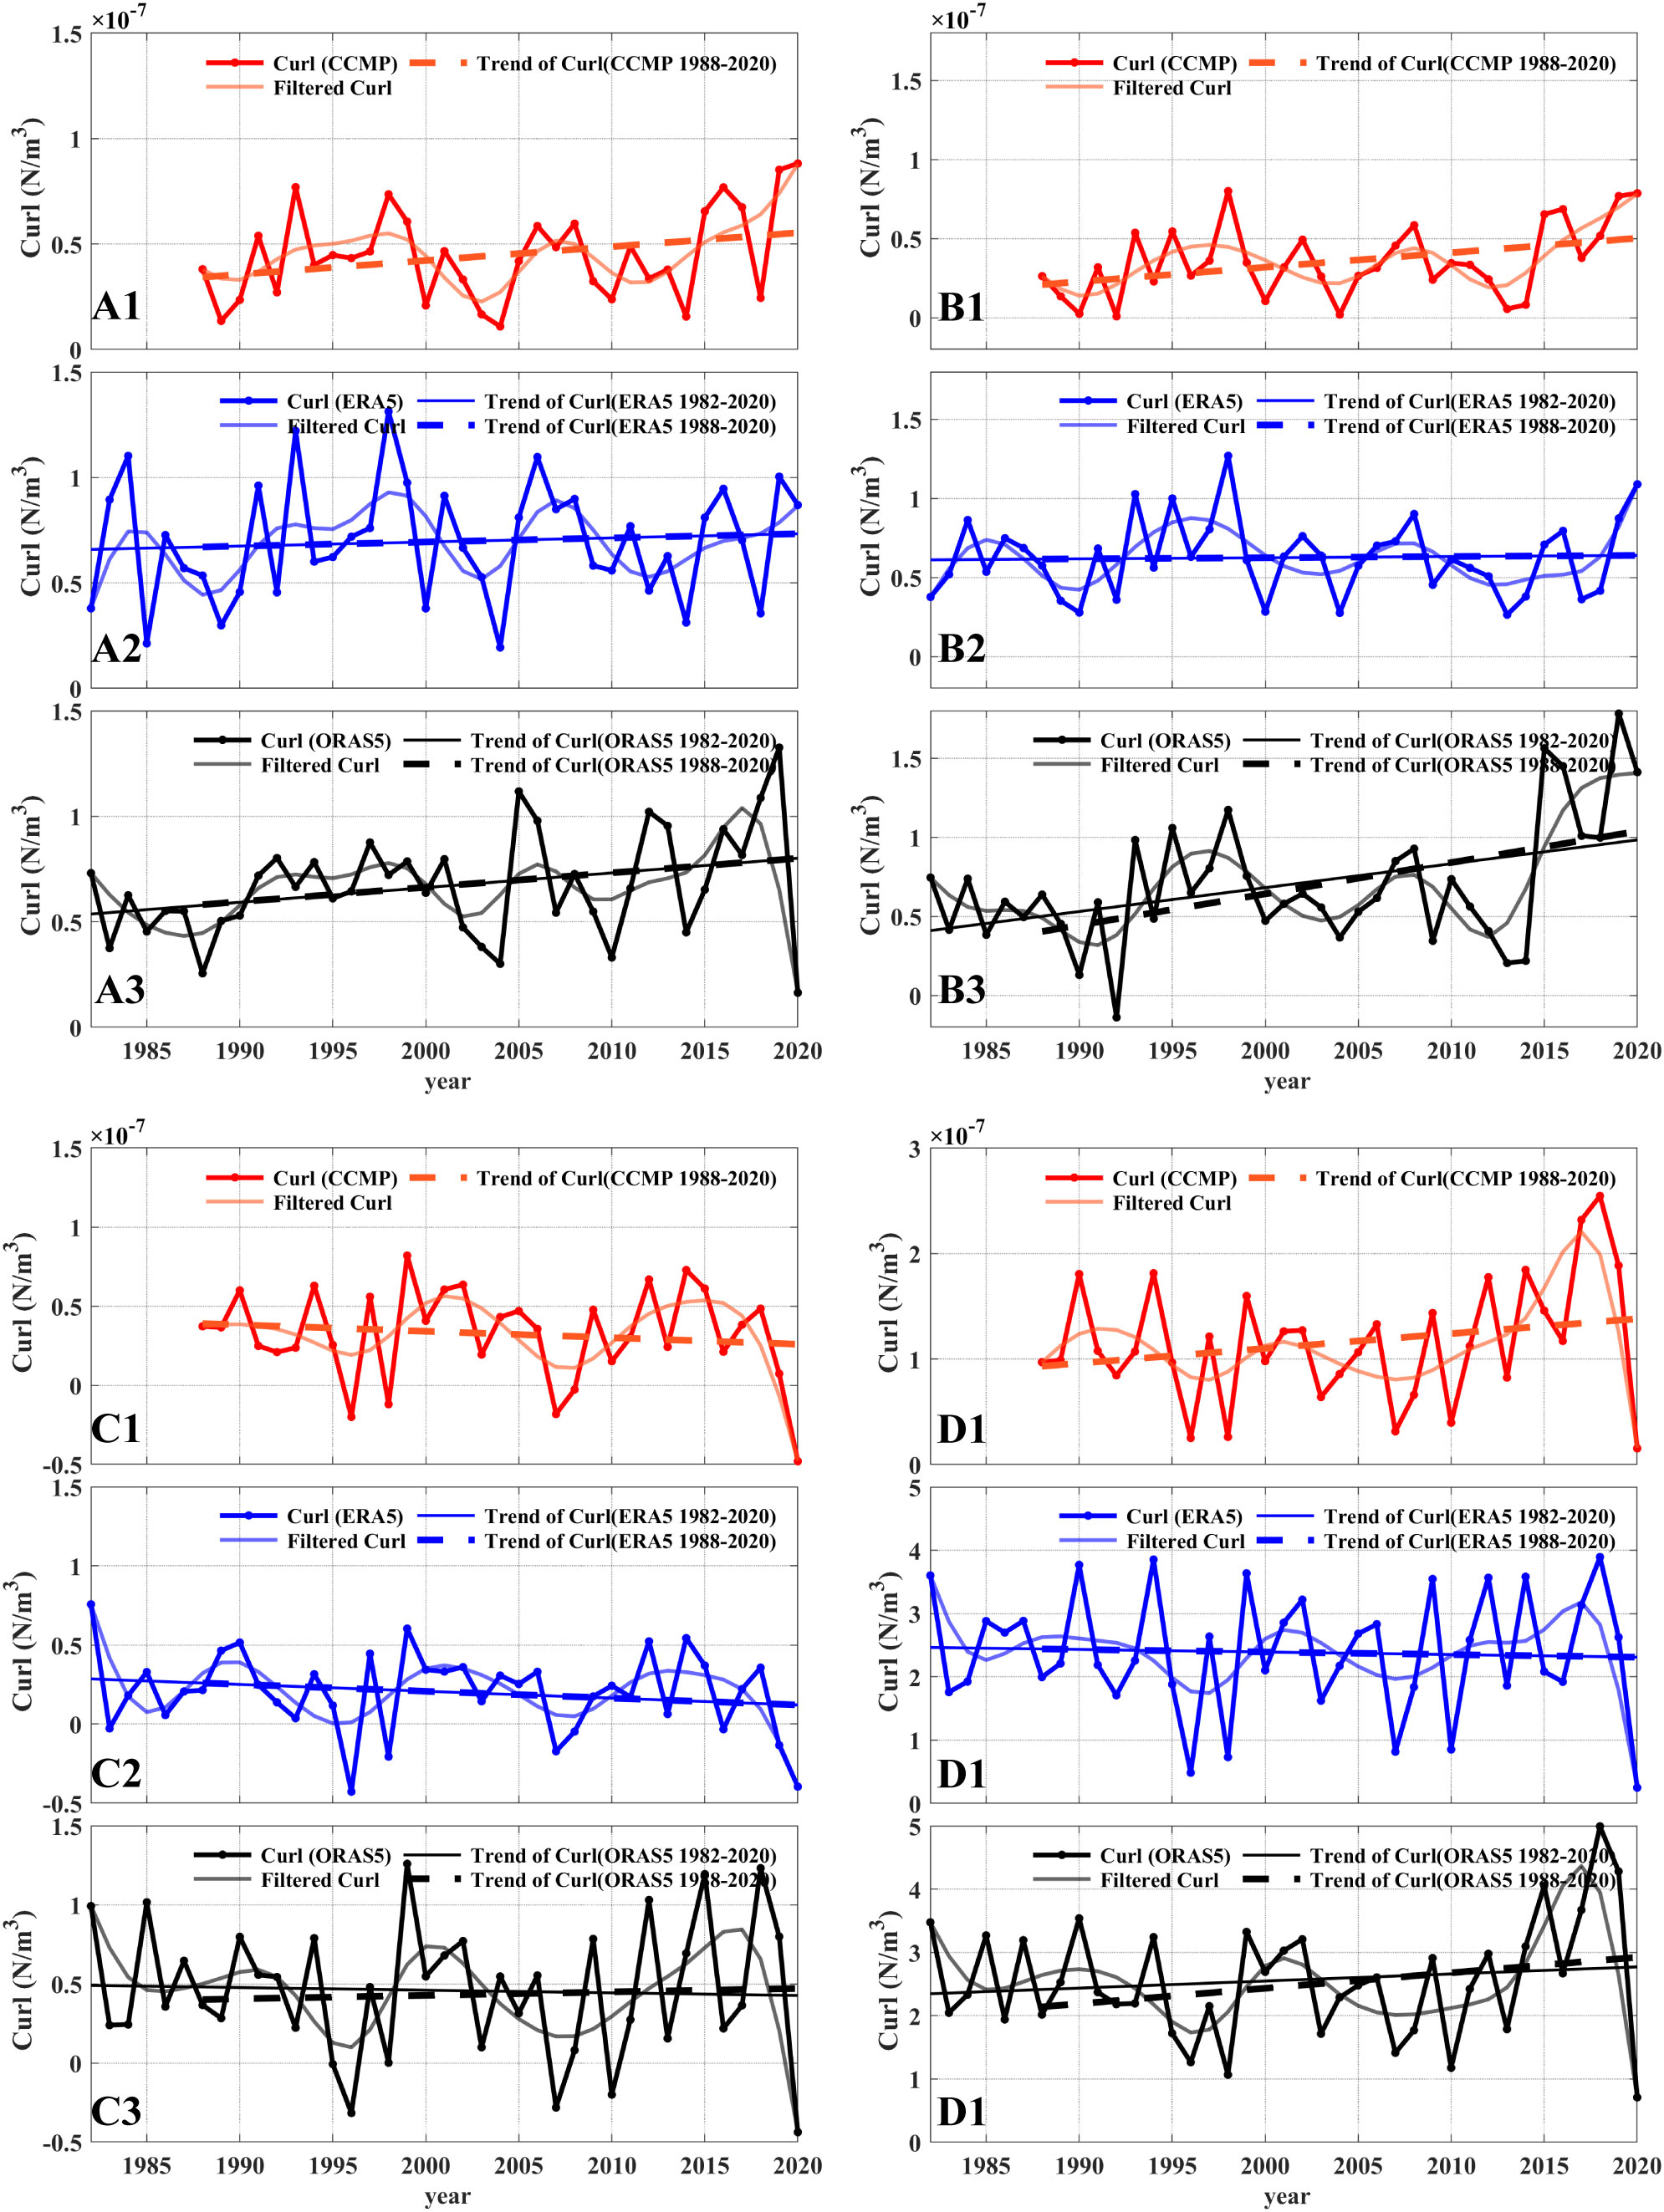
Figure 8 Time series (heavy solid lines), 7-year low-passed filtered time series (solid lines), and trends (dashed lines) of wind curl in the UEG region calculated from CCMP (A1), ERA5 (A2) and ORAS5 (A3); in the UEH region calculated from CCMP (B1), ERA5 (B2) and ORAS5 (B3); in the NUEV region calculated from CCMP (C1), ERA5 (C2) and ORAS5 (C3); and in the SUEV region from CCMP (D1), ERA5 (D2) and ORAS5 (D3).
Previous studies have also shown that different wind data present different, even opposite, long-term trends (Narayan et al., 2010; Seo et al., 2012; Sydeman et al., 2014; Varela et al., 2016; Wang et al., 2015; Quilfen et al., 2021). Using CCMP as a reference, we compared the wind datasets using Taylor diagrams. The high STD of the alongshore wind stress and wind stress curl of ORAS5 (except for the wind stress curl in the UEG region) indicated a high degree of dispersion in ORAS5 (Figure 9). The RMSD and STD of ORAS5 were higher than that of ERA5, indicating that the coastal wind stress and wind stress cyclicity of ERA5 were closer to those of CCMP (Figure 9). There is a problem that in climate reanalysis, which the interaction between any bias in numerical atmospheric models and evolving observational systems could introduce spurious climate signals (Hersbach et al., 2018). For multi-satellite gridded products, it is also challenging to achieve the accuracy required for climate research (Bourassa et al., 2019). The systematic and time-dependent differences between wind products also indicate the need for further research on the temporal stability of these widely used wind datasets (Alvarez et al., 2017; Quilfen et al., 2021). Therefore, a better understanding of the gaps between wind datasets and the selection of appropriate wind datasets are important and require continuous effort.

Figure 9 Taylor diagrams of 7 years lowpass filtered time series of alongshore wind stress and wind stress curl calculated from CCMP, ERA5, and ORAS5 for the regions of UEG (A), UEH (B), NUEV (C), and SUEV (D). The radial axis represents the normalized STD, with the unit value referenced as the CCMP STD; the RMSD with respect to the CCMP data are represented by green dashed arcs and numbers; the correlation coefficients vary in the azimuthal direction as blue dashed-dotted lines and numbers. The green dot represents the alongshore wind stress, and the red diamond represents the wind stress curl.
Because of the differences in the long-term trends in the alongshore wind stress and local wind curl between the three datasets, it is difficult to draw a direct conclusion on the mechanisms of intensified coastal upwelling during 1982–2020 in the SCS. Considering the CCMP is based on satellite data, we regarded it as a reference to discuss the potential mechanism of intensified upwelling. In the NSCS, long-term trends for wind stress curl in the UEG and UEH regions from the CCMP were responsible for the enhanced coastal upwelling (Figures 8A1 and B1), which was also confirmed by Hong and Zhang (2021) and Xie et al. (2016). Xie et al. (2016) pointed out wind stress curl is a more important factor than alongshore wind stress influencing the upwelling in the area of UEH. Hong and Zhang (2021) found that the strengthening of the wind stress curl was an important factor for the enhancement of coastal upwelling along the coast of the NSCS.The enhancement of long-term trends in both alongshore wind stress and wind stress curl from CCMP was favourable to the intensified SUEV during 1982–2020, which was consistent with previous studies (Thai et al., 2022).
In addition, background flow is also an important cause, except for the local wind field contributing to the coastal upwelling intensity in the SCS (Wang et al., 2014; Lin et al., 2015; Shu et al., 2016; Shu et al., 2018a; Shu et al., 2018b). In the coastal area of Vietnam, the enhancement or weakening of NUEV is more influenced by the ocean’s own flow (Ngo and Hsin, 2021). Offshore currents close to the coast, controlled by the spatial distribution of sub-mesoscale and mesoscale dynamical processes, can influence NUEV. The southward or northward currents off the coast of Vietnam, caused by two opposing conditions, wind and offshore circulation, ultimately suppresses the NUEV (Thai et al., 2022). In the NSCS, UEG is not only related to alongshore wind stress, the alongshore currents modulated by topography and thermocline depth in slopes also significantly influence upwelling (Shu et al., 2018a). Non-local western boundary currents also significantly influence the strength of the UEH (Su et al., 2014). Exploring the effects of these factors on the long-term trends in coastal upwelling may require further research.
Using three SST datasets, OSTIA, ERA5, and ORAS5, this study assessed the long-term trends in three typical coastal upwelling zones (UEG, UEH, and UEV) in the SCS during 1982-2020. To remove the long-term trend of the basin-scale SSTs, a TPI was used to quantify the upwelling intensity. All three datasets showed an intensified trend in upwelling intensity in the UEG, UEH, and UEV regions between 1982 and 2020. Among the three datasets, the largest WTPI values were obtained from the OSTIA data calculations. These were -1.12 x 10⁵°C km2 /10 years for UEG, -2.12 x 10⁴°C km2 /10 years for UEH and -1.04 x 10⁴°C km2 /10 years for UEV.
The Ekman transport derived from alongshore wind stress and the Ekman pumping derived from wind stress curl were considered the main mechanisms influencing inshore upwelling. The long-term trends in alongshore wind stress and wind stress curl were calculated using three types of wind data: CCMP, ERA5, and ORAS5. Based on the CCMP and reports from previous studies, the enhancement of UEG and UEH during 1982–2020 may be more related to the wind stress curl. North and south Vietnam had different responses to summer winds, and both coastal wind stress and wind stress curl are possible reasons for the intensified long-term trend of the SUEV. In contrast, in the NUEV region, neither alongshore wind stress nor wind stress curl was the main influencing mechanism. It may be more influenced by currents, which were not explored in this study. The stability of widely used wind data requires further research, and differences in calculated trends can occur with the selection of different wind datasets. It should be noted that we only considered the effect of wind on intensified coastal upwelling in the SCS. There may be multiple influencing mechanisms that require further investigation.
The original contributions presented in the study are included in the article/supplementary material. Further inquiries can be directed to the corresponding author.
YS and JY designed the research and guided the study. SL analyzed the data. SL and YS wrote the first draft of the manuscript. QJ and JZ contributed to the interpretation of the results. All authors contributed to the data analysis discussion and manuscript writing. All authors contributed to the article and approved the submitted version.
This work was supported by the National Key R&D Program of China (2021YFC3101702), National Natural Science Foundation of China (42130402, 42076019, 41906017), and Open Project Program of the State Key Laboratory of Tropical Oceanography (project LTOZZ2001).
The authors declare that the research was conducted in the absence of any commercial or financial relationships that could be construed as a potential conflict of interest.
All claims expressed in this article are solely those of the authors and do not necessarily represent those of their affiliated organizations, or those of the publisher, the editors and the reviewers. Any product that may be evaluated in this article, or claim that may be made by its manufacturer, is not guaranteed or endorsed by the publisher.
Alvarez I., Lorenzo M., DecAstro M., Gomez-Gesteira M. (2017). Coastal upwelling trends under future warming scenarios from the CORDEX project along the Galician coast (NW Iberian peninsula). Int. J. Climatol. 37 (8), 3427–3438. doi: 10.1002/joc.4927
Atlas R., Hoffman R., Ardizzone J., Leidner S., Jusem J., Smith D., et al. (2011). A cross-calibrated, multiplatform ocean surface wind velocity product for meteorological and oceanographic applications. B. Am. Meteorol. Soc 92 (2), 157–174. doi: 10.1175/2010bams2946.1
Bakun A. (1990). Global climate change and intensification of coastal ocean upwelling. Science. 247 (4939), 198–201. doi: 10.1126/science.247.4939.198
Bakun A., Black B., Bograd S., García M., Miller A., Rykaczewski R., et al. (2015). Anticipated effects of climate change on coastal upwelling ecosystems. Curr. Clim. Change. Rep. 1 (2), 85–93. doi: 10.1007/s40641-015-0008-4
Barth J., Bruce A., Jane L., Francis C., John M., Anthony R. (2007). Delayed upwelling alters nearshore coastal ocean ecosystems in the northern California current. P. Natl. Acad. Sci. 104 (10), 3719–3724. doi: 10.1073/pnas.0700462104
Benazzouz A., Mordane S., Orbi A., Chagdali M., Hilmi K., Atillah A., et al. (2014). An improved coastal upwelling index from sea surface temperature using satellite-based approach–the case of the canary current upwelling system. Cont. Shelf. Res. 81, 38–54. doi: 10.1016/j.csr.2014.03.012
Bombar D., Dippner J., Doan H., Ngoc L., Liskow I., Loick N., et al. (2010). Sources of new nitrogen in the Vietnamese upwelling region of the south China Sea. J. Geophys. Res. oceans. 115 (C06018), 1–14. doi: 10.1029/2008JC005154
Bourassa M., Thomas M., Cerovecki I., Chang P., Dong X., Chiara G., et al. (2019). Remotely sensed winds and wind stresses for marine forecasting and ocean modeling. Front. Mar. Sci. 6. doi: 10.3389/fmars.2019.00443
Chen Z., Jiang Y., Wang J., Gong W. (2019). Influence of a river plume on coast upwelling dynamics: Importance of stratification. J. Phys. Oceanogr. 49, 2345–2363. doi: 10.1175/JPO-D-18-0215.1
Donlon C., Matthew J., John S., Jonah R., Emma F., Werenfrid W. (2012). The operational Sea surface temperature and Sea ice analysis (OSTIA) system. Remote. Sens. Environ. 116, 140–158. doi: 10.1016/j.rse.2010.10.017
Fang G., Chen H., Wei Z., Wang Y., Wang X. (2006). Trends and interannual variability of the south China Sea surface winds, surface height, and surface temperature in the recent decade. J. Geophys. Res. 111, C11S16. doi: 10.1029/2005JC003276
Gan J., Cheung A., Guo X., Li L. (2009). Intensified upwelling over a widened shelf in the northeastern south China Sea. J. Geophys. Res. 114, C09019. doi: 10.1029/2007JC004660
Gan J., Wang J., Liang L., Li L., Guo X. (2015). A modeling study of the formation, maintenance, and relaxation of upwelling circulation on the northeastern south China Sea shelf. Deep. Sea. Res. Part. II. Top. Stud. Oceanogr. 117, 41–52. doi: 10.1016/j.dsr2.2013.12.009
García-Reyes M., Largier J. (2010). Observations of increased wind-driven coastal upwelling off central California. J. Geophys. Res. 115, C04011. doi: 10.1029/2009jc005576
Hersbach H., Rosnay P., Bell B., Schepers D., Simmons A., Soci C., et al. (2018). “Operational global reanalysis: Progress, future directions and synergies with NWP,” in ERA report series, 2 (Reading, UK: ECMWF). doi: 10.21957/tkic6g3wm
Hong B., Zhang J. (2021). Long-term trends of Sea surface wind in the northern south China Sea under the background of climate change. J. Mar. Sci. Eng. 9, 752. doi: 10.3390/jmse9070752
Huang Z., Feng M. (2015). Remotely sensed spatial and temporal variability of the leeuwin current using MODIS data. Remote. Sens. Environ. 166, 214–232. doi: 10.1016/j.rse.2015.05.028
Hu J., Wang X. (2016). Progress on upwelling studies in the China seas. Rev. Geophys. 54, 653–673. doi: 10.1002/2015RG000505
Jayaram C., Kumar P. (2018). Spatio-temporal variability of upwelling along the southwest coast of India based on satellite observations. Cont. Shelf. Res. 156, 33–42. doi: 10.1016/j.csr.2018.02.003
Jing Z., Qi Y., Du Y. (2011). Upwelling in the continental shelf of northern south China Sea associated with 1997–1998 El niño. J. Geophys. Res. 116, C02033. doi: 10.1029/2010jc006598
Jing Z., Qi Y., Du Y., Zhang S., Xie L. (2015). Summer upwelling and thermal fronts in the northwestern south China Sea: Observational analysis of two mesoscale mapping surveys. J. Geophys. Res. 120 (3), 1993–2006. doi: 10.1002/2014jc010601
Jing Z., Qi Y., Hua Z., Zhang H. (2009). Numerical study on the summer upwelling system in the northern continental shelf of the south China Sea. Cont. Shelf. Res. 29 (2), 467–478. doi: 10.1016/J.csr.2008.11.008
Lachkar Z. (2014). Effects of upwelling increase on ocean acidification in the California and canary current systems. Geophys. Res. Lett. 41 (1), 90–95. doi: 10.1002/2013gl058726
Lin P., Cheng P., Gan J., Hu J. (2015). Dynamics of wind-driven upwelling off the northeastern coast of hainan island. J. Geophys. Res. 121, 1160–1173. doi: 10.1002/2015JC011000
Liu C., Li X., Wang S., Tang D., Zhu D. (2020). Interannual variability and trends in sea surface temperature, sea surface wind, and sea level anomaly in the south China Sea. Int. J. Remote. Sens. 41 (11), 4160–4173. doi: 10.1080/01431161.2020.1714777
Liu Y., Peng Z., Shen C., Zhou R., Song S., Shi Z., et al. (2013). Recent 121-year variability of western boundary upwelling in the northern south China Sea. Geophys. Res. Lett. 40 (12), 3180–3183. doi: 10.1002/grl.50381
Liu Y., Peng Z., Wei G., Chen G., Sun W., He J. (2009). Variation of summer coastal upwelling at northern south China Sea during the last 100 years. Geochimica. 38 (4), 317–322. doi: 10.19700/j.0379-1726.2009.04.001
Loick N., Dippner J., Doan H., Liskow I., Voss M. (2007). Pelagic nitrogen dynamics in the Vietnamese upwelling area according to stable nitrogen and carbon isotope data. Deep. Sea. Res. Part. I. Oceanogr. Res. Pap. 54 (4), 596–607. doi: 10.1016/j.dsr.2006.12.009
Loisel H., Vantrepotte V., Ouillon S., Ngoc D., Herrmann M., Tran V., et al. (2017). Assessment and analysis of the chlorophyll-a concentration variability over the Vietnamese coastal waters from the MERIS ocean color sensor, (2002–2012). Remote. Sens. Environ. 190, 217–232. doi: 10.1016/j.rse.2016.12.016
Lu W., Oey L., Liao E., Zhuang W., Yan X., Jiang Y. (2018). Physical modulation to the biological productivity in the summer Vietnam upwelling system. Ocean. Sci. 14, 1303–1320. doi: 10.5194/OS-14-1303-2018
Nadh A., Becek K., Dagar L. (2016). A review of coastal upwelling research in the south China Sea: Challenges, limitations and prospects. Int. J. Earth Atmos. Sci. 3 (4), 63–72.
Narayan N., Paul A., Mulitza S., Schulz M. (2010). Trends in coastal upwelling intensity during the late 20th century. Ocean. Sci. 6 (3), 815–823. doi: 10.5194/os-6-815-2010
Ngo M., Hsin Y. (2021). Impacts of wind and current on the interannual variation of the summertime upwelling off southern Vietnam in the south China Sea. J. Geophys. Res. oceans. 126 (6), 1–23. doi: 10.1029/2020jc016892
Park Y., Choi A. (2017). Long-term changes of south China Sea surface temperatures in winter and summer. Cont. Shelf. Res. 143, 185–193. doi: 10.1016/j.csr.2016.07.019
Quilfen Y., Shutler J., Piolle J., Autret E. (2021). Recent trends in the wind-driven California current upwelling system. Remote. Sens. Environ. 261 (4), 112486. doi: 10.1016/j.rse.2021.112486
Ryther J. (1969). Photo synthesis and fish production from the sea. Science. 166 (3901), 72–76. doi: 10.1126/science.166.3901.72
Seo H., Brink K., Dorman C., Koracin D., Edwards C. (2012). What determines the spatial pattern in summer upwelling trends on the U.S. West coast? J. Geophys. Res. oceans. 117(8), 1–11. doi: 10.1029/2012jc008016
Shen Y., Jing Z., Tan K., Xie L. (2018). Comparison of the responses of the oiongdong upwelling and the Vietnam coastal upwelling to super EI nino events. Adv. Mar. Sci. (in Chinese) 37 (03), 374–386. doi: 10.3969/j.issn.1671–6647.2019.03.002
Shu Y., Wang D., Feng M., Geng B., Chen J., Yao J., et al. (2018a). The contribution of local wind and ocean circulation to the interannual variability in coastal upwelling intensity in the northern south China Sea. J. Geophys. Res. oceans. 123 (9), 6766–6778. doi: 10.1029/2018jc014223
Shu Y., Wang D., Zhu J., Peng S. (2011). The 4-d structure of upwelling and pearl river plume in the northern south China Sea during summer 2008 revealed by a data assimilation model. Ocean Model. 36 (3–4), 228–241. doi: 10.1016/j.ocemod.2011.01.002
Shu Y., Wang Q., Zu T. (2018b). Progress on shelf and slope circulation in the northern south China Sea. Scientia Sinica. 61 (5), 560–571. doi: 10.1007/s11430-017-9152-y
Shu Y., Xue H., Wang D., Xie Q., Chen J., Li J., et al. (2016). Observed evidence of the anomalous south China Sea western boundary current during the summers of 2010 and 2011. J. Geophys. Res. oceans. 121, 1145–1159. doi: 10.1002/2015JC011434
Su J., Xu M., Pohlmann T., Xu D., Wang D. (2014). A western boundary upwelling system response to recent climate variation, (1960–2006). Cont. Shelf. Res. 57 (3–9). doi: 10.1016/j.csr.2012.05.010
Sydeman W., García-Reyes M., Schoeman D., Rykaczewski R., Thompson S., Black B., et al. (2014). Climate change and wind intensification in coastal upwelling ecosystems. Science. 345 (6192), 77–80. doi: 10.1126/science.1251635
Thai T., Herrmann M., Estournel C., Marsaleix P., Duhaut T., Bui H., et al. (2022). The role of wind, mesoscale dynamics, and coastal circulation in the interannual variability of the south Vietnam upwelling, south China Sea – answers from a high-resolution ocean model. Ocean. Sci. 18 (4), 1131–1161. doi: 10.5194/os-18-1131-2022
Thompson B., Tkalich. P., Malanotte. P. (2017). Regime shift of the south China Sea SST in the late 1990s. Clim. Dynam. 48, 1873–1882. doi: 10.1007/s00382-016-3178-4
Varela R., Santos F., Gomez-Gesteira M., Alvarez I., Costoya X., Dias J. (2016). Influence of coastal upwelling on SST trends along the south coast of Java. PLoS One 11 (9), e0162122. doi: 10.1371/journal.pone.0162122
Wang D., Gouhier T., Menge B., Ganguly A. (2015). Intensification and spatial homogenization of coastal upwelling under climate change. Nature. 518 (7539), 390–394. doi: 10.1038/nature14235
Wang D., Shu Y., Xue H., Hu J., Zhuang W., Zu T., et al. (2014). Relative contributions of local wind and topography to the coastal upwelling in the northern south China Sea. J. Geophys. Res. oceans. 119, 2550–2567. doi: 10.1002/2013JC009172
Wang D., Wang H., Li M., Liu G., Wu X. (2013). Role of ekman transport versus ekman pumping in driving summer upwelling in the south China Sea. J. Ocean. U. China. 12 (3), 355–365. doi: 10.1007/s11802-013-1904-7
Wang Y., Yu Y., Zhang Y., Zhang H., Chai F. (2020). Distribution and variability of sea surface temperature fronts in the south China Sea. Estuar. Coast. Shelf. Sci. 240 (2), 106793. doi: 10.1016/j.ecss.2020.106793
Wang D., Zhuang W., Xie S., Hu J., Shu Y., Wu R. (2012). Coastal upwelling in summer 2000 in the northeastern south China Sea. J. Geophys. Res. oceans. 117, C04009. doi: 10.1029/2011JC007465
Weiss A. (2001). “Topographic position and landforms analysis,” in Proceedings of the Poster Presentation, ESRI User Conference, San Diego, CA, 9–13 July 2001; p. 200.
Xie S., Xie Q., Wang D., Liu W. (2003). Summer upwelling in the south China Sea and its role in regional climate variations. J. Geophys. Res. 108 (C8), 3261. doi: 10.1029/2003JC001867
Xie L., Zhang W., Zhao H. (2012). Overview of studies on qiongdong upwelling. J. Trop. Oceanography (in Chinese) 31 (04), 35–41. doi: 10.3969/j.issn.1009–5470.2012.04.005
Xie L., Zong X., Yi X., Li M. (2016). The interannual variation and long-term trend of qiongdong upwelling. Oceanologia Limnologia Sin. (in Chinese) 47 (01), 43–51. doi: 10.11693/hyhz20150300069
Yang Y., Xie S., Du Y., Tokinaga H. (2015). Interdecadal difference of interannual variability characteristics of south China Sea SSTs associated with ENSO. J. Climate. 28 (18), 7145–7160. doi: 10.1175/JCLI-D-15-0057.1
Yu Y., Wang Y., Cao L., Tang R., Chai F. (2020). The ocean-atmosphere interaction over a summer upwelling system in the south China Sea. J. Marine. Syst. 208 (4), 103360. doi: 10.1016/j.jmarsys.2020.103360
Yu L., Yang K. (2022). A warm and a cold spot in cape cod waters amid the recent new England shelf warming. Front. Mar. Sci. 9. doi: 10.3389/fmars.2022.922046
Keywords: upwelling, trend, South China Sea, alongshore wind stress, wind stress curl
Citation: Liu S, Zuo J, Shu Y, Ji Q, Cai Y and Yao J (2023) The intensified trend of coastal upwelling in the South China Sea during 1982-2020. Front. Mar. Sci. 10:1084189. doi: 10.3389/fmars.2023.1084189
Received: 30 October 2022; Accepted: 16 January 2023;
Published: 07 February 2023.
Edited by:
Zhongya Cai, University of Macau, ChinaReviewed by:
Yuntao Wang, Ministry of Natural Resources, ChinaCopyright © 2023 Liu, Zuo, Shu, Ji, Cai and Yao. This is an open-access article distributed under the terms of the Creative Commons Attribution License (CC BY). The use, distribution or reproduction in other forums is permitted, provided the original author(s) and the copyright owner(s) are credited and that the original publication in this journal is cited, in accordance with accepted academic practice. No use, distribution or reproduction is permitted which does not comply with these terms.
*Correspondence: Jinglong Yao, eWFvamxAc2NzaW8uYWMuY24=
Disclaimer: All claims expressed in this article are solely those of the authors and do not necessarily represent those of their affiliated organizations, or those of the publisher, the editors and the reviewers. Any product that may be evaluated in this article or claim that may be made by its manufacturer is not guaranteed or endorsed by the publisher.
Research integrity at Frontiers
Learn more about the work of our research integrity team to safeguard the quality of each article we publish.