- 1Institute of Coastal Systems – Analysis and Modeling, Helmholtz-Zentrum Hereon, Geesthacht, Germany
- 2Institute of Oceanography, Center for Earth System Research and Sustainability, University of Hamburg, Hamburg, Germany
- 3Research Centre for Coastal Ocean Science and Technology, School of Marine Sciences, Sun Yat-Sen University, Guangzhou, China and Southern Marine Science and Engineering Guangdong Laboratory (Zhuhai), Zhuhai, China
The Pearl River Delta (PRD), where several megacities are located, has undergone drastic morphological changes caused by anthropogenic impact during the past few decades. In its main estuary, the water area has been reduced by 21% whilst the average water depth has increased by 2.24 m from 1970s to 2010s. The mainly human-induced morphological change together with sea level rise has jointly led to a remarkable change in the water stratification. However, the spatial and temporal variability of stratification in the estuary and associated driving mechanisms remain less understood. In this study, stratification in the Pearl River Estuary (PRE) in response to morphological change and external forcing is investigated by 3-dimensional numerical modeling. Simulation results indicate that stratification in the PRE exhibits distinct spatial and temporal variabilities. At a tidal-to-monthly time scale, variation of stratification is mainly driven by advection and straining through tidal forcing. At a monthly-to-seasonal scale, monsoon-driven river runoff and associated plume and fronts dominate the variation of stratification. Human-induced morphological change leads to an enhancement of stratification by up to four times in the PRE. Compared to an overwhelming human impact in the past few decades, future sea level rise would further enhance stratification, but to a much lesser extent than past human impacts. In addition, stratification in different areas of the estuary also responds differently to the driving factors. The western shoal of the estuary is most sensitive to changes in morphology and sea level due to its shallowness, followed by the channels and other parts of the estuary, which are less sensitive.
1 Introduction
Water column stratification is an essential characteristic of estuaries. Conventionally, according to stratification or vertical salinity structure, estuaries can be classified as salt wedge, strongly stratified, weakly stratified and well mixed types (Pritchard, 1955; Cameron and Pritchard, 1963). In tidal estuaries, stratification is normally determined by salinity gradients which result from a balance between the stratifying tendency of estuarine circulation and mixing by tides, with additional but short-term impacts generated by energetic weather events (Zhang et al., 2018). Stratification has important consequences for estuarine ecology and matter transport (Li et al., 2018a; Zhang et al., 2020; Zhang et al., 2021b) and environmental hazards such as hypoxia or anoxia may be triggered by a persistently stable stratification (Cui et al., 2019).
Estuaries and coastal seas are transition areas between land and ocean with profound changes exerted by human activities and climate change (Wu et al., 2016; Ralston and Geyer, 2019; Deng et al., 2020). Numerous observational and modeling studies have confirmed a significant modification in estuarine stratification by morphological changes and sea level rise. For example, the dredging of shipping channels results in enhanced estuary circulation and salinity intrusion in many estuaries (Kennish, 2003). Chant et al. (2018) demonstrated that a relatively small (15%) increase in depth by dredging in a short reach of an estuary may double the exchange of salt flux and remarkably increase stratification in the estuary. In contrast, Ralston and Geyer (2019) showed that channel deepening due to dredging may result in an increase in salinity intrusion but almost no change in the estuarine circulation, suggesting that the impact of channel dredging on stratification is nonlinear and site dependent. Sea level rise also influences the stratification of estuaries. Gong and Shen (2011) simulated the hydrodynamics of Chesapeake Bay in response to the projected sea level rise scenarios in the 21st century. Their results show that the bay-scale averaged stratification would strengthen along with a sea level rise and characterized by obvious seasonal and inter-annual variations. Through scenario simulation Chua and Xu (2014) found that sea level rise would increase the strength of gravitational circulation, resulting in higher vertical stratification by increasing the strength of salinity gradient and reducing the bottom-generated turbulence.
The Pearl River, located in the south of China, with an annual mean discharge of 336×109m3 (Zhang et al., 2009), is one of the world largest rivers in terms of river discharge (Figure 1A). The Pearl River Estuary (PRE) is featured by a complex channel network through its delta that hosts several megacities (Guangzhou, Shenzhen and Hong Kong) with a total population of 63.01 million (Zhang et al., 2021a). A major portion (~61%) of river discharge from the Pearl River to the continental shelf of the South China Sea is delivered through Lingding Bay (Figure 1C) (Han et al., 2021), where is subject to intense morphological changes by human activities (Wu et al., 2016). Since 1970s, frequent dredging in the two main shipping channels (i.e., east and west channels) have deepened the mean channel depth by more than 15% till 2010s. Meanwhile, the water area of Lingding Bay has decreased by ~170 km2 (8.1% of the total Lingding Bay water area in 1970s) due to land reclamation, and sediment input to the bay has been reduced by 70% by human activities at the catchment like river damming (Dai et al., 2007). A joint accumulative effect of land reclamation, channel dredging, river damming and sand excavation resulted in a decrease of water areas and a deepening of the mean water depth by 2.24 m from 1970s to 2010s over the entire Lingding Bay, with annual variation at local sites up to ± 5m/yr (Wu et al., 2016).
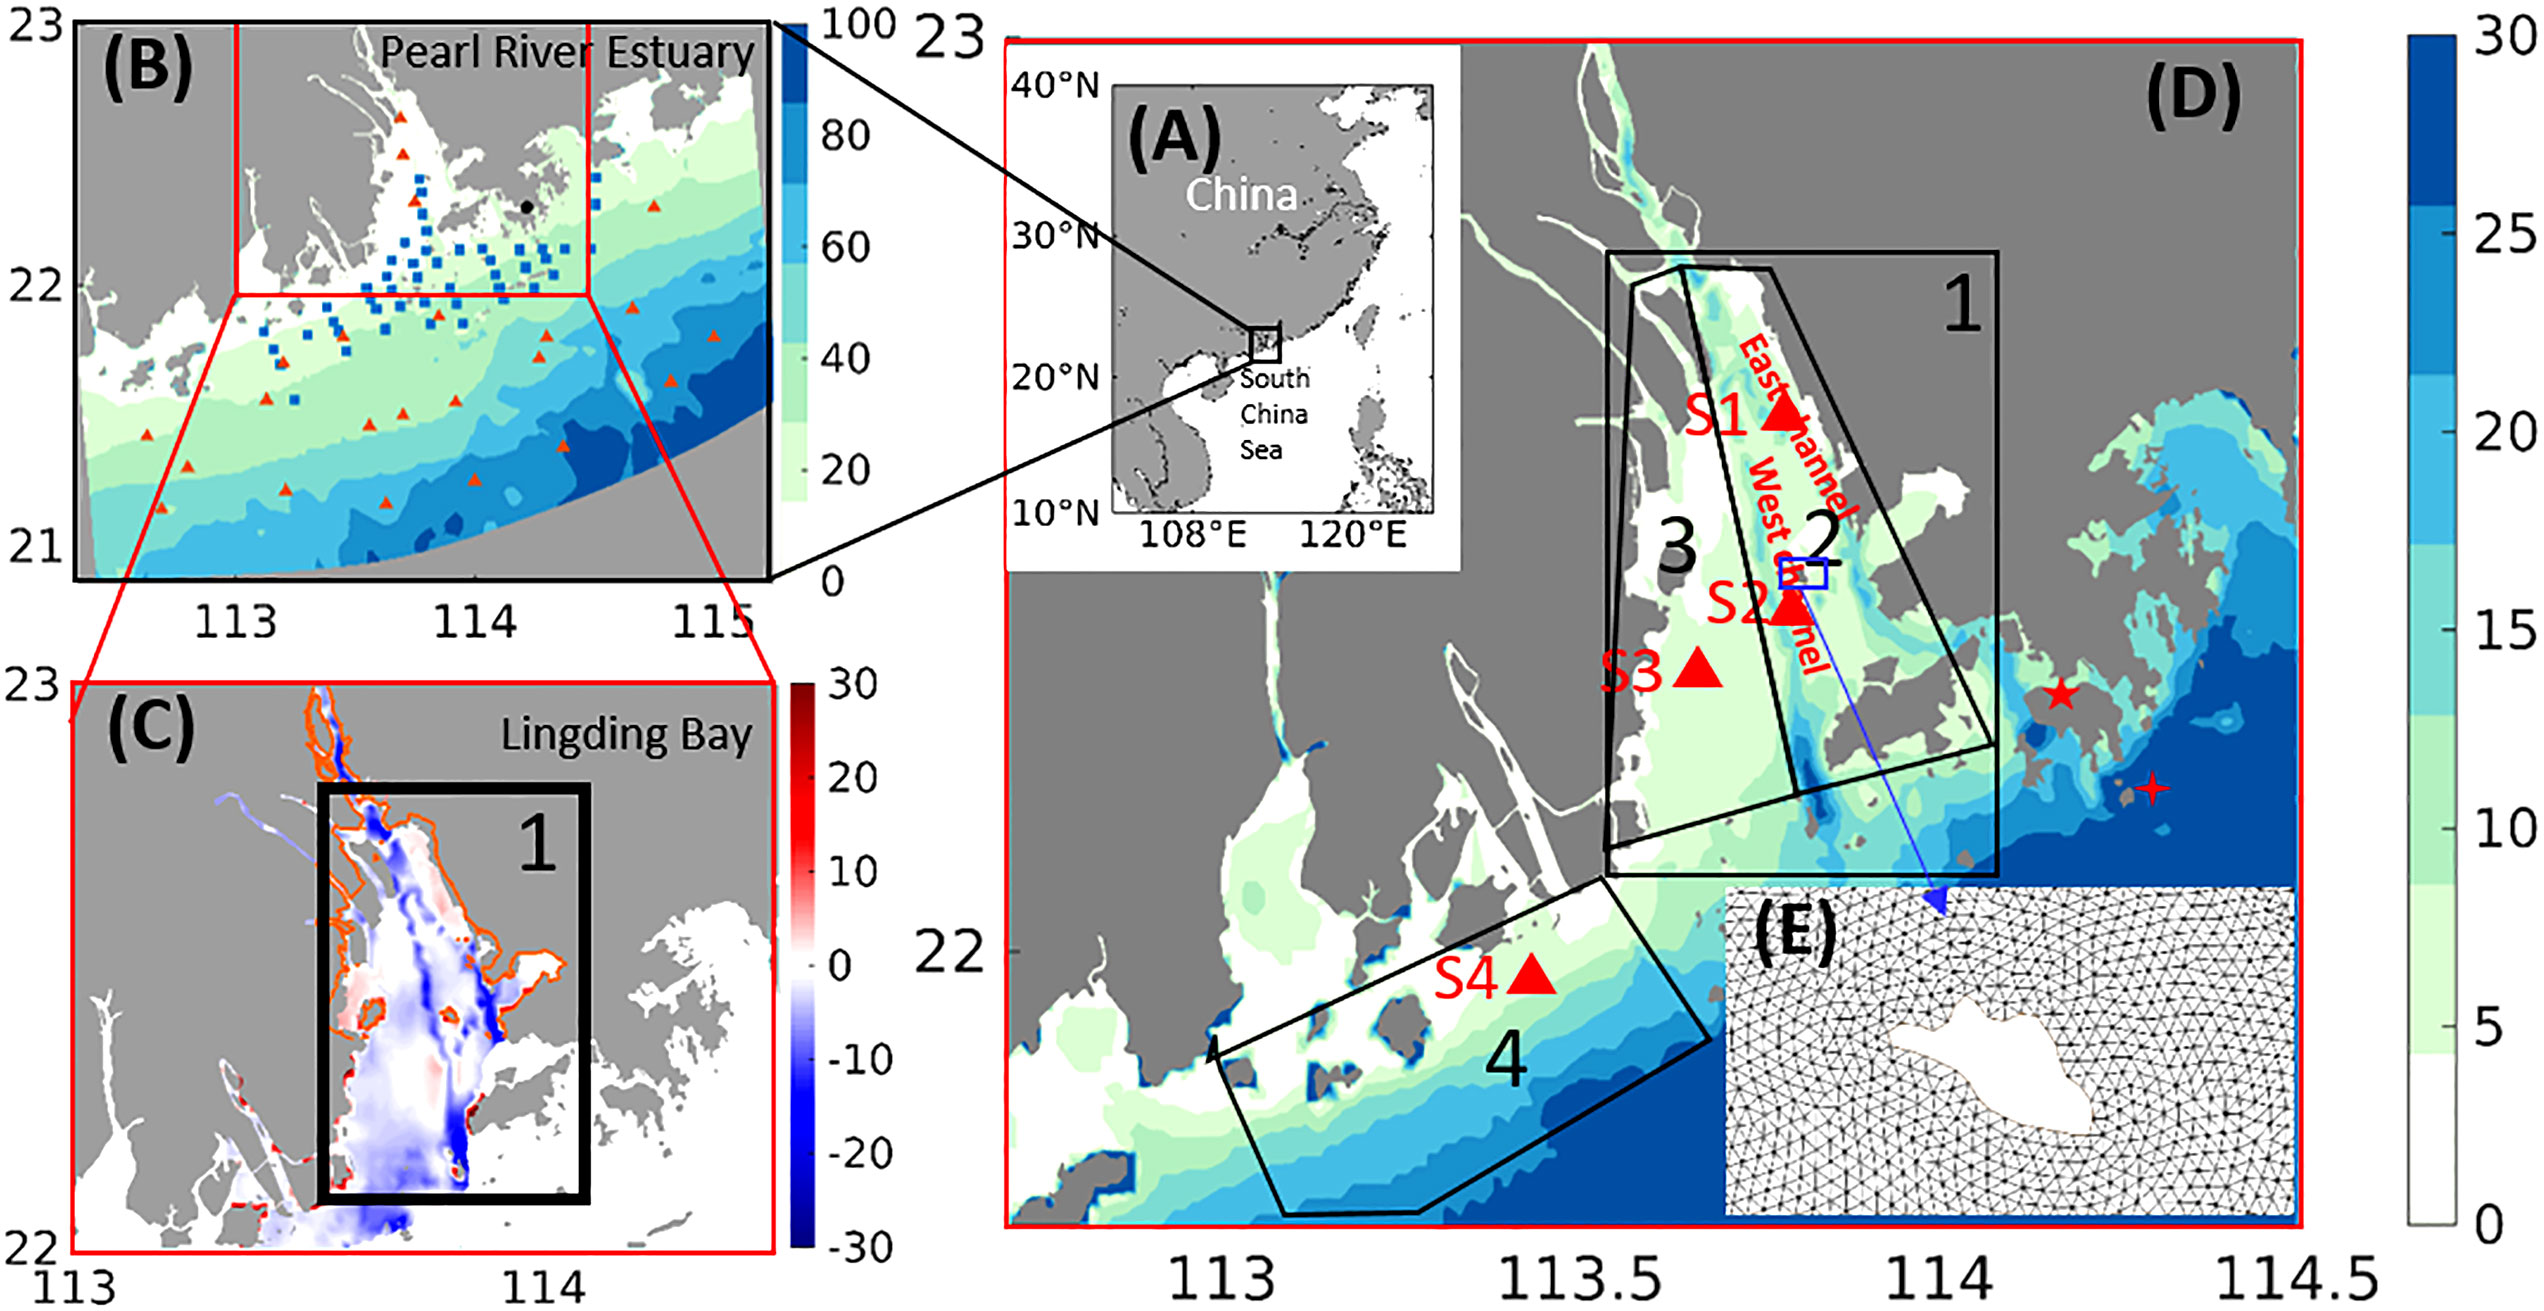
Figure 1 Location maps. (A) The location of the Pearl River Estuary in south China. (B) The model domain. Squares represent sites for salinity validation; triangles represent sites for temperature validation; the black dot is the location of the tidal gauge. (C) Bathymetric change from the 1970s to 2010s. The black frame indicates the Lingding Bay. The orange line refers to the shoreline in the 1970s. (D) Bathymetry (unit: m) of the PRE in 2010s, the marksed areas are: Zone 1 (Lingding Bay), Zone 2(channels), Zone 3 (west shoal), and Zone 4 (river plume dominated area). The four red triangles indicate the selected sites which are used to assess the stability of stratification. The five-pointed star indicates the location of Victoria harbor. The four-pointed star indicates the location of Waglan Island. (E) An example of computational grid around small island.
The mean sea level at the mouth of PRE rose at a rate of 3.1 mm/yr during 1954-2021 (https://www.hko.gov.hk/en/climate_change/obs_hk_sea_level.htm), and exhibits an accelerating trend in recent decades (Wong et al., 2003; Masson-Delmotte et al., 2021). Existing studies show that the impact of sea level rise on the estuarine circulation and stratification in the PRE is through a modification of tides and estuarine circulation. Based on three-dimensional hydrodynamic modeling, Hong et al. (2020) found that the salinity, stratification and tidal range all increase as sea-level rises and are characterized by clear spatial and seasonal variations. By calculating the water flux, Yuan et al. (2015) found that the upstream salinity intrusion increased linearly in the main channel (Modaomen) of the estuary with sea level rise, meanwhile the isohaline of 0.45 (which is the salinity standard for drinking water) moved offshore in other two smaller channels Jiaomen and Hongqimen.
Previous studies of stratification in the PRE mainly focused on the extent of saltwater intrusion. The spatial and temporal variation of stratification in the PRE in response to decadal-scale morphological change and sea-level rise remains largely unknown. As the PRE is a bell-shaped estuary, the tidal range and current in response to the morphological change and sea-level rise are highly nonlinear (Hong et al., 2020; Valentim et al., 2013). In the short term, the stratification strength varies from days to seasons, with a prominent variation in the tidal cycle (Luo et al., 2009). In the longer term, how the interaction between tides and river runoff responds to morphological change and sea-level rise and consequent impact on stratification are yet to be explored (Hong et al., 2020). The aim of this study is to contribute to addressing this question and quantify the role of morphological change and sea level rise in driving the variation of stratification in the PRD at multi-temporal and spatial scales by high-resolution 3-dimensional numerical modeling.
2 Data and methods
We used a 3-D model to simulate three scenarios, namely one historical scenario based on the morphology (bathymetry and coastline configuration) in 1970s, one present day scenario based on the morphology in 2010s and one future scenario for 2050s based on the present day morphology superposed by a moderate sea level rise of 20cm, which are represented by Run_1970s, Run_2010s and Run_2050s, respectively. Data for model setup and performance assessment as well as methods for result analysis are described in following sections.
2.1 Data
Several observational datasets obtained via field surveys and gauge stations in the study area as well as global hydrographic datasets and projections were used to initialize and validate the model. The topographic data used in this study primarily consist of historical bathymetrical maps of Lingding Bay (Deng et al., 2020). Two topographic datasets of Lingding Bay derived from the 1970s and 2010s were used for modeling in this study. Another two topographic datasets from 1980s and 1990s were additionally used for the analysis of morphological change during the period of 1970s - 2010s.
Compared to dominance by the human-induced morphological change between 1970s and 2010s, future change of stratification in the PRE would be mainly driven by climate change especially the sea-level rise because of a legal prohibition of land reclamation and sand excavation initiated in recent years (Zhao et al., 2015).
The historical mean sea level recorded at the estuary mouth (Vitoria Harbor at Hong Kong, https://www.hko.gov.hk/en/climate_change/proj_hk_msl.htm) was used in the simulation of the scenarios 1970s and 2010s. A sea level rise by 20 cm from present day level was used to study the sensitivity of stratification to a moderate sea level rise for a futures scenario corresponding to 2050. Recorded data from the Hong Kong Observatory indicate that the mean sea level in the station Victoria Harbour rose at a rate of ~3 mm/year during 1954-2021 (https://www.hko.gov.hk/en/climate_change/obs_hk_sea_level.htm). However, it is expected that future sea-level rise rate would be accelerated. The scenario simulation for 2050s in this paper is based on SSP2-4.5 from IPCC AP6, showing that the mean sea level of the world sea would rise at a mean rate of 5 mm/year in the future, which means that the sea level would rise by 20 cm until 2050s compared to that in 2010s. The SSP2-4.5 scenario considers intermediate greenhouse gas emissions, in which CO2 emissions around current level until 2050, then falling but not reaching zero by 2100. The probability for likely range of SSP2-4.5 to cover the outcome is at least 66% (IPCC, 2021). Thermal expansion of a warming ocean makes up 21-43% of the total global mean sea level rise in the scenario SSP2. The melting of land ice (glaciers and ice sheets) adds mass to the ocean (as freshwater), and makes up most of the remainder of global mean sea level rise (Couldrey et al., 2022).
Monthly river discharge data are available from the China Sediment Report (http://www.mwr.gov.cn/sj/tjgb/zghlnsgb/). Daily river discharge from July to September 2017 was collected from existing publications (Liu and Gan, 2020) to assess model performance against observations. In addition, historical data from the eight main outlets of the PRE (Liu and Gan, 2020; Yu et al., 2021) were collected to calculate the proportion of river tributary discharge.
The Copernicus Marine Environment Monitoring Service (CMEMS) data were used to specify the initial fields of temperature and salinity as well as to provide open boundary conditions in the study area (Shen et al., 2018). The CMEMS data is a reanalysis product of the global ocean eddy-resolving model (with 1/12 degree horizontal resolution and 50 vertical levels). Cruise data for surface water temperature and salinity during the period of July to September 2017 were collected from existing publications (Liu and Gan, 2020) to assess model performance.
Atmospheric forcing driven by monsoons was included in open boundary (CMEMS data) and interpolated into our model grid using wind, air pressure, precipitation, and net solar radiation obtained from European Centre for Medium Range Weather (ECMWF) ERA-interim (https://cds.climate.copernicus.eu/cdsapp#!/dataset/reanalysis-era5-single-levels?tab=overview). The spatial resolution of ERA-interim data is 0.25° × 0.25° and the temporal resolution is 1 day.
Eight primary tidal constituents (M2, S2, N2, K2, K1, O1, P1, Q1) were specified at the open boundary. The tidal data were extracted from the global TPXO9-atlas (https://www.tpxo.net/global/tpxo9-atlas). In addition, daily data of water level, salinity, temperature, and currents (u, v) from 1th June 2017 to 1th June 2018 obtained from CMEMS were specified at the open boundary. At the upstream river boundaries, a constant salinity of 3 psu was specified with a daily varying temperature extracted from the Himawari-8 satellite product (http://www.data.jma.go.jp/mscweb/en/index.html) from 1th June 2017 to 1th June 2018.
2.2 Methods
2.2.1 Hydrodynamic model and setup for the study area
The hydrodynamic model used in this study is the Semi-implicit Cross-scale hydroscience Integrated system Model (Zhang et al., 2016). SCHISM is developed from the SELFE model and includes new features that ensure its robustness in application to estuarine and coastal areas with complex coastline and morphology. In particular, SCHISM includes (1) a new advection scheme for the momentum equation which includes an iterative smoother to reduce excess mass produced by higher-order kriging method, (2) a new viscosity formulation to work robustly for generic unstructured grids and effectively filter out spurious modes without introducing excessive dissipation, and (3) a new higher-order implicit advection scheme for transport (TVD2) to effectively handle a wide range of Courant number as commonly found in typical cross-scale applications. In addition, the model shows a good performance in the eddying regime, which represents the last missing link for cross-scale modeling (Zhang et al., 2016).
The model domain covers the PRE and its eight river outlets spanning from 21 to 23°N in latitude and 112.4 to 115.25°E in longitude (Figure 1B), with a high grid resolution (~50 m) in the Lingding Bay and coarsening resolution (till ~1000 m) toward the open boundary at the shelf of the South China Sea. In particular, sparsely distributed islands in the PRE are resolved by a high-resolution grid so that their impact on hydrodynamics is included (Figure 1E). Three scenarios, namely Run_1970s, Run_2010s and Run_2050, were designed. The morphological data of 1970s and 2010s were used in the Run_1970s and Run_2010s, respectively. Land reclamation and sand excavation in the PRE were officially banned during the past decade (Tang et al., 2016). Therefore, it is expected that future morphological change until 2050 would not be as dramatic as the historical change between 1970s and 2010s. Dredging in the two main shipping channels is expected to continue to maintain the depth. Based on this, the Run_2050s adopted the morphology in 2010s but superposed by a 20 cm higher sea level compared to that of 2010s. The 3D hydrodynamic model time step was 60 seconds and the simulation period was one year (starting from 1st June 2017) in each scenario and adopted the same atmospheric forcing from 1st June 2017 to 6th July 2018. The simulation results of Run_2010s are assessed by observation data from 2017. Further details of model setup are provided in the Supplementary Material(Supplementary Table 1).
2.2.2 Potential energy anomaly
In this study, potential energy anomaly (PEA) φ (Simpson and Bowers, 1981) is used as a measure for stratification:
Where ρ is the vertical density profile over the water column of depth H, given by H = η + h, η is the free surface, h is the bed level, is the depth average density, z is the vertical coordinate, and g is the gravitational acceleration. The value of φ indicates the work required per unit of volume to cause a complete vertical mixing of the water column.
The water column is considered as stratified when φ exceeds the threshold 10 J/m3 (Chegini et al., 2020). Based on the scenario Run_2010s, the average value of φ>10J/m3 covers 89% of the time over the entire simulation in a major part of the study area. In order to distinguish strong stratification, another threshold φ>50J/m3 is used, above which the water column is highly stratified.
2.2.3 Gradient Richardson number
To evaluate the stability of vertical stratification, the gradient Richardson number Ri is computed by:
with the definition of buoyancy frequency
and the vertical shear
The water column is considered stably stratified when log10(Ri)≥1 (Chen, 2018).
2.2.4 Salinity variance balance
MacCready et al. (2018) introduced the concept of salinity variance to understand the budget change of salinity. Salinity variance is given by , where s is the in-situ salinity, is the salinity averaged over the entire water body of the estuary. According to Wang et al. (2017), the total salinity variance of an estuary can be calculated by:
where V indicates the whole estuarine water volume. Li et al. (2018b) separated the total salinity variance into two parts corresponding to the horizontal and the vertical components:
where represents the horizontal salinity variance and represent the vertical salinity variance.
In this study, we focus on vertical density stratification. For this reason, only the vertical salinity variance is considered. Based on the conservation of vertical salinity variance , Li et al. (2018) proposed a dynamic equation to describe the temporal change of the vertical salinity variance integrated over the entire water column:
where is the vertically averaged salinity, ∇h is the horizontal gradient operator, Uh is the horizontal velocity vector, and Kzz is the vertical eddy diffusivity. In a physical process-based understanding, Equation (7) can be expressed as Tendency + advection = straining + dissipation.
By using the above equations, Li et al. (2018b) quantified the influence of straining and mixing on stratification in the Yangtze estuary. Their research indicated that the salinity variance method could be used as a useful approach for examining the spatial and temporal variability of stratification in estuaries and coastal environments.
2.2.5 Sub-division of the study area for process understanding
To better understand the spatial variation in stratification, the study area is divided into four zones, as shown in Figure 1D, taking into account their distinct features in hydrodynamic conditions and morphology. Zone 1 covers the entire Lingding Bay. Zone 2 covers the channel area in the Lingding Bay, including two channels and the area in between. Zone 3 covers the west shoal of the Lingding Bay and Zone 4 covers the coastal area dominated by the river plume.
3 Results
3.1 Model validation
To assess the model performance, simulation results of the scenario Run_2010s were compared to observation data (salinity and temperature) collected in a cruise from 11th to 21th of July 2017 (Yu et al., 2021) as well as water level recorded at a fixed gauge station (Waglan Island, Figure 1B).
The comparison demonstrates a general satisfactory model performance in capturing both spatial and temporal variations of water level, salinity and temperature (Figure 2). The recorded tidal amplitude is ~2 m at the gauge station (Waglan Island) and the Root Mean Square Error (RMSE) of the simulated water level is 0.15 m, corresponding to 7.5% deviation from observation. The data show a dominance of semi-diurnal tides with a distinct spring-neap cycle in the study area. Salinity constantly changes under the effect of tides (Figure 2B). The correlation coefficient between the simulated surface water salinity and field data is 0.93, and the RMSE is 2.7 psu. The Taylor diagram of the simulated sea surface temperature compared to field data indicates a high correlation coefficient between 0.95 and 0.99, and a RMSE within 1°C. Based on the satisfactory agreement between observation and simulation for the surface water, and the understanding that surface water dynamics in the estuary, especially temporal and spatial variation of temperature and salinity, is jointly controlled by interaction between freshwater discharge and bottom saline water, we therefore believe that the model also reliably captures the bottom water dynamics which is not covered by existing observation data. The overall good model performance allows for using the extended simulation results (for 400 days in each scenario) to derive insights into the impact of morphological change and sea-level rise on variation of stratification in the PRD at multi-temporal and spatial scales.
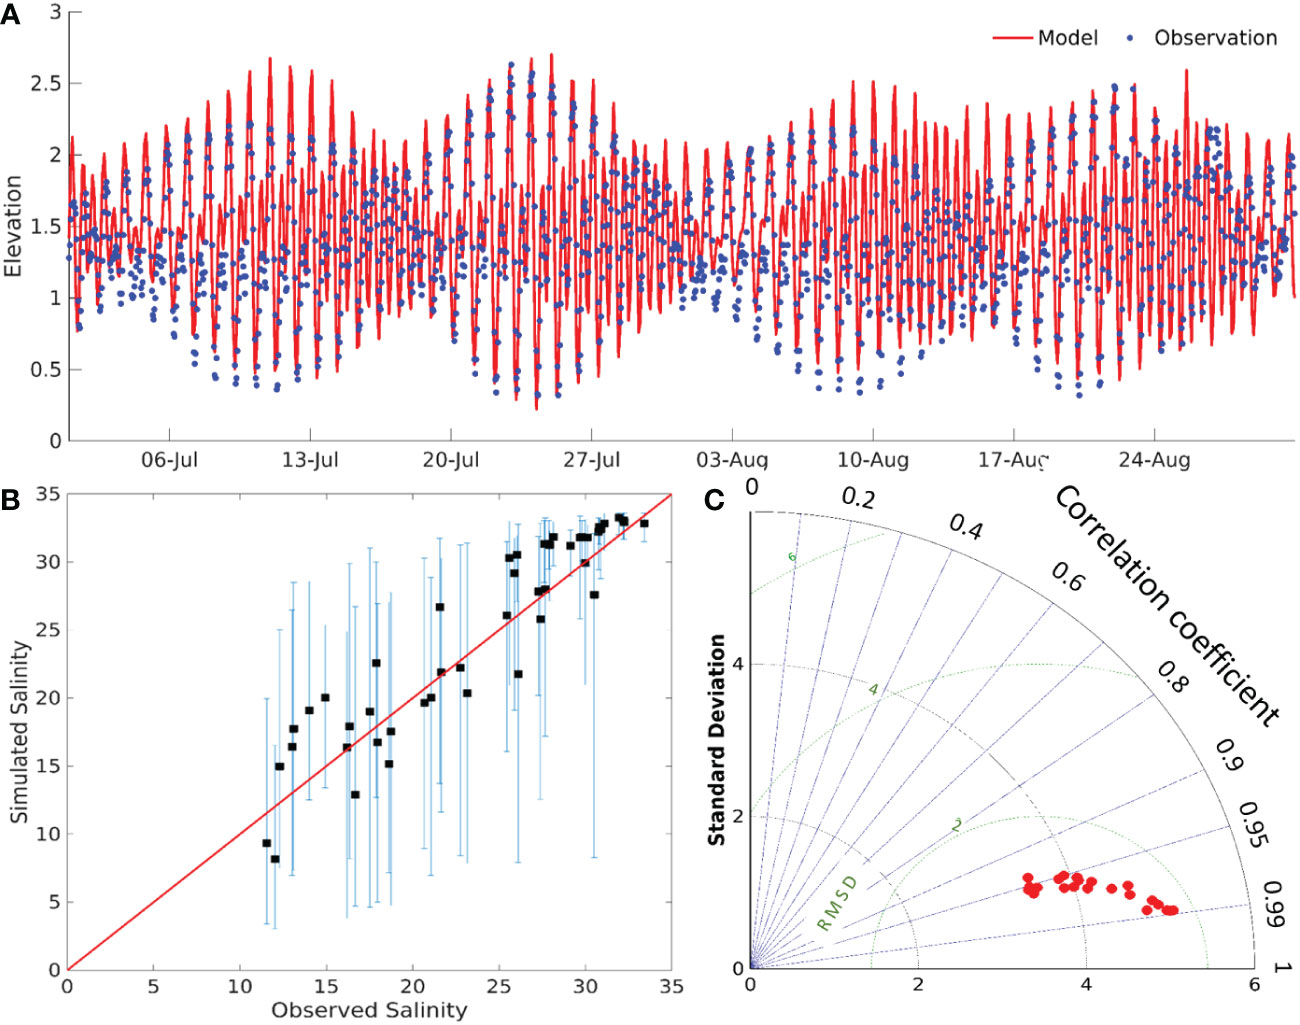
Figure 2 Comparison between model result and field data of (A) water level at the gauge station Waglan Island and (B) surface salinity collected during a research survey in July 2017 by Yu et al. (2021). In addition, simulated temporal variation of surface salinity within a tidal cycle at each measuring station is indicated by the bar crossing the measured value. Location of the stations is shown in Figure 1B. (C) Taylor diagram showing the standard deviation, the correlation coefficient, and the RMSE of simulated surface temperature against field data at 23 stations. Location of the stations is shown in Figure 1B by red dots.
3.2 Variability of stratification and driving factors
The morphology of the PRE changed considerably from 1970s to 2010s, especially in the Lingding Bay (Figure 1C). The average depth of Lingding Bay (Zone 1) increased by 2.24 m. The most significant deepening occurred in the channels (Zone 2) due to dredging, with a mean depth increase of 4.85 m and local maximum of 12 m in the southern Lingding Bay, close to the Lantau island. Depth of the western shoal area (Zone 3) was increased by approximately 1 m on average (the calculation is based on the water area of 2010s), whilst the area close to the west bank became shallower and the coastline extend to the sea due to land reclamation. The total water area of the Lingding Bay decreased by approximately 170 km2 because of land reclamation, accounting for 8.1% of the total water area in the 1970s. Most reduction of water area occurred in west shoal (Zone 3), with 14.32% of its total water area in the 1970s transformed to land till 2010s by artificial reclamation. The overall trend of changes in the Lingding Bay was narrowing and deepening from 1970s to 2010s.
River runoff in the PRE has a remarkable seasonality driven by monsoon. A direct comparison of the spatial distribution of stratification among the three scenarios can be seen in the salinity difference between the bottom and surface water averaged in two representative seasons (Figure 3). The wet season from 1st July to 1st September is characterized by a mean river runoff of 2.5×10⁴m3/s, while the dry season from 1st October to 1st December has a much reduced mean river runoff of 0.75×10⁴m3/s. Model results indicate a salinity increase in the bottom water of Lingding Bay by about 70% during the wet season and about 50% during the dry season from 1970s to 2010s. In contrast, the increase of salinity in the bottom water of the Lingding Bay from the 2010s to 2050s is 3.5% and 2.1% in the wet and dry seasons, respectively.
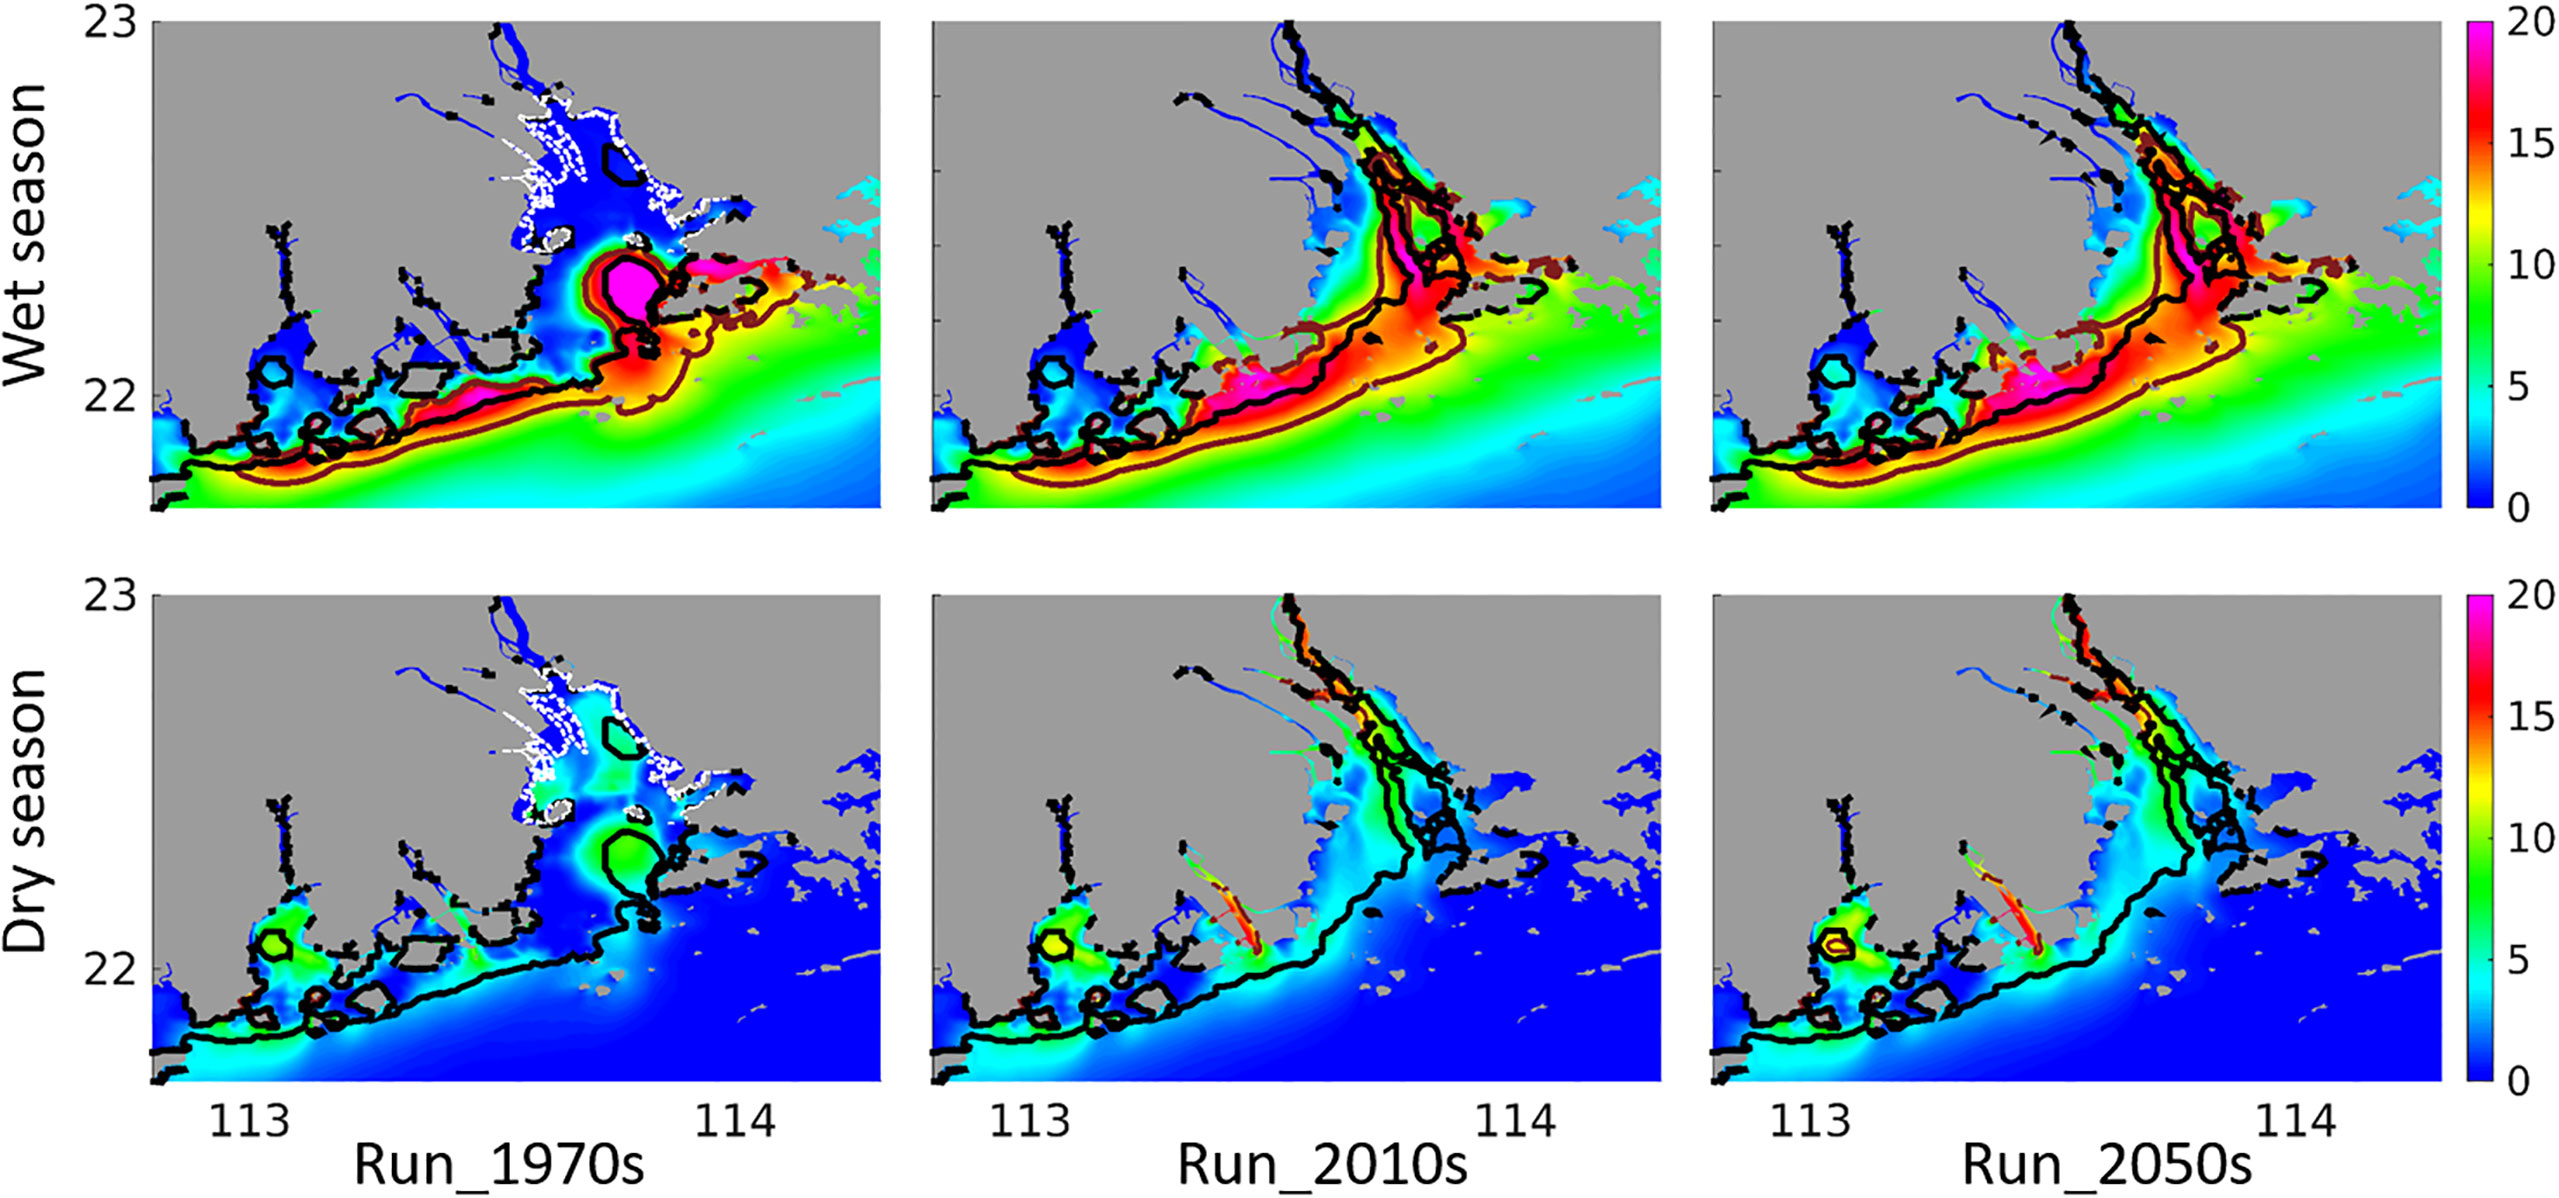
Figure 3 The salinity difference from bottom to surface in wet and dry season of Run_1970s, run_2010s and Run_2050s, areas with salinity difference values greater than 12 psu is surrounded by brown lines. The black line indicates the 7-m isobath. The white dashed line in the Run_1970s refers to the location of coastline in 2010s. (Unit: psu).
The salinity difference of 12 psu between the bottom and surface water can be used as a simple indicator for stratification (depicted by the brown line in Figure 3) as proposed by Li et al. (2017). As shown in Figure 3, the morphological change from 1970s to 2010s has notably changed the spatial distribution of stratification in the Lingding Bay. In the simulation result of 1970s, we found that the 7-m isobaths (described by the black lines in Figure 3) roughly describe the northern edge of stratification in the wet season. Stratification is mainly located in the outer the Lingding Bay and the river plume dominated area (Zone 4). Whilst in the 2010s, although the northern edge of stratification is still mostly limited by the 7-m isobaths in the wet season, stratification extends to the interior the Lingding Bay along the two channels (Zone 2) and appears in the western shoal (Zone 3) and further expands in Zone 4 due to the morphological change. Compared to the wet season, stratification in the dry season is weaker but with a different spatial pattern (Figure 3). Due to decrease in river runoff, stratification appears in the upper part of the Lingding Bay and extends into the rivers. Stratification in the Run_2050s shows very minor difference with the Run_2010s in both wet and dry seasons, suggesting a minor role of sea level rise (by 20 cm) in controlling the spatial pattern of salinity difference between bottom and surface water in the study area.
3.2.1 Variation caused by morphological change
To further understand the spatial and temporal variation of stratification and driving processes behind, the potential energy anomaly (φ) the four terms in Equation 4 are quantified for each sub-region for each scenario and compared accordingly. A variation index σmc, calculated by σmc=φ2010s/φ1970s where φ2010s and φ1970s represent the potential energy anomaly in the Run_2010s and Run_1970s, respectively, is used to indicate the change of stratification induced by the morphological change between the 1970s and 2010s, while σsc=φ2050s/φ2010s is used to indicate the change of stratification induced by sea-level rise.
The daily value of φ for each sub-region in the three scenarios is shown in Figure 4. The results cover the period of simulation, which includes variation in wet and dry season. Results of both wet season and dry season were shown. There exists a persistently strong stratification (φ≥50J/m3) in the PRE during the wet season in all scenarios (Run_1970s, Run_2010s and Run_2050s), due to the large river runoff. Morphological changes mainly occurred in the Lingding Bay (Zone 1). Consequently, enhancement of stratification also mainly occurs in the Lingding Bay. In the channel area (Zone 2), stratification is always strong in the wet season, whilst in the dry season the strength of stratification becomes much weaker with φ normally ranging between 10 and 30 J/m3 in all three scenarios (Run_1970s, Run_2010s and Run_2050s). In the west shoal area (Zone 3), strong stratification does not occur before the morphological change (Run_1970s), but occasionally occurs after the morphological change (Run_2010s and Run_2050s) in the wet season. Stratification in the river plume dominated area (Zone 4) exhibits similar change to that in Zone 3 in the wet season, but in the dry season the value of φ is almost the same in all scenarios in Zone 4 whilst periodic enhancement in φ is seen in Zone 3.
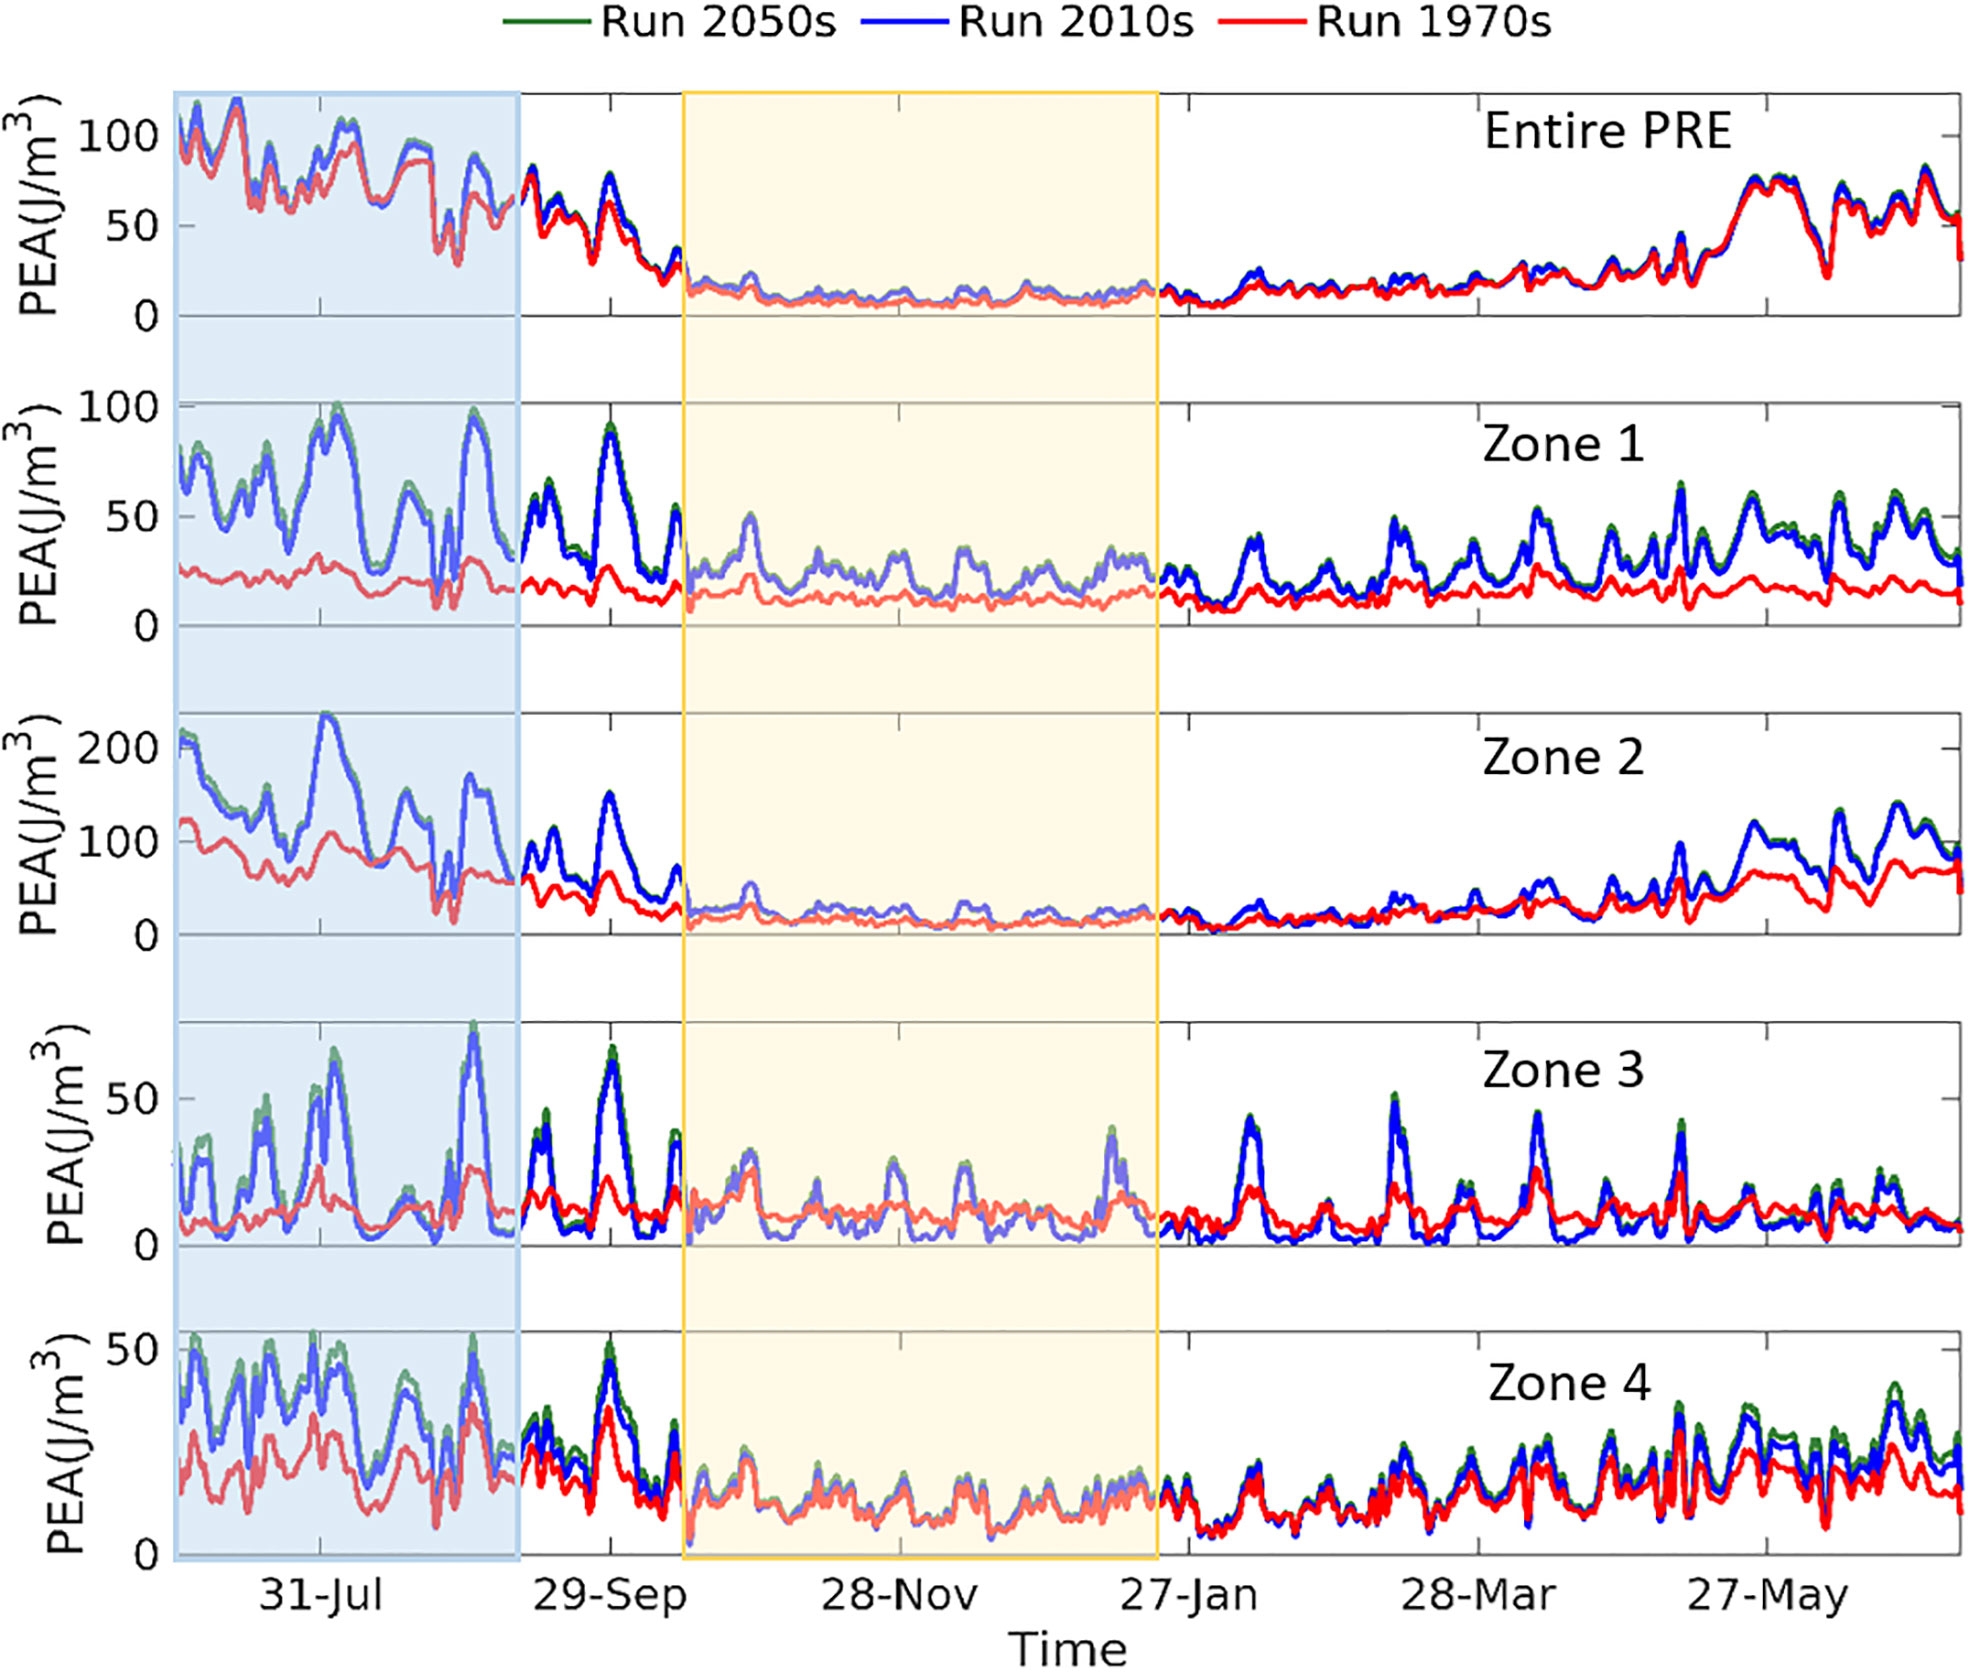
Figure 4 Time series of daily-averaged potential energy anomaly (φ) in the entire PRE and different sub-regions in the three scenarios (Run_1970s, Run_2010s and Run_2050s). The light blue and yellow rectangles indicate the wet season (July and August) and dry season (October, November and December), respectively.
The enhancement of stratification due to morphological change in the entire PRE is most significant in the wet season. In the wet season, the strength of stratification averaged over the Zone 1 and 2 is up to 4 times and in Zone 3 even up to 7 times stronger in the Run_2010s than that in the Run_1970s, while in the dry season the enhancement of stratification by morphological change becomes less prominent (Table 1). Besides a general strengthening of stratification in the wet season, the enhancement also exhibits some obvious periodic cycles (Figure 4). Figure 5 indicates that this periodic enhancement is caused by the spring-neap tidal cycle. These results indicate that the stratification of the Lingding Bay becomes much more sensitive to tidal and river runoff impact after the morphological change.

Table 1 The factor by which the stratification is enhanced due to morphological changes and sea-level rise in different areas.
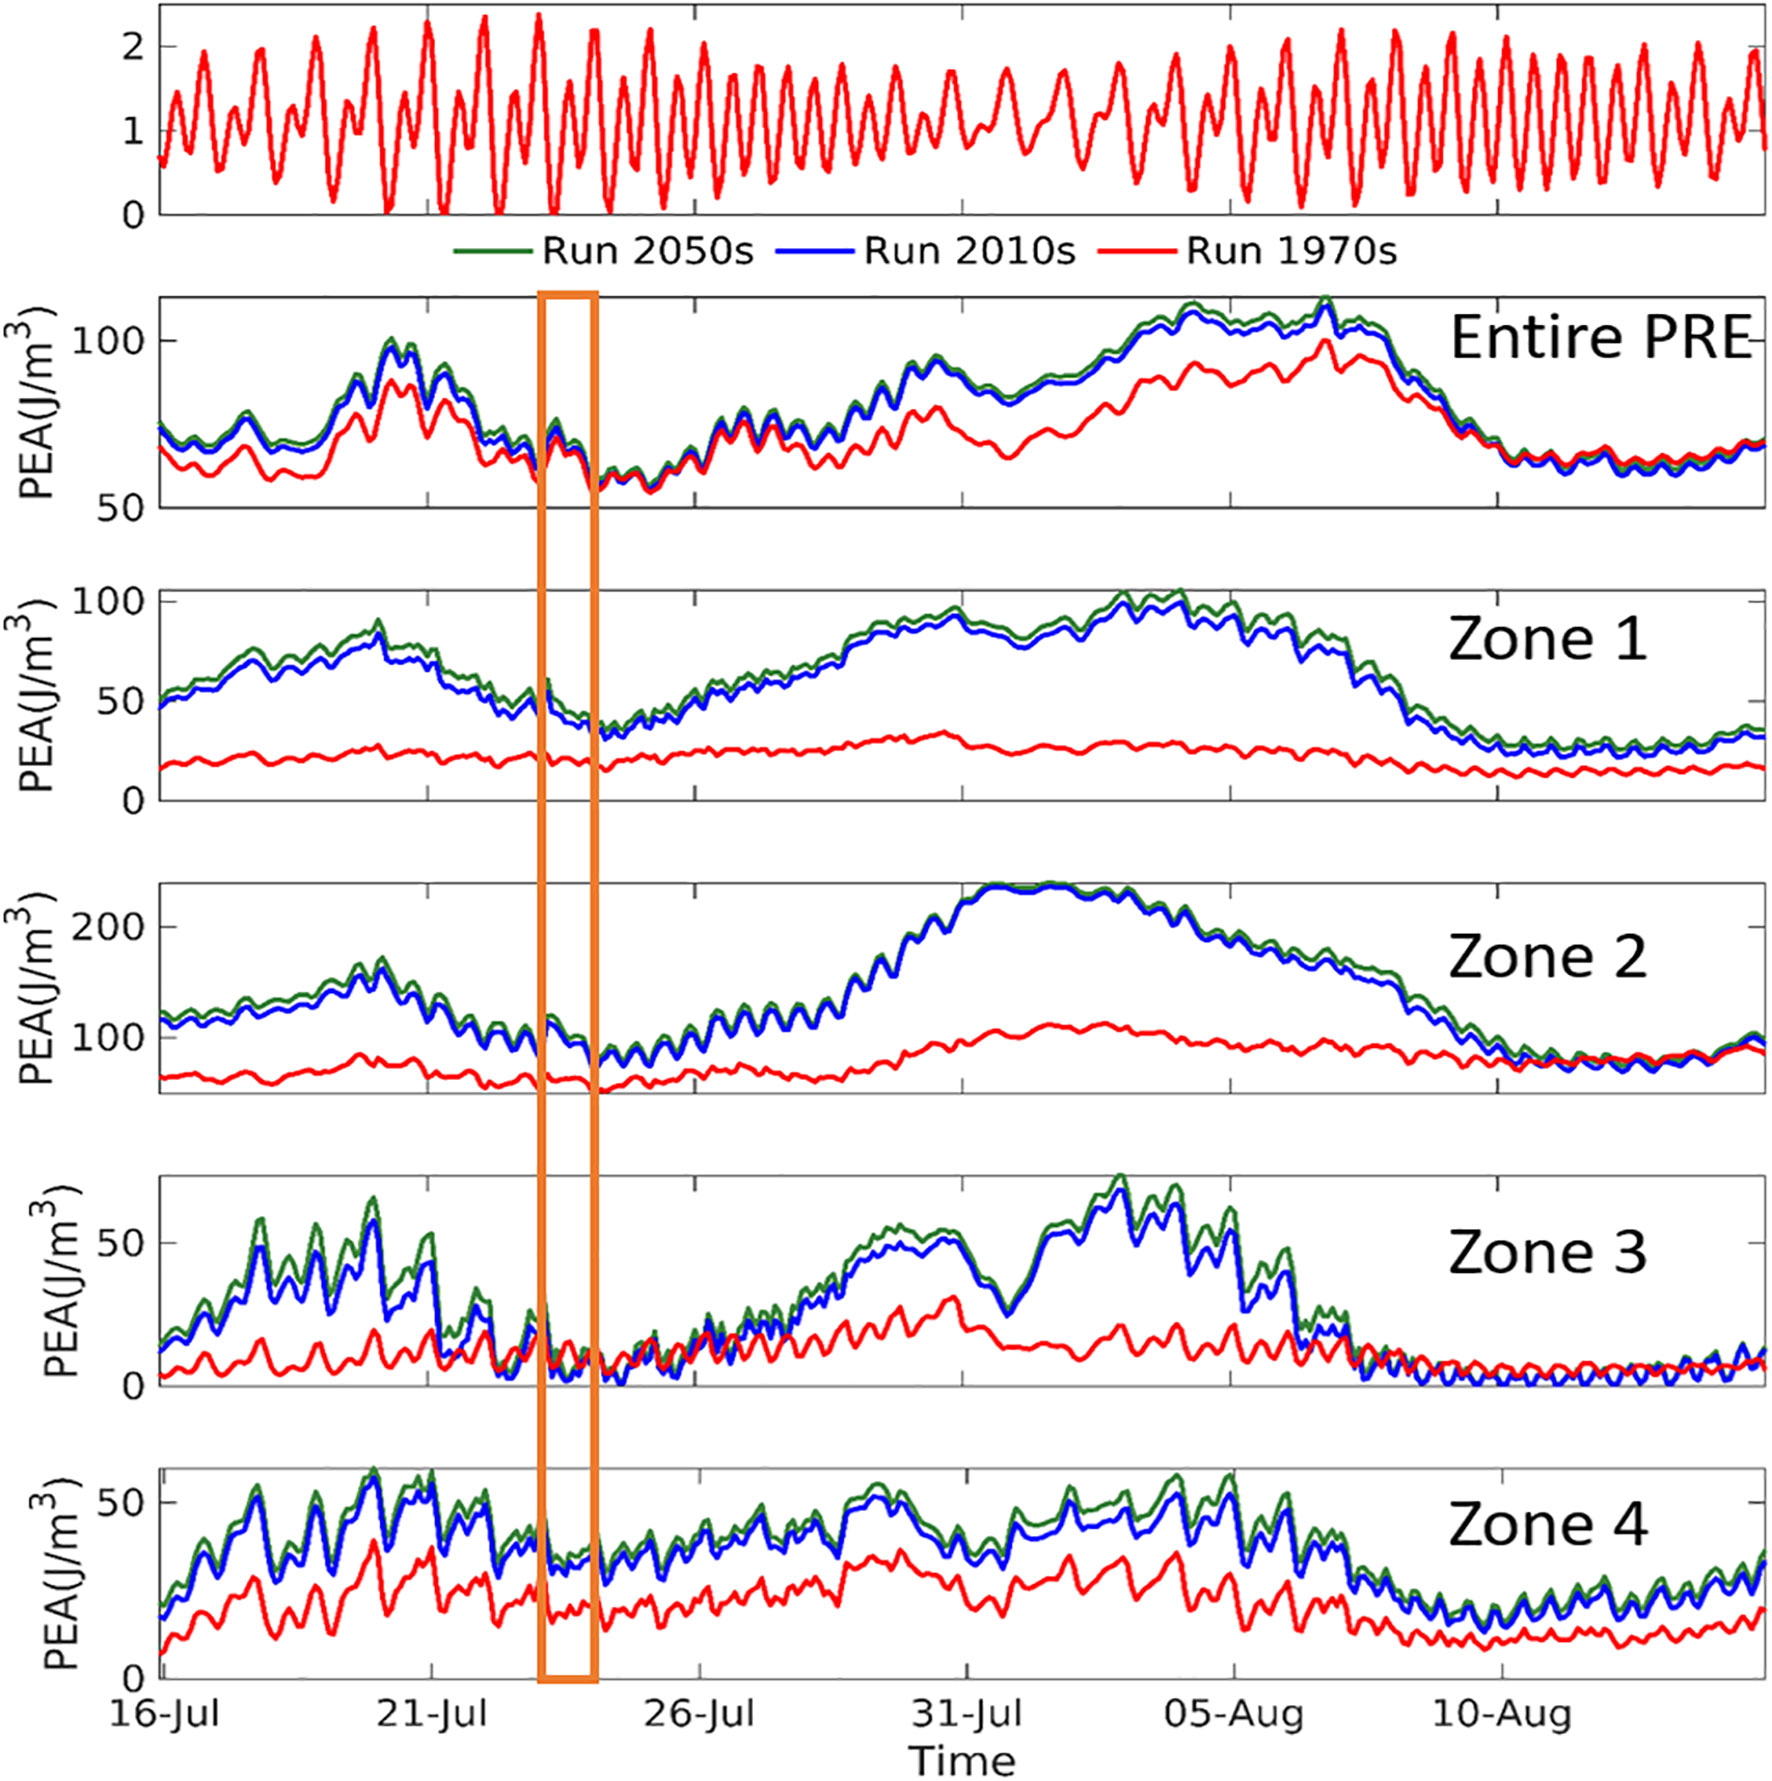
Figure 5 Potential energy anomaly (φ) in different sub-regions in the three scenarios from 16 July to 15 August. Duration of the typhoon Roke is marked by the orange rectangle.
Tides affect stratification in the PRE mainly at short time scales from hours extending to spring-neap cycle. Tidal signals are clearly seen in the time series of φ at each sub-region (Figure 5). Spectral analysis of φ in the Run_2010s shows that the tide-driven fluctuation of φ is mainly at M4, M2, and K1 cycles, which is consistent with field observation (Mao et al., 2004). According to the simulation results, morphological change in the Lingding Bay (Zone 1) from 1970s to 2010s results in an increase intidal in this region, the increase range gradually decreases from north to south, and the maximum increase can reach 0.5 m in the northern of the Lingding Bay near the coastline. The increase of tidal amplitude caused by the changes of coastline (Shen et al., 2018); and the deepening of the channels area (Zone 2) makes stronger tidal flow than before(Run_1970s) in the Lingding Bay, which leads to stronger salt water intrusion. Both the increase of tidal amplitude and the intensification of tidal flow lead to a nonlinear response of stratification.
Before the morphological change (i.e. in the Run_1970s), φ 1970s in the Lingding Bay (Zone 1) fluctuates mildly around 25 J m-3 in the wet season and slightly higher than 15 J m-3 in the dry season. The impact of spring-neap tidal cycle is hardly visible. By contrast, φ 2010s exhibits a positive correlation with the tidal cycle, and fluctuates between 25 to 100 J m-3 during the spring-neap tidal cycle (Figures 4, 5). The enhancement of stratification caused by the morphologic change σmc ranges between 1 and 4 depending on the tidal phase. The peaks of σmc appear normally before the peak of spring tides, and the troughs appear after the spring peaks but before the neap tides. Advection is primarily responsible for this phenomenon (Figure 6), as the advection term (Equation 4) increases by about three times during the transition from neap tides to spring tides. It can be seen in Figure 6 that the advection of the horizontal gradient of salinity variance is the main contributor to stratification. During the advection process, the vertical salinity variance increases significantly (by about 200% on average) with a strong saltwater intrusion from the bottom, resulting in an import of salinity variance to the Lingding Bay.
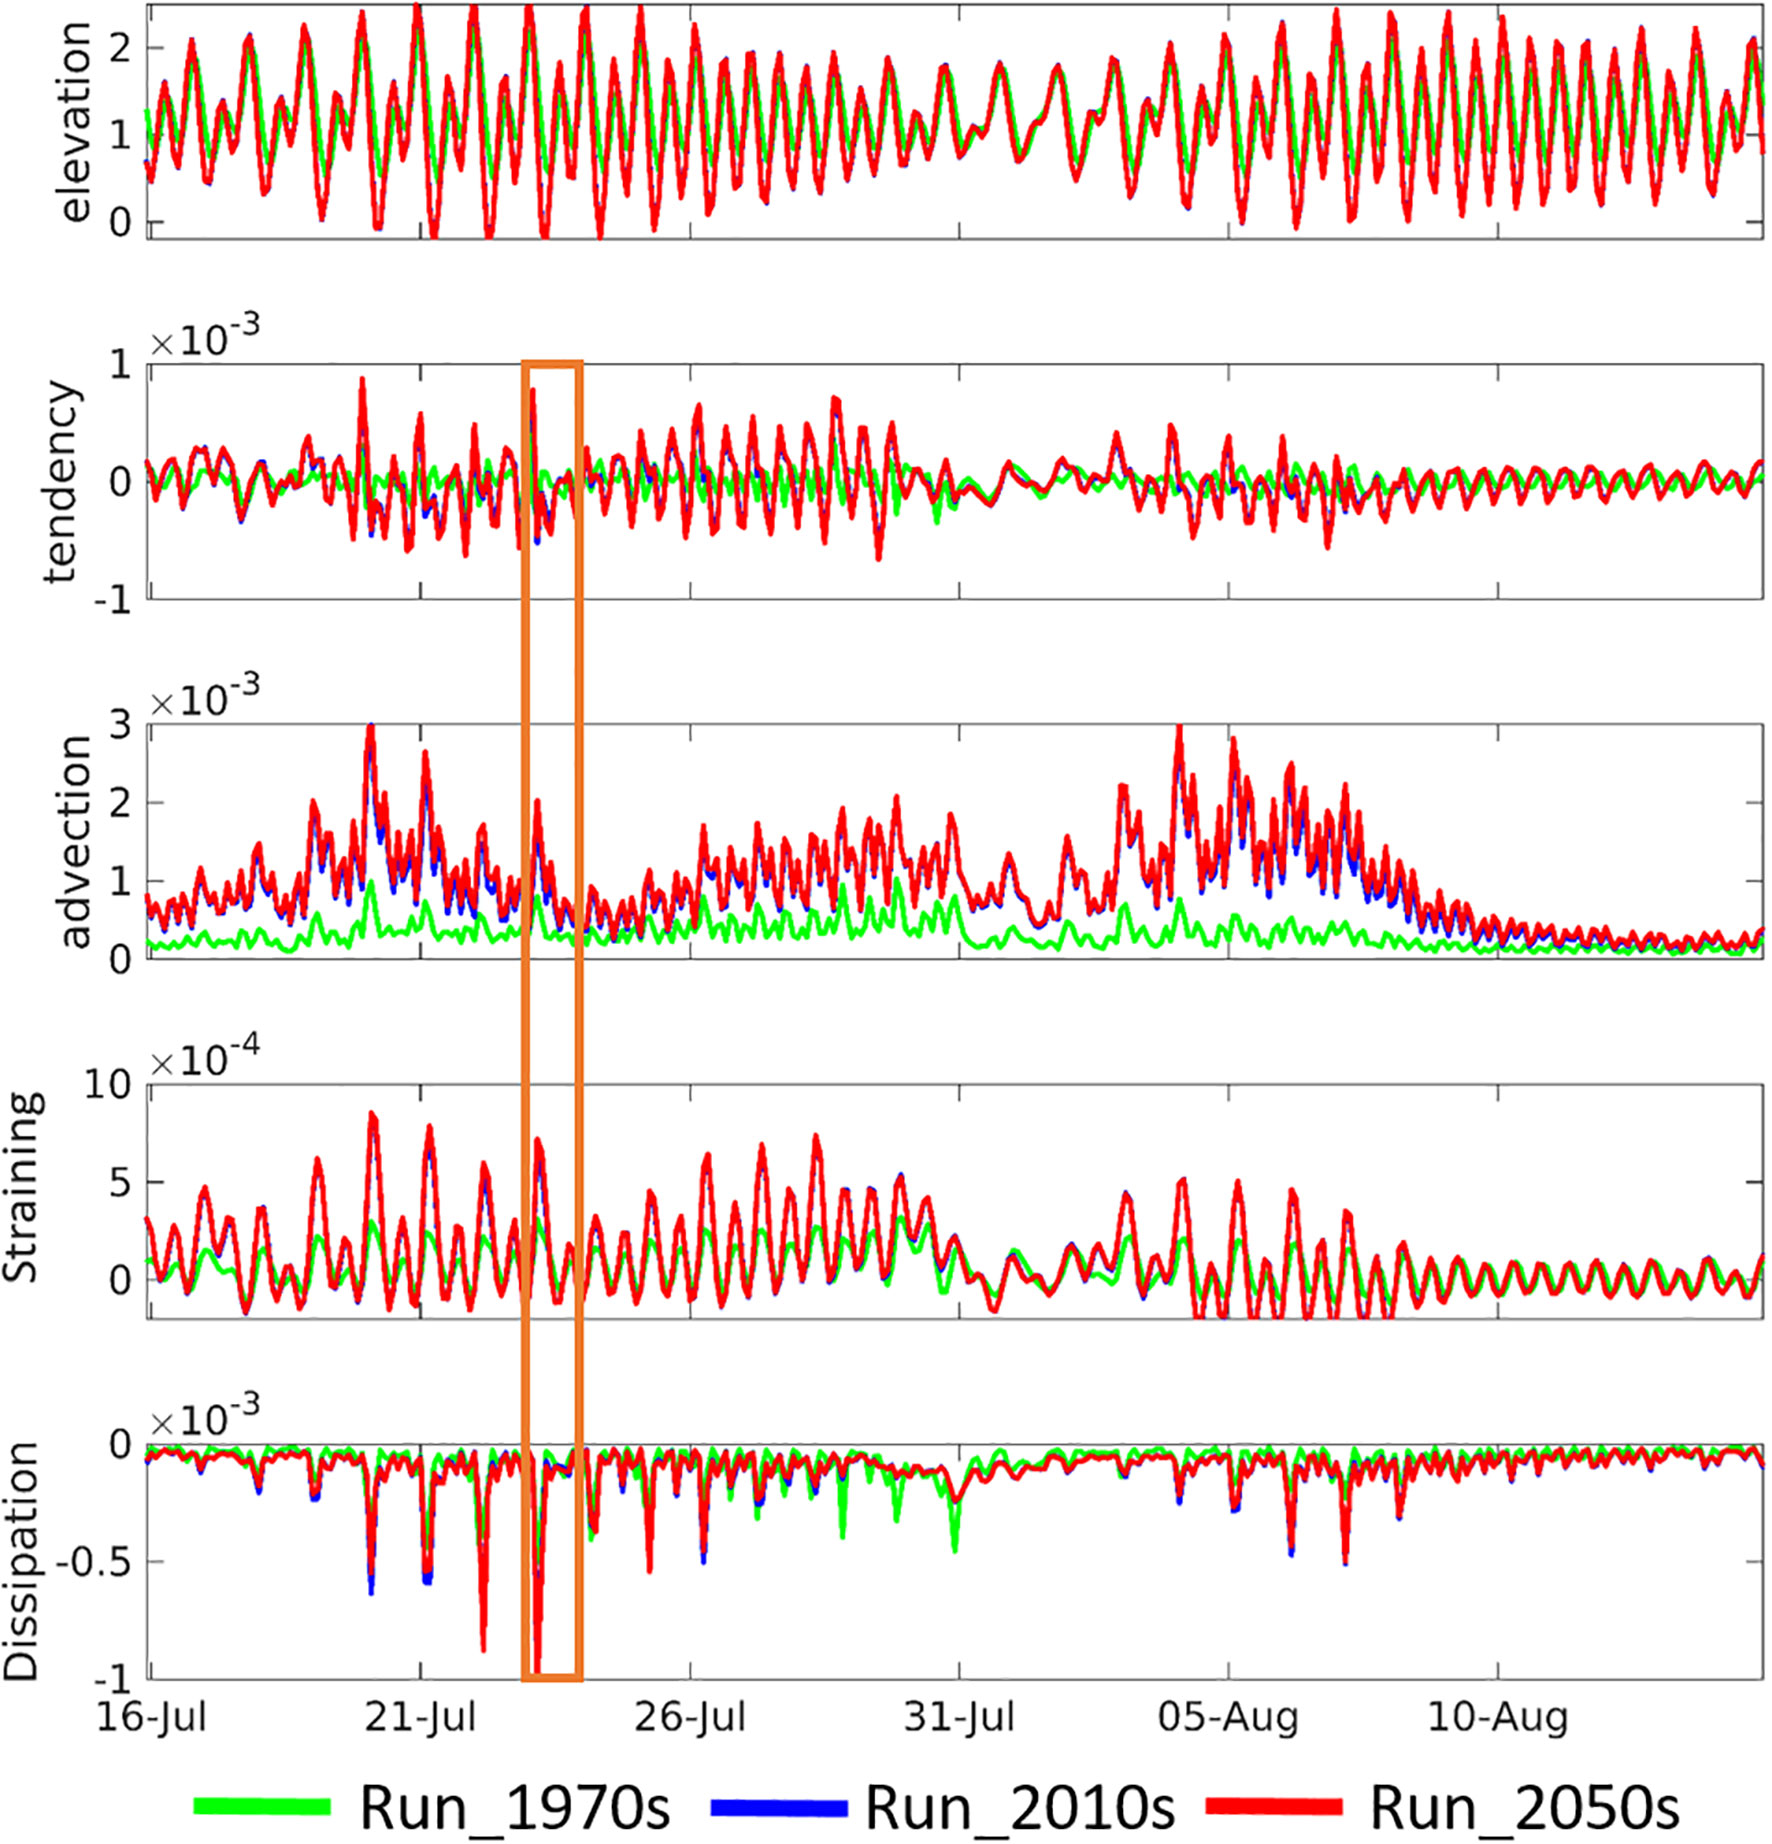
Figure 6 Spring-neap tidal cycle reflected in the change of water level and corresponding change in the vertical salinity variance (tendency, advection, straining, dissipation) in the Lingding bay (Zone 1). Duration of the typhoon Roke is marked by the orange rectangle.
In the channels of the Lingding Bay (Zone 2), stratification is more significant than in other sub-regions, which is attributed to a strong saltwater intrusion, similar to many other estuarine channels (Xu et al., 2008; Ralston and Geyer, 2019). The response of stratification to morphological deepening in the channels is similar to that in the entire Lingding Bay (Zone 1) as seen in Figures 4, 5 as well as Table 1. Advection is the main controlling process for variation of stratification in the channels. In the west shoal area (Zone 3), φ1970s fluctuates mildly around 10 J m-3 without obvious seasonal variation. This means that water is between well mixed and weakly stratified in this area before the morphological change (Run_1970s). By contrast, a clear fluctuation related to the spring-neap tidal cycle is seen in φ2010s, which can reach up to 70 J m-3 in the wet season during the transition from the neap tides to spring tides, approximately 7 times larger than that in the Run_1970s. This result indicates that the morphological change alters the west shoal (Zone 3) from a well mixed/weakly stratified environment in 1970s to periodically strongly stratified environment in 2010s.
Compared to the sub-regions Zone 1-3, the river plume dominated area (Zone 4) appears to be less affected by the morphological change (Figures 4, 5; Table 1). In the dry season, stratification is only slightly enhanced by morphological change (up to 1.2 times) and sea level rise (up to 1.15 times), while in the wet season, stratification is persistently enhanced by morphological change (up to 2.5 times) and sea level rise (up to 1.25 times) and can exceed the threshold of strong stratification (φ=50 J m-3) episodically during neap tides and transition to spring tides.
Short-term extreme events such as typhoons also impact the stratification in the PRE. Three typhoons (Roke on 23rd July, Hato on 22-23rd August, Pakhar on 26-27th August, www.hko.gov.hk) occurred in 2017 and were included in the simulations. Impact of the typhoon Roke (23rd July) was shown in Figure 5. In the Run_1970s, there is no obvious response to the typhoon in the channels (Zone 1 and 2) and the shoal area (Zone 3). The reduction in stratification occurs only in the river plume-dominated area (Zone 4). After the morphological change, stratification is significantly reduced by the typhoon in every sub-region in the Run_2010s and 2050s. This is caused by a higher landward advection of salt water induced by the typhoon, as well as higher straining and dissipation (Figure 6). However, typhoons impact stratification in the PRE only for a short-term and the system rapidly (in 2 days after the typhoon Roke) restores to a tide-driven status after the typhoon passage.
At a monthly-to-seasonal scale, monsoon-driven river runoff dominates the variation of stratification (Figure 4). The location of stratification is bounded by the estuarine fronts. The fronts in the PRE are formed by salinity gradient between the riverine water and saline shelf waters (Wong et al., 2004).
To identify the location of the fronts, the horizontal salinity gradient in surface and bottom water is calculated respectively in the three scenarios with peak values (>0.0015 psu/m) indicating the fronts (Figure 7). Results show that in the surface water (Figure 7A), the front is dominated by the river runoff, and is mostly located in the outer estuary and the estuarine plume area (Zone 4) in the wet season of all three scenarios. As river runoff decreases, the surface front moves landward in the dry season. In the Run_1970s, the surface front is located in the middle of the Lingding Bay, exhibiting a belt-like shape. After the morphological change (Run_2010s), the surface front is located in the inner part of the Lingding Bay and close to the river outlets. This is also the case in the Run_2050s. In the bottom water (Figure 7B), result of the Run_1970s shows that the front is roughly limited by the 7m isobath of the Lingding Bay in the wet season, whilst in the Run_2010s and Run_2050s, the front is located along both sides of the two shipping channels, on the shoal between the channels and the western shoal (Zone 3). These results indicate that the shoals have become the place for the frontogenesis (in the wet season) after the morphological change. In the dry season, the bottom front in the Run_1970s is located quite close to the surface front, indicating a vertically homogeneous but horizontally stratified state. After the morphological change, the fronts retreat onshore and are located close to the river outlets (Run_2010s and Run_2050s).
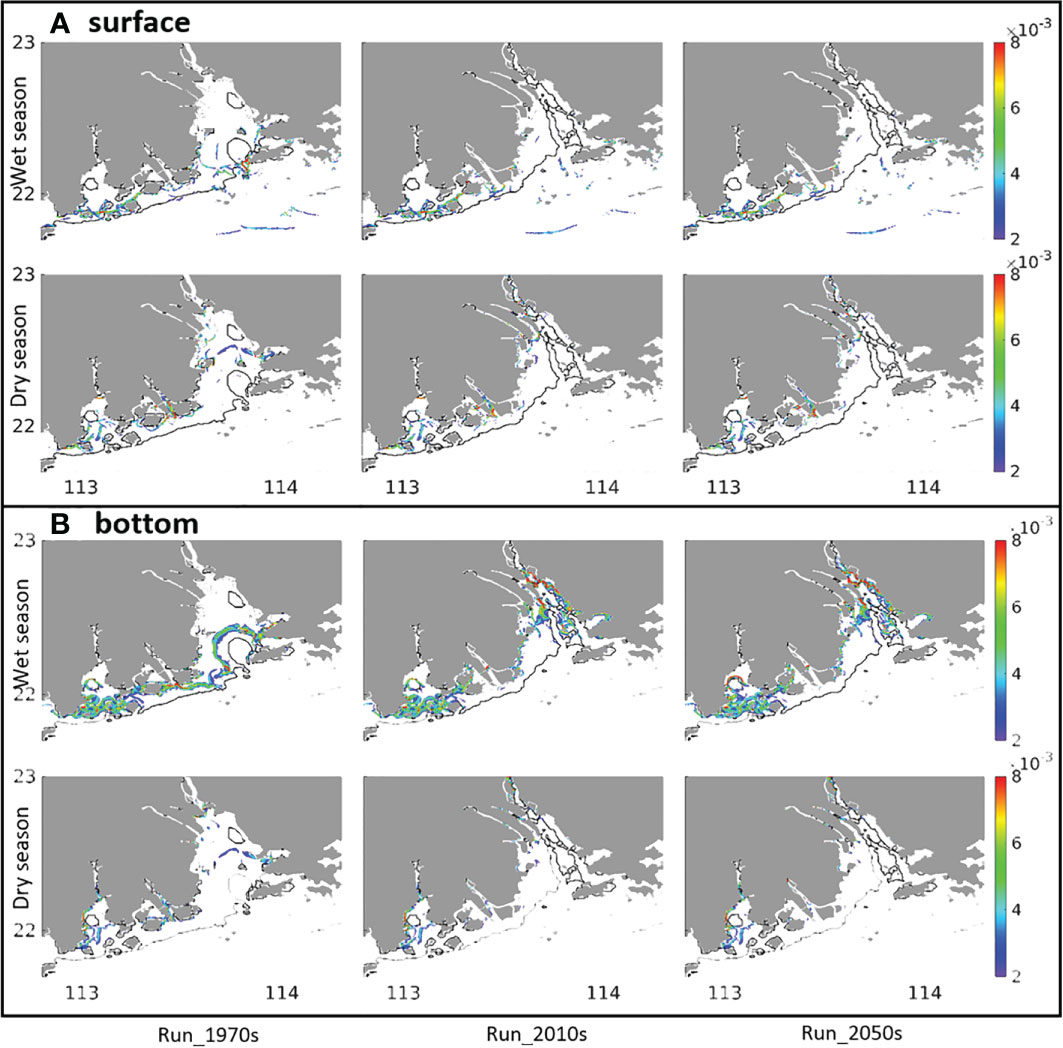
Figure 7 Location of estuarine fronts in the (A) surface and (B) bottom water (identified by salinity gradient greater than 0.0015 psu/m) in the PRE in the three scenarios. The black line indicates the 7-m isobaths. (Unit: psu/m). Supplementary Material provides a zoom in view of Lingding Bay (Supplementary Figure 1).
3.2.2 Variation caused by sea-level rise
Sea level rise is one of the main drivers of the variation in future scenarios. As seen in Figures 4, 5; Table 1, the enhancement of stratification due to sea-level rise (Run_2050s) is minor compared with that caused by morphological change, but it varies among the sub-regions. The strongest enhancement of stratification due to sea-level rise occurs in the west shoal (Zone 3) in both wet and dry seasons. In Zone 3, stratification is enhanced up to 2.5 times in the wet season while 1.5 times in the dry season by a sea-level rise of 20 cm (Run_2050s). In other sub-regions, stratification is enhanced by maximum of 1.25 times in the wet season and 1.15 times in the dry season by the sea level rise.
The study of Chua and Xu (2014) mentioned that sea-level rise results in a stronger baroclinic pressure gradient proportional to the water depth, indicating an increase in the strength of gravitational circulation, thereby resulting in higher vertical stratification. The enhancement of stratification is through a tidal straining of the density field (Cheng et al., 2011). In Equation (7), the straining term describes a transformation of horizontal salinity gradient to vertical salinity gradient. A positive value of the straining term means destruction of stratification (destratification), while a negative value refers to enhancement of stratification. The temporal variation of the straining term (Figure 8) shows amplified negative straining during spring tides, which means that stratification is enhanced during the spring tides, as the negative straining leads to increased salinity variance. The peaks of enhancement of stratification caused by sea level rise also appear during spring tides (Figure 8). This result means that the sea level rise would cause a transformation of horizontal salinity gradient to vertical salinity gradient, with most significant effect in spring tides caused by negative straining, thereby increasing the vertical stratification. Thus, the impact of sea level rise on stratification is different from the morphological change, as the morphological change mainly alters the advection process as described previously.
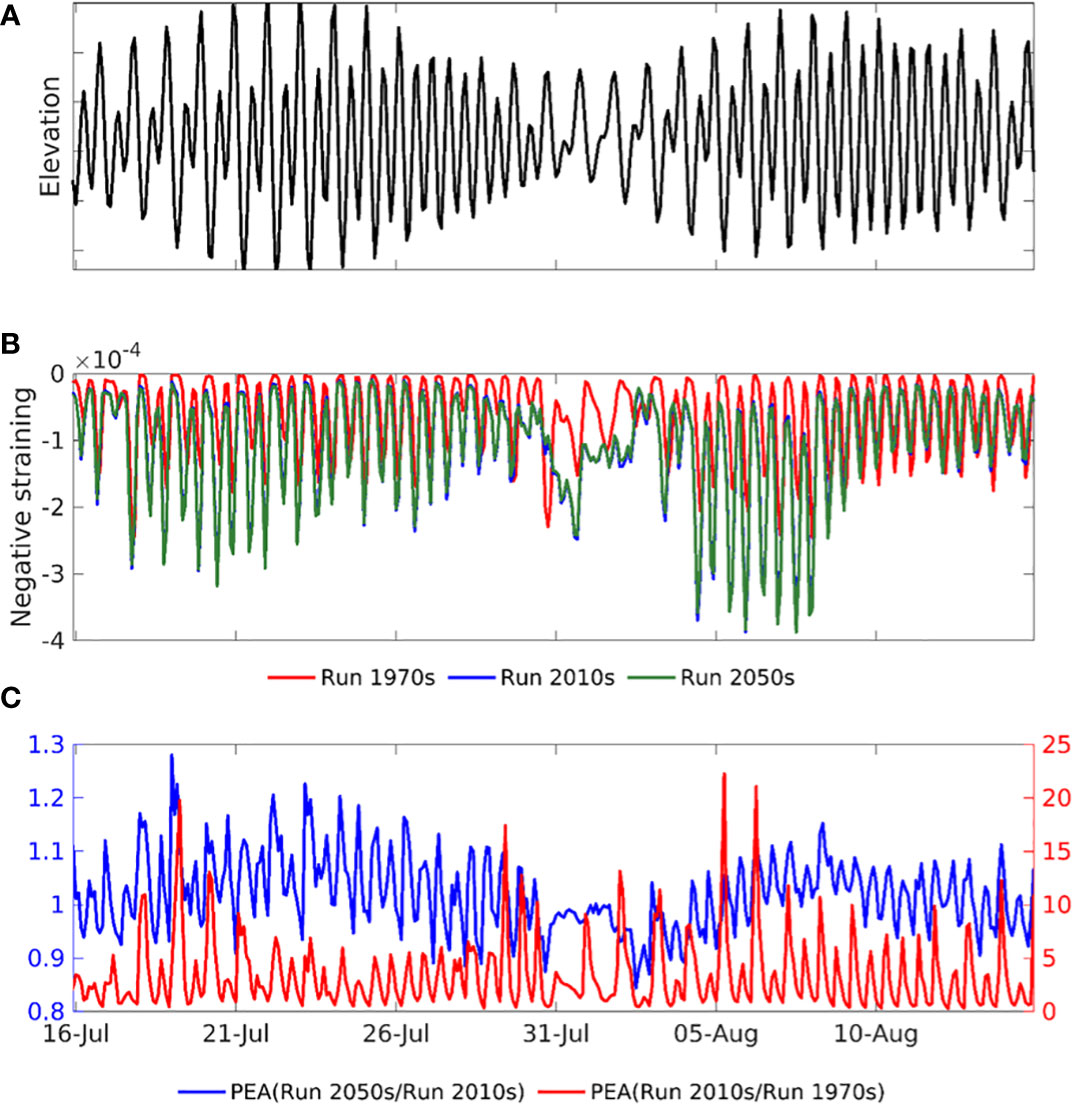
Figure 8 Time series of (A) water level, (B) straining and (C) magnification of negative straining due to morphologic change and sea-level rise.
3.2.3 Variation of stability in stratification
To further assess the impact of morphological change and sea level rise on stratification in the PRE, stability of stratification in the four selected sites (Figure 1D) is calculated based on the gradient Richardson number Ri. As already indicated by results from previous sections (3.2.1), stratification is most significant in the wet season. Therefore, the analysis of the stability of stratification is focused on the wet season.
Figure 9 shows one-month variation of the vertical distribution of the gradient Richardson number Ri at the four sites in the wet season. In the Run_1970s, stratification does not exist in the eastern channel (S1), where water depth is around 3 m. Stable stratification (log10(Ri)>1) frequently occurs in the western channel (depth > 7 m, S2) and the river plume-dominated area (depth is around 3.5 m, S4). By contrast, stable stratification in the shallow western shoal (Zone 3) mainly appears during neap tides and is absent for the rest of the time. In the Run_2010s, stability of stratification is enhanced at all four sites, with most significant change in the eastern channel (S1, Table 2), where the channel depth is increased by ~ 3 m. Similar to the strength of stratification represented by φ, stability of the stratification also presents fluctuations following the spring-neap tidal cycle. The strongest enhancement of Ri occurs during neap tides and their transition to spring tides, whilst is weakened or completely destroyed by strong mixing during spring tides.
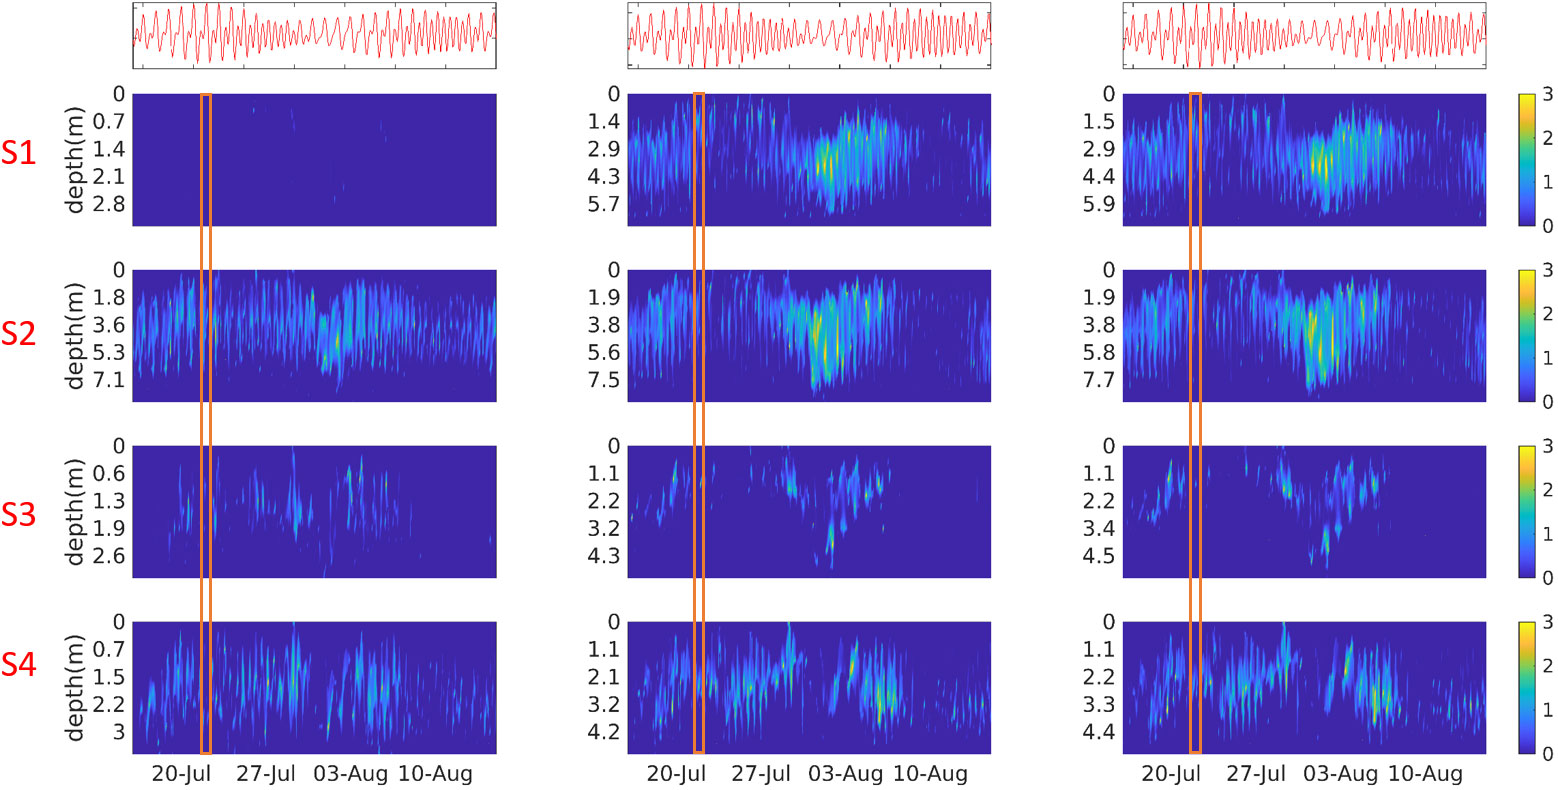
Figure 9 Time series of vertical profile of the gradient Richardson number Ri (plotted in log10(Ri)) in the wet season at the four selected sites in the Run_1970s (left column), Run_2010s (middle column) and Run_2050s (right column). Duration of the typhoon Roke is marked by the orange rectangle.
The stability of stratification at the two channels and the west shoal exhibits similar temporal variation in response to the spring-neap tidal cycle, meanwhile is characterized by a vertical variation in its maximum value (Figure 9). Maximum Ri migrates downward to the deeper part of the water column during a transition from spring to neap tides, and then starts to rebound towards surface during the transition from neap to spring tides. However, such pattern is not observed at S4 located in the river plume-dominated area (Zone 4). The reason is attributed to the spatial variation of the river plume and its front. During neap tides, the river plume and its front reach their maximum extent in Zone 4. The site S4 is mainly dominated by well mixed fresh water which greatly dampens stratification. During the transition from neap to spring tides, the river plume and its fronts retreat to the inner shore, and stratification at S4 becomes more stable.
It is worth to note that typhoons exert only short-term perturbations to the stability of stratification. As can be seen in Figure 5, it takes around two days for the stratification to restore to a tide-driven state after the typhoon passage. The stability of stratification exhibits similarly (Figures 9, 10). Further, our simulation results show that the instability of stratification is controlled by a joint impact of spring-neap tidal cycle and typhoons (Figure 10). Stratification is quite unstable and relatively weak during the typhoon period overlapping with the transition from spring tide to neap tides. However, stratification rapidly restores with a significantly enhanced stability after the typhoon passage and during the transition from neap tides to spring tides. In addition, morphological change results in a delay of the restoration by half a day as seen by a comparison between the Run_1970s and Run_2010s, whilst the impact of sea level rise is hardly seen.
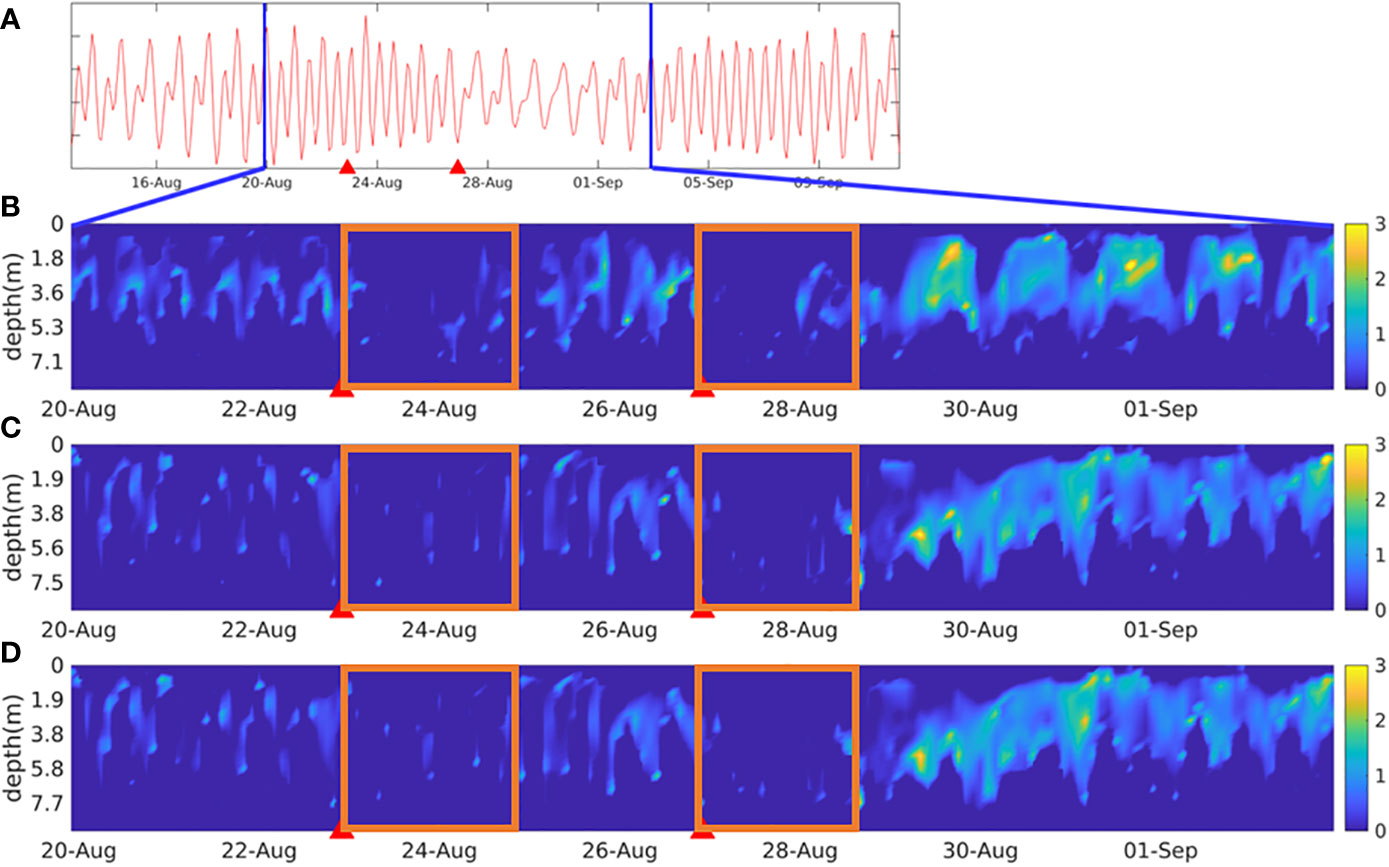
Figure 10 Time series of the (A) water elevation, and the gradient Richardson number Ri in the (B) Run_1970s, (B) Run_2010s, and (D) Run_2050s at site 2 (Zone 2). The arrival and duration of two typhoons (Hato and Pakhar) are marked by red triangles and orange rectangles, respectively.
Sea-level rise also increases the stability of stratification in the PRE, although the extent is much weaker than that caused by the morphological change (Figure 9; Table 2). The extent also varies among the sites, with maximum increase (by ~15%) at S1 (Zone 2) and S3 (Zone 3), and minimum increase at S4 (Zone 4).
4 Discussion
Geyer and MacCready (2014) provided a quantitative means of classification of estuaries in terms of stratification, which are based on two dimensionless parameters. The first parameter, i.e., the Freshwater Froude number Frf=U0/(βgS0H)1/2, represents the ratio of the mean river velocity (U0) to the gravitationally driven exchange flow that is scaled with the water depth H. Here, S0 is the background ocean salinity and β≅7.7×10⁻⁴ is the coefficient of saline contraction. The second is the mixing parameter , which measures the ratio between the tidal timescale and the timescale of vertical turbulent mixing. In, N0=(βgS0/H)1/2 is the buoyancy frequency for maximum top to bottom salinity variation in an estuary, where ω is the tidal frequency, Ut is the amplitude of the depth-averaged tidal velocity, Cd≅(1–2.5)×10-3 is the drag coefficient.
Estuaries can be classified into different stratification conditions based on the freshwater Froude number Frf and the mixing number M (Figure 11). The range of M is calculated from the variation of tidal current velocities and water depth in a spring-neap cycle, whereas the range of Frf is estimated by the variation of the monthly mean river runoff within a year. Many estuaries, including the Puget sound, the Chesapeake Bay, the Pearl River Estuary and the Yangtze River, are characterized by a broad range of M not only due to the variation of spring-neap tides but also owing to the signification variation of water depth (Geyer and MacCready, 2014; Chen, 2018). Data from these estuaries show that M decreases along with an increase in the average water depth, which is evidenced by a decrease of M for the Lingding Bay from the 1970s to the 2010s (Figure 11). Compared to the Yangtze Estuary which mainly falls into the type of salt wedge because of its large Frf, stratification in the PRE in 2010s is more variable and encompasses three types (salt wedge, strongly stratified and partially mixed) in the wet season, and two types (strongly stratified and partially mixed) in the dry season (Chen, 2018). However, Frf of the PRE seems to be underestimated in our simulation, since salt wedge intrusion in the area has been reported by several studies (Mao et al., 2004; Cui et al., 2019) both during the wet and dry seasons. The main reason for underestimation is likely caused by an exclusion of tributaries on the western coast of the bay in our model, therefore U0 is underestimated in our results.
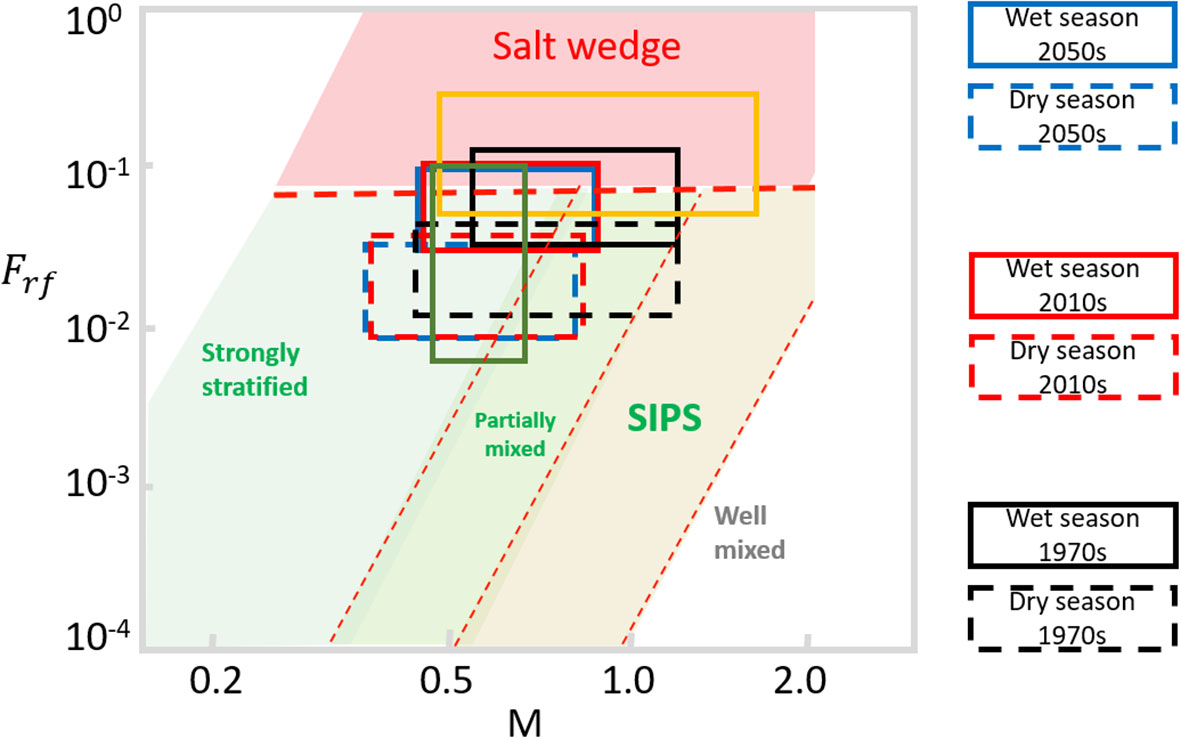
Figure 11 Estuarine parameter space with the freshwater Froude number (Frf) and mixing number (M). The red solid line calculated from , in which α=3.4, which divides the estuarine parameter space into estuaries that always remain stratified and those that experience boundary-generated mixing during a tidal cycle. The location of PRE in different ages and different seasons are indicated in the figure. The yellow rectangle is the location of North passage Yangtze River according to Chen (2018); the green rectangle represent the Hudson River according to Geyer and Maccready (2014). SIPS is Strain-Induced Periodic Stratification. Modified from Geyer and Maccready (2014).
The morphological change in the Lingding Bay between 1970s and 2010s not only causes a remarkable decrease of M but also a mild decrease of Frf. According to the simulation results in the Run_1970s, stratification in the PRE mainly encompasses three types (salt wedge, strongly stratified and partially mixed) in the wet season, whilst in the dry season salt wedge is replaced by strain-induced periodic stratification (SIPS) (Figure 11). In the Run_2010s, SIPS does not exist in the dry season anymore, and the whole system is shifted toward strongly stratified conditions. By contrast, a sea level rise of 20 cm (Run_2050s) only shows a minor impact on M and Frf when comparing with the Run_2010s scenario. The range of M shifts slightly to the left due to a sea level rise-induced decrease in mixing. The range of Frf remains unchanged, suggesting that a 20 cm-sea level rise alone would not affect river flows in the study area.
The PRE shows both similarity (e.g. decrease of M along with an increase of depth) and difference with other estuaries which have also experienced human-induced deepening. In the Hudson estuary, modification for navigation since the late 1800s has increased the channel depth by 10-30%, which results in a strong salinity intrusion but almost no change in the estuarine circulation according to the study by Ralston and Geyer (2019), which argued that the import of salt by estuarine circulation is balanced by the export of salt by the mean advection due to river discharge. Our results demonstrated that both the import of salt and the estuarine circulation are enhanced by the morphological change. The difference is likely to be attributed to that (a) the Lingding Bay experienced not only deepening but also reduction in water area by 8.1%, which have consequent impact on tidal velocity and amplitude (Shen et al., 2018), and (b) an exclusion of the effect of tidal mixing in the estimate by Ralston and Geyer (2019).
The relationship between depth change and salt fluxes is nonlinear in estuaries. Chant et al. (2018) found that a relatively small (15%) increase in depth by dredging in a short reach of an estuary may double the exchange salt flux and remarkably increase stratification in the estuary. Ralston and Geyer (2019) found that channel deepening by 10%-30% in the Hudson estuary increases salinity intrusion by 30% and enhanced stratification during neap tides. In the PRE, the channels (Zone 2) were deepened by 49% (4.85m) from 1970s to 2010s, and the salt fluxes are increased by 78%, resulting in an increase of stratification by max. 400% in the channel area. Meanwhile, the west shoal was deepened by 28% along with a significant reduction in its water area, leading to an increase of stratification by max. 700%. These results suggest a highly amplified and irreversible impact of human-induced morphological change on estuarine environments in terms of stratification. It is worth noting that although direct human interventions including sand mining and land reclamation have been banned, other human activities which may also affect morphological change of the estuary, such as channel dredging and river damming, will still continue in future (Liu et al., 2018). An exclusion of potential morphological change caused by reduced sediment input from rivers due to damming or by extreme events (e.g. floods, typhoons) in the future scenario Run_2050s would lead to uncertainties of our estimation. To what extent these natural and anthropogenic drivers would lead to morphological change and consequence on estuarine circulation and stratification in future remains to be explored.
Our simulations show a minor impact of sea level rise (by 20 cm from 2010s to 2050s) on the stratification and circulation in the PRE. However, climate change impacts not only the sea level but also other environmental variables such as temperature and precipitation which have not been taken into account in this study so far. Climate change also seems to cause more frequent occurrence of extreme events such as cyclones (storms) and marine heat waves. The former may strongly affect the stratification at a short-term (as shown in our results), while the latter could cause higher temperature in the surface water, thus enhancing a thermal induced stratification [e.g., the southern North Sea, Chen et al. (2022)]. However, in typical estuarine environments such as the PRE where stratification is caused mainly by salinity gradient, we hypothesized that a change in temperature gradient by marine heat waves and enhanced solar radiation would not significantly affect the stratification. To test the impact of sea surface temperature increase on the stratification of PRE, a scenario with an increase of surface water temperature (above the pycnocline) at the open boundary by 2°C and enhanced atmospheric radiation over the entire model domain in summer (July and August). These results confirms our hypothesis and shows that the change in surface water temperature has only minor impact on stratification of the PRE, characterized by a change of the PEA within 5% from the reference level (Supplementary Table 1; Supplementary Figure 2).
Future climate change might affect stratification in the PRE mainly through modified river runoff. Hong et al. (2020) found that the rate of increase in stratification in response to the sea-level rise is higher during the high-flow conditions than that during the low-flow conditions. This might be related to the stability of the stratification, which shows a weaker vertical stratification with lower stability during dry season, and opposite in the wet season. Since river runoff is the main driving factor for monthly-to-seasonal variation of stratification in the PRE, how future climate change would affect monsoon intensity and associated river runoff and consequent impact on estuarine stratification remains to be further explored.
5 Conclusion
A high-resolution 3-D hydrodynamic model was used to investigate the impact of mainly human-induced morphological change (from 1970s till 2010s) and climate-induced sea level rise (from 1970s till 2050s) on the stratification in the PRE. The following conclusions are drawn from the simulation results.
1. Morphological change in the Lingding Bay (the main estuary of the PRE) from 1970s to 2010s results in a bay-scale enhancement of stratification by up to four times, with maximum enhancement (up to seven times) at the western shoal of the bay;
2. Stratification in the PRE becomes more sensitive to tidal and river runoff impact after the morphological change. The variation is greatly amplified by the spring-neap tidal cycle. The maximum enhancement in stratification occurs in the transition period from neap to spring tides due to the increase of advection of salinity variance;
3. The relationship between depth change and salt fluxes is nonlinear and varies among different morphological units. In the PRE, the eastern channel and the western shoal experience the greatest enhancement in both strength and stability of stratification caused by the morphological change;
4. Compared to an overwhelming impact of human-induced morphological change in the past few decades, future change of stratification driven by sea level rise would be further strengthened but to a much less extent. The maximum enhancement associated with sea level rise occurs in spring tides due to the increased negative straining;
Our results suggest a highly amplified and irreversible impact of human-induced morphological change on estuarine environments in terms of stratification, which should be taken into account in future planning of estuaries. The results of our researches might have potential implications for the estuarine management, in particular, human intervention such as the planning of land reclamation or sand mining in Lingding Bay, etc. As the human intervention is the main driving factor of variations of the hydrodynamic environment in PRE. With the deepening of channels as well as the average depth of Lingding Bay, the stratification becomes more stable and extends in space. Cui et al. (2019) found that the spatial distribution of coastal hypoxia can be well predicted by the overlapping zone between river plume and salt wedge. Therefore, the distribution of stratification is highly relevant to the occurrence of hypoxia in the PRE. Our model is suitable for further scenario studies to assess the impact of climate change and human intervention on estuaries.
Data availability statement
The original contributions presented in the study are included in the article/Supplementary Material. Further inquiries can be directed to the corresponding authors.
Author contributions
MM, WZ and CS contributed to conception and design of the study. JD provided the morphological data. MM collected the database, developed the model set-up and model validation and performed all analysis. WZ supervised the analysis of simulation results. MM and WZ wrote the first draft of the manuscript. All authors contributed to manuscript revision. All authors contributed to the article and approved the submitted version.
Funding
This study is a contribution to the Helmholtz PoF programme “The Changing Earth – Sustaining our Future” on its Topic 4: Coastal zones at a time of global change. It also contributes to the theme “C3: Sustainable Adaption Scenarios for Coastal Systems” of the Cluster of Excellence EXC 2037 ‘CLICCS - Climate, Climatic Change, and Society’ – Project Number: 390683824 funded by the Deutsche Forschungsgemeinschaft (DFG, German Research Foundation) under Germany’s Excellence Strategy. JD was supported by the National Natural Science Foundation of China, China (NSFC, Grant No. 41806100; NSFC-FDCT, Grant No., 42161160305).
Acknowledgments
Many thanks to Peter Arlinghaus and Lucas Porz for their help in the early stage of model build-up.
Conflict of interest
The authors declare that the research was conducted in the absence of any commercial or financial relationships that could be construed as a potential conflict of interest.
Publisher’s note
All claims expressed in this article are solely those of the authors and do not necessarily represent those of their affiliated organizations, or those of the publisher, the editors and the reviewers. Any product that may be evaluated in this article, or claim that may be made by its manufacturer, is not guaranteed or endorsed by the publisher.
Supplementary material
The Supplementary Material for this article can be found online at: https://www.frontiersin.org/articles/10.3389/fmars.2023.1072080/full#supplementary-material
References
Chant R. J., Sommerfield C. K., Talke S. A. (2018). Impact of channel deepening on tidal and gravitational circulation in a highly engineered estuarine basin. Estuaries Coasts 41 (6), 1587–1600. doi: 10.1007/s12237-018-0379-6
Chegini F., Holtermann P., Kerimoglu O., Becker M., Kreus M., Klingbeil K., et al. (2020). Processes of stratification and destratification during an extreme river discharge event in the German bight ROFI. J. Geophys. Res.: Oceans 125 (8). doi: 10.1029/2019jc015987
Chen W. (2018). Dynamics of currents and sediment in estuaries with different density stratifications (Doctoral dissertation, Utrecht University). Available at: https://dspace.library.uu.nl/handle/1874/362308.
Cheng P., Valle-Levinson A., de Swart H. E. (2011). A numerical study of residual circulation induced by asymmetric tidal mixing in tidally dominated estuaries. J. Geophys. Res.: Oceans 116 (C1). doi: 10.1029/2010JC006137
Chen W., Staneva J., Grayek S., Schulz-Stellenfleth J., Greinert J. (2022). The role of heat wave events in the occurrence and persistence of thermal stratification in the southern north Sea. Natural Hazards Earth System Sci. 22 (5), 1683–1698. doi: 10.5194/nhess-22-1683-2022
Chua V. P., Xu M. (2014). Impacts of sea-level rise on estuarine circulation: An idealized estuary and San Francisco bay. J. Mar. Syst. 139, 58–67. doi: 10.1016/j.jmarsys.2014.05.012
Couldrey M. P., Gregory J. M., Dong X., Garuba O., Haak H., Hu A., et al (2022). Greenhouse-gas forced changes in the Atlantic meridional overturning circulation and related worldwide sea-level change. Climate Dyn. doi: 10.1007/s00382-022-06386-y
Cui Y., Wu J., Ren J., Xu J. (2019). Physical dynamics structures and oxygen budget of summer hypoxia in the pearl river estuary. Limnol. Oceanogr. 64 (1), 131–148. doi: 10.1002/lno.11025
Dai S., Yang S., Cai A. (2007). Variation of sediment discharge of the pearl river basin from 1955 to 2005. Acta GEOGRAPHICA SINICA-CHINESE EDITION- 62 (5), 554.
Deng J., Yao Q., Wu J. (2020). Estuarine morphology and depositional processes in front of lateral river-dominated outlets in a tide-dominated estuary: A case study of the lingding bay, south China Sea. J. Asian Earth Sci. 196. doi: 10.1016/j.jseaes.2020.104382
Geyer W. R., MacCready P. (2014). The estuarine circulation. Annu. Rev. fluid mechanics 46, 175–197. doi: 10.1146/annurev-fluid-010313-141302
Gong W., Shen J. (2011). The response of salt intrusion to changes in river discharge and tidal mixing during the dry season in the modaomen estuary, China. Continental Shelf Res. 31 (7-8), 769–788. doi: 10.1016/j.csr.2011.01.011
Han Z., Xie H., Li H., Li W., Wen X., Xie M. (2021). Morphological evolution of the lingding channel in the pearl river estuary over the last decades. J. Coast. Res. 37 (1), 104–112. doi: 10.2112/JCOASTRES-D-19-00187.1
Hong B., Liu Z., Shen J., Wu H., Gong W., Xu H., et al. (2020). Potential physical impacts of sea-level rise on the pearl river estuary, China. J. Mar. Syst. 201, 103245. doi: 10.1016/j.jmarsys.2019.103245
Hong B., Shen J. (2012). Responses of estuarine salinity and transport processes to potential future sea-level rise in the Chesapeake bay. Estuarine Coast. Shelf Sci. 104-105, 33–45. doi: 10.1016/j.ecss.2012.03.014
Kennish M. J. (2003). Estuarine research, monitoring, and resource protection. (Boca Raton, FI, USA: CRC Press). Available at: https://books.google.de/books?id=UdICWCidu9oC&redir_esc=y.
Li X., Geyer W. R., Zhu J., Wu H. (2018b). The transformation of salinity variance: A new approach to quantifying the influence of straining and mixing on estuarine stratification. J. Phys. Oceanogr. 48 (3), 607–623. doi: 10.1175/JPO-D-17-0189.1
Li L., He Z., Xia Y., Dou X. (2018a). Dynamics of sediment transport and stratification in changjiang river estuary, China. Estuarine Coast. Shelf Sci. 213, 1–17. doi: 10.1016/j.ecss.2018.08.002
Liu Z., Gan J. (2020). A modeling study of estuarine–shelf circulation using a composite tidal and subtidal open boundary condition. Ocean Model. 147. doi: 10.1016/j.ocemod.2019.101563
Liu F., Hu S., Guo X., Luo X., Cai H., Yang Q. (2018). Recent changes in the sediment regime of the pearl river (South china): Causes and implications for the pearl river delta. Hydrol Processes 32 (12), pp.1771–1785. doi: 10.1002/hyp.11513
Li R., Xu J., Li X., Shi Z., Harrison P. J. (2017). Spatiotemporal variability in phosphorus species in the pearl river estuary: influence of the river discharge. Sci. Rep. 7 (1), 1–13. doi: 10.1038/s41598-017-13924-w
Luo L., Li S., Wang D. (2009). Hypoxia in the pearl river estuary, the south China Sea, in July 1999. Aquat. Ecosystem Health Manage. 12 (4), 418–428. doi: 10.1080/14634980903352407
MacCready P., Geyer W. R., Burchard H. (2018). Estuarine exchange flow is related to mixing through the salinity variance budget. J. Phys. Oceanogr. 48 (6), 1375–1384. doi: 10.1175/JPO-D-17-0266.1
Mao Q., Shi P., Yin K., Gan J., Qi Y. (2004). Tides and tidal currents in the pearl river estuary. Continental Shelf Res. 24 (16), 1797–1808. doi: 10.1016/j.csr.2004.06.008
Masson-Delmotte V., Zhai P., Pirani A., Connors S. L., Péan C., Berger S., et al. (2021). Climate change 2021: the physical science basis. contribution of working group I to the sixth assessment report of the intergovernmental panel on climate change 2. (Cambridge, United Kingdom and New York, NY, USA: Cambridge University Press), 2391. doi: 10.1017/9781009157896
Pritchard H. B. (1995). Estuarine circulation patterns: American Society of Civil Engineers Proceedings.
Ralston D. K., Geyer W. R. (2019). Response to channel deepening of the salinity intrusion, estuarine circulation, and stratification in an urbanized estuary. J. Geophys. Res.: Oceans 124 (7), 4784–4802. doi: 10.1029/2019jc015006
Shen Y., Jia H., Li C., Tang J. (2018). Numerical simulation of saltwater intrusion and storm surge effects of reclamation in pearl river estuary, China. Appl. Ocean Res. 79, 101–112. doi: 10.1016/j.apor.2018.07.013
Simpson J. H., Bowers D. (1981). Models of stratification and frontal movement in shelf seas. Deep Sea Res. Part A. Oceanogr. Res. Papers 28 (7), 727–738. doi: 10.1016/0198-0149(81)90132-1
Tang Y., Xi S., Chen X., Lian Y. (2016). Quantification of multiple climate change and human activity impact factors on flood regimes in the pearl river delta of China. Adv. Meteorol. 2016. doi: 10.1155/2016/3928920
Valentim J. M., Vaz L., Vaz N., Silva H., Duarte B., Caçador I., et al. (2013). Sea Level rise impact in residual circulation in tagus estuary and ria de aveiro lagoon. J. Coast. Res. 65 (10065), 1981–1986. doi: 10.2112/SI65-335.1
Wang T., Geyer W. R., MacCready P. (2017). Total exchange flow, entrainment, and diffusive salt flux in estuaries. J. Phys. Oceanogr. 47 (5), 1205–1220. doi: 10.1175/JPO-D-16-0258.1 https://www.hko.gov.hk/hko/publica/reprint/r556.pdf
Wong L., Chen J., Dong L. (2004). A model of the plume front of the pearl river estuary, China and adjacent coastal waters in the winter dry season. Continental Shelf Res. 24 (16), 1779–1795. doi: 10.1016/j.csr.2004.06.007
Wong W., Li K., Yeung K. (2003). Long term sea level change in Hong Kong. Hong Kong Meteorol. Soc. Bull. 13 (1-2), 24–40. Available at: https://www.hko.gov.hk/hko/publica/reprint/r556.pdf
Wu Z. Y., Saito Y., Zhao D. N., Zhou J. Q., Cao Z. Y., Li S. J., et al. (2016). Impact of human activities on subaqueous topographic change in lingding bay of the pearl river estuary, China, during 1955-2013. Sci. Rep. 6, 37742. doi: 10.1038/srep37742
Xu H., Lin J., Wang D. (2008). Numerical study on salinity stratification in the pamlico river estuary. Estuarine Coast. Shelf Sci. 80 (1), 74–84. doi: 10.1016/j.ecss.2008.07.014
Yuan R., Zhu J., Wang B. (2015). Impact of sea-level rise on saltwater intrusion in the pearl river estuary. J. Coast. Res. 31 (2), 477–487. doi: 10.2112/JCOASTRES-D-13-00063.1
Yu L., Gan J., Dai M., Hui C. R., Lu Z., Li D. (2021). Modeling the role of riverine organic matter in hypoxia formation within the coastal transition zone off the pearl river estuary. Limnol. Oceanogr. 66 (2), 452–468. doi: 10.1002/lno.11616
Zhang Y., Ren J., Zhang W. (2020). Flocculation under the control of shear, concentration and stratification during tidal cycles. J. Hydrol. 586, 124908. doi: 10.1016/j.jhydrol.2020.124908
Zhang Y., Ren J., Zhang W., Wu J. (2021b). Importance of salinity-induced stratification on flocculation in tidal estuaries. J. Hydrol. 596, 126063. doi: 10.1016/j.jhydrol.2021.126063
Zhang Q., Sun X., Zhang K., Liao Z., Xu S. (2021a). Trade-offs and synergies of ecosystem services in the pearl river delta urban agglomeration. Sustainability 13 (16), 9155. doi: 10.3390/su13169155
Zhang Z., Wu H., Yin X., Qiao F. (2018). Dynamical response of changjiang river plume to a severe typhoon with the surface wave-induced mixing. J. Geophys. Res.: Oceans 123 (12), 9369–9388. doi: 10.1029/2018JC014266
Zhang W., Yan Y., Zheng J., Li L., Dong X., Cai H. (2009). Temporal and spatial variability of annual extreme water level in the pearl river delta region, China. Global Planetary Change 69 (1-2), 35–47. doi: 10.1016/j.gloplacha.2009.07.003
Zhang Y. J., Ye F., Stanev E. V., Grashorn S. (2016). Seamless cross-scale modeling with SCHISM. Ocean Model. 102, 64–81. doi: 10.1016/j.ocemod.2016.05.002
Keywords: stratification, salinity variation, morphological change, sea level rise, scenario
Citation: Ma M, Zhang W, Chen W, Deng J and Schrum C (2023) Impacts of morphological change and sea-level rise on stratification in the Pearl River Estuary. Front. Mar. Sci. 10:1072080. doi: 10.3389/fmars.2023.1072080
Received: 17 October 2022; Accepted: 20 January 2023;
Published: 01 February 2023.
Edited by:
Selvaraj Kandasamy, Xiamen University, ChinaReviewed by:
Peng Yao, Hohai University, ChinaHuawei Wang, Southern University of Science and Technology, China
Sandeep Kizhur, Central University of Kerala, India
Copyright © 2023 Ma, Zhang, Chen, Deng and Schrum. This is an open-access article distributed under the terms of the Creative Commons Attribution License (CC BY). The use, distribution or reproduction in other forums is permitted, provided the original author(s) and the copyright owner(s) are credited and that the original publication in this journal is cited, in accordance with accepted academic practice. No use, distribution or reproduction is permitted which does not comply with these terms.
*Correspondence: Mengyao Ma, bWVuZ3lhby5tYUBoZXJlb24uZGU=; Wenyan Zhang, d2VueWFuLnpoYW5nQGhlcmVvbi5kZQ==
 Mengyao Ma
 Wenyan Zhang
 Wei Chen
 Junjie Deng
 Corinna Schrum