 José Manuel Morales-Pulido1
 Adrian Munguia-Vega2,3*
 Sylvia Patricia A. Jiménez-Rosenberg4
 Axayacatl Rocha-Olivares5
 Clara E. Galindo-Sánchez1*
- 1Laboratorio de Genómica Funcional, Departamento de Biotecnología Marina, Centro de Investigación y de Educación Superior de Ensenada (CICESE), Ensenada, Mexico
- 2Conservation Genetics Laboratory & Desert Laboratory on Tumamoc Hill, University of Arizona, Tucson, AZ, United States
- 3Applied Genomics Lab, La Paz, Mexico
- 4Instituto Politécnico Nacional-Centro Interdisciplinario de Ciencias Marinas (CICIMAR), La Paz, Mexico
- 5Laboratorio de Ecología Molecular, Departamento de Oceanografía Biológica, Centro de Investigación y de Educación Superior de Ensenada (CICESE), Ensenada, Mexico
Larval genetic information influences populations’ genetic pools, causing genetic homogenization or structuration. So, knowing about adult and larval genetic information is essential to understand processes such as connectivity. The aims are to evaluate Twospot flounder (Bothus robinsi, a fish with a high dispersal potential) larval pools’ genetic diversity, test if the larvae tend to mix or display collective dispersal, compare genetic information between larvae and adults and evaluate its connectivity. We used ddRADSEQ to genotype 1,034 single nucleotide polymorphic sites from B. robinsi larvae sampled in waters from the Bay of Campeche and the eastern Gulf of Mexico (GOM) and adults sampled on Florida’s continental shelf. Larvae were identified morphologically and by DNA barcoding. We estimated Fst-paired comparations, Principal Components Analysis (PCA), Discriminant Analyses of Principal Components (DAPC), and a Structure analysis to understand genetic trends. With the software COLONY, we made a sibship evaluation. We observed no significant heterogeneity among regions (Fst p-values>0.05). PCA, DAPC, and the Structure Analysis showed one genetic cluster, indicating genetic homogeneity. We did not detect full-sibs or half-sibs. We linked the results with the high dispersal potential of B. robinsi due to a long pelagic larval duration and the potential of ocean dynamics to transport and mix larvae from all GOM shelf areas. These findings suggest that the dispersal potential of B. robinsi is large enough to produce genetic connectivity in all GOM subpopulations and that time spent by its larvae in dispersal pathways is enough to mix larvae from different GOM subpopulations, indicating a panmictic population.
1 Introduction
Demographic connectivity links local populations via the dispersal of individuals in their larval, juvenile, or adult phases (Cowen and Sponaugle, 2009; Kendrick et al., 2017). In marine fish, the spatial scale of larval dispersal is generally orders of magnitude larger than in the juvenile or adult phases. Thus the transport of larvae via ocean currents is the main driver of the biological connectivity of many marine fishes (Green et al., 2015). Most studies of genetic connectivity in fish focus on sampling adult individuals, typically representing multiple cohorts and generations of larval and adult dispersal and after the effects of survival during settlement and growth, integrating all these processes into a snapshot of genetic structure and connectivity (Hedgecock et al., 2007; Gagnaire, 2020). Population genetic studies of larvae in transit are relatively rare. Still, they can shed light on an important yet complex stage in the life history of marine fish that eventually influences the population’s genetic process (Ottmann et al., 2016; Shima and Swearer, 2016; Riquet et al., 2017). Three distinct, non-mutually exclusive processes are in play to define the role of a site within a fish metapopulation, including the export of individuals towards other sites, the import of individuals from other regions, and the amount of self-recruitment (individuals that remain at their natal site at the end of their larval stage). The balance of these processes defines a site as a net source (export of individuals exceeds imports) or net sink (import of individuals exceeds exports), while the levels of exchange of individuals with other sites define if a population is considered open (high exchange) or closed (little or zero exchange) (Cowen and Sponaugle, 2009).
The availability of genetic information from larval pools is logistically challenging. The composition and fate of the larval pool itself depend on different physical and biological factors in the environment (Pineda et al., 2007; Otwoma et al., 2018). The environmental unpredictability is thought to cause a large proportion of larvae to die or eventually fail to settle and survive, with only a small subset of larvae surviving and eventually reproducing as adults (Shima and Swearer, 2016). This phenomenon is dubbed sweepstakes reproductive success and effectively reduces the effective population size and enhances genetic drift and the differences in allele frequencies among subpopulations (Ottmann et al., 2016). However, some studies have contradicted the sweepstakes hypothesis by showing genetic homogeneity among multiple larval events (Domingues et al., 2011).
The mixing process in the dispersal stage is essential for larval pools to maintain high genetic diversity (Yearsley et al., 2013). However, it has been reported that in some species, larvae can avoid the mixing process and display a collective dispersal. This implies that the movement of larvae is not entirely independent of one another (Yearsley et al., 2013). In the scenario of collective dispersal, larvae of the same spawning event tend to travel together, either driven by larval behavior or physical oceanographic processes. Collective dispersal allows relatives to stick together during the dispersal phase, increasing measures of endogamy in larval pools (Riquet et al., 2017).
The Twospot flounder (Bothus robinsi) is a small fish (max. length 30-40 cm) that inhabits the continental and insular shelf between depths of 0-100 m. In the Gulf of Mexico (GOM), B. robinsi is found from Florida to the Quintana Roo continental shelf (Munroe, 2003; Evseenko, 2008; McEachran, 2009; Blanqueto-Manzanero and Vega-Cendejas, 2018)1.
Due to its small size, this flounder does not have a targeted commercial fishery. However, it has ecological significance because it contributes to the nutrient flux, acting as predator and prey (in all their developmental stages). They feed on small fishes, crustaceans such as crabs, shrimps, amphipods, polychaetes, among others organism. Bothus robinsi eggs and larvae are consumed by jellyfish, ctenophores, worms, shrimps, and fish during their time in the plankton. Young flounders are preyed by crabs, shrimps, and many predatory fishes (cod, sculpin, and moray eels, among other fishes) (Wakida-Kusunoki et al., 2013)2,3. Furthermore, B. robinsi larvae have the potential to be a connectivity bioindicator because of their high abundance and distribution in neritic and oceanic waters and their occurrence in all seasons (Houde et al., 1979; Sanvicente-Añorve et al., 2000; Flores-Coto et al., 2009).
Its principal dispersal strategy depends on the presence of pelagic eggs and larvae. Bothus robinsi has a high dispersal potential due to its capability of spawning throughout the year and its long pelagic larval duration (PLD) (Houde et al., 1979; Evseenko, 2008). Like other flounders, species from the Bothus genus can extend their larval developmental stage. A study of B. podas indicates that its larvae could settle after three months, depending on the environmental characteristics (Morato et al., 2007). For B. robinsi, there is a record suggesting the possibility for PLD as long as 5-12 months (Evseenko, 2008). Flatfishes from the Order Pleuronectiformes are characterized by long PLD, for example, 70 days for the Bay whiff (Citharichthys spilopterus; Gunther, 1862) (Joyeux et al., 1995), and 4-7 months for the Atlantic halibut (Hippoglossus hippoglossus; Linnaeus, 1758) (Sadorus et al., 2021).
Bothus robinsi dispersal potential does not end after finishing their larval stage. Their juvenile stage can live sometime in the pelagic environment until settlement because they use the reserve of nutrients in their massive liver to avoid starvation. In addition, they keep a transparent and slightly visible coloration that allows them to blend in the pelagic environment and avoid predators, increasing their probability of survival and settling (Evseenko, 2008). Bothus robinsi dispersal capabilities translate into a high potential for population connectivity in the GOM.
The GOM is a semi-closed sea with a 1.6 million km2 area. This gulf is a dynamic system due to the presence of heterogeneous currents that fragment the pelagic environment into provinces characterized by some degree of isolation (Figure 1) (Miron et al., 2017). The provinces were determined using lagrangian analysis based on the dynamical system that is governed by the motion of fluid particles, which are described by satellite-tracked drifters on the ocean surface (Miron et al., 2017). Starting the analysis, the tracers spend more time moving and eventually temporarily accumulating in regions within them than dispersing across their boundaries (Figure 1). These retention effects, which constrain connectivity between distant places in the GOM and keep planktonic organisms inside the provinces, are the result of oceanic dynamic systems such as cyclonic and anticyclonic eddies, and circulation (Figures 1, 2) (Díaz-Flores et al., 2017; Miron et al., 2017).
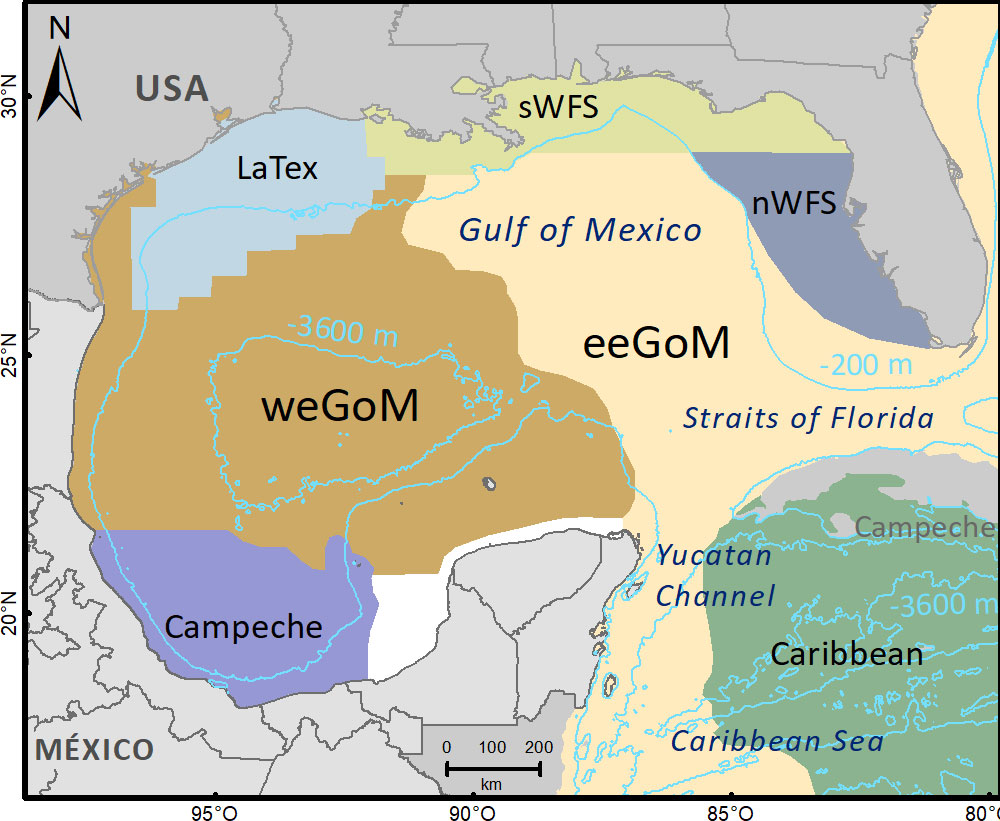
Figure 1 Scheme of oceanographic provinces in the Gulf of Mexico based on Miron et al. (2017).
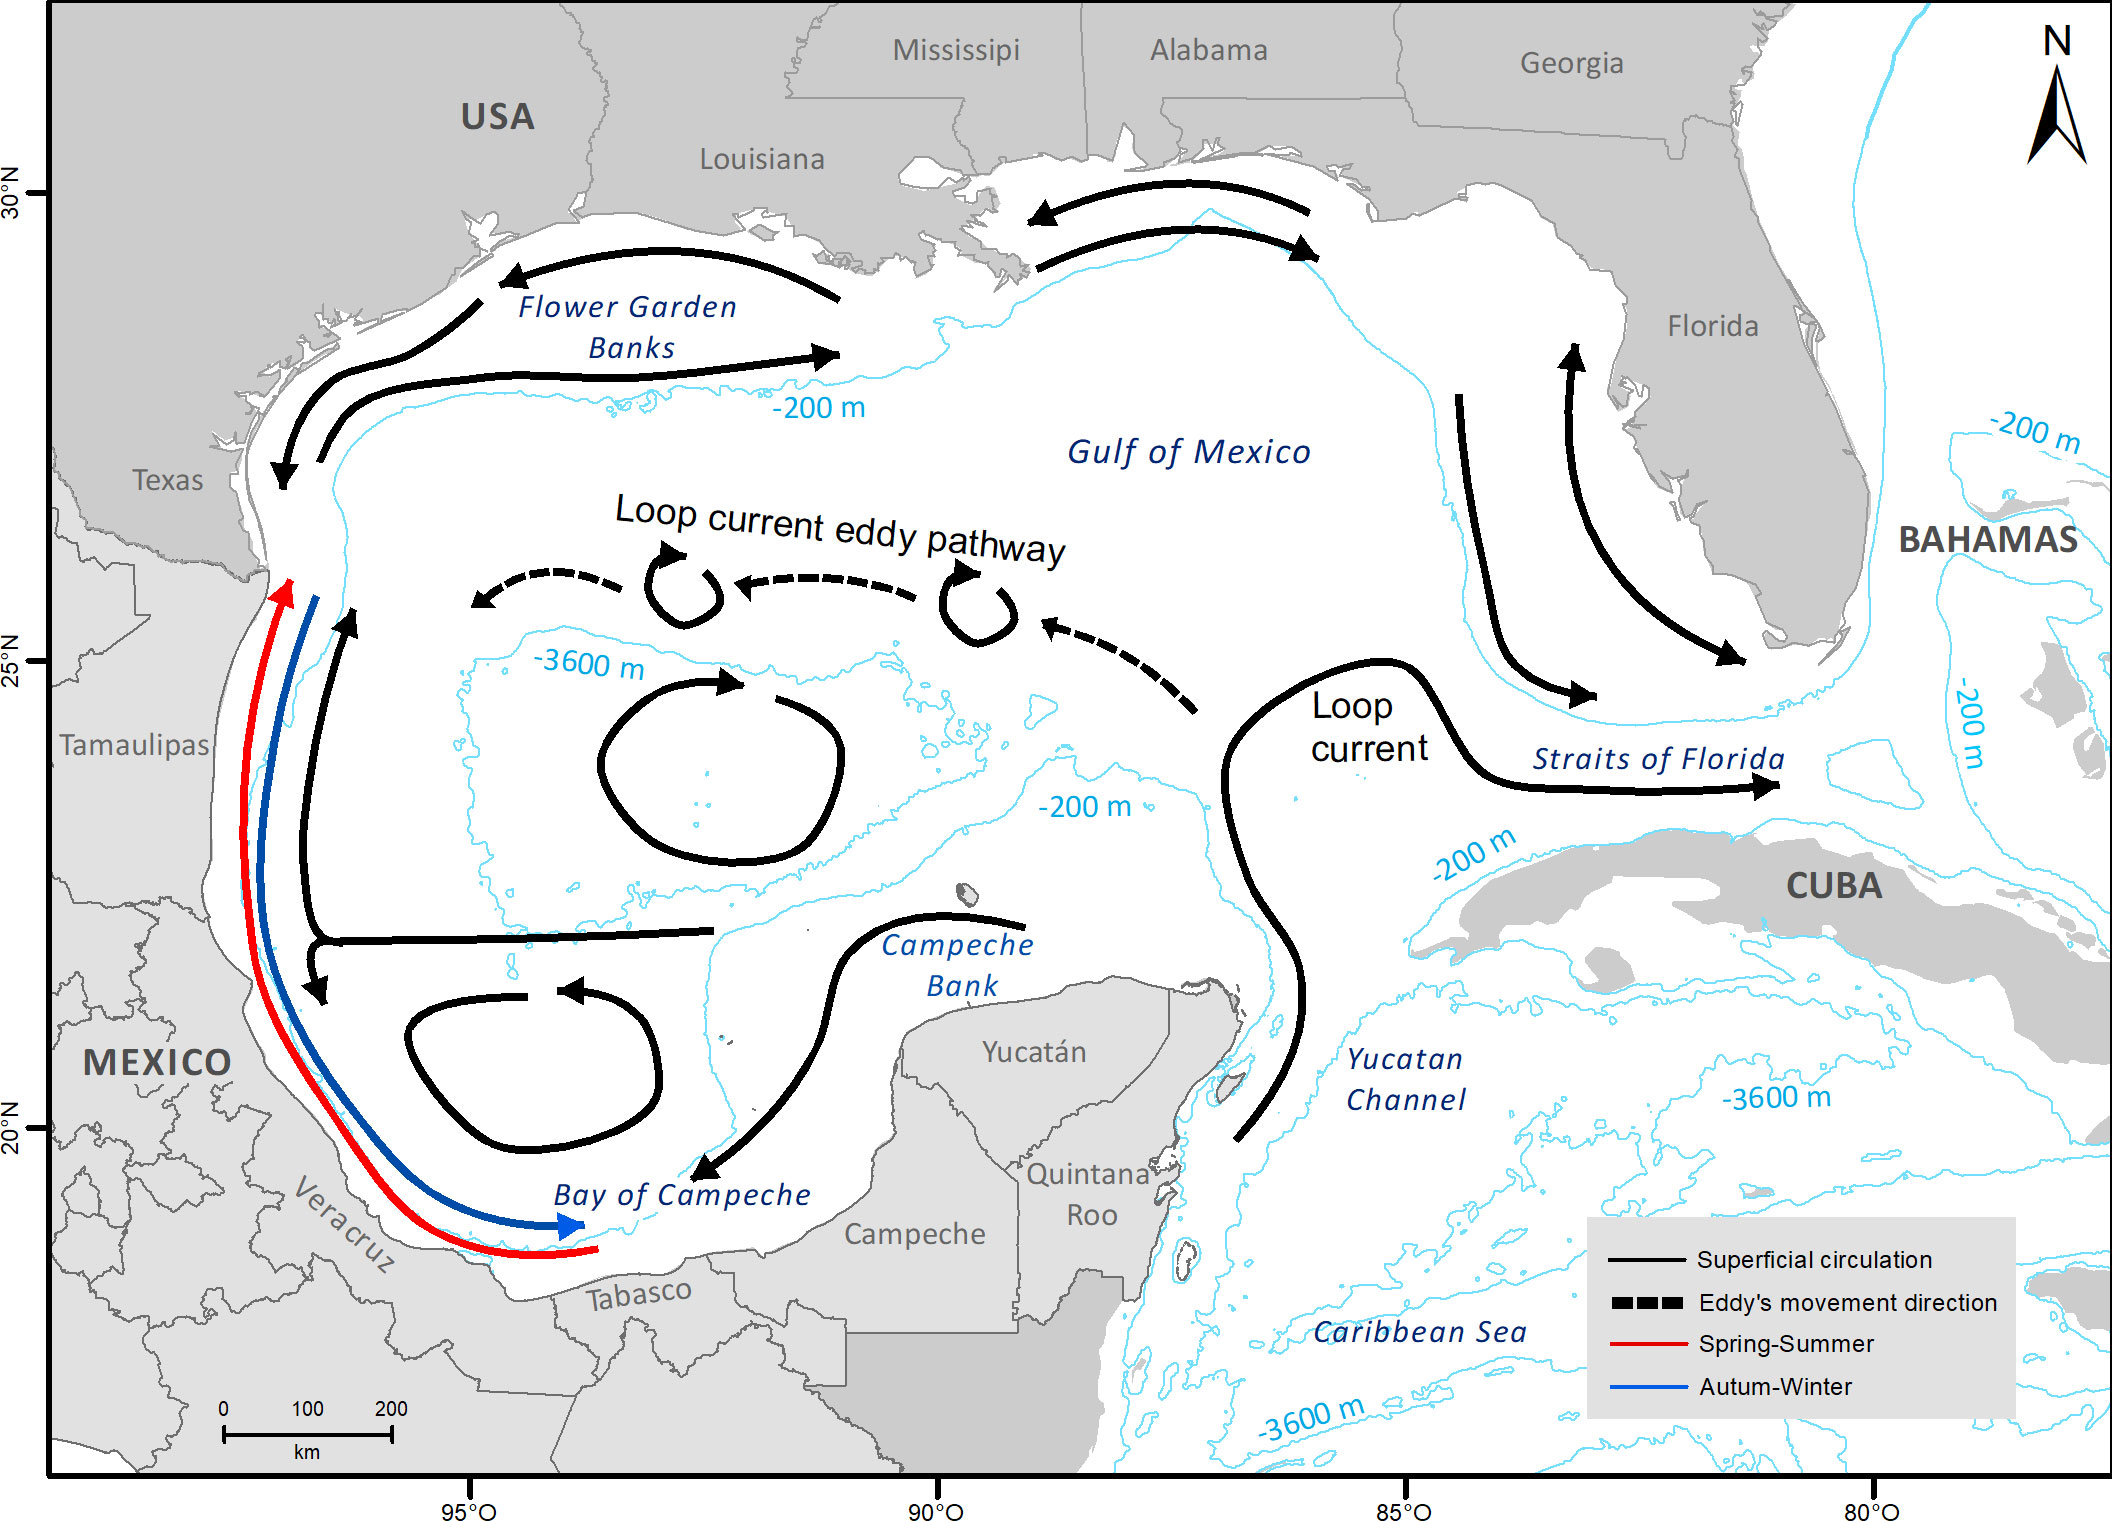
Figure 2 Map of the Gulf of Mexico showing the surface circulation (0-200 m) in spring, summer, autumn, and winter seasons, based on; Zavala-Hidalgo et al. (2003); Hamilton et al. (2018); Lara-Hernández et al. (2019); Turner and Rabalais (2019); Romero-Centeno et al. (2021).
The principal oceanographic feature in the GOM is the Loop Current and its related eddies. This current enters into the GOM through the Yucatan Channel, turns anticyclonically to the east, and leaves the GOM through the Straits of Florida (Figure 2) (Díaz-Flores et al., 2017; Lara-Hernández et al., 2019). Anticyclonic eddies can shred any month of the year from the main Loop Current as a result of multiple seasonal and stochastic processes. These eddies drift toward the west or northwest (Figure 2) until their arrival on the continental shelf between the north of Veracruz and the south of Texas, after 2-4 months, and dissipate (Muller-Karger et al., 2015; Díaz-Flores et al., 2017; Romero-Centeno et al., 2021). These large anticyclonic eddies (200-300 km) interact with the continental shelf, enhancing coastal upwelling throughout the region. The interaction of cyclonic and anticyclonic eddies allows the transport of water and particles among different provinces (Muller-Karger et al., 2015; Lara-Hernández et al., 2019; Romero-Centeno et al., 2021).
Although there is an overall anticyclonic circulation in the GOM, there are zones with cyclonic circulation, including the continental shelf between Texas and Louisiana, the shelf off western Florida and the cyclonic eddy in the Bay of Campeche (Figure 2). Over the western continental platform (i.e.,Tamaulipas and Veracruz), seasonal winds drive the direction of the currents northward during May-August and southward or south-eastward during September-March (Figure 2) (Lara-Hernández et al., 2019; Romero-Centeno et al., 2021).
Several studies in the GOM have modeled Langranian trajectories of particles (virtual larvae of propagules) driven by ocean currents using the Hybrid Coordinate Ocean Model (HYCOM) (Johnson et al., 2013; Sanvicente-Añorve et al., 2014; Lara-Hernández et al., 2019). Typically, passive particles are tracked during a period based on the species’ PLD to estimate the number of particles that settle in distinct regions and the patterns of potential connectivity (Johnson et al., 2013; Sanvicente-Añorve et al., 2014; Lara-Hernández et al., 2019). According, to simulations of larval transport (Johnson et al., 2013; Salas-Monreal et al., 2018; Lara-Hernández et al., 2019), the PLD influences the probability of larvae escaping their natal oceanographic province. The Campeche province is inside the Bay of Campeche, a southern bight surrounded on three sides by the Mexican states of Campeche, Tabasco, and Veracruz. This province has a tendency to retain plankton as a result of the seasonal neritic dynamics, the cyclonic eddy, and the influence of an anticyclonic eddy located to the north over deep waters (Figure 2) (Sanvicente-Añorve et al., 2014; Villegas-Sánchez et al., 2014; Díaz-Flores et al., 2017; Lara-Hernández et al., 2019).
Studies modeling larval transport in the GOM suggest that fish with short PLD (16 days) have a high degree of connectivity among nearby subpopulations separated by ~56 km inside the Bay of Campeche. However, subpopulations located in the shelf of Veracruz and Campeche that are separated by ~460 Km exhibit lower connectivity (Sanvicente-Añorve et al., 2014; Lara-Hernández et al., 2019). Species with longer PLD (31 days) display potential connectivity between subpopulations from distinct provinces, including Campeche and Southwest Florida Shelf (SWFS), separated by 1280 Km (Johnson et al., 2013; Lara-Hernández et al., 2019). Organisms with a PLD 4-7 months like the lobster (Panulirus argus) show connectivity between distant subpopulations from different provinces separated by 1,680 km (Northern Veracruz and Southern Florida) (Lara-Hernández et al., 2019).
In this study, we contrasted allele frequencies between larval pools from multiple locations around the GOM and adult fishes of B. robinsi from the northern GOM. We also evaluated the genetic diversity in the larval pool of B. robinsi and tested if the larvae tended to mix or if they displayed evidence of collective dispersal. Finally, we evaluated the genetic connectivity using B. robinsi larvae and adults across the GOM.
2 Material and methods
2.1 Sampling of fish larvae and adult tissues
Fish larvae (126) were obtained from zooplankton samples collected during two oceanographic surveys: XIXIMI-04 and GOMECC-3. The XIXIMI-04 survey was conducted in the oceanic-waters from the GOM in the summer of 2015 (Supplementary Figure 1), while GOMECC-3 covered the central region, continental shelf, and the Atlantic coast of Florida during the summer of 2017 (Supplementary Figure 2).
Sampling was carried out using double oblique hauls (200 m to surface) with bongo nets fitted with 335 μm Nitex mesh nets and General Oceanic flowmeters (Smith and Richardson, 1977). Zooplankton samples from one net were preserved in ice-cold 96% ethanol changed after 48 h, and samples were stored at four °C until analyzed. Fish larvae were sorted out from the zooplankton samples for morphological taxonomic identification.
Sixteen adult tissues (muscle and fin rays), fixed in 96% ethanol and molecularly identified using COI sequences, were donated by Florida Fish and Wildlife Research Institute and by the Guy Harvery Research Institute. All tissues were from adults sampled off the western Florida coast in different years: 2008, 2012, 2013, 2014, and 2017 (Supplementary Figure 3).
2.2 Molecular identification of fish larvae
To corroborate the taxonomic identification of larvae initially identified as Bothus based on morphological characteristics, the genomic DNA was extracted from eye or muscle tissue with the Dneasy Blood and Tissue Kit (Qiagen, Hilden, DE). DNA quality, purity, and quantity were determined using 2% agarose gel and Nanodrop 2000 (Thermo Fisher Scientific, Inc., USA). The cytochrome oxidase subunit I (COI) region (~650 bp) of the mtDNA was amplified using primers: FishF1: 5’-TCA ACC AAC CAC AAA GAC ATT GGC AC-3’, FishF2: 5’-TCG ACT AAT CAT AAA GAT ATC GGC AC-3’ (Ward et al., 2005). The amplification reaction was carried out in 20 μl with 0.025 units of GoTaq polymerase (Promega, USA), 1X enzyme buffer (5X Green GoTaq Flexi Buffer, Promega, USA), 1.5 μM MgCl2 (Promega, USA), 0.2 Mm dNTP’s (Promega, USA), 0.2 μM for each primer, and 5.9-40.7 ng of DNA. DNA amplifications were performed in a polymerase chain reaction (PCR) thermal cycler C1000 Touch (Bio-Rad Laboratories, USA) with the following parameters: 2 min at 95°C, 35 cycles of 30 sec at 94°C, 30 sec at 54°C, 1 min at 72°C, and a final extension of 10 min at 72°C. The PCR products were sequenced in both directions on a Sanger sequencer ABI Prism 3130xl Genetic Analyzer (SEQXCEL INC., San Diego, CA, USA).
The quality of COI sequences was examined using the Geneious software package Version 4.8.4 (Kearse et al., 2012). All nucleotide sequences were aligned using the ClustalW algorithm, and the sequences were trimmed by eliminating primer sequences and mismatches edited in MEGA X.10.8 (Kumar et al., 2018). Cleaned sequences were queried against the GenBank database from the National Center for Biotechnology Information (NCBI4) and Barcode of Life Data (BOLD) System (Ratnasingham and Hebert, 2007) using the Basic Local Alignment Search Tool (BLAST) (Altschul et al., 1990).
2.3 Genomic library for SNP discovery and genotyping
Genomic DNA was extracted using the Dneasy Blood and Tissue Kit from adult tissue (fins or muscle) and complete larvae that were molecularly identified as B. robinsi, DNA concentrations were quantified using an Invitrogen Qubit High Sensitivity assay (ThermoFisher SCIENTIFIC, USA), and DNA quality was evaluated via agarose gel electrophoresis. To construct the genetic library, samples between 100 ng and 800 ng were selected. DNA samples were purified using 1.6X AMPure XP magnetic beads (Beckman Coulter, USA) to eliminate low molecular weight molecules corresponding to degraded DNA and were homogenized to a volume of 80 µl. A reduced representation ddRADSEQ library was constructed based on Peterson et al. (2012). Digestion was done with 43-245 ng and using the EcoRI (5’ GAATTC) and Mspl (5’ CCGG) restriction enzymes. A barcode adapter was ligated to EcoRI restriction sites, while a common adapter was ligated to Mspl restriction sites, using equimolar quantities of each digested sample. Samples were pooled by index sequence: two pools of 48 samples and two pools of 13 samples. Each pool was size-selected based on a double purification protocol using AMPure beads. In selecting DNA fragments larger than 300 bp, we made a purification with a concentration of 0.8X beads, following the AMPure instructions and steps (Binding, Separation, Ethanol Wash, Elution Buffer, Transfer). The second purification was done with a concentration of 0.64 X beads to select DNA fragments smaller than 400 bp, followed by a third purification step with a concentration of 1.6X beads. The final library ranged in size between 300-400 bp.
Illumina flow-cell adapter sequences and index-specific sequences were added to each index pool via PCR with the following parameters: 2 min at 94°C, 18 cycles for 30 sec at 94°C, 30 sec at 60°C, 20 sec at 60°C. The four index pools were combined into one library sequenced as a paired-end (150 bp) run on one Illumina HiSeq X DNA Lane (Novogene Corporation Inc., Sacramento, CA, USA).
2.4 De novo analysis: In silico identification of loci and genotyping
Paired-end raw reads were analyzed and filtered using the software Stacks (Catchen et al., 2013). Quality filtering and demultiplexing were performed with the “process_radtags” function with a “Phred score” of 30 and trimming the last ten bases of the end of the read. Putative orthologous tags (stacks) per individual were assembled with “ustacks” scripts. Different combinations of parameters were explored and the combination with a higher number of stacks was selected: minimum depth of coverage required to create a stack (m) of five and a maximum nucleotide mismatch (M) allowed between stacks of four. RAD loci catalogs were constructed in “cstacks” with a parameter of mismatches allowed between sample tags (n) of six. Rad loci and SNPs were selected with the “population” scripts using the parameters: SNPs found in at least 90% (-r), SNPs with a minimum allele frequency (min_maf) larger than 0.05, and number of populations (-p) of one (all the individuals were considered as one population). Finally, filtered RAD loci and SNPs information was exported as a vcf file.
The population vcf file was loaded in the VCFtools software to do a quality filter based on the pipeline obtained from dDocent5. The parameters in the quality filtering steps were: –max-missing: Excluded loci based on the proportion of missing data, defined between 0 and 0.5, where 0 allows sites that are completely missing and 1 indicates no missing data allowed; –mac: Excluded loci with a minor allele count lower than 3 (mac); –min DP: Included loci with a mean depth value ≥ 40 (overall included individuals); maf: excluded loci with alleles with a minimum allele frequency < 0.056.
Deviations from Hardy-Weinberg equilibrium (HWE) were evaluated with the package “pegas” using the function “hw-test” in R7, and the significance values were adjusted with the False Discovery Rate (FDR). Linkage equilibrium was evaluated with Tassel 5.0.
2.4.1 Outlier loci
Loci potentially influenced by selection were identified and filtered out to build a dataset of neutral loci that was used to infer population structure and connectivity. Two tests were applied to minimize the number of false positive loci assumed to be under selection. An FST approach was done using Arlequin 3.5.2.2 (Excoffier and Lischer, 2010) and a Bayesian method performed by Bayescan v2.1 (Foll and Gaggiotti, 2008). The Bayesian method was run with default settings (5,000 iterations, 10 thinning intervals, 20 pilot runs – 5,000 iterations each, 10 prior odds).
2.5 Population genetic analyses
The B. robinsi individuals retained after the bioinformatic quality filters were grouped into three regions for analysis of genetic diversity and structure (central, southern, and northern), based on the GOM province delimitation (Figure 1) following Miron et al. (2017).
2.5.1 Statistical power of the basin-specific datasets
To estimate the statistical power of the final loci to detect true levels of genetic differentiation, we used the simulation method implemented in POWSIM 4.1.; executable Powsim_b (Ryman and Palm, 2006). Simulations of 1034 loci from 66 B. robinsi individuals were run using default parameter values for dememorizations = 1000, batches = 100, and iterations per batch = 1000 for a scenario involving three subpopulations, using an effective population size (Ne) of 2000 and a generation drift of t=4, t=10, and t=20. Using a Chi2 test (1000 replicates), we determined if the loci dataset give enough information to detect minimal Fst values: Fst = 0.001, Fst = 0.0025, and Fst = 0.005.
2.5.2 Genetic diversity and genetic structure
General descriptors of genetic diversity for each region, including the mean number of alleles, observed heterozygosity (Ho), expected heterozygosity (He), and fixation index Fis were calculated using GenAlEx 6.5 (Peakall and Smouse, 2012). Pairwise Fst distances based on allele frequencies between regions were calculated with Arlequin 3.5.2.2.
To estimate the number of distinct genetic clusters we performed a principal component analysis (PCA), a discriminant analysis of principal components (DAPC), and a Bayesian clustering analysis. The principal component analysis (PCA) was performed using the “adegenet” package from the R software, the missing genotypes were imputed according to the mean allele frequencies using the function “scaleGen”, package from the R software. Discriminant analyses of principal components (DAPC) were performed utilizing the “adegenet” package in R. We used a k-value= three (number of regions to which the samples were assigned).
The software Structure V2.01 (Pritchard et al., 2000) was used to conduct a Bayesian clustering analysis to estimate the number of genetic clusters (K). The run was performed with K from 1 to 11 with five independent replicates (to evaluate if there were a possibility of the existence of several clusters between 2 to 10), 200,000 Markov chain Monte Carlo (MCMC) per replicate, and 100,000 MCMC burn-in period. The analysis was run with the admixture model and the option “LOCPRIOR”. Independent runs for each K value were averaged using the Clumpak server (Kopelman et al., 2015). The ad hoc statistic ΔK determined the most likely K value in the software structure harvester 0.6.948.
2.5.3 Full sibling`s determination
From the 66 samples from B. robinsi (larvae and adults), the presence of full siblings was screened through replicate sibship analyses with multilocus genotypes (1034 SNPs) excluding individuals with missing data. Analyses were run with the software COLONY (Jones and Wang, 2010), using the parameters: mating system-1 polygamy for males and females; mating system-2 without endogamy, dioic and diploid species, number of offspring in the sample=66, number of runs=5, length of run= Long, allele frequency= unknow.
3 Results
A total of 105 larvae were molecularly identified as B. robinsi (Table 1 and Supplementary Table 2) and 21 larvae were molecularly identified as B. ocellatus. Overall, most identified samples were at the preflexion stage (41%), followed by larvae at the flexion (31%) and postflexion stages (28%, Table 1). Most B. robinsi larvae (99) were identified at 16 out of 52 surveyed stations from the XIXIMI-04 research cruise on oceanic water, while only 6 larvae were found at 3 out of 26 surveyed stations from the GOMECC cruise near the continental shelf (Supplementary Table 1).
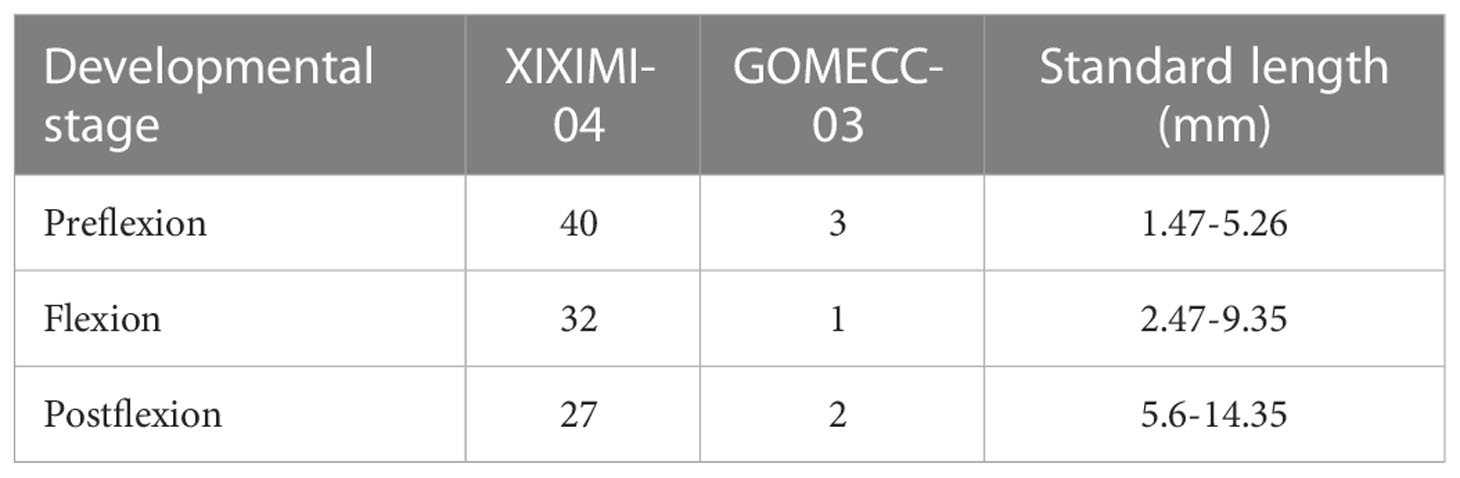
Table 1 Number of Bothus robinsi larvae sampled in two oceanographic cruises classified by developmental stages and standard length.
From the 121 samples from B. robinsi (105 larvae in different developmental stages and 16 adult tissues), 76 individuals and 11,912 loci passed the Stacks filters. After the VCFtools filters 1,140 loci and 66 individuals passed the filters. All of the scored loci were neutral (no outliers), while 97 significantly deviated from HWE and were eliminated, nine loci pairs showed significant linkage disequilibrium, and one locus of each pair was discarded. A total of 1,034 loci from 66 individuals passed ddRAD filters and were used for bioinformatic analyses: XIXIMI-04 = 55 larvae, GOMECC-3 = 3 larvae, and donated tissues = 8 adults (Table 1 and Supplementary Table 1). These individuals were divided into three regions (Figure 3): southern = 39, central =18, and northern= 9. The regions were based on the Miron et al. (2017) division of oceanographic provinces (Figure 1). There were missing data in the final data set. In the southern region data, there were 12% missing data in 18 loci; in the central region data, there were 10% missing data in 31 loci; in the northern region data, there were 12% missing data in 282 loci, 25% missing data in 25 loci and 37% missing data in three loci. In the individuals, we registered a mean value of missing data of 1.91% (minimum = 0.19%; maximum 15.86%).
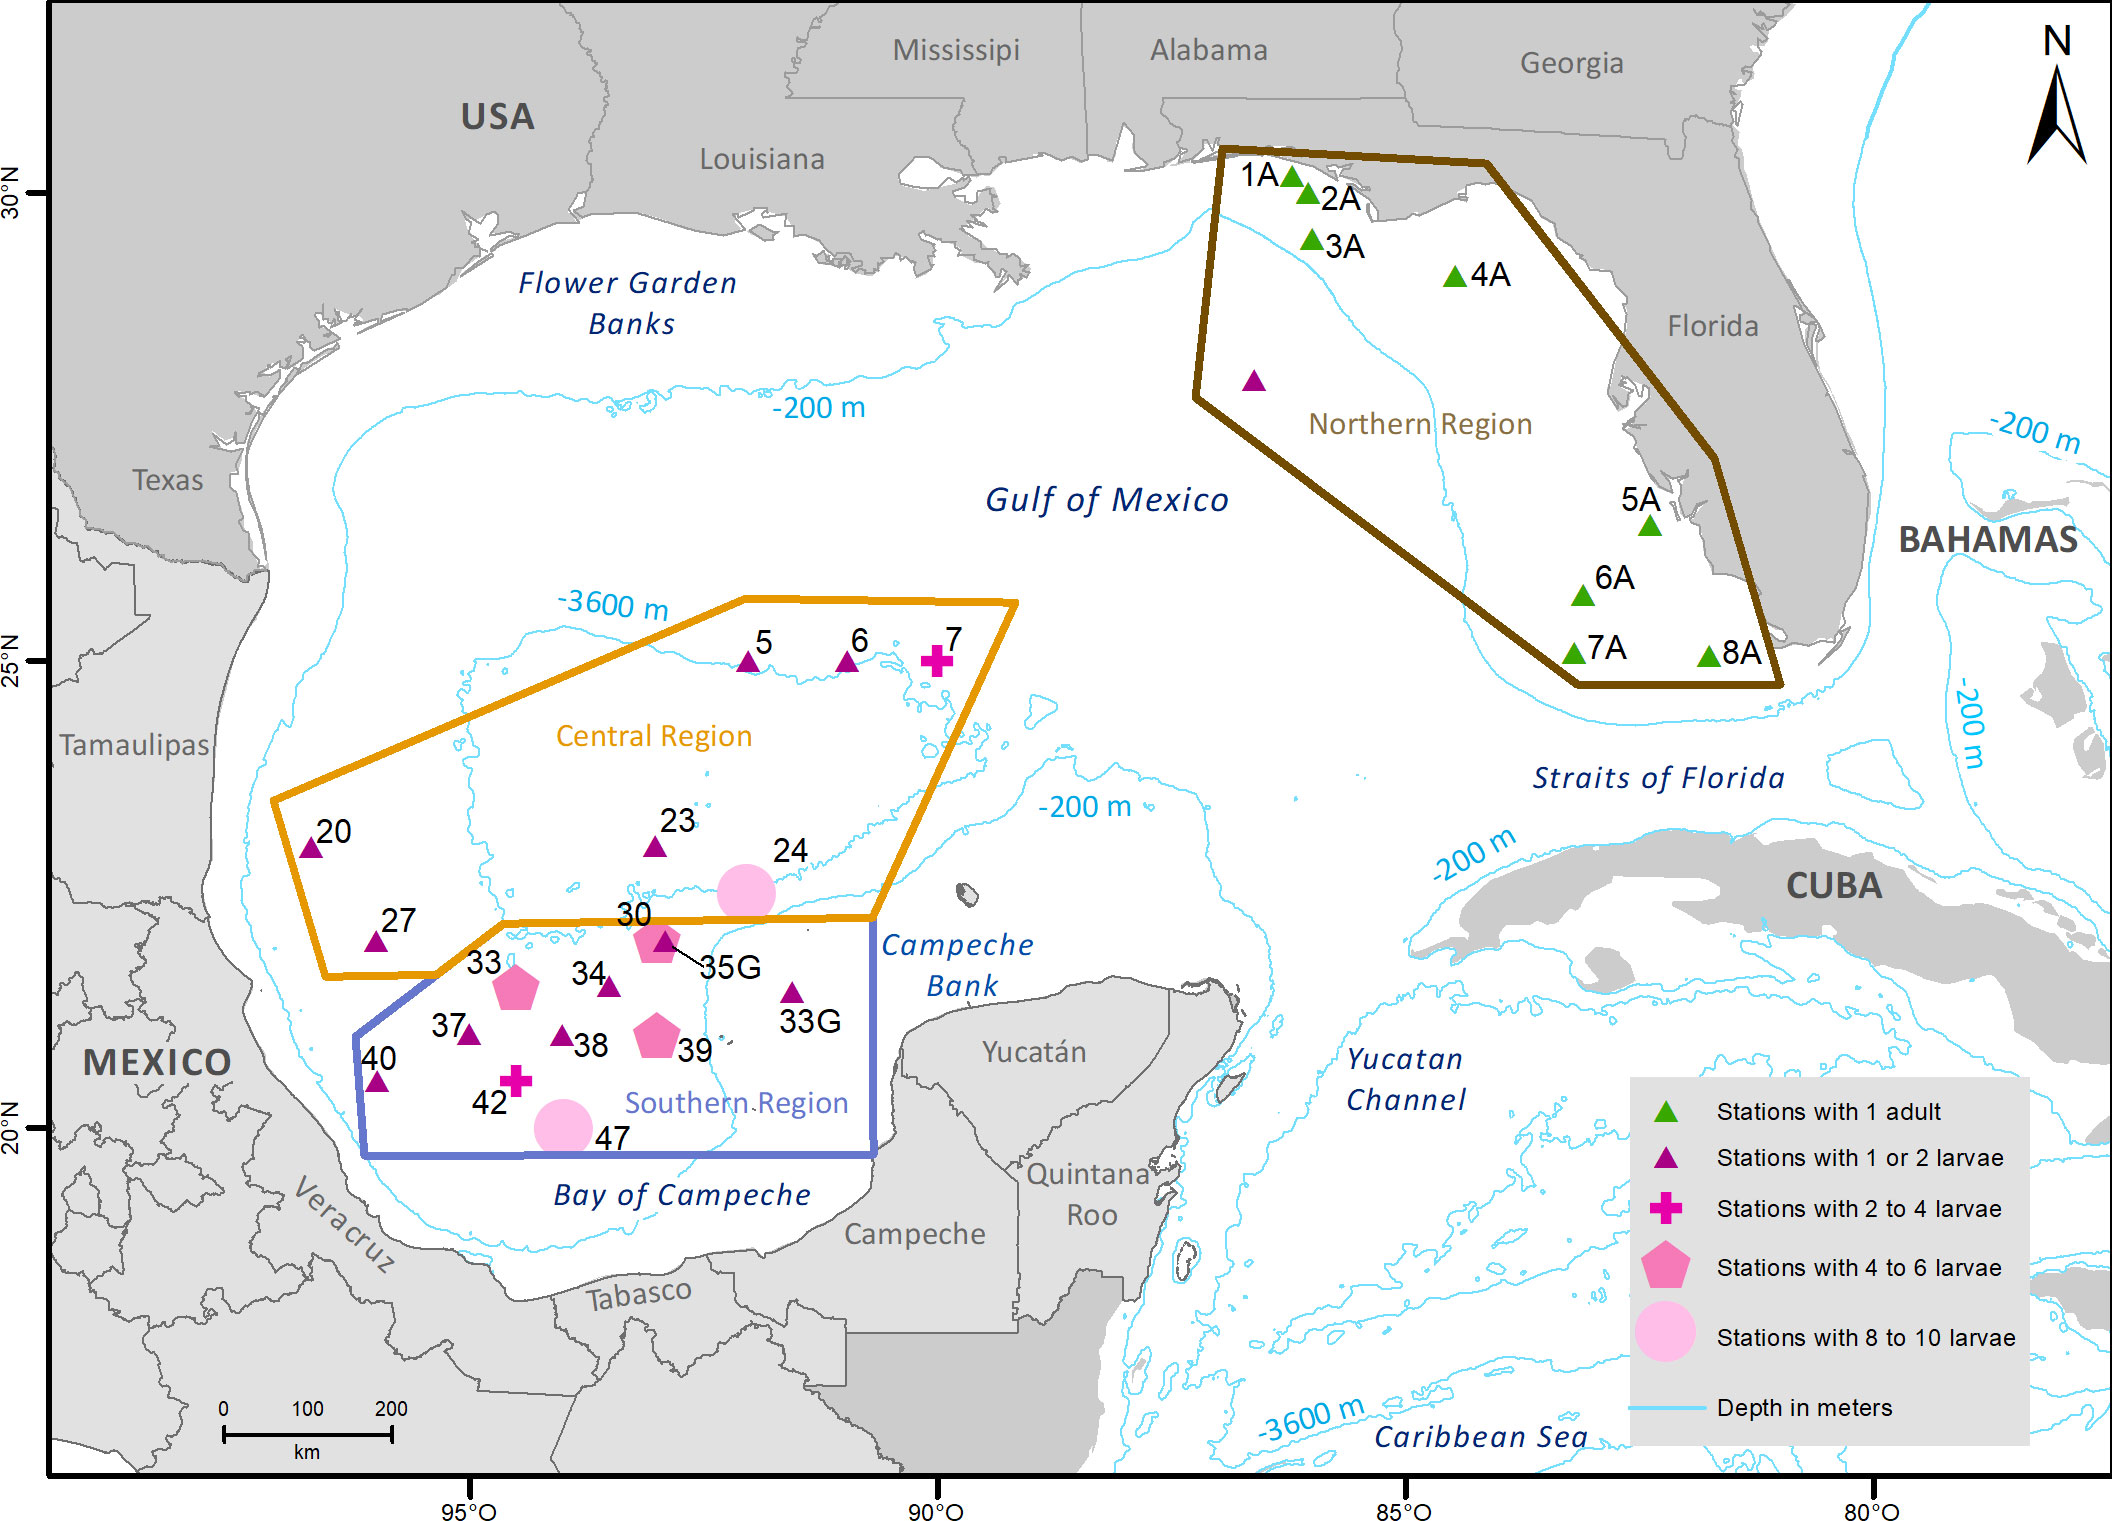
Figure 3 Distribution of Bothus robinsi larvae and adults, included in the final library, separated in three regions: central, southern, and northern.
3.1 Genetic analyses
The simulations performed in POWSIM indicated that the dataset has enough statistical power to detect FST values of 0.0025 (Chi2 = 0.907; power 92.70%), 0.0050 (Chi2 = 1; power 100%), and 0.0099 (Chi2 = 1; power 100%).
3.2 Genetic diversity
The genetic diversity (He) was similar in the three sampled regions and ranged from 0.238 to 0.255 (Table 2); likewise, the number of effective alleles was similar among the three regions and varied between 1.38-1.39. Central and Northern regions showed slightly higher values of Ho compared to He and negative Fis values (Table 2). In the northern region, 97.78% of the loci were in HWE (p-value=0.07-1), 97.1% in the central (p-value=0.06-1), and 98.36% in the southern region in HWE (p-value=0.06-1). The Fis values were close to zero (range -0.07 to 0.003).
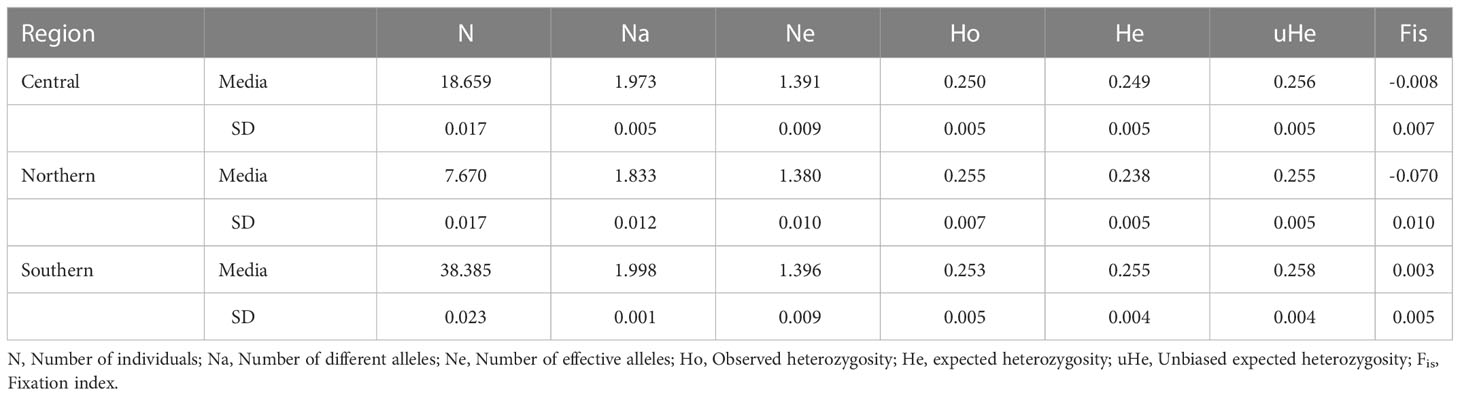
Table 2 Mean values and standard deviations of general descriptors of genetic diversity of 66 Bothus robinsi larvae and adults.
The paired FST statistics calculated were 0.028 between southern vs central (p-value= 0.197), 0.049 southern vs north (p-value= 0.108), and 0.068 between central vs northern (p-value= 0.067). None of the Fst comparisons were statistically significant (p > 0.05), indicating a lack of genetic structure.
The PCA and DPCA gave similar results that were congruent with the Fst analyses. The PCA first and second axis (PC1, 49.67% of the variance; PC2, 48.62% of the variance) showed that all organisms belong to one genetic cluster (Figure 4). The DAPC was generated based on 20 PC. The two retained PC (PC1, 77.53%; PC2, 22.46%; proportion of conserved variance 0.426) showed the existence of one genetic cluster (Figure 4).
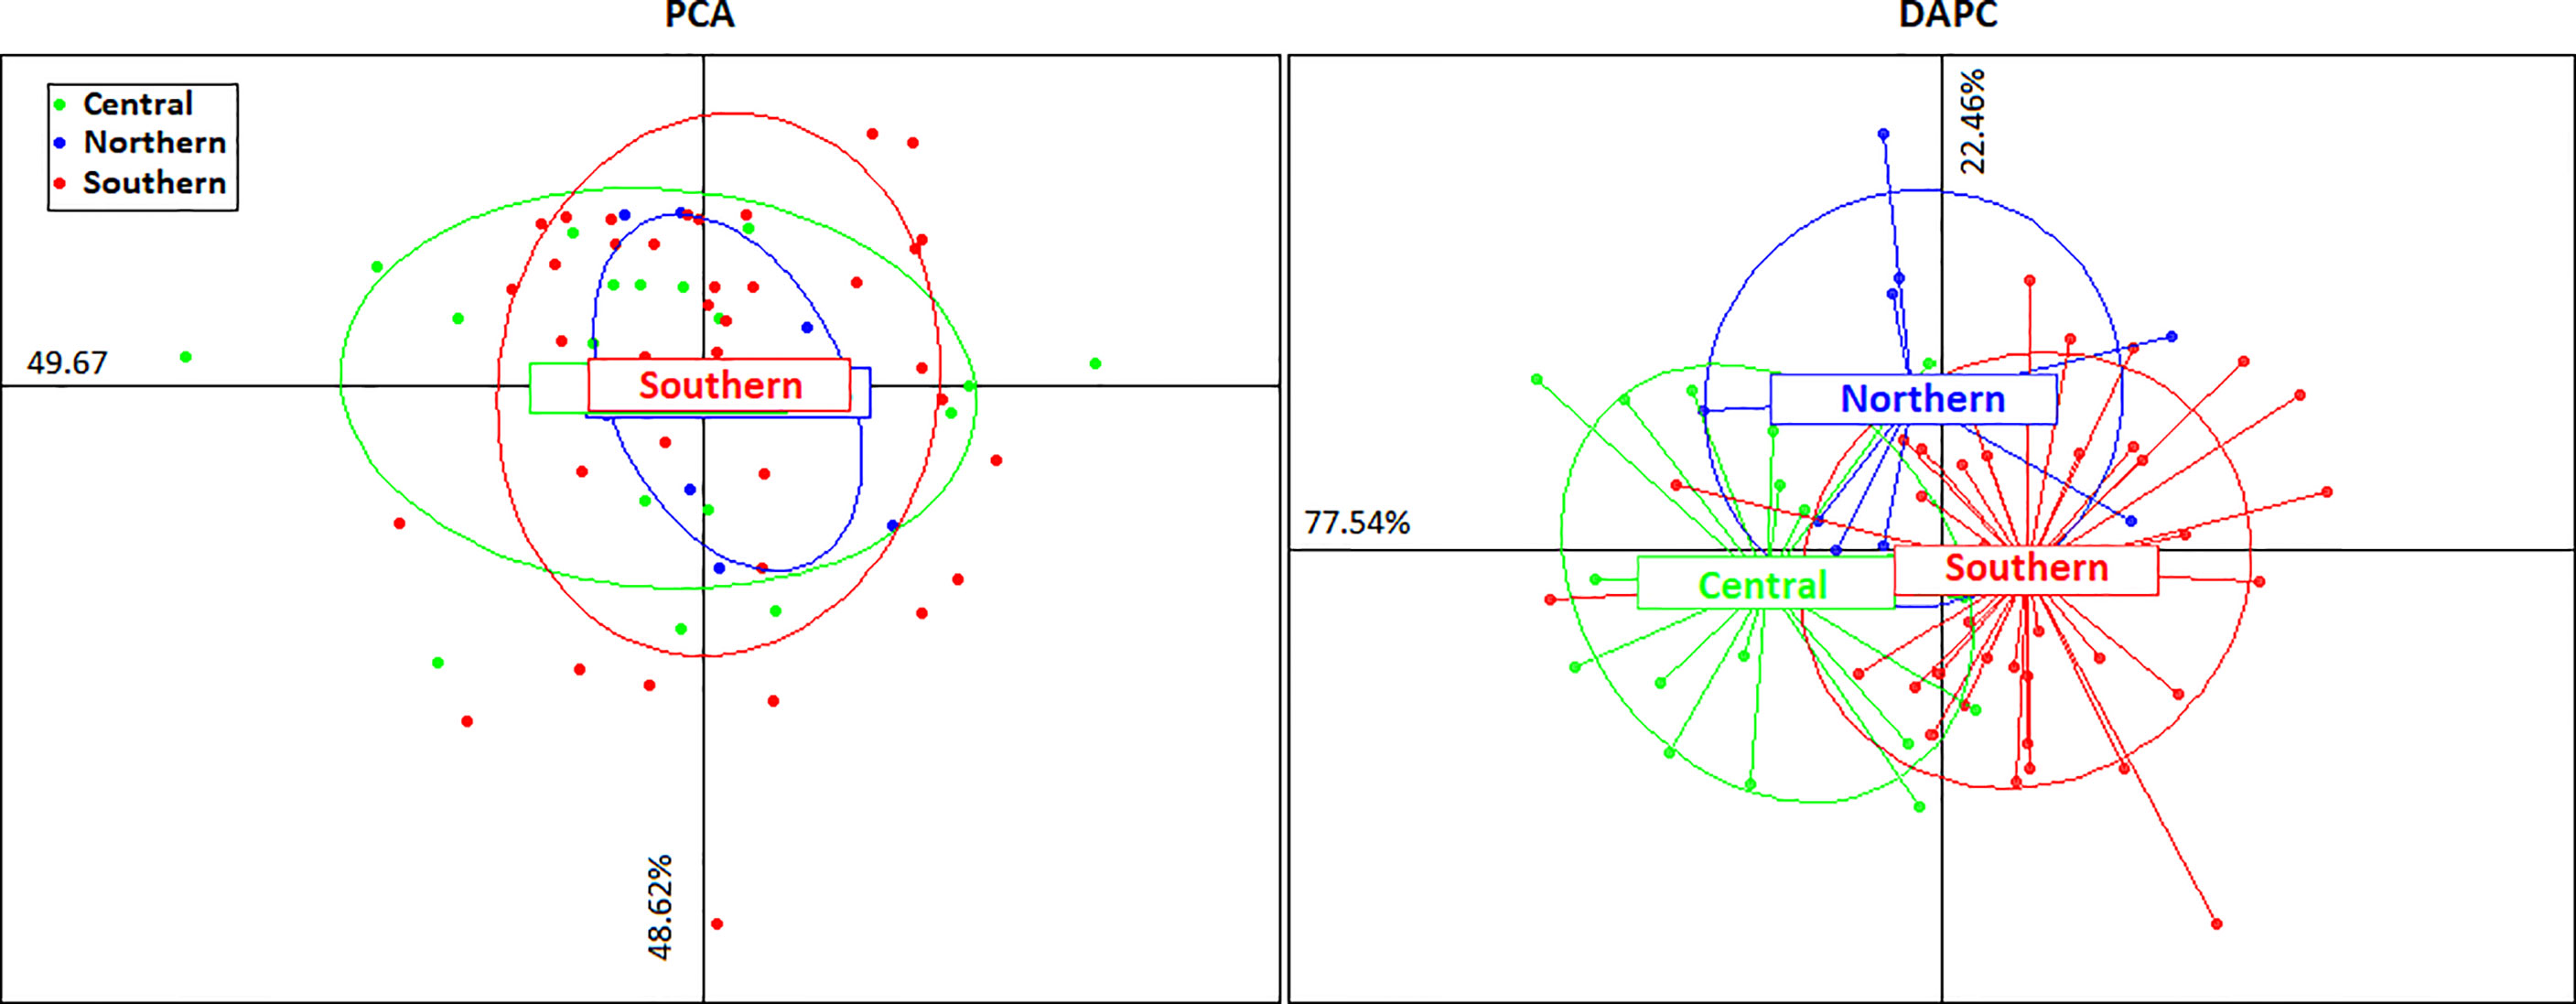
Figure 4 PCA and DAPC. Graphs obtained from 1,034 neutral SNPs. PCA graph points represent Bothus robinsi individuals (66) from the three regions sampled in the Gulf of Mexico; DAPC graph points represent different Bothus robinsi individuals (66), color pattern different sampling regions (blue=northern, green central, and red=southern).
The Bayesian clustering carried out with the Structure software showed similar results to PCA and DAPC. Although the optimal number of genetic cluster (K) determined was nine (K=9) according to the ad hoc statistic ΔK, the Log-likelihood for K (LK) was not consistent with the ΔK, and showed no resolution to estimate a clear optimum K value (Supplementary Figure 4).
All the organisms in the Structure plot showed homogeneity in the assignment probabilities to K= 2, K= 3, and K= 9 (Figure 5 and Supplementary Figure 5).

Figure 5 Structure barplot obtained from 1,304 SNPs loci in 66 individuals. Posterior probabilities of individual assignment are shown for two K values (K=2, and K=3) for comparison.
3.3 Full siblings’ determination
A sibship evaluation was carried out with a full-likelihood method implemented in COLONY. Three possible half-sib pairs were estimated, but the probability values were very low (0.021, 0.001, and 0.001), indicating the lack of any full-sib or half-sib pairs among the individuals sampled.
4 Discussion
The genetic diversity descriptors obtained were very similar in the three sampled regions. Observed and expected heterozygosities showed similar values, indicating that the sampled organisms have the expected heterozygosity for a population with random mating. Also, Fis values near zero suggest that lack of endogamy in the individuals sampled within each region.
The three sampled regions showed similar allele frequencies based on non-significant Fst values. These values were consistent with the evidence of one genetic cluster observed in the PCA and DAPC graphs. These results are similar to the Fst values observed in the Western Atlantic lionfish (Pterois volitans; PLD ~25-35 days) among subpopulations located in the Northern GOM (Louisiana, Mississippi, Alabama, and Florida) (Fst = -0.040 to 0.013, p-values>0.05) suggesting the existence of one genetically homogeneous population (Pérez-Portela et al., 2018).
We did not find evidence for collective dispersal. We determined that all sampled larvae were genetically unrelated, even in stations where we sampled multiple larvae from the same developmental stage. The lack of first- and second-degree relatives and the absence of signs of inbreeding within each region where the larvae were sampled along with the existence of genetic homogeneity among all sampled regions support the lack of collective dispersal behavior. In a study of the slipper limpet (Crepidula fornicata), Riquet et al. (2017) observed a possible scenario of collective dispersal. They reported related larvae (full-sibs and half-sibs) sampled simultaneously and the presence of genetic differentiation between distinct larval groups, indicating a reduced effective population size or sweepstake reproductive success. Because we sampled unrelated larvae in different developmental stages at the same sampling stations, we inferred that these larval groups represent a mixture of larvae from different cohorts and sites, resulting from the high dispersal potential of B. robinsi consistent with a long PLD. A PLD of 4-6 months allows high rates of mixing over hundreds of kilometers, reducing the effects of sweepstakes’ reproductive success (Ottmann et al., 2016).
As consistently reflected in the results showing a lack of genetic structure (Fst, PCA, DAPC, Structure Bayesian clustering), the larvae sampled showed genetic homogeneity, indicating an open population with high degree of genetic connectivity in the GOM. Bothus robinsi larvae occurred jointly in the upper 100-meter water layer (Evseenko, 2008; Garbini et al., 2014), so their dispersal is influenced by the superficial currents (Figure 2). We did not find support for the presence of high self-recruitment driven by the retention mechanisms reported for the Bay of Campeche (Sanvicente-Añorve et al., 2014; Díaz-Flores et al., 2017; Lara-Hernández et al., 2019). However, our results agree with larval dispersal simulations where the Bay of Campeche is considered a zone with high potential connectivity among nearby subpopulations (Veracruz, Tabasco, and Campeche; subpopulations located in the Campeche province and Bay of Campeche) for organisms with a PLD between 4-7 months (Sanvicente-Añorve et al., 2014; Lara-Hernández et al., 2019). These results highlight the complex dynamics of metapopulation processes within a region like the Bay of Campeche, which could be explained if export/import and self-recruitment vary along the year resulting in distinct metapopulations scenarios for different species that display different configurations of spawning times and PLDs.
The high potential connectivity results from the combination of the currents caused by the cyclonic gyre in the Bay of Campeche and the current’s back-and-forth behavior in the narrow western shelf in Veracruz and Tamaulipas (Figure 2) (Sanvicente-Añorve et al., 2014; Lara-Hernández et al., 2019). The west neritic surface circulation over the narrow shelf display seasonal variations driven by the dynamics of winds, causing currents to shift towards the northwest in Spring and Summer (March to August) or southeast in Autumn and Winter (September to February) (Sanvicente-Añorve et al., 2014). This circulation keeps the larvae inside the narrow western shelf and transports larvae to the southeast (Campeche Banks) or the northwest (Flower Garden Banks). Additionally, larvae can be transported to oceanic waters towards the north through a confluence area of neritic and oceanic waters over the western edge of the Campeche Bank influenced by the cyclonic gyre of the Bay of Campeche. The gyre keeps larvae in the Bay of Campeche until their incorporation into the Campeche shelf or their possible ejection to other GOM provinces (Sanvicente-Añorve et al., 2014; Lara-Hernández et al., 2019).
For larvae with long PLD as the lobster Panulirus argus (4-7 months), the dynamic of currents in the Campeche Bay generates high values of potential connectivity. The highest connectivity values between GOM subpopulations were observed within the Campeche Bay: Campeche-Central Veracruz and Campeche-Southern Veracruz, followed by Central Veracruz-Southern Veracruz, Northern Veracruz-Central Veracruz, and Northern Veracruz-Campeche (Lara-Hernández et al., 2019). The dynamics of the Bay of Campeche, in combination with the high potential of dispersal and the multiple spawning events of B. robinsi, enhance the possibility of mixing cohorts in the dispersal, homogenizing allele frequencies within groups of larvae. Furthermore, its long PLD makes it possible for groups of larvae trapped inside the cyclonic gyre to have more possibilities to settle in the continental platform inside or outside of the Bay of Campeche (Lara-Hernández et al., 2019). The P. argus larval dispersal simulation also showed that the Bay of Campeche registered the highest values of self-recruitment (Northern Veracruz 0.711%; Central Veracruz 1.736%; Southern Veracruz 1.179%; Campeche 4.451%) (Lara-Hernández et al., 2019).
The results from studies that conducted larval dispersal simulations for P. argus (PLD=4-7 months) and the Red snapper (Lutjanus campechanus; PLD=31 days) suggest that bidirectional connectivity could be present between Florida and the Bay of Campeche for B. robinsi (PLD= approx. 5-12 months) (Evseenko, 2008; Johnson et al., 2013). In P. argus and L. campechanus larval dispersal simulations, potential connectivity is observed between all the sites located in the Bay of Campeche (Northern Veracruz, Southern Veracruz, Central Veracruz) and all the sites in Florida (Northern, Central Florida, and Southern Florida) (Lara-Hernández et al., 2019). The B. robinsi biological characteristics (subpopulation locations and PLD) are enough to have similar dispersal pathways.
We must emphasize that the direct connectivity between the Bay of Campeche and Florida is not the only way to exchange genes. The indirect exchange of genes between all provinces and subpopulations is possible under a scenario where GOM subpopulations are connected with other neighboring sites creating connectivity over multiple generations and enhancing the gene exchange via a stepping-stone model (Maruyama, 1970; Sanvicente-Añorve et al., 2014; Díaz-Flores et al., 2017; Lara-Hernández et al., 2019; Compaire et al., 2021)The dispersal pathway where the Bay of Campeche is a larval source suggests that the larvae can settle in almost any other locations within the GOM.
Another scenario that can explain genetic homogeneity is the existence of one single larval pool for the GOM. Larval dispersal simulations, along with B. robinsi long PLD and its distribution around the GOM continental shelf are consistent with the idea that B. robinsi larvae spend enough time in oceanic waters to enhance the mixing process. Distinct larval cohorts originating in the continental shelf of the Bay of Campeche, Florida, Quintana Roo, Texas, and Flower Garden Banks can contribute to the larval pools found in the central and southern regions. This mix of larvae from different areas could explain the genetic homogeneity found among our samples. We suggest that this mix of larvae is happening in all the GOM, generating the existence of one larval pool and the genetic homogenization in the GOM.
These results indicate that B. robinsi has the biological characteristic of avoiding the dynamics of retention zones. Additionally, our study confirmed the genetic homogeneity between B. robinsi larvae from the Bay of Campeche, oceanic waters from the central region of the GOM, and adults from Florida, suggesting high genetic connectivity and the existence of a single B. robinsi panmictic population.
Data availability statement
The datasets presented in this study can be found in online repositories. The names of the repository/repositories and accession number(s) can be found in the article/Supplementary Material.
Ethics statement
Ethical review and approval was not required for the animal study because we obtained larvae from zooplankton nets. The animals were not used in any experiment.
Author contributions
JM-P, AM-V, CG-S, SPJ-R, and ARO conceived and designed research. JM-P and CG-S conducted the molecular identifications. JM-P and SPJ-R conducted morphological identifications. JM-P and AM-V built the ddRAD-Seq library. Writing-original draft JM-P and AM-V. Writing-review and editing JM-P, CG-S, AM-V, SPJ-R, and ARO. JM-P and AM-V conducted the bioinformatic analysis. JM-P, CG-S, AM-V, SPJ-R, and ARO interpreted the results. All authors contributed to the article and approved the submitted version.
Funding
This research has been funded by the Consejo Nacional de Ciencia y Tecnología in Mexico (National Council for Science and Technology - Mexican Ministry of Energy - Hydrocarbon Fund Project 201441). This study is a contribution of the Gulf of Mexico Research Consortium (CIGoM). The authors acknowledge Petróleos Mexicanos (PEMEX) specific request to the Hydrocarbon Fund to address the environmental effects of oil spills in the Gulf of Mexico. Samples reported in this work were partially collected under the auspices of the National Oceanic and Atmospheric Administration (NOAA) Ocean Acidification Program (OAP) during the GOMECC-3 cruise (research permit for Mexican waters PPFE/DGOPA-137/17, EG0082017. All authors are also grateful to Dr. Leticia Barbero for the opportunity of sampling ichthyoplankton during GOMECC-3.
Acknowledgments
The authors are grateful to Javier Robles Flores, Edna Sánchez Castrejón, and Anaid Saavedra Flores from the Laboratorio de Genómica Funcional, Departamento de Biotecnología Marina, CICESE. Dr. Oscar E. Juárez for the support in the performance of genetic analysis and interpretation of genomic data. Dr. Miguel A. Martinez for the bioinformatic support. Dr. Sharon Zinah Herzka Llona and her team from the Departamento de Oceanografía Biológica, Centro de Investigación Científica y de Educación Superior de Ensenada (CICESE) for the samples collection. Dr. Paula Pérez-Brunius, from CICESE, for support with GOM circulation literature and explanation. Dr. Victor Benjamin from the Ocean Science Foundation, Irving CA, for supplying tissue samples. FWC – Fish and Wildlife Research Institute for making the material available, and to Eric Post, Ichthyology Collection Manager, for help in the logistics of obtaining the adult B. robinsi tissues from the Florida Fish and Wildlife Conservation Commission (FSBC): FSBC 23959, FSBC 24392, FSBC 24578, FSBC 24592, FSBC 25746, FSBC 25785, FSBC 25920, FSBC 26633, FSBC 26656, FSBC 28035, FSBC 28237, FSBC 32399 and FSBC 34057. Fátima Ordóñez from Laboratorio de Plancton y Ecología Marina IPN-CICIMAR. Consejo Nacional de Ciencia y Tecnología for the scholarship, CVU: 691884 CONACYT.
Conflict of interest
The authors declare that the research was conducted in the absence of any commercial or financial relationships that could be construed as a potential conflict of interest.
Publisher’s note
All claims expressed in this article are solely those of the authors and do not necessarily represent those of their affiliated organizations, or those of the publisher, the editors and the reviewers. Any product that may be evaluated in this article, or claim that may be made by its manufacturer, is not guaranteed or endorsed by the publisher.
Supplementary material
The Supplementary Material for this article can be found online at: https://www.frontiersin.org/articles/10.3389/fmars.2023.1070483/full#supplementary-material
Footnotes
- ^ https://www.fishbase.se/summary/Bothus-robinsi.html
- ^ https://www.floridamuseum.ufl.edu/discover-fish/species-profiles/bothus-ocellatus/
- ^ https://mexican-fish.com/twospot-flounder/
- ^ http://www.ncbi.nlm.nih.gov
- ^ http://www.ddocent.com/filtering/
- ^ https://vcftools.sourceforge.net/man_latest.html
- ^ https://www.R-project.org/
- ^ https://taylor0.biology.ucla.edu/structureHarvester /
References
Altschul S. F., Gish W., Miller W., Myers E. W., Lipman D. J. (1990). Basic local alignment search tool. J. Mol. Biol. 215 (3), 403–410. doi: 10.1016/S0022-2836(05)80360-2
Blanqueto-Manzanero M. D., Vega-Cendejas M. E. (2018). Ontogenetic variation of food habitats of Trichopsetta ventralis (Pleuronectiformes: Bothidae) in the southern gulf of Mexico. Hidrobiológica 28 (1), 1–10. doi: 10.24275/uam/izt/dcbs/hidro/2018v28n1/Vega
Catchen J., Bassham S., Wilson T., Currey M., O´Brien C., Yeates. Q., et al. (2013). The population structure and recent colonization history of Oregon threespine stickleback determined using restriction-site associated DNA-sequencing. Mol. Ecol. 22 (11), 2864–2883. doi: 10.1111/mec.12330
Compaire J. C., Pérez-Brunius P., Jiménez-Rosenberg S. P. A., Rodríguez J., Echeverri G. L., Herzka S. Z. (2021). Connectivity of coastal and neritic fish larvae to the deep waters. Limnol. Oceanogr. 66 (6), 2423–2441. doi: 10.1002/lno.11762
Cowen R. K., Sponaugle S. (2009). Larval dispersal and marine population connectivity. Annu. Rev. Mar. Sci. 1 (1), 443–466. doi: 10.1146/annurev.marine.010908.163757
dDocent (2022) SNP filtering tutorial. Available at: http://www.ddocent.com/filtering (Accessed October 13, 2022).
Díaz-Flores M.Á., Salas-de-León D. A., Monreal-Gómez M. A. (2017). Origin and evolution of cyclonic eddy of the bay of campeche, gulf of Mexico. Rev. Biol. Mar. Oceanogr. 52 (3), 441–450. doi: 10.4067/s0718-19572017000300003
Domingues C. P., Creer S., Taylor M. I., Queiroga H., Carvalho G. R. (2011). Temporal genetic homogeneity among shore crab (Carcinus maenas) larval events supplied to an estuarine system on the Portuguese northwest coast. Heredity 106, 832–840. doi: 10.1038/hdy.2010.126
Evseenko S. A. (2008). Distribution and routes of drift migrations in larvae of three species of flatfish Bothus (Bothidae) in open waters of the northern Atlantic. J. Ichthyol. 48 (9), 792–809. doi: 10.1134/S0032945208090105
Excoffier L., Lischer H. E. L. (2010). Arlequin suite ver 3.5: A new series of programs to perform population genetics analyses under Linux and windows. Mol. Ecol. Resour. 10 (3), 564–567. doi: 10.1111/j.1755-0998.2010.02847.x
FishBase (2022) Bothus robinsi. Available at: https://www.fishbase.se/summary/Bothus-robinsi.html (Accessed October 04, 2022).
Flores-Coto C., Zavala F., Sanvicente L. (2009). Ictioplancton del sur del golfo de méxico. un compendio. Hidrobiológica 19 (1), 49–76.
Florida Museum (2022) Bothus ocellatus. Available at: https://www.floridamuseum.ufl.edu/discover-fish/species-profiles/bothus-ocellatus/ (Accessed October 04, 2022).
Foll M., Gaggiotti O. (2008). A genome-scan method to identify selected loci appropriate for both dominant and codominant markers: a bayesian perspective. Genetics 180 (2), 977–993. doi: 10.1534/genetics.108.092221
Gagnaire P. A. (2020). Comparative genomics approach to evolutionary process connectivity. Evol. Appli. 13 (6), 1320–1334. doi: 10.1111/eva.12978
Garbini C. N., de Zani-Teixeira M. L., Ohkawara M. H., Katsuragawa M. (2014). Distribution and abundance of Pleuronectiformes larvae off southeastern Brazil. Braz. J. Oceanogr. 62, 23–34. doi: 10.1590/s1679-87592014051706201
Green A. L., Maypa A. P., Almany G. R., Rhodes K. L., Weeks R., Abesamism R. A., et al. (2015). Larval dispersal and movement patterns of coral reef fishes, and implications for marine reserve network design. Biol. Rev. 90 (4), 1215–1247. doi: 10.1111/brv.12155
Hamilton P., Leben R., Bower A., Furey H., Pérez-Brunius P. P. (2018). Hydrography of the gulf of Mexico using autonomous floats. J. Phys. Oceanogr. 48 (4), 773–794. doi: 10.1175/JPO-D-17-0205.1
Hedgecock D., Barber P., Edmands S. (2007). Genetic approaches to measuring connectivity. Oceanography 20 (3), 70–79. doi: 10.5670/oceanog.2007.30
Houde E. D., Leak J. C., Dowd C. E., Berkeley S. A., Richards W. J. (1979). Ichthyoplankton abundance and diversity in the eastern gulf of Mexico (New Orleans: US Department of Commerce, National Technical Information Service PB-299839).
Johnson D. R., Perry H. M., Lyczkowski-Shultz J. (2013). Connections between campeche bank and red snapper populations in the gulf of Mexico via modeled larval transport. Trans. Am. Fish. Soc 142 (1), 50–58. doi: 10.1080/00028487.2012.720630
Jones O. R., Wang J. (2010). COLONY: a program for parentage and sibship inference from multilocus genotype data. Mol. Ecol. Resour. 10 (3), 551–555. doi: 10.1111/j.1755-0998.2009.02787.x
Joyeux J. C., Miller J. M., Aliaume C., Zerbi A. (1995). Growth of sand whiff Citharichthys arenaceus and bay whiff Citharichthys spilopterus (pleuronectiformes: bothidae) in Puerto Rico (greater antilles) and north Carolina (USA), with comments on growth rate comparisons. Neth. J. Sea. Res. 34 (1–3), 211–220. doi: 10.1016/0077-7579(95)90028-4
Kearse M., Moir R., Wilson A., Stones-Havas S., Cheung M., Sturrock S., et al. (2012). Geneious basic: An integrated and extendable desktop software platform for the organization and analysis of sequence data. Bioinformatics 28 (12), 1647–1649. doi: 10.1093/bioinformatics/bts199
Kendrick G. A., Orth R. J., Statton J., Hovey R., Ruiz L., Lowe R. J., et al. (2017). Demographic and genetic connectivity: the role and consequences of reproduction, dispersal and recruitment in seagrasses. Biol. Rev. 92 (2), 921–938. doi: 10.1111/brv.12261
Kopelman N. M., Mayzel J., Jakobsson M., Rosenberg N. A., Mayrose I. (2015). Clumpak: A program for identifying clustering modes and packaging population structure inferences across K. Mol. Ecol. Resour. 15 (5), 1179–1191. doi: 10.1111/1755-0998.12387
Kumar S., Stecher G., Li M., Knyaz C., Tamura K. (2018). MEGA X: molecular evolutionary genetics analysis across computing platforms. Mol. Biol. Evol. 35 (6), 1–4. doi: 10.1093/molbev/msy096
Lara-Hernández J. A., Zavala-Hidalgo J., Sanvicente-Añorve L. (2019). Connectivity and larval dispersal pathways of Panulirus argus in the gulf of Mexico: a numerical study. J. Sea Res. 155, 101814. doi: 10.1016/j.seares.2019.101814
Maruyama T. (1970). Effective number of alleles in a subdivided population. Theor. Popul. Biol. 1 (3), 273–306. doi: 10.1016/0040-5809(70)90047-X
McEachran J. D. (2009). “Fishes (Vertebrata: Pisces) of the gulf of Mexico,” in Gulf of Mexico origin, waters, and biota, vol. 1 . Eds. Darryl F. L., Camp C. K. (Austin, TX: A&M University Texas Press), 1223–1316.
Mexico - Fish, Birds, Crabs, Marine Life, Shells and Terrestrial Life (2022) Twospot flounder. Available at: https://mexican-fish.com/twospot-flounder/ (Accessed October 13, 2022).
Miron P., Beron-Vera F. J., Olascoaga M. J., Sheinbaum J., Pérez-Brunius P., Froyland G. (2017). Lagrangian Dynamical geography of the gulf of Mexico. Sci. Rep. 7 (1), 1–12. doi: 10.1038/s41598-017-07177-w
Morato T., Afonso P., Carvalho N., Lourinho P., Santos. R. S., Krug H. M., et al. (2007). Growth, reproduction and recruitment patterns of the wide-eyed flounder, Bothus podas delaroche (Pisces: Bothidae), from the Azores. Mar. Biol. Res. 3 (6), 403–411. doi: 10.1080/17451000701712331
Muller-Karger F. E., Smith J. P., Werner S., Chen R., Roffer M., Liu Y., et al. (2015). Natural variability of surface oceanographic conditions in the offshore gulf of Mexico. Prog. Oceanogr. 134, 54–76. doi: 10.1016/j.pocean.2014.12.007
Munroe T. A. (2003). “"Bothidae. lefteye flounders", in FAO species identification guide for fishery purposes,” in The living marine resources of the Western central atlantic. vol. 3: Bony fishes part 2 (Opistognathidae to molidae), sea turtles and marine mammal. Ed. Carpenter K. E.(Rome, ITA: Food and agriculture organization of the United Nations (FAO)), 1885–1895.
National Library of Medicine (2022) The national center of biotechnology (NCBI). Available at: http://www.ncbi.nlm.nih.gov (Accessed October 13, 2022).
Ottmann D., Gorud-Colvert K., Sard N. M., Huntington B. E., Banks M. A., Sponaugle S. (2016). Long-term aggregation of larval fish siblings during dispersal along an open coast. Proc. Natl. Acad. Sci. U. S. A. 113 (49), 14067–14072. doi: 10.1073/pnas.1613440113
Otwoma L. M., Reuter H., Timm J., Meyer A. (2018). Genetic connectivity in a herbivorous coral reef fish (Acanthurus leucosternon bennet 1833) in the eastern African region. Hydrobiologia 806 (1), 237–250. doi: 10.1007/s10750-017-3363-4
Peakall R., Smouse P. E. (2012). GenAlEx 6.5: Genetic analysis in excel. population genetic software for teaching and research-an update. Bioinformatics 28 (19), 2537–2539. doi: 10.1093/bioinformatics/bts460
Pérez-Portela R., Bumford A., Coffman B., Wedelich S., Davenport M., Fogg A., et al. (2018). Genetic homogeneity of the invasive lionfish across the northwestern Atlantic and the gulf of Mexico based on single nucleotide polymorphisms. Sci. Rep. 8 (1), 1–12. doi: 10.1038/s41598-018-23339-w
Peterson B. K., Weber J. N., Kay E. H., Fisher H. S., Hoekstra H. E. (2012). Double digest RADseq: An inexpensive method for de novo SNP discovery and genotyping in model and non-model species. PloS One 7 (5), e37135. doi: 10.1371/journal.pone.0037135
Pineda J., Hare J., Sponaugle S. (2007). Larval transport and dispersal in the coastal ocean and consequences for population connectivity. Oceanography 20 (3), 22–39. doi: 10.5670/oceanog.2007.27
Pritchard J. K., Stephens M., Donnelly P. (2000). Interspecific cross of Brassica oleracea var. alboglabra and B. napus: Effects of growth condition and silique age on the efficiency of hybrid production, and inheritance of erucic acid in the self-pollinated backcross generation. Genetics 155, 945–959. doi: 10.1093/genetics/155.2.945
Ratnasingham S., Hebert P. D. N. (2007). The barcode of life data ystem. Mol. Ecol. Notes. 7, 355–364. doi: 10.1111/j.1471-8286.2006.01678.x
R Core Team (2022) R core team 2021 r: a language and environment for statistical computing (R foundation for statistical computing). Available at: https://www.R-project.org/ (Accessed October 13, 2022).
Riquet F., Comtet T., Broquet T., Viard F. (2017). Unexpected collective larval dispersal but little support for sweepstakes reproductive success in the highly dispersive brooding mollusc Crepidula fornicata. Mol. Ecol. 26 (20), 5467–5483. doi: 10.1111/mec.14328
Romero-Centeno R., Zavala-Hidalgo J., Osuna-Cañedo J. P. (2021). “Circulación oceánica y oleaje,”. In: Eds. Herzka S. Z., Álvarez R.A.Z., Cárdenas E.M.P. y G. Hernández Atlas de línea base ambiental del golfo de México (tomo II). (México: Consorcio de Investigación del Golfo de México).
Ryman N., Palm S. (2006). POWSIM: a computer program for assessing statistical power when testing for genetic differentiation. Mol. Ecol. Notes. 6 (3), 600–602. doi: 10.1111/j.1471-8286.2006.01378.x
Sadorus L. L., Goldstein E. D., Webster R. A., Stockhausen W. T., Planas J. V., Duffy-Anderson J. T. (2021). Multiple life-stage connectivity of pacific halibut (Hippoglossus stenolepis) across the Bering Sea and gulf of Alaska. Fish. Oceanogr. 30 (2), 174–193. doi: 10.1111/fog.12512
Salas-Monreal D., Marin-Hernadez M., Salas-Perez J. J., Salas-de-Leon D. A., Monreal-Gomez M. A., Perez-España H. (2018). Coral reef connectivity within the Western Gulf of Mexico. J. Mar. Syst. 179, 88–89. doi: 10.1016/j.jmarsys.2017.12.001
Sanvicente-Añorve L., Flores-Coto C., Chiappa-Carrara X. (2000). Temporal and spatial scales of ichthyoplankton distribution in the southern gulf of Mexico. Estuar. Coast. Shelf Sci. 51 (4), 463–475. doi: 10.1006/ecss.2000.0692
Sanvicente-Añorve L., Zavala-Hidalgo J., Allende-Arandía M. E., Hermoso-Salazar M. (2014). Connectivity patterns among coral reef systems in the southern gulf of Mexico. Mar. Ecol.-Prog. Ser. 498, 27–41. doi: 10.3354/meps10631
Shima J. S., Swearer S. E. (2016). Evidence and population consequences of shared larval dispersal histories. Ecology 97 (1), 25–31. doi: 10.1890/14-2298.1
Smith P. E., Richardson S. L. (1977). Standard techniques for pelagic fsh egg and larva surveys (Rome: FAO Fisheries Technology Paper).
Structure Harvester (2022) Structure harvester web v0.6.94. Available at: https://taylor0.biology.ucla.edu/structureHarvester/ (Accessed October 13, 2022).
Turner R. E., Rabalais N. N. (2019). “The gulf of Mexico,” in World seas: an environmental evaluation, 2nd ed., vol. I . Ed. Sheppard C. (Europe, the Americas and west Africa: Academic Press), 445–464. doi: 10.1016/B978-0-12-805068-2.00022-X
VCFtools (2022) Vcftools v0.1.13. Available at: https://vcftools.sourceforge.net/man_latest.html (Accessed October 13, 2022).
Villegas-Sánchez C. A., Pérez-España H., Rivera-Madrid R., Salas-Monreal D., Arias- González J. E. (2014). Subtle genetic connectivity between Mexican Caribbean and south-western gulf of Mexico reefs: The case of the bicolor damselfish, Stegastes partitus. Coral Reefs. 33 (1), 241–251. doi: 10.1007/s00338-013-1083-4
Wakida-Kusunoki A., Becerra-de la Rosa I., González-Cruz A., Amador-del Ángel L. E. (2013). Distribución y abundancia de la fauna acompañante del camarón en la costa. Universidad y Ciencia. 29 (1), 75–86.
Ward R. D., Zemlak T. S., Innes B. H., Last P. R., Hebert P. D. N. (2005). DNA Barcoding australia’s fish species. Philos. Trans. R. Soc B: Biol. Sci. 360 (1462), 1847–1857. doi: 10.1098/rstb.2005.1716
Yearsley J. M., Viard F., Broquet T. (2013). The effect of collective dispersal on the genetic structure of a subdivided population. Evolution 67 (6), 1649–1659. doi: 10.1111/evo.12111
Keywords: larval dispersal, collective dispersal, flatfish, bothidae, XIXIMI, GOMECC, larval pool, genetic homogeneity
Citation: Morales-Pulido JM, Munguia-Vega A, Jiménez-Rosenberg SPA, Rocha-Olivares A and Galindo-Sánchez CE (2023) Genetic connectivity in Twospot flounder (Bothus robinsi) across the Gulf of Mexico, inferred with single nucleotide polymorphisms from larvae and adults. Front. Mar. Sci. 10:1070483. doi: 10.3389/fmars.2023.1070483
Received: 14 October 2022; Accepted: 03 January 2023;
Published: 26 January 2023.
Edited by:
M. Leopoldina Aguirre-Macedo, Center for Research and Advanced Studies, MexicoReviewed by:
Henrique Queiroga, University of Aveiro, PortugalJesús Alejandro Zamora Briseño, Instituto de Ecología (INECOL), Mexico
Copyright © 2023 Morales-Pulido, Munguia-Vega, Jiménez-Rosenberg, Rocha-Olivares and Galindo-Sánchez. This is an open-access article distributed under the terms of the Creative Commons Attribution License (CC BY). The use, distribution or reproduction in other forums is permitted, provided the original author(s) and the copyright owner(s) are credited and that the original publication in this journal is cited, in accordance with accepted academic practice. No use, distribution or reproduction is permitted which does not comply with these terms.
*Correspondence: Adrian Munguia-Vega, YWlyZHJpYW5AYXJpem9uYS5lZHU=; Clara E. Galindo-Sánchez, Y2dhbGluZG9AY2ljZXNlLm14