 Chelsea N. Lopez
 Dennis A. Hansell
- 1National Aeronautics and Space Administration (NASA) Goddard Space Flight Center, Ocean Ecology Laboratory, Greenbelt, MD, United States
- 2Science Systems and Applications, Inc. (SSAI), Lanham, MD, United States
- 3Department of Ocean Sciences, Rosenstiel School of Marine, Atmospheric and Earth Science, University of Miami, Miami, FL, United States
Here we shed light on two mechanisms that stimulate deep particle export via upper-ocean iron fertilization in the Southern Ocean: deep frontal mixing and melting of sea ice. We present data collected a decade apart in the Pacific sector of the Southern Ocean when, serendipitously, seasonal Antarctic ice melt was anomalously low (2008) and anomalously high (2017). In 2008, the low ice melt year, we concluded that vertical mixing of iron into the euphotic zone via deep-mixing fronts was the primary stimulant of export that reached depths of ~1500 meters. This process was evidenced by localized enhancements of dissolved organic carbon (DOC) concentrations up to 4 µmol C kg-1 beneath seven branches of fronts embedded within the Antarctic Circumpolar Current (ACC). We used these enhanced DOC concentrations in the bathypelagic as primary indications of the depths and locations of recent export, as it is a logical residue of such. In 2017, the year in which sea ice melt was anomalously high, we concluded that the main driver of a widespread export event to the seafloor was the lateral influx of iron within the melt. Indications of this event included substantial enhancements of DOC concentrations (2 - 6 µmol C kg-1), elevated beam attenuation, and enhanced surface iron concentrations associated with a layer of low salinity water at a nearby station. Further, significant deficits of upper ocean silicic acid during the 2017 occupation indicated that deep export was likely stimulated by an iron-fueled diatom bloom. This analysis highlights the impact of iron supplied from frontal vertical mixing and sea ice melt on export and ultimately for long-term carbon sequestration in the Southern Ocean, as well as the utility of deep DOC enrichments as signatures of particle export. Understanding the impact that ice melt events have on carbon export is crucial given that anomalous events are occurring more often as our climate changes.
1 Introduction
DOC concentrations that are higher than background refractory DOC (~34 – 45 µmol C kg-1; region dependent) in the interior ocean can exist as a residue of modern carbon export (Noji et al., 1999; Hansell et al., 2012). Though it is commonly thought that these signatures are fleeting and do not extend to the bathypelagic (Hansell and Carlson, 2015), our recent work reveals that significant DOC enhancements can span the entirety of the water column as a result of major export events (Lopez et al., 2020; Lopez and Hansell, 2021). In the aforementioned studies, we utilized these anomalous DOC signatures to pinpoint locations in which uniquely deep export occurred, then employed ancillary sensor, bottle, and satellite data to assess the underlying mechanisms driving that export. Here, we expand that work to the Southern Ocean, where DOC similarly serves as a useful qualitative proxy for bathypelagic export.
The Southern Ocean is a high-nutrient-low-chlorophyll region, where nitrate is plentiful but primary production is controlled by the concentration of bioavailable iron (Timmermans et al., 1998). Iron is a mandatory co-factor for various biological enzymes, such as the nitrogen-fixation enzyme nitrogenase as well as nitrate reductase (Timmermans et al., 1994; Morel and Price, 2003). An iron-starved autotrophic community quickly consumes the nutrient in the euphotic zone and as such, concentrations are consistently depleted. Previous research in the Southern Ocean has demonstrated the strong response of autotrophs to episodic inputs of iron via marked increases of phytoplankton biomass and carbon export efficiency (Boyd et al., 2000; Arrieta et al., 2004; Blain et al., 2007; Boyd et al., 2007). Though the subarctic Pacific is similarly iron limited, this micronutrient is supplied via iron-rich Asian dust (Duce and Tindale, 1991) whereas iron is largely supplied to the Southern Ocean through vertical upwelling of deep water, melting of iron-rich Antarctic ice, and continental sediment exchange (de Baar et al., 1995; Tagliabue et al., 2014; Laufkötter et al., 2018; Sergi et al., 2020). However, these processes are fluctuating as global climate and environmental conditions change (Deppeler and Davidson, 2017), thus a solid understanding of their impact on the biological pump is advantageous for future development of mitigation strategies.
Antarctic ice retains iron that is embedded through exchange with sediment and surface dust accumulation and is thus a major intermediary for iron supply to the Southern Ocean. Melt from both sea ice and continental ice impact the region, though the latter is largely confined to coastal zones and transported beneath the mixed layer and thus must be vertically upwelled to support autotrophs (Person et al., 2021). Both forms of ice melt can supply a considerable amount of bioavailable iron to surrounding waters, enhancing autotrophic carbon production and its subsequent export (Lannuzel et al., 2011; Lannuzel et al., 2016; Laufkötter et al., 2018). Discrete measurements have revealed high concentrations of bioavailable iron within ice, reaching levels up to 17.4 nM (Wang et al., 2014; Lannuzel et al., 2016), which is substantially higher than concentrations of only ~0.1 to 1 nmol kg-1 reported in the subsurface Southern Ocean (de Baar et al., 1995; Sieber et al., 2021). The flux of iron sourced from ice melt into surrounding surface waters is estimated to be as high as 200 nmol m-2 d-1 in some regions (Lannuzel et al., 2016) and that ice-associated iron influx can locally increase carbon production and export up to 30 and 42%, respectively (Person et al., 2019). Production and export enhancements are likely even higher during extreme ice melt events that are becoming more common in the last decade (Fetterer et al., 2017). As such, temporal variability of ice melt dynamics is certainly impacting local biological community structure, carbon production, and export dynamics (Peck et al., 2010; Freeman et al., 2018; Moore et al., 2018), thus these impacts should be better quantified to predict future changes.
Fronts are another key source of iron supply for autotrophs because they locally enhance upward nutrient flux into the euphotic zone, thereby stimulating carbon production and deep particle export (Guidi et al., 2012; Ohman et al., 2012; Lopez and Hansell, 2021). We previously linked enhancements of bathypelagic DOC concentrations to overlying fronts in the North Pacific (30-45°N), concluding deep export to be stimulated by nitrate injection into the euphotic zone (Lopez and Hansell, 2021). The Southern Ocean similarly hosts strong fronts within the turbulent Antarctic Circumpolar Current (ACC) that are known to stimulate vertical nutrient mixing (Sokolov and Rintoul, 2007), therefore we evaluate here the impact of these fronts on export during 2008 and 2017, again using DOC as a proxy.
Though much is being learned of the Southern Ocean through major projects such as SOCCOM (Southern Ocean Carbon and Climate Observations and Modeling) and GEOTRACES, here we demonstrate the value of using DOC signatures to shed light on processes that stimulate deep export. We explored data along a transect at 103°W in 2008 and 2017, of which the DOC distributions differed substantially. Given such dichotomy, we centered our efforts on exploring the following questions:
(1) What is the relative importance of front-derived upwelling versus sea ice melt for supplying iron that stimulates deep, DOC-releasing export beneath the ACC?
(2) Did the relative influences of these two mechanisms result in the differences in the degree of export observed in 2008 and 2017?
By studying these controls on deep export, we can better understand the role of fronts within the ACC and large-scale ice melting in modulating carbon sequestration within the deep waters of the Pacific sector of the Southern Ocean.
2 Materials and methods
Our analysis targeted the waters along transect P18 (30-62°S, 103°W) of the U.S. Global Ocean Ship-Based Hydrographic Investigations Program (GO-SHIP; Figure 1) in austral summer of both 2008 and 2017 using a variety of open-source shipboard, sensor, and satellite data (See Data Availability).
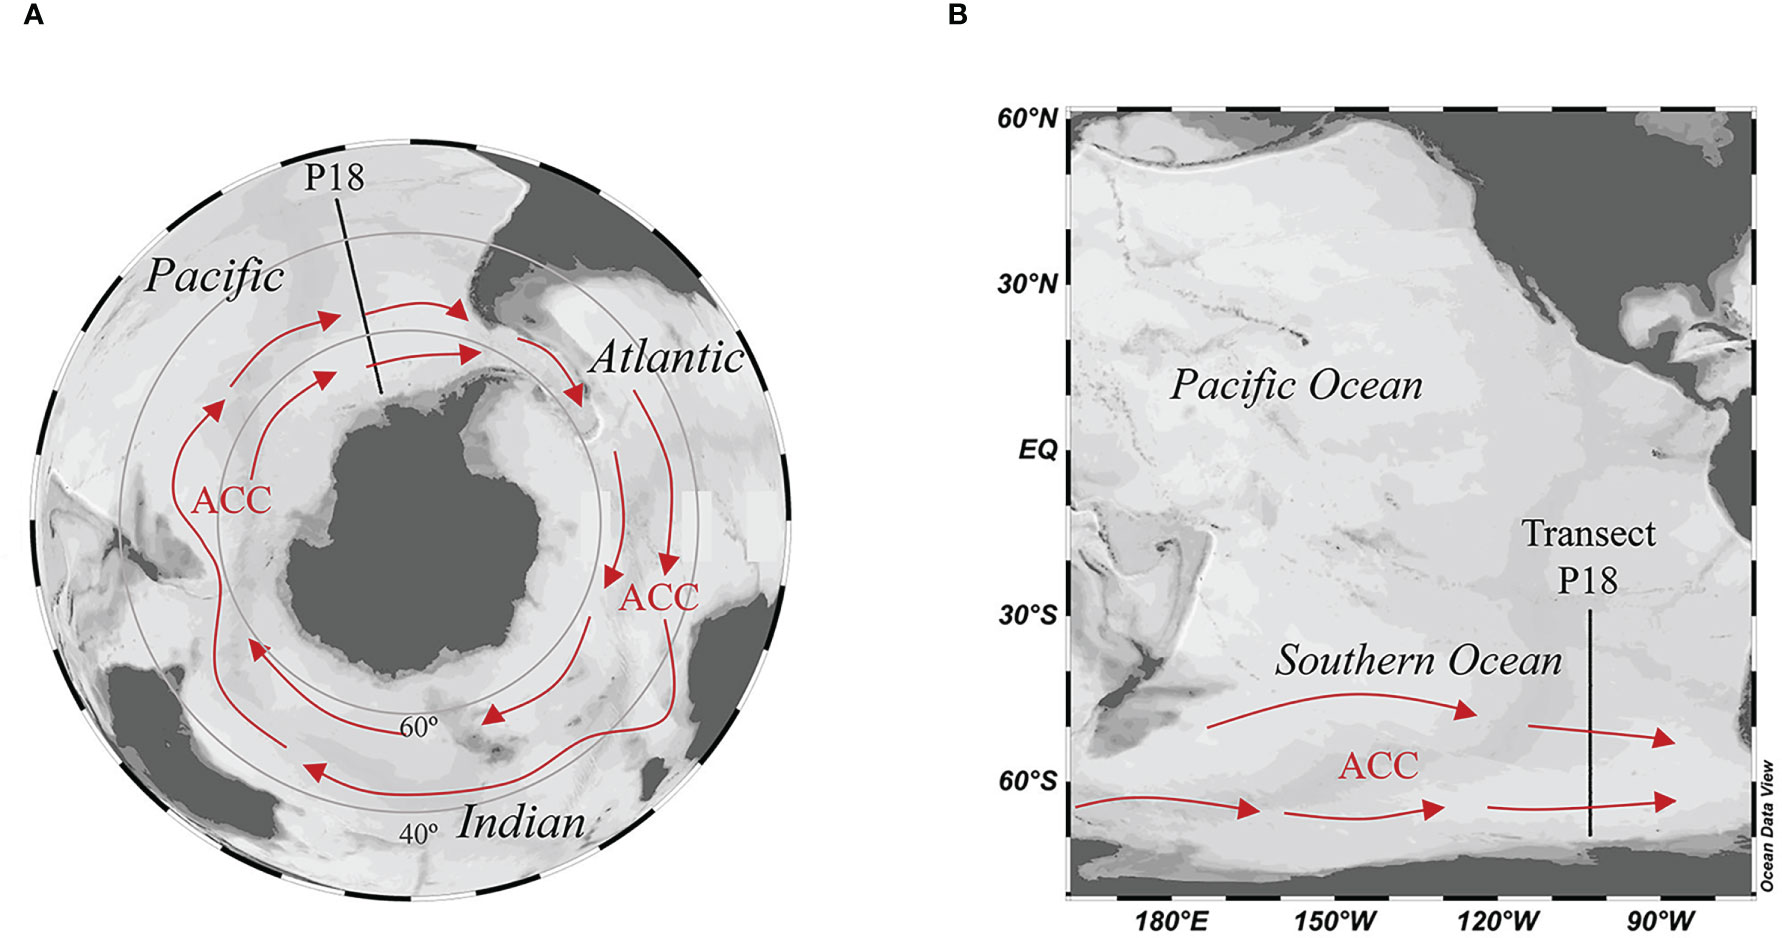
Figure 1 (A) Orthographic and (B) standard views of the Southern Ocean and its bathymetry. Location of the GO-SHIP transect P18 is shown. ACC circulation is depicted with red arrows. Maps were developed using Ocean Data View (Schlitzer, 2021) and not intended to be geographically exact.
Discrete DOC samples for depths >500 m for each of the P18 cruises were analyzed for statistical significance. The distribution of DOC concentrations in the bathypelagic were then compared to locations of distinct fronts within the ACC (Figure 2 and Table 1). The location of the fronts in each year was determined by abrupt changes in salinity from Argo float salinity profiles (Argo, 2021; Figures 2A, B) and with reference to previous characterizations of the area (Sokolov and Rintoul, 2002). Float profiles were present within 500 km of the transect latitude and within 30 days of the occupation. A total of 265 and 665 Argo float profiles in 2008 and 2017 were analyzed, respectively.
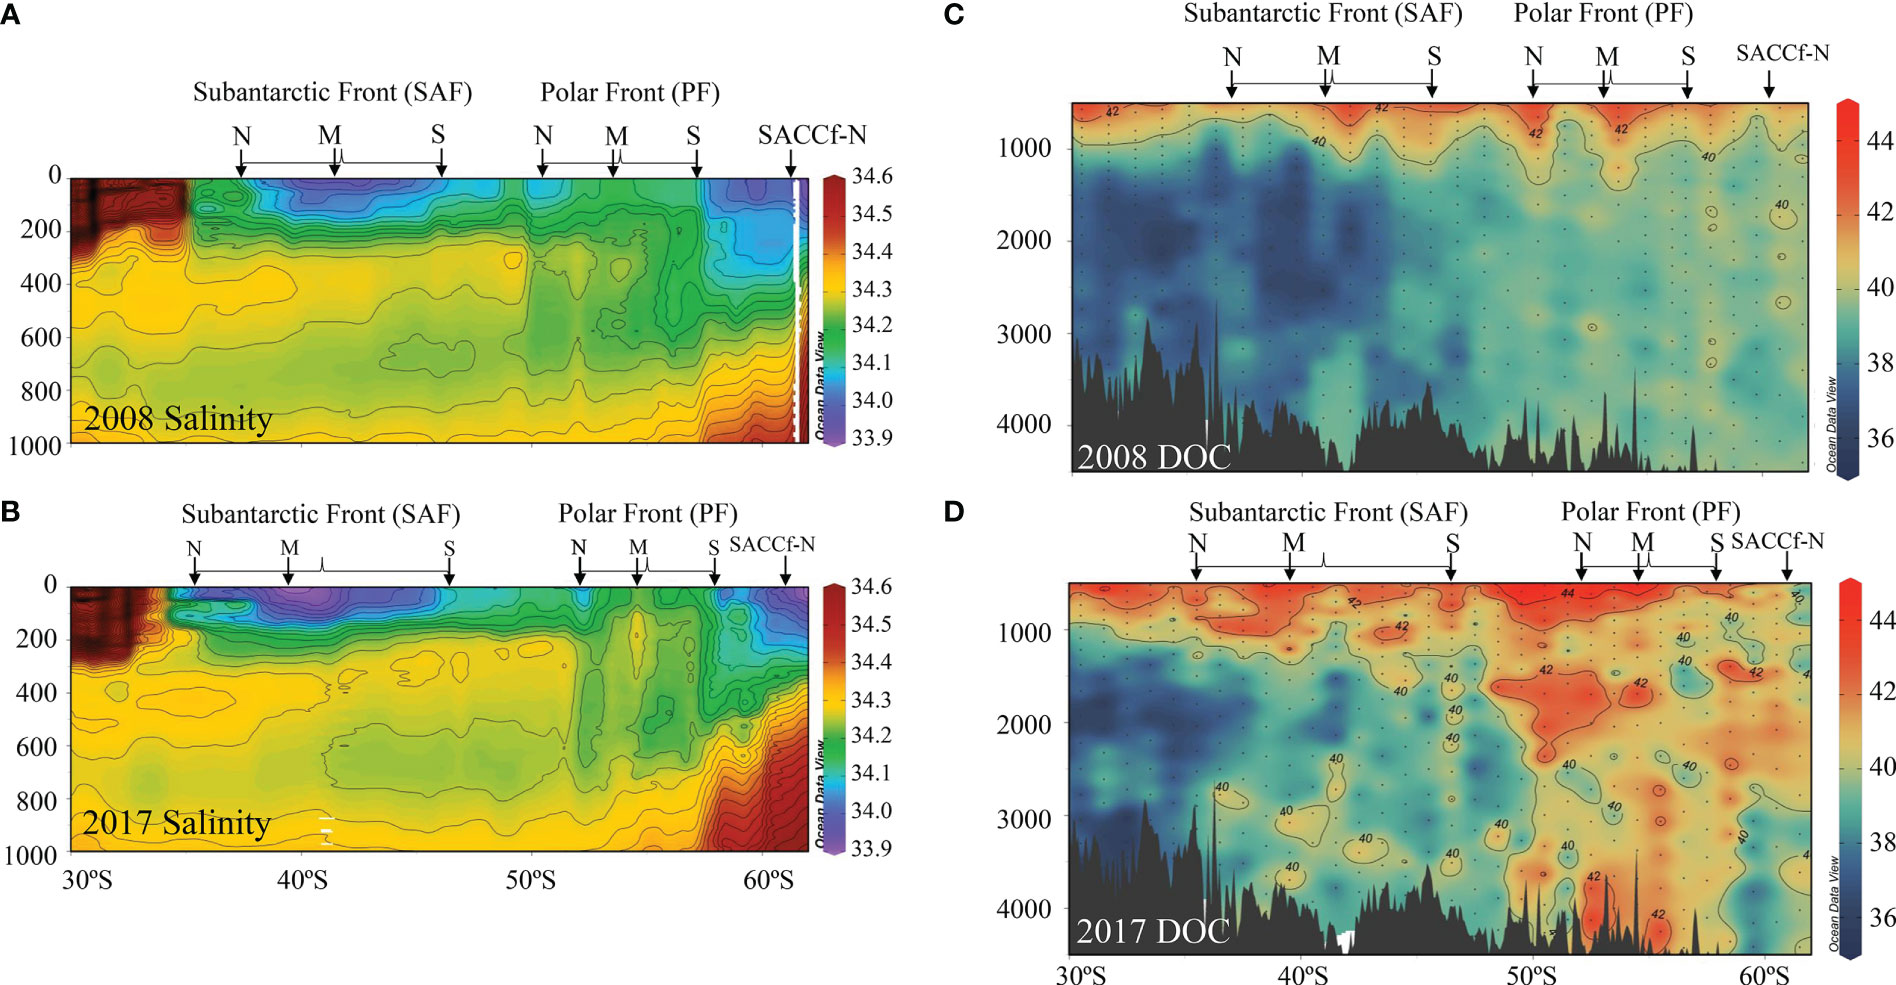
Figure 2 Upper ocean salinity distributions in (A) January 2008 and (B) January 2017 at 100°W ± 5° between 30-62°S that identify the latitudes of the north (N), mid (M), and southern (S) branches of the Subantarctic Front (SAF) and the Polar Front (PF). The location of the northern branch of the Southern Antarctic Circumpolar Current Front is also identified. Profiles were obtained from 265 and 665 Argo float profiles, respectively (Argo, 2021). Contours for isohalines are in 0.025 increments. DOC concentrations [µmol C kg-1] in (C) January 2008 and (D) January 2017 along transect P18.
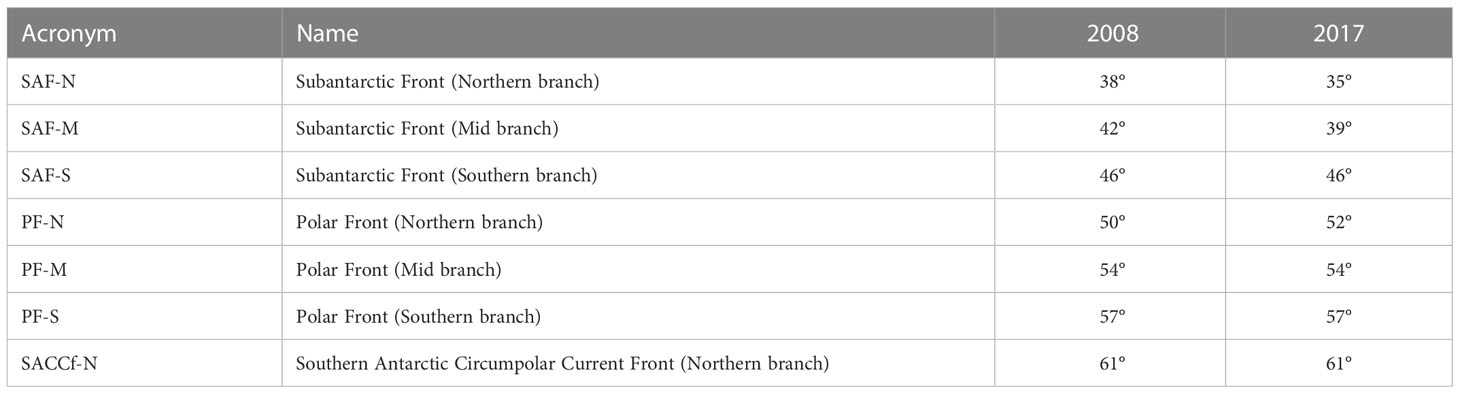
Table 1 Acronyms and approximate latitudes of the Polar Front (PF) and Subantarctic Front (SAF), their respective branches, and the Southern Antarctic Circumpolar Current Front (SACCf-N).
Mixing dynamics within the Polar Front (PF) were assessed by comparing monthly mixed layer depths between January 2007 to January 2008 and January 2016 to January 2017. Temperature and salinity data from Argo float profiles present within 500 km of the transect longitude (103°W) and between 50-60°S were used to calculate mixed layer depth, defined as the first depth at which potential density exceeded surface density by 0.125 kg m-3 (Monterey and Levitus, 1997).
Discrete upper-ocean iron measurements from the GEOTRACES GSci01 Antarctic Circumnavigation Expedition (Walton and Thomas, 2018), collected nearly contemporaneously with the P18 occupation in January 2017, were used in conjunction with salinity profiles to determine associations between iron concentrations and freshwater input via ice melt.
Ice area data from the National Snow and Ice Data Center (NSIDC; Fetterer et al., 2017) were then analyzed to investigate ice melt conditions during each year. Anomalies were identified by the difference in month-by-month sea ice area from the climatological mean in the 1978 – 2021 record.
Finally, bottle silicic acid concentrations normalized to salinity 35 between the two P18 cruises were analyzed to determine differences in upper-ocean nutrient uptake between 2008 and 2017 occupations.
3 Antarctic Circumpolar Current: Hydrographic context
The area of interest stretches from the subtropical gyre of the South Pacific to the high latitudes of the Southern Ocean (Figure 1), with the latter notoriously hosting the most turbulent waters in the global ocean (Smith et al., 2013). Turbulence arises from extreme westerly winds between 40-70°S, aptly referred to as the “Roaring 40’s”, “Furious 50’s”, and “Screaming 60’s”. These winds give rise to the strongest oceanic current; the Antarctic Circumpolar Current (ACC; Smith et al., 2013). Several fronts are embedded within the ACC that differ in strength, location, and mixing depth (Gille, 1994; Sokolov and Rintoul, 2009). Our focus was on the dynamics of the north, middle, and south branches of the Polar Front (PF; ~50-55°N) and the Subantarctic Front (SAF, ~38-45°), as well as the northern branch of the Southern Antarctic Circumpolar Current Front (SACCf-N). The naming conventions and approximate latitudes for each frontal branch are listed in Table 1. The northern boundary of the Polar Front (PF-N) is the location of the Antarctic Convergence (Verlencar et al., 1990), where water begins to subduct to form Antarctic Intermediate Water (AAIW). Overturning water circulation of the major water masses in this region is depicted in Figure S1 in Supplementary Material.
4 Observations: Dissolved organic carbon distributions
We were initially intrigued by this region due to the differences in the deep DOC concentrations between the 2008 and 2017 occupations of P18 (Figures 2C, D). A Mann-Whitney U test for DOC concentrations at depths >500 meters indicated a statistical significance between the two distributions (p = 2.2 x 10⁻¹⁶). We report two main observations from these distributions; first, that the 2008 distribution contained narrow, vertically aligned features of elevated DOC concentrations (enhanced by 2-4 µmol C kg-1 from neighboring stations at the same depths) in the mesopelagic/upper bathypelagic (<1500 m) at seven latitudes (~37°, 42°, 45°, 50°, 54°, 58°, and 61°S; Figure 2C). Secondly, DOC concentrations in 2017 were commonly 2-6 µmol C kg-1 higher than background throughout the deep bathypelagic at latitudes >50°S (Figure 2D). The enhancements were higher than uncertainty of DOC measurement, which is ±1.5 µmol C kg-1.
5 Discussion
5.1 Influence of iron injection via turbulent frontal mixing on deep export
In 2008, export down to ~1500 m appeared to be induced by vertical nutrient injection at the fronts, as indicated by spatially narrow enhancements of DOC concentrations largely confined to frontal locations (Figures 2C, D, 3A). Physical subduction as an alternative input of DOC is not considered viable since winter mixing does not reach the depths to which the DOC enhancements extend (~1500 m; see discussion on winter mixed layer depths associated with Figure 4 below). In 2017, there appeared to be a modest correlation between mesopelagic/upper bathypelagic DOC enhancements and the locations of the fronts that also suggested front-associated export, but those enhancements were mainly overshadowed by ubiquitous DOC enrichment at latitudes >50°S. As an optical measure of particle abundance, enhancements in beam attenuation beneath the PF also provided evidence of deep export in 2017 (Supplementary Material S2). To create such dichotomy between export, we questioned whether the mixing depths in the PF years differed substantially between the years.
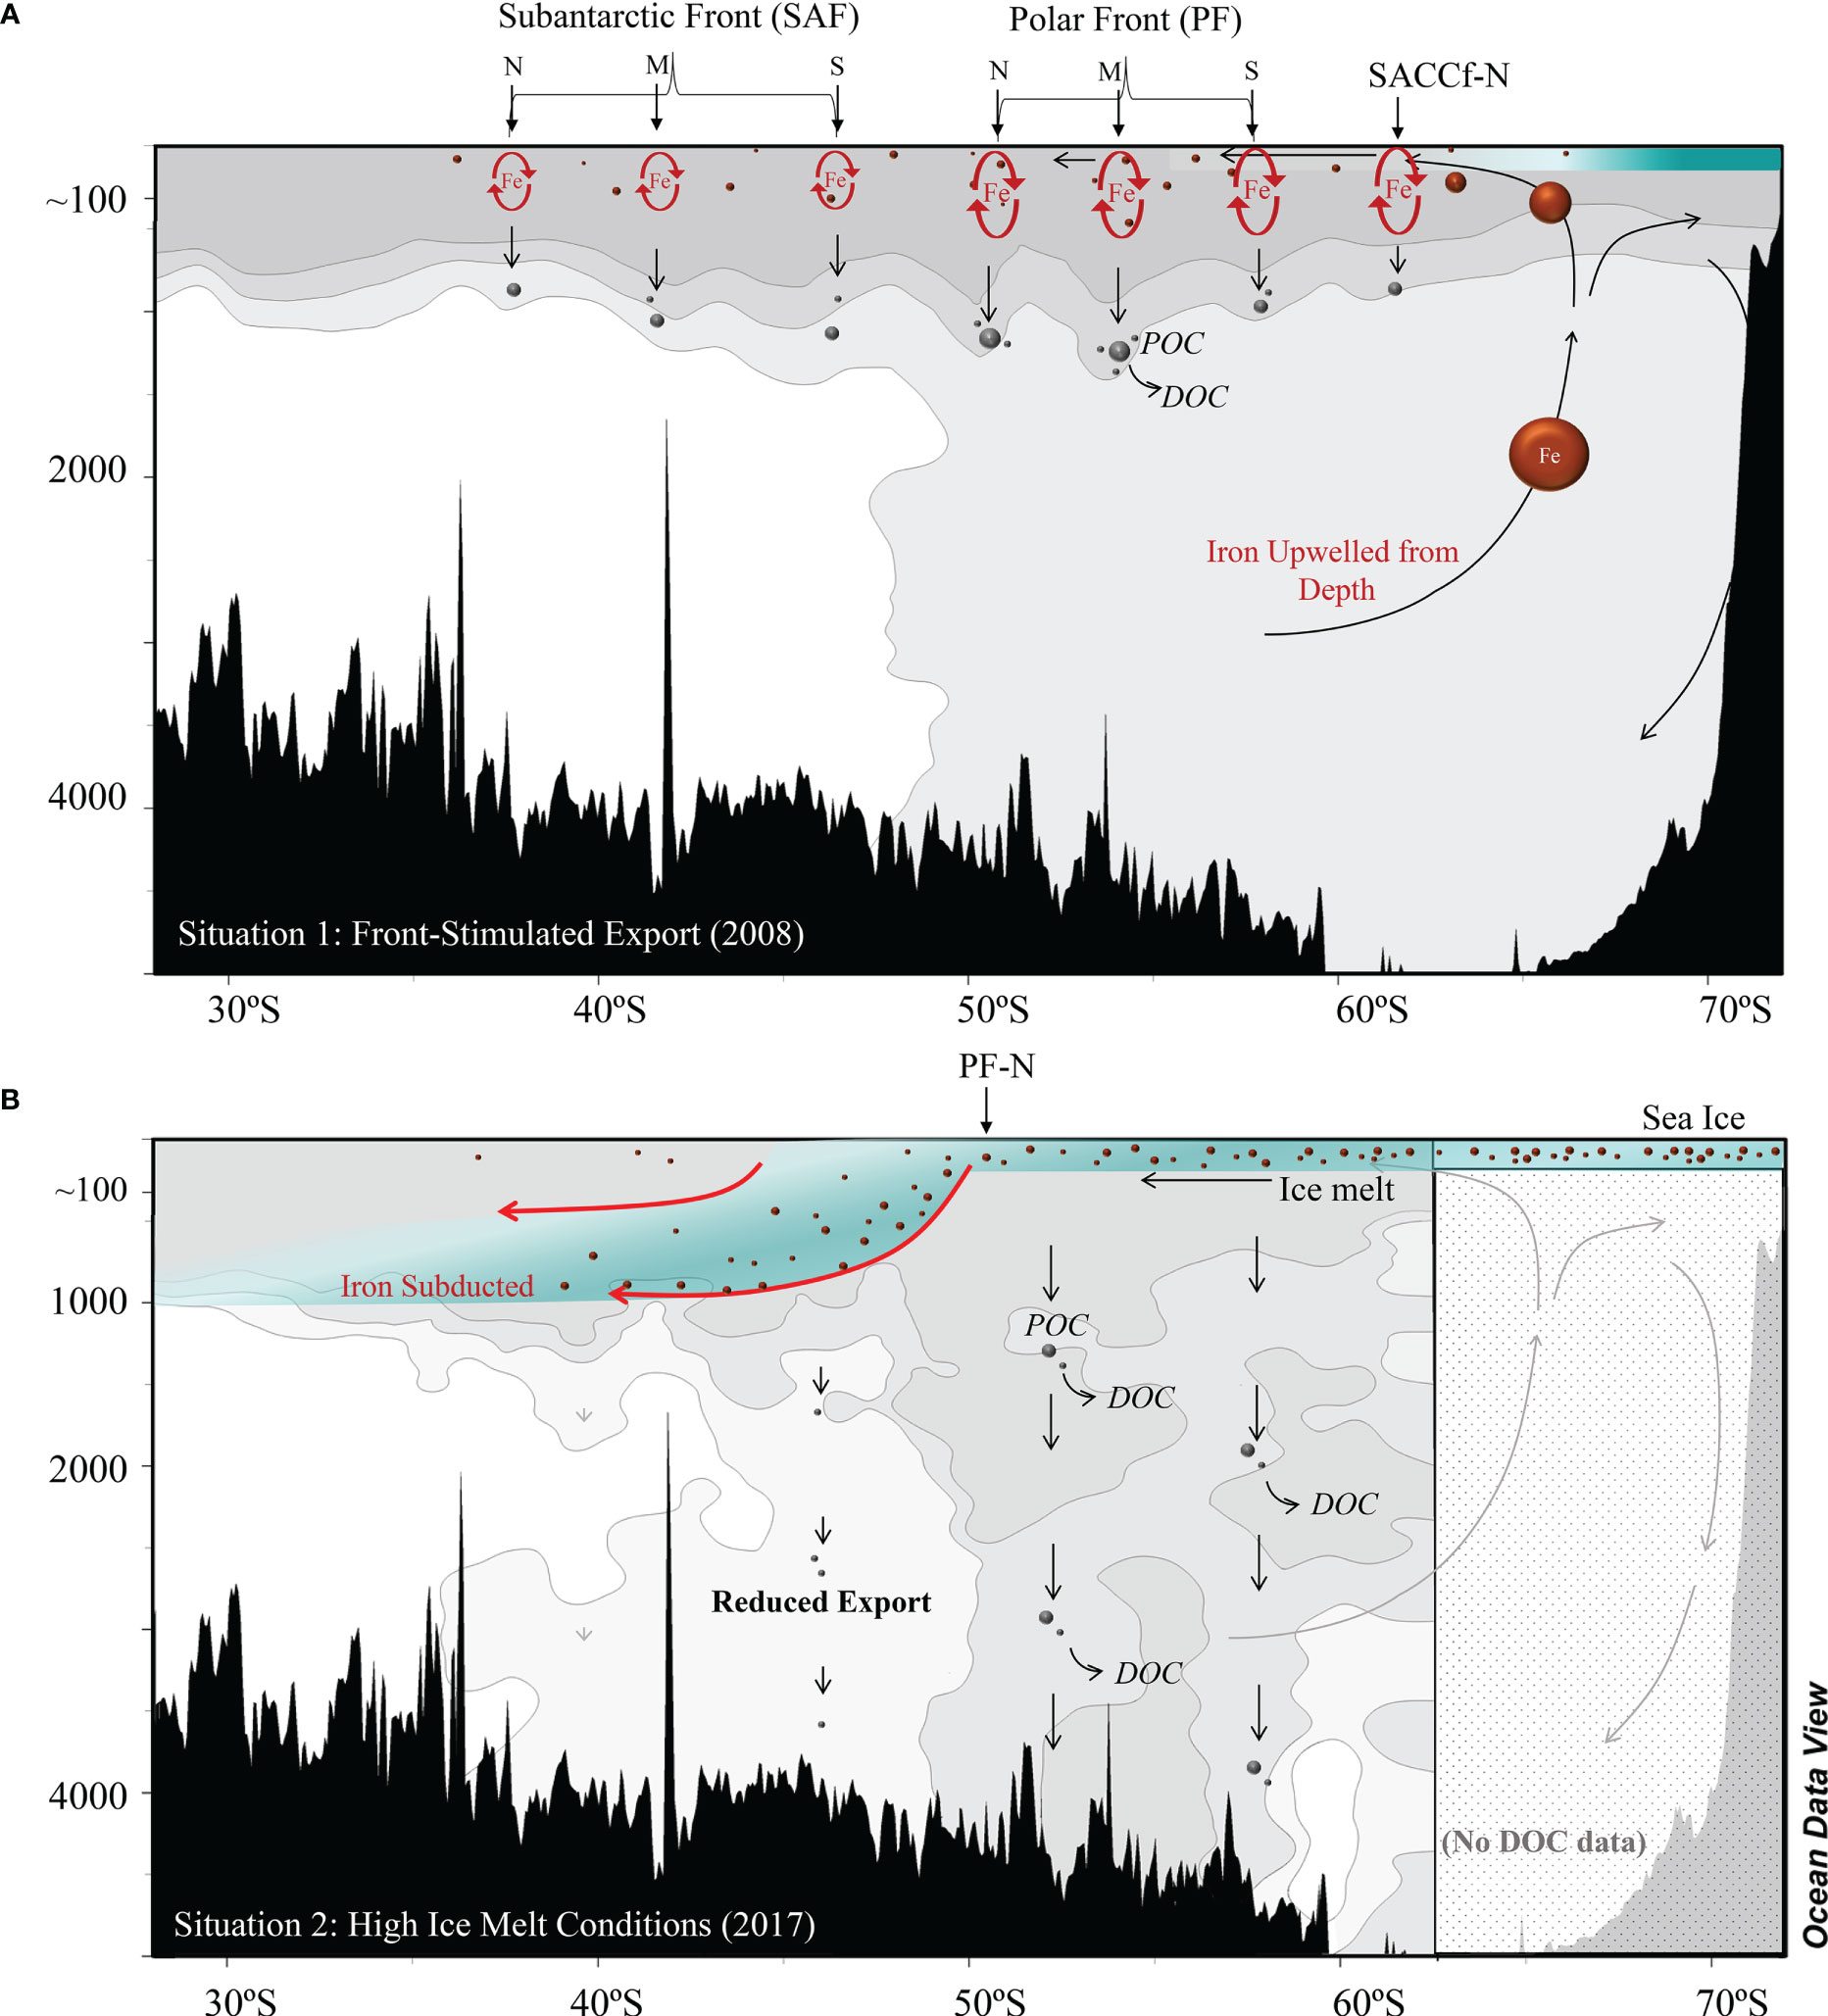
Figure 3 (A) Mechanism stimulating front-associated export overlayed on 2008 DOC distribution (grayscale; higher concentrations are deeper gray). Dissolved iron (depicted as red spheres) is upwelled from depth at high latitudes, renewing the upper ocean, and subsequently flows northward within the Ekman Layer. Vertical mixing at the fronts cycle iron to the surface ocean, enhancing production and subsequent particle export (gray spheres) to the upper bathypelagic. Exported particles release DOC upon descent, resulting in narrow features of enhanced DOC concentrations beneath the fronts. (B) Mechanism stimulating ice-associated export overlayed on 2017 DOC distribution (gray shaded area). As sea ice melts, its associated iron (depicted as red spheres) is transported northward, supplying the euphotic zone with elevated concentrations of bioavailable iron that stimulates production. As a result, widespread particle export ensues (gray spheres), releasing DOC to the water column upon descent to the deep bathypelagic. At the PF-N, meltwater subducts, sinking iron out of the euphotic zone and stunting equatorward production. Ice melt can also be imported laterally with the flow of the ACC. Upper-ocean depths are not to scale. Circulation derived from Carter et al., 2022 and Hansell and Carlson, 2015.
Figure 4 Modeled mixed layer depths from Monterey and Levitus, 1997. Mixed layer depths are calculated as the first depth in which potential density exceeds 0.125 kg m-3 of the surface density. The embedded red boxes indicate the approximate latitudes in which the widespread export event of 2017 had occurred.
In austral winter (June – November), the MLD within the PF typically reaches extraordinary depths estimated down to ~700 m followed by abrupt springtime shallowing (Figures 4, 5A; Dong et al., 2008). Phytoplankton blooms peak in December (Moore and Abbott, 2000), when MLDs shoal to ~100 m or less. Northward of the PF, the SAF hosts shallower winter MLDs that reach a maximum of only ~200 meters and is thus less capable of mixing iron into the euphotic zone from deeper depths. We focused on the mixed layer of the PF, where export was enhanced in 2017, and found evidence that differences in MLDs during winters preceding shipboard observations between occupations likely did not contribute to the dichotomy in apparent export (Figure 5). We initially postulated that the MLDs in 2016 would be deeper than 2007, logically resulting in enhanced vertical upwelling of iron and a higher degree of production/export, but instead winter MLDs in 2016 were generally ~100 m shallower. Alternatively, deep winter mixing in Antarctic waters has been argued to result in lower levels of biomass due to reduced ability for accumulation once adequate light levels become available (Hague and Vichi, 2018). The MLD data also provided evidence against this notion. Light becomes sufficient to support autotrophy in this region in November (Arrigo et al., 1997; Thomalla et al., 2011), but MLDs were nearly 200 meters deeper during November 2016 compared to 2007 (mean depth of 420 m versus 250 m, respectively). If biomass accumulation was stunted by deeper MLDs during light onset, we would have found the MLD in November 2007 (the less productive year) to be deeper than 2016; however, the opposite was evident. Further, the deep MLD of 420 m in 2017 would mix phytoplankton further out of the euphotic zone than in 2007, also stunting growth. As such, it appeared that differences in the relative MLDs did not directly influence the degree of bathypelagic export during the two years of interest.
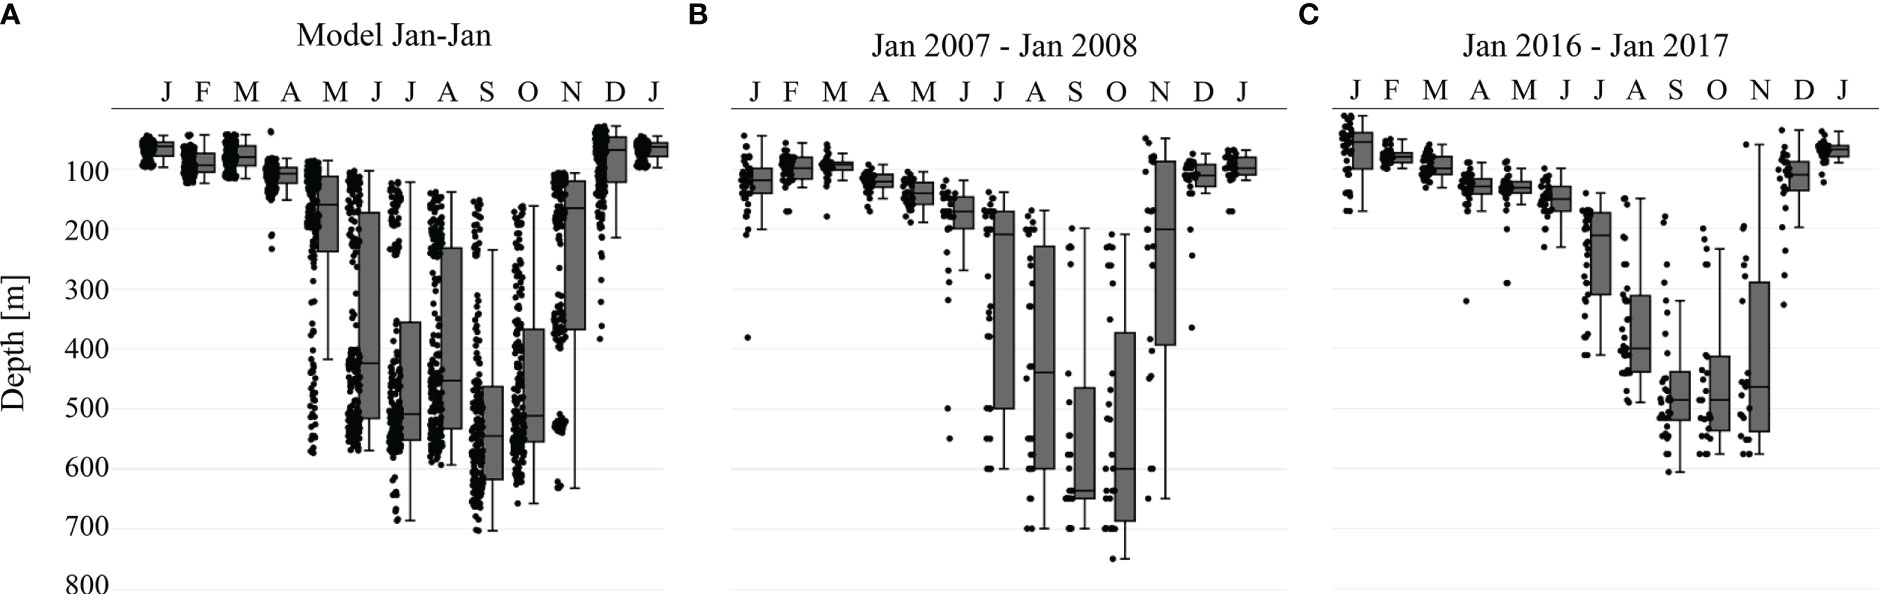
Figure 5 Boxplot of mixed layer depths from (A) Monterey and Levitus, 1997 database, (B) January 2007 to January 2008 calculated from Argo data, and (C) January 2016 to January 2017 calculated from Argo data. The position of the points on x-axis is trivial within each month.
5.2 Export stimulated by iron sourced from sea ice melt
5.2.1 Surface iron concentrations in 2017
Elevated upper ocean (15 m) iron concentration at a station sampled nearby (69°S, 100°W, 0.184 nmol kg-1, Figure 6) on GEOTRACES ACE (Antarctic Circumpolar Expedition) was associated with a layer of freshwater, supporting the notion that the widespread export event was fueled by ice-associated iron influx, rather than vertical upwelling at fronts. Iron concentration at the nearby station was the highest measured at this depth of all stations sampled around the continent during the GEOTRACES expedition, which otherwise ranged from 0.010-0.150 nmol kg-1. Average summer surface salinity is lowest in our region of interest, indicating high input of ice melt in comparison to stations in other sectors of the Southern Ocean. The vertical profile of dissolved iron concentrations at this station was uniquely high at 15 meters yet drastically declined deeper in the euphotic zone, increasing again below 150 meters (Figure 6B, red line). This station was the only one that exhibited enhanced surface (15 m) iron concentration relative to the entire mixed layer. We would expect the entire mixed layer to be enriched in iron had it been sourced from below via nutrient injection, rather than enhancement at the surface. These data indicated the presence of iron sourced laterally via sea ice melt, which likely stimulated the major export event observed in 2017. Unfortunately, nearby data during 2007/2008 were not collected for comparison.
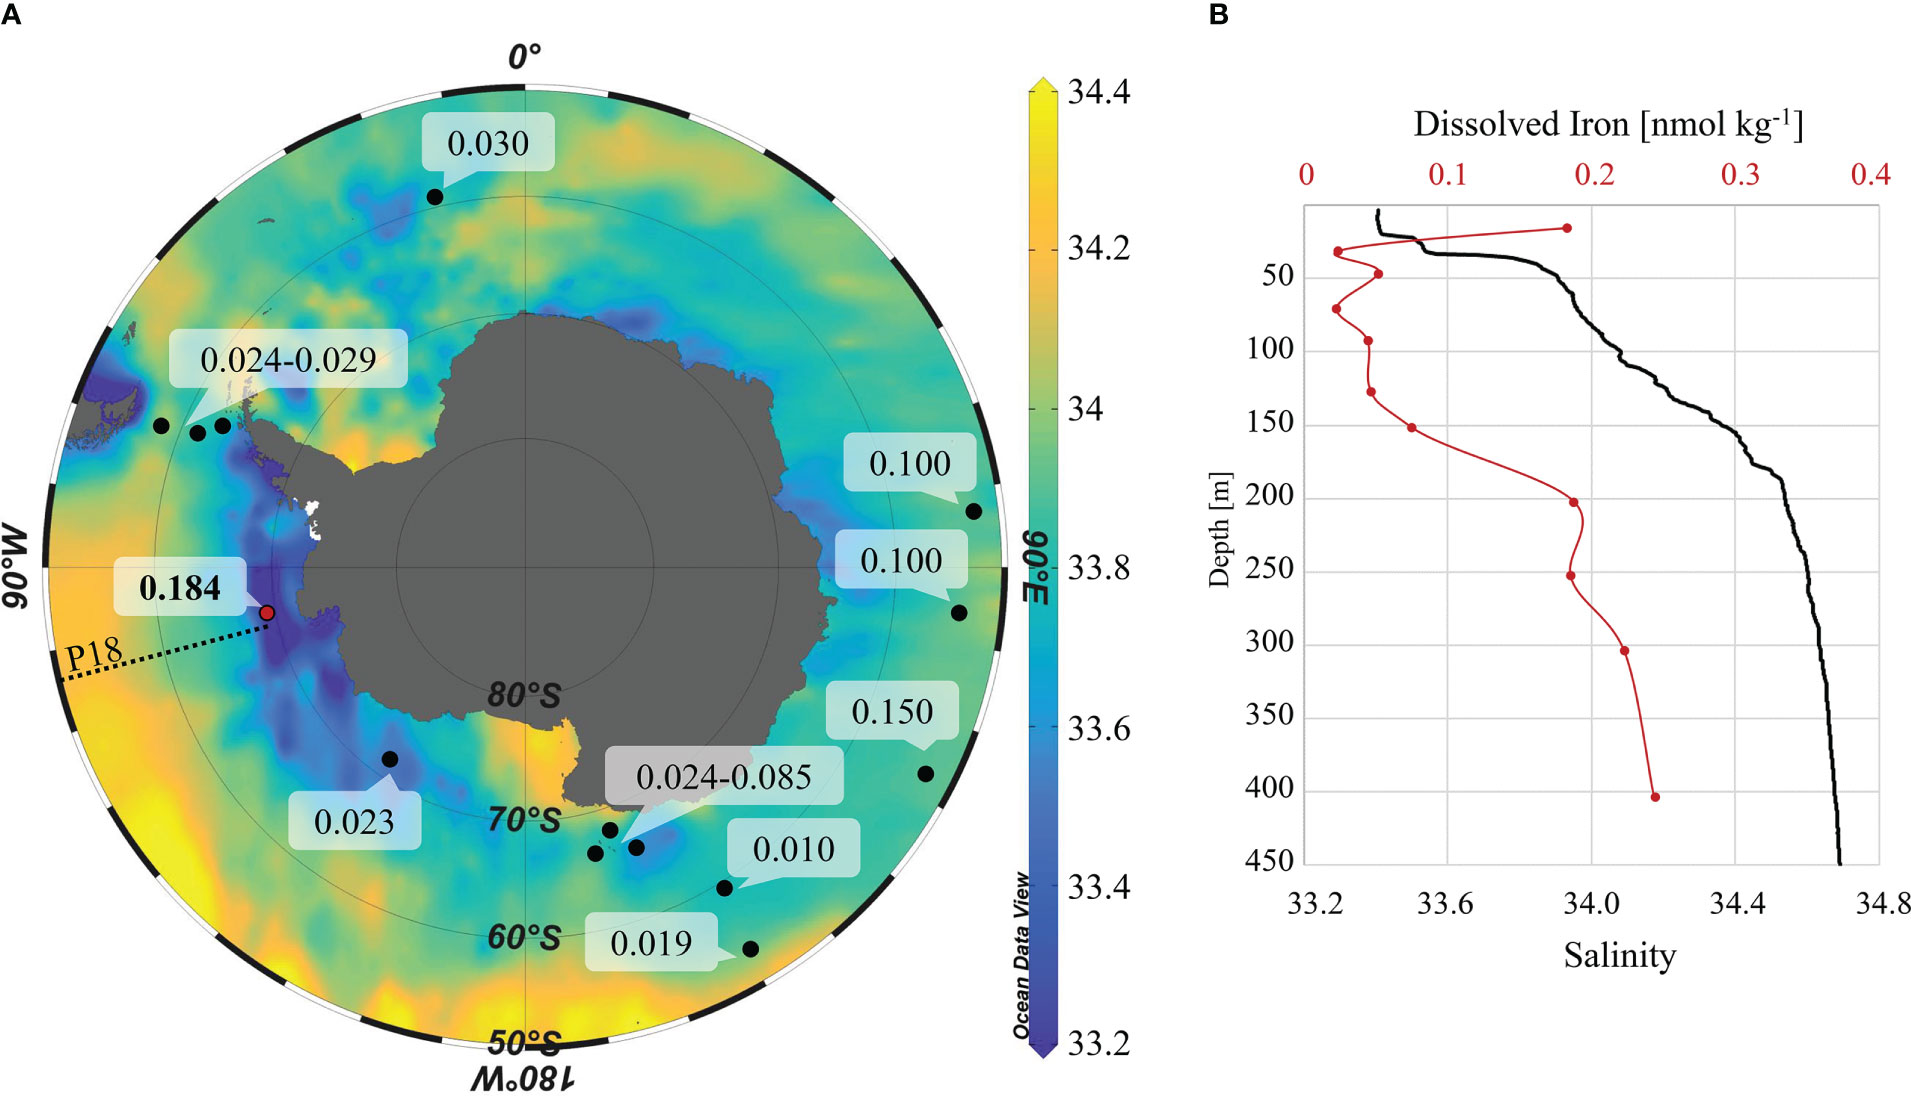
Figure 6 (A) Dissolved iron [nmol kg-1] concentrations at 15 meters from GEOTRACES cruise GSci01 (Walton and Thomas, 2018) occupied between 20/12/2016 to 19/01/2017 (black dots and white call boxes) overlayed on surface salinity data (<5 m) from 10,361 stations sampled between December 1st and March 1st (austral summer). Salinity data were compiled from GLODAP, PACIFICA, and Southern Ocean Atlas Databases (Webb, 1994; Suzuki et al., 2013; Key, 2015; Olsen et al., 2016). (B) Dissolved iron concentration profile from station 68 (69°S, 100°W; red line) on cruise GSci01 and CTD salinity data from 2017 P18 (69°S, 103°W; black line). GSci01 salinity data are not displayed, as measurements above 15 m were not available.
5.2.2 The 2016 ice retreat event
Though we found evidence of enhanced iron concentrations associated with ice melt near the region of interest in 2017, we aimed to discern whether the relative amount of ice-sourced iron was a factor contributing to the stark differences in the degree of export in 2008 and 2017. Meehl et al., 2019 identified significant anomalies in atmospheric and oceanic conditions during late 2016/early 2017, particularly that seasonal Antarctic ice extent retreat occurred 46% faster and about a month earlier than usual (Fetterer et al., 2017; Turner et al., 2017; Meehl et al., 2019). The authors suggested the event to be influenced by anomalous northward migration of the westerlies resulting in dramatically weaker winds near the 60-65°S belt (Meehl et al., 2019) and strong northward Ekman layer flow (Schlosser et al., 2017) that ultimately carries melt water and entrained iron into the ACC, potentially enhancing deep export.
Satellite-derived ice data revealed substantial differences in sea ice area between the years of interest (Fetterer et al., 2017), an indication that ice melt likely resulted in enhanced bathypelagic export observed in 2017. Ice area in December and January of the 2016/2017 occupation were an astonishing 3.0 million km2 and 1.6 million km2 less than 2007/2008, respectively (Figure 7), indicating that a high degree of ice melt was transported to the surface ocean in the latter occupation. November and December are crucial months for this region because light levels become sufficient around November while adequate stratification in the euphotic zone occurs in December, both of which are conditions required for biomass accumulation and subsequent export. However, the differences in total sea ice area do not directly determine the total degree of ice melt. Analysis of monthly accumulation and depletion of ice area in each year revealed that the total decline from maximum ice accumulation by December in 2016 was substantially higher; -8.47 million km2 in comparison to only -7.75 on average (Table 2 and Figure 8). The extensive degree of ice melt present in 2016 would logically supply the region with iron, ultimately enhancing production and stimulating the widespread export event evident in 2017 (Figure 3B). Peculiarly, ice area decline by December 2007 was considerably less than the climatological mean, at only -5.65 million km2, which revealed that iron flux from melting sea ice was unusually low (Figure 8). As such, we found that the degree of sea ice melt during both years in this study was anomalous and we suggest that the differences in export are explained by the degree of ice melt supplied to the ACC (Figure 8B). This conclusion is further supported by the fact that deep DOC enhancements were largely limited to latitudes south of the location in which upper ocean waters subduct to form the AAIW (Verlencar et al., 1990; Talley, 2013). Subduction of these waters sinks the associated iron out of the euphotic zone, logically stunting equatorward production.
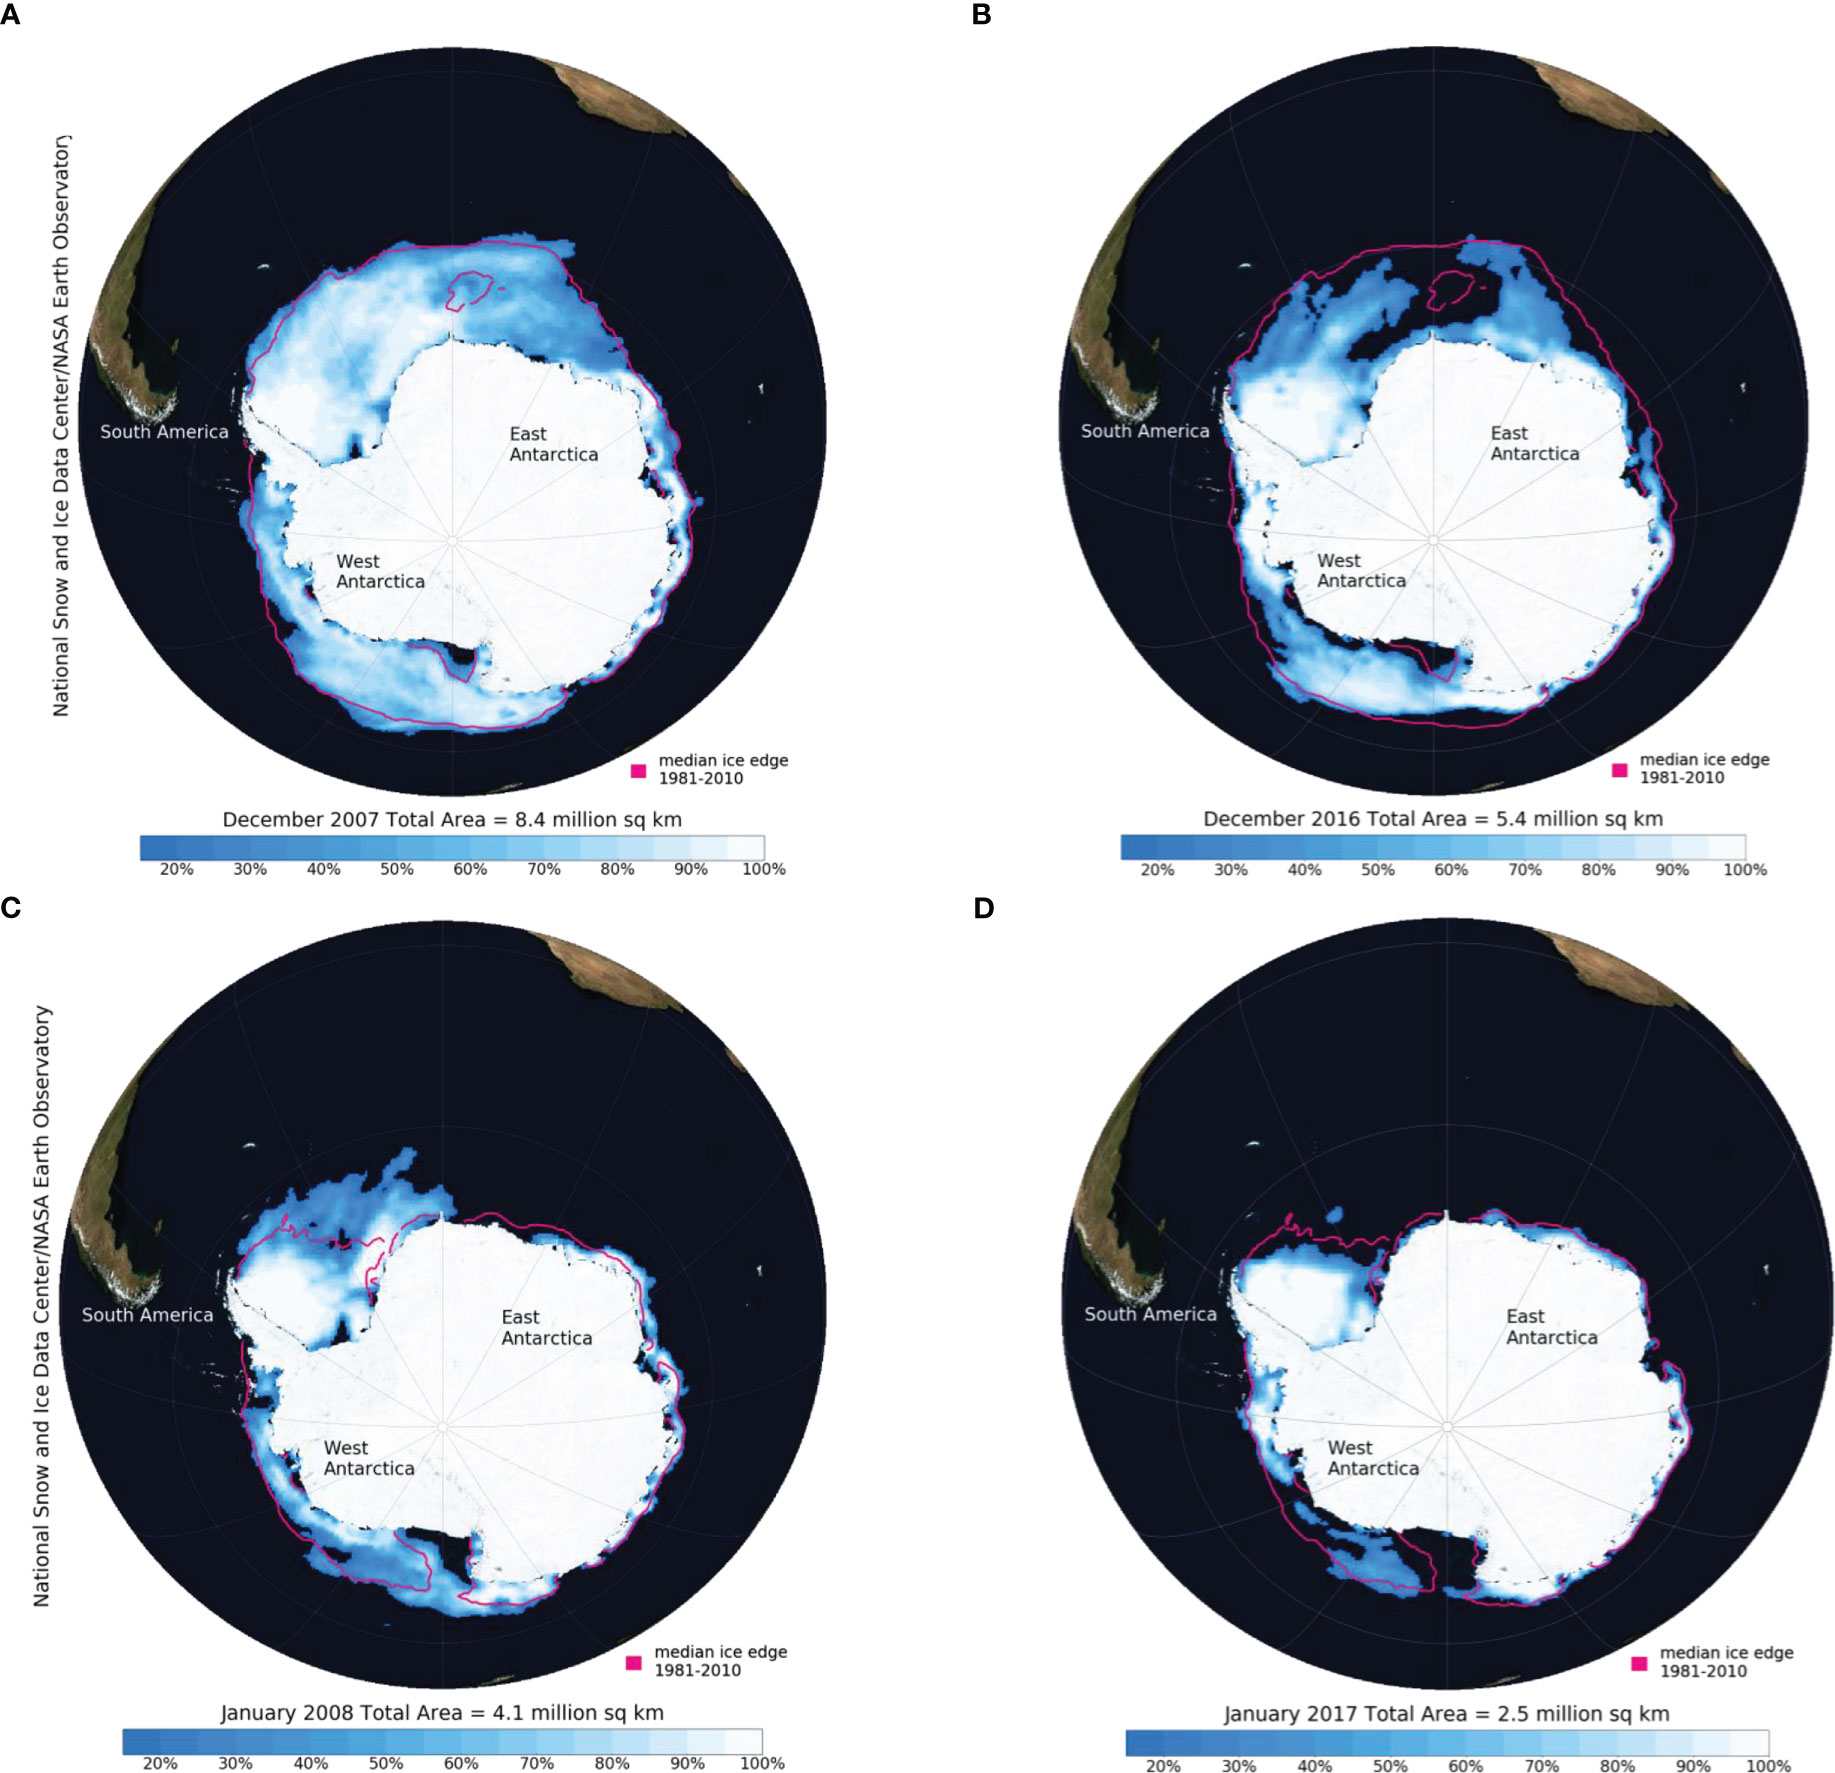
Figure 7 Sea ice area maps in (A) December 2007, (B) December 2016, (C) January 2008, and (D) January 2017. Percentages indicate ice concentration. Image courtesy of the National Snow and Ice Data Center, University of Colorado, Boulder.
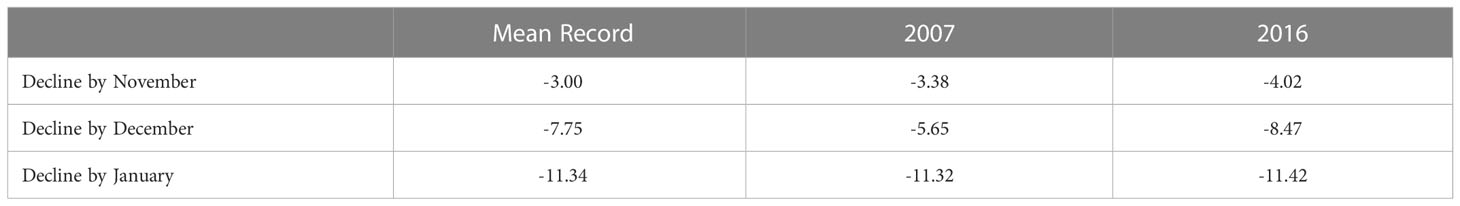
Table 2 Total ice area declines from maximum winter ice accumulation (million km2).
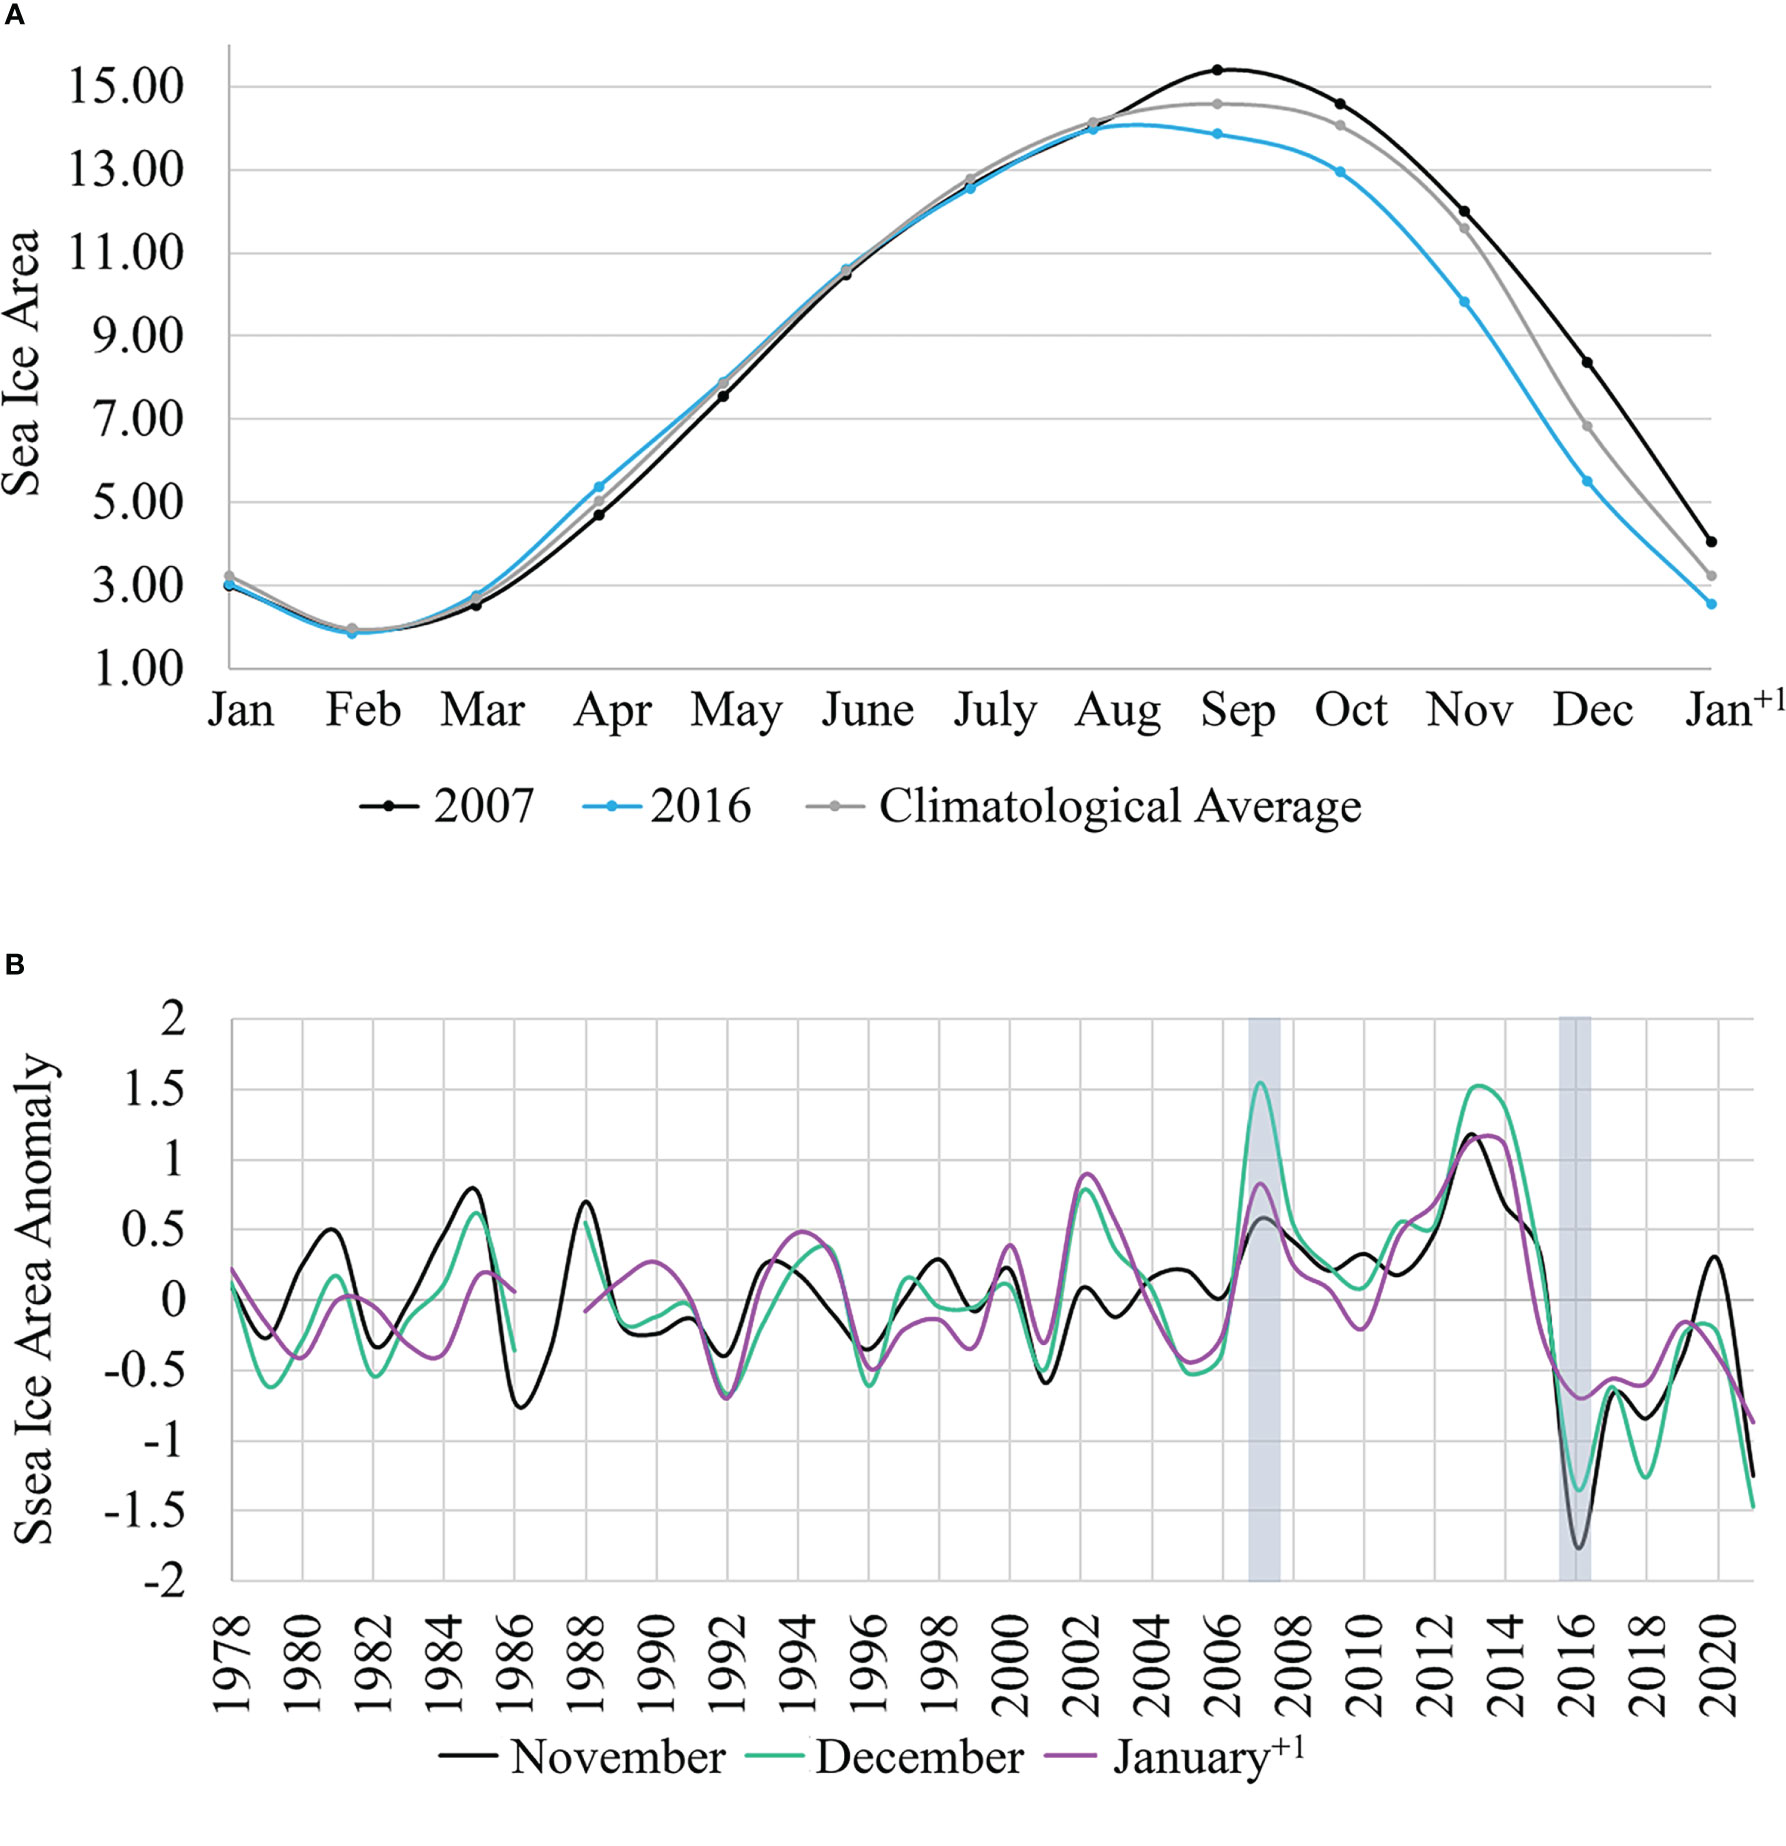
Figure 8 (A) Monthly sea ice area [million km2] from 2007, 2016 and on average from the 1979 – 2021 record. (B) Sea ice area anomaly (million km2) from the mean ice area record in November, December, and proceeding January (austral summer). The winters of interest (2007 and 2016) are shaded gray.
5.3 Evidence of an iron-fueled diatom bloom
A considerable deficit of silicic acid in the upper water column at latitudes >50°S in the 2017 occupation in comparison to 2008 (Figure 9) indicated that a widespread diatom bloom was the driving force behind the major export event. Silicic acid concentrations in the upper water column of the PF in the low export year (2008) were ~1-2 µmol kg-1, while concentrations in 2017 were only ~0.1-0.2 µmol kg-1, indicating noteworthy uptake by these organisms. Given their large size and heavy, siliceous shells, diatoms can export fast-sinking bioavailable material on the order of weeks to months (Smetacek et al., 2012), logically resulting in the appearance of DOC signatures observed here. Their presence in the PF is well documented in underlying sediments (Verlencar et al., 1990; Boyd et al., 2000; Rigual-Hernández et al., 2015), and the species is particularly responsive to iron fertilization due to higher metabolic iron requirements; 75% of primary production has been attributed to the group during iron fertilization experiments (de Baar et al., 1995; Boyd et al., 2000; Morel and Price, 2003). The results here reveal that diatoms appear to thrive on ice-sourced iron in the PF, but export to the deep bathypelagic was not apparent northward in the SAF. Previous studies on community structure revealed the PF to be dominated by diatoms while smaller pico- and micro- plankton species dominate the SAF (Freeman et al., 2018; Henley et al., 2020), suggesting that the observed DOC signatures were distinctly associated with diatom-sourced particles that reach the bathypelagic.
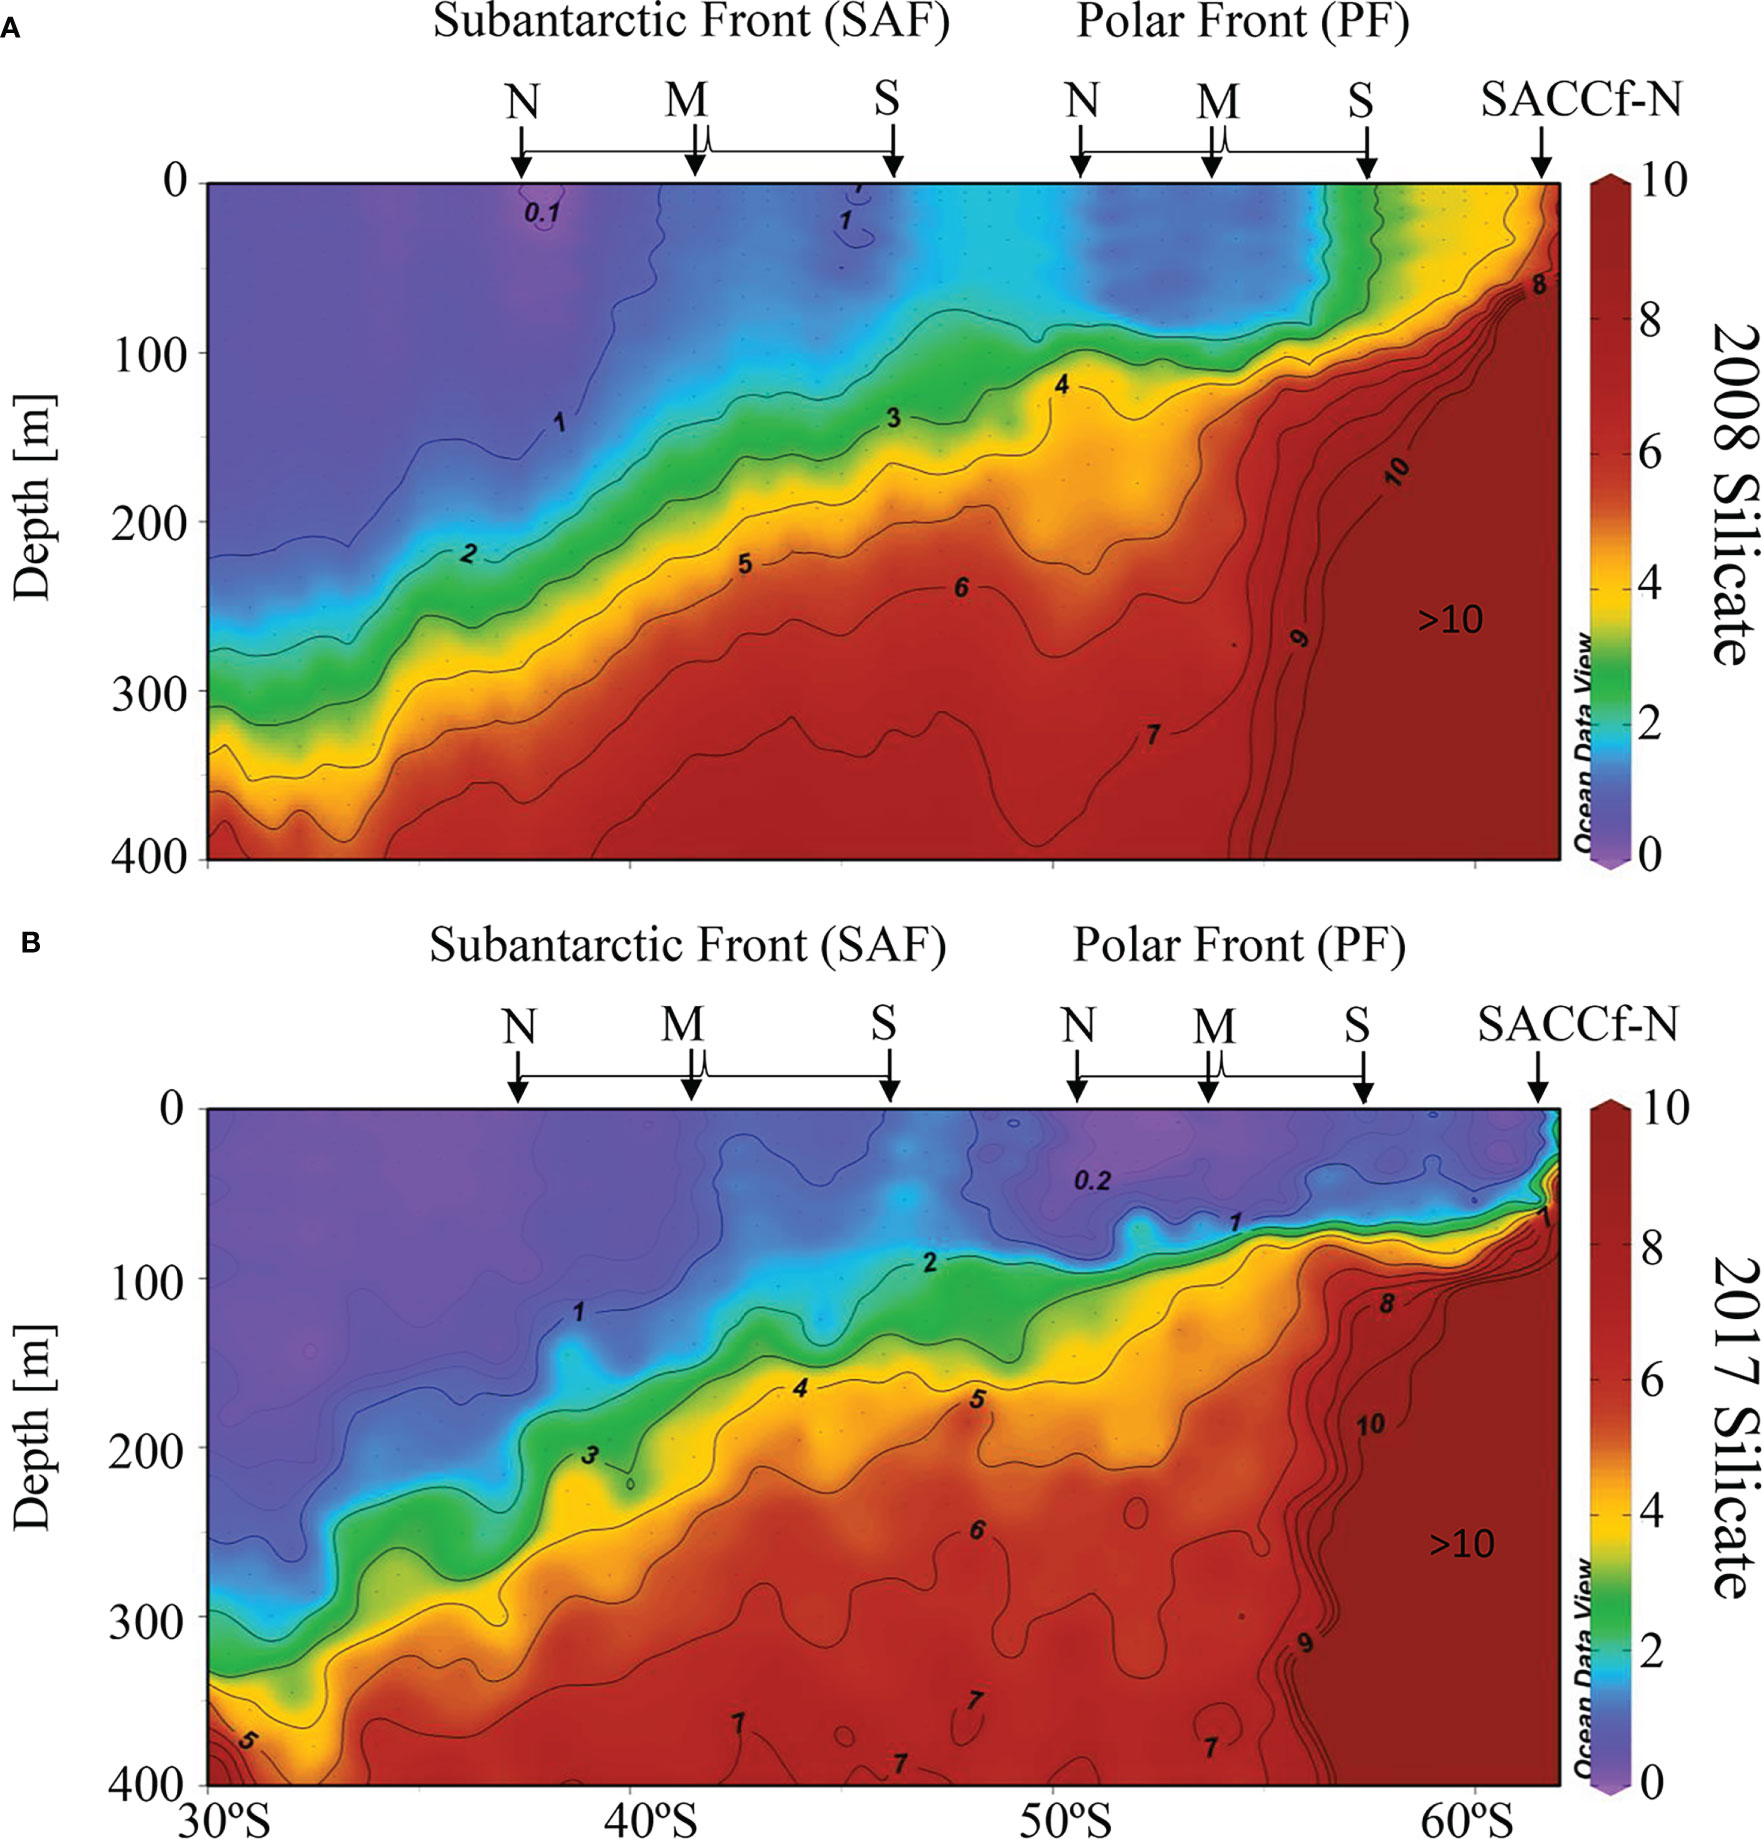
Figure 9 Upper ocean (<400 m) silicic acid concentrations [µmol kg-1] normalized to a salinity of 35 in (A) January 2008 and (B) January 2017 along P18 occupations (103°W).
6 Implications for the future Southern Ocean
The Southern Ocean is estimated to contribute up to 40% of atmospheric CO2 uptake, demonstrating its great importance for long term carbon sequestration (Khatiwala et al., 2009; DeVries, 2014). As such, understanding the Southern Ocean’s response to anomalous conditions is critical for predicting coming changes in the biological pump. Unusual climate conditions and events are already regularly occurring, as extreme heatwaves, ice melt events, and anomalous westerly winds are gaining attention (Turner et al., 2017; Meehl et al., 2019; Parkinson, 2019). For instance, record high Antarctic temperatures were reported in summer of 2019/2020, succeeded by another heatwave in March 2022 that reached temperatures > 40°C higher than usual in some regions (Robinson et al., 2020; Colucci, 2022). Unfortunately, these anomalies may become less “anomalous” in coming years.
From this work, we reveal evidence that export to depths <1500 m in 2007/2008 was stimulated by enhanced upward mixing of iron within turbulent fronts when iron influx from ice melt was low. In contrast, when iron input from ice melt was higher-than-average in 2016/2017, deep export occurred at latitudes south of the PF-N. Post-2016, the region continued a period of decreasing summer ice cover (Meehl et al., 2019) and increased frequency of anomalously low ice area. In the ice record (Figure 8B), we found that such events occurred in 2018 and 2021 and perhaps exhibited above average export as well. However, this study is limited to one longitude. Other sectors of the Southern Ocean are subject to other iron sources and have different ice melt dynamics (Adusumilli et al., 2020), therefore the conclusions from this study may not extrapolate to other regions. Regardless, it is plausible that increased frequency of such events will further increase deep export and become conduits for the deep sequestration of carbon by sedimentation, microbial respiration into inorganics, and addition to the refractory DOC pool. Though this process ultimately results in atmospheric carbon sequestration, dramatic sea ice melt events can cause a ripple effect that negatively impacts factors such as ocean temperature regulation and the lifecycles of local biological community (Thomas and Dieckmann, 2010). Given that there is a need to constrain the uncertainty of the impact that climate change has on the biological pump (Henson et al., 2022), this work provides some insight on the dramatic response within the Pacific sector of the Southern Ocean.
7 Conclusions
In this work, we furthered our understanding of the Southern Ocean’s response to two prominent mechanisms of iron fertilization: deep frontal mixing and sea ice melt. We utilized signatures of enhanced DOC concentrations at bathypelagic depths to identify latitudes at which deep export occurred along the same transect in the Pacific sector occupied a decade apart (2008 vs. 2017). Antarctic ice area happened to be anomalous in both years, with high levels of ice melt present in 2017 and a low degree of melt in 2008, providing a unique opportunity to understand the impact of ice-associated iron on carbon export dynamics. We conclude that the primary influence on upper-bathypelagic export in 2008, when anomalously low ice melt was present, was upwelling/cycling of iron focused within well-known fronts in the area. In contrast, widespread export throughout the water column at latitudes >50°S in 2017, when ice melt was high, resulted from anomalously high influx of iron sourced from the melt. These conclusions present us with a dynamic view of these waters, revealing the significant and widespread influence that ice-sourced iron has on deep carbon export, as well as the role that ever-present fronts play when the influx of ice melt is low. Further, this work demonstrates the utility of bathypelagic DOC signatures as indications of modern carbon export, effectively allowing us to identify important locations and further explore the mechanisms driving that export. Given that anomalous events such as those discussed here are occurring more often, understanding the ocean’s response to a changing Antarctic climate is key to predicting future changes in the biological pump.
Data availability statement
DOC, beam attenuation, and silicic acid data as well as sample collection methods are available from the Carbon Hydrographic Data Office (CCHDO) at https://cchdo.ucsd.edu for cruises 33RO20071215 and 33RO20161119. (Baringer and Johnson, 2021a, 2021b; Hansell, 2021a, 2021b; Mordy and Zhang, 2021a, 2021b; Gardner, 2021a, 2021b). Argo float data are available at https://argo.ucsd.edu/data (Argo, 2021). ACE GEOTRACES data are available from the GEOTRACES Intermediate Data Product (2021) at https://www.geotraces.org/geotraces-intermediate-data-product-2021/. Sea ice data presented are the final Goddard Space Flight Center (GSFC) product obtained from Version 3 of the Sea Ice Index, distributed by the National Snow and Ice Data Center (NSIDC) from platform/instruments from the Defense Meteorological Satellite Program (DMSP) -F13 SSM/I and -F17 SMMIS (Fetterer et al., 2017). Data are available at https://nsidc.org/data/explore-data.
Author contributions
CL conceived the idea, designed the project, completed data analysis, and wrote the manuscript. DH assisted with writing and project development. All authors contributed to the article and approved the submitted version.
Funding
This work was supported by National Science Foundation Grant OCE 2023500 to DH and National Aeronautics and Space Administration (NASA) Grant 80NSSC18K0437 supporting CL and DH. The International GEOTRACES Programme is possible in part thanks to the support from the U.S. National Science Foundation (Grant OCE-1840868) to the Scientific Committee on Oceanic Research (SCOR).
Acknowledgments
The GEOTRACES 2021 Intermediate Data Product (IDP2021) represents an international collaboration and is endorsed by the Scientific Committee on Oceanic Research (SCOR). The many researchers and funding agencies responsible for the collection of data and quality control are thanked for their contributions to the IDP2021. Float data were collected and made freely available, thanks to the International Argo Program and the national programs that contribute to it (https://argo.ucsd.edu , https://www.ocean-ops.org). The Argo Program is part of the Global Ocean Observing System. We thank the U.S. NSF and NOAA funded project US GO-SHIP and the many researchers and crew who contributed to those efforts.
Conflict of interest
Author CL is/was employed by Science Systems and Applications, Inc.
The remaining author declares that the research was conducted in the absence of any commercial or financial relationships that could be construed as a potential conflict of interest.
Publisher’s note
All claims expressed in this article are solely those of the authors and do not necessarily represent those of their affiliated organizations, or those of the publisher, the editors and the reviewers. Any product that may be evaluated in this article, or claim that may be made by its manufacturer, is not guaranteed or endorsed by the publisher.
Supplementary material
The Supplementary Material for this article can be found online at: https://www.frontiersin.org/articles/10.3389/fmars.2023.1070458/full#supplementary-material
References
Adusumilli S., Fricker H. A., Medley B., Padman L., Siegfried M. R. (2020). Interannual variations in meltwater input to the Southern Ocean from Antarctic ice shelves. Nat. Geosci. 13, 616–620. doi: 10.1038/s41561-020-0616-z
Argo (2021). Argo float data and metadata from global data assembly centre (Argo GDAC) (SEANOE). doi: 10.17882/42182
Arrieta J. M., Weinbauer M. G., Lute C., Herndl G. J. (2004). Response of bacterioplankton to iron fertilization in the Southern Ocean. Limnol. Oceanogr. 49 (3), 799–808. doi: 10.4319/lo.2004.49.3.0799
Arrigo K. R., Worthen D. L., Lizotte M. P., Dixon P., Dieckmann G. (1997). Primary production in Antarctic sea ice. Science 276, 394–397. doi: 10.1126/science.276.5311.394
Baringer M., Johnson G. (2021a) CTD data from cruise 33RO20161119, exchange version. Available at: https://cchdo.ucsd.edu/cruise/33RO20161119 (Accessed Access date 2021-05-15). CCHDO cruise.
Baringer M., Johnson G. (2021b) CTD data from cruise 33RO20071215, exchange version. Available at: https://cchdo.ucsd.edu/cruise/33RO20071215 (Accessed Access date 2021-05-15). CCHDO cruise RB-07-11.
Blain S., Quéguiner B., Armand L., Belviso S., Bombled B., Bopp L., et al. (2007). Effect of natural iron fertilization on carbon sequestration in the Southern Ocean. Nature 446 (7139), 1070–1074. doi: 10.1038/nature05700
Boyd P. W., Jickells T., Law C. S., Blain S., Boyle E. A., Buesseler K. O., et al. (2007). Mesoscale iron enrichment experiments 1993-2005: Synthesis and future directions. Science 315 (5812), 612–617. doi: 10.1126/science.1131669
Boyd P. W., Watson A. J., Law C. S., Abraham E. R., Trull T., Murdoch R., et al. (2000). A mesoscale phytoplankton bloom in the polar Southern Ocean stimulated by iron fertilization. Nature 407 (6805), 695–702. doi: 10.1038/35037500
Carter L., Bostock-Lyman H., Bowen M. (2022). “Water masses, circulation and change in the modern Southern Ocean,” in Antarctic Climate evolution (Elsevier), 165–197. doi: 10.1016/B978-0-12-819109-5.00003-7
Colucci R. (2022) Record heatwave in 2022. Available at: https://www.severe-weather.eu/global-weather/powerful-heatwave-affecting-antarctic-continent-unprecedented-temperatures-40-degrees-above-average-rrc/.
de Baar H. J. W., de Jong J. T.M., Bakker D. C. E., Löscher B. M., Veth C., Bathmann U., et al. (1995). Importance of iron for plankton blooms and carbon dioxide drawdown in the Southern Ocean. Nature 373 (6513), 412–415. doi: 10.1038/373412a0
Deppeler S. L., Davidson A. T. (2017). Southern Ocean phytoplankton in a changing climate. Front. Mar. Sci. 4. doi: 10.3389/fmars.2017.00040
DeVries T. (2014). The oceanic anthropogenic CO2 sink: Storage, air-sea fluxes, and transports over the industrial era. Global Biogeochem. Cycles 28, 631–647. doi: 10.1002/2013GB004739
Dong S., Sprintall J., Gille S. T., Talley L. (2008). Southern Ocean mixed-layer depth from argo float profiles. J. Geophys. Res. 113 (C6), C06013. doi: 10.1029/2006JC004051
Duce R. A., Tindale N. W. (1991). Atmospheric transport of iron and its deposition in the ocean. Limnol. Oceanogr. 36 (8), 1715–1265. doi: 10.4319/lo.1991.36.8.1715
Fetterer F., Knowles K., Meier W. N., Savoie M., Windnagel A. K. (2017). Updated daily. sea ice index, version 3 (Boulder, Colorado USA: NSIDC: National Snow and Ice Data Center). doi: 10.7265/N5K072F8
Freeman N. M., Lovenduski N. A., Munro D. R., Krumhardt K. M., Lindsay K., Long M. C., et al. (2018). The variable and changing Southern Ocean silicate front: Insights from the CESM Large ensemble. Global Biogeochem. Cycles 32 (5), 752–685. doi: 10.1029/2017GB005816
Gardner W. (2021a) Transmissometer data from cruise 33RO20161119, exchange version. Available at: https://cchdo.ucsd.edu/cruise/33RO20161119 (Accessed Access date 2021-05-15). CCHDO cruise 10.7942/C21T0F.
Gardner W. (2021b) Transmissometer data from cruise 33RO20071215, exchange version. Available at: https://cchdo.ucsd.edu/cruise/33RO20071215 (Accessed Access date 2021-05-15). CCHDO cruise RB-07-11.
Gardner W. D., Richardson M. J., Carlson C. A., Hansell D. A., Mishonov A. V. (2003). Determining true particulate organic carbon: Bottles, pumps and methodologies. Deep sea Res. Part II: Topical Stud. Oceanogr 50 (3,4), 655–574. doi: 10.1016/S0967-0645(02)00589-1
GEOTRACES Intermediate Data Product Group (2021). The GEOTRACES intermediate data product 2021 (IDP2021) (NERC EDS British Oceanographic Data Centre NOC). doi: 10.5285/cf2d9ba9-d51d-3b7c-e053-8486abc0f5fd
Gille S. T. (1994). Mean sea surface height of the Antarctic circumpolar current from geosat data: Method and application. J. Geophys. Res. 99 (C9), 18255. doi: 10.1029/94JC01172
Guidi L., Calil P. H. R., Duhamel S., Björkman K. M., Doney S. C., Jackson G. A., et al. (2012). Does eddy-eddy interaction control surface phytoplankton distribution and carbon export in the north pacific subtropical gyre? Carbon cycle spatial variability. J. Geophys. Res.: Biogeosci. 117 (G2). doi: 10.1029/2012JG001984
Hague M., Vichi M. (2018). A link between CMIP5 phytoplankton phenology and sea ice in the Atlantic Southern Ocean. Geophys. Res. Lett. 45 (13), 6566–6575. doi: 10.1029/2018GL078061
Hansell D. (2021a) DOC data from cruise 33RO20161119, exchange version. Available at: https://cchdo.ucsd.edu/cruise/33RO20161119 (Accessed Access date 2021-05-15). CCHDO cruise 10.7942/C21T0F.
Hansell D. (2021b) DOC data from cruise 33RO20071215, exchange version. Available at: https://cchdo.ucsd.edu/cruise/33RO20071215 (Accessed Access date 2021-05-15). CCHDO cruise RB-07-11.
Hansell D. A., Carlson C. (2015). Biogeochemistry of Marine Dissolved Organic Matter (Elsevier). doi: 10.1016/C2012-0-02714-7
Hansell D. A., Carlson C. A., Schlitzer R. (2012). Net removal of major marine dissolved organic carbon fractions in the subsurface ocean. Global Biogeochem. Cycles 26, n/a–n/a. doi: 10.1029/2011GB004069
Henley S. F., Cavan E. L., Fawcett S. E., Kerr R., Monteiro T., Sherrell R. M., et al (2020) Changing biogeochemistry of the Southern Ocean and its ecosystem implications. Front. Mar. Sci. 7 (July). doi: 10.3389/fmars.2020.00581
Henson S. A., Laufkötter C., Leung S., Giering S. L.C., Palevsky H. I., Cavan E. L. (2022). Uncertain response of ocean biological carbon export in a changing world. Nat. Geosci. 15 (4), 248–545. doi: 10.1038/s41561-022-00927-0
Key R. M., Olsen A., Van Heuven S., Lauvset S. K., Velo A., Lin X., et al. (2015). Global ocean data analysis project, version 2 (GLODAPv2), ORNL/CDIAC-162, ND-P093 (Carbon Dioxide Information Analysis Center (CDIAC). doi: 10.3334/CDIAC/OTG.NDP093_GLODAPV2
Khatiwala S., Primeau F., Hall T. (2009). Reconstruction of the history of anthropogenic CO2 concentrations in the ocean. Nature 462, 346–349. doi: 10.1038/nature08526
Lannuzel D., Bowie A. R., Remenyi T., Lam P., Townsend A., Ibisanmi E., et al. (2011). Distributions of dissolved and particulate iron in the sub-Antarctic and polar frontal Southern Ocean (Australian sector). Deep sea Res. Part II: Topical Stud. Oceanogr. 58, 2094–2112. doi: 10.1016/j.dsr2.2011.05.027
Lannuzel D., Chever F., van der Merwe P. C., Janssens J., Roukaerts A., Cavagna A.-J., et al (2016) Iron biogeochemistry in Antarctic pack ice during SIPEX-2. Deep sea Res. Part II: Topical Stud. Oceanogr. 131 (September), 111–122. doi: 10.1016/j.dsr2.2014.12.003
Laufkötter C., Stern A. A., John J. G., Stock C. A., Dunne J. P. (2018). sea Ice iron sources stimulate the Southern Ocean carbon cycle. Geophys. Res. Lett. 45 (24), 13, 377–13, 385. doi: 10.1029/2018GL079797
Li Q. P., Franks P. J. S., Ohman M. D., Landry M. R. (2012). Enhanced nitrate fluxes and biological processes at a frontal zone in the southern California current system. J. Plankton Res. 34 (9), 790–780. doi: 10.1093/plankt/fbs006
Lopez C. N., Hansell D. A. (2021). Evidence of deep DOC enrichment via particle export beneath subarctic and northern subtropical fronts in the north pacific. Front. Mar. Sci. 8 (September). doi: 10.3389/fmars.2021.659034
Lopez C. N., Robert M., Galbraith M., Bercovici S. K., Orellana M. V., Hansell D. A. (2020). High temporal variability of total organic carbon in the deep northeastern pacific. Front. Earth Sci. 8. doi: 10.3389/feart.2020.00080
Meehl G. A., Arblaster J. M., Chung C. T.Y., Holland M. M., DuVivier A., Thompson L., et al. (2019). Sustained ocean changes contributed to sudden Antarctic sea ice retreat in late 2016. Nat. Commun. 10 (1), 145. doi: 10.1038/s41467-018-07865-9
Monterey G., Levitus S. (1997). “seasonal variability of mixed layer depth for the world ocean,” in NOAA Atlas NESDIS 14, vol. 96. (Wash., D.C.: U.S. Gov. Printing Office), 87.
Moore J. K., Abbott M. R. (2000). Phytoplankton chlorophyll distributions and primary production in the Southern Ocean. J. Geophys. Res. 105, 28709–28722. doi: 10.1029/1999JC000043
Moore J.K., Fu W., Primeau F., Britten G. L., Lindsay K., Long M., et al. (2018). Sustained climate warming drives declining marine biological productivity. Science 359 (6380), 1139–1143. doi: 10.1126/science.aao6379
Mordy C., Zhang J. (2021a) Nutrient data from cruise 33RO20161119, exchange version. Available at: https://cchdo.ucsd.edu/cruise/33RO20161119 (Accessed Access date 2021-05-15).
Mordy C., Zhang J. (2021b) Nutrient data from cruise 33RO20071215, exchange version. Available at: https://cchdo.ucsd.edu/cruise/33RO20071215 (Accessed Access date 2021-05-15). CCHDO cruise RB-07-11.
Morel F. M. M., Price N. M. (2003). The biogeochemical cycles of trace metals in the oceans. Science 300 (5621), 944–947. doi: 10.1126/science.1083545
Noji T. T., Børsheim K. Y., Rey F., Nortvedt R. (1999). Dissolved organic carbon associated with sinking can be crucial for estimates of vertical carbon flux. Sarsia 84, 129–135. doi: 10.1080/00364827.1999.10420440
Ohman M. D., Powell J. R., Picheral M., Jensen D. W. (2012). Mesozooplankton and particulate matter responses to a deep-water frontal system in the southern California current system. J. Plankton Res. 34 (9), 815–827. doi: 10.1093/plankt/fbs028
Olsen A., Key R. M., van Heuven S., Lauvset S. K., Velo A., Lin X., et al (2016) The global ocean data analysis project version 2 (GLODAPv2) – an internally consistent data product for the world ocean. Earth Syst. Sci. Data 8 (2), 297–323. doi: 10.5194/essd-8-297-2016
Parkinson C. L. (2019). A 40-y record reveals gradual Antarctic sea ice increases followed by decreases at rates far exceeding the rates seen in the Arctic. Proc. Natl. Acad. Sci. 116 (29), 14414–14423. doi: 10.1073/pnas.1906556116
Peck L. S., Barnes D. K. A., Cook A. J., Fleming A. H., Clarke A. (2010). Negative feedback in the cold: Ice retreat produces new carbon sinks in Antarctica: Negative climate feedbacks in Antarctica. Global Change Biol. 16 (9), 2614–2623. doi: 10.1111/j.1365-2486.2009.02071.x
Person R., Aumont O., Madec G., Vancoppenolle M., Bopp L., Merino N. (2019). Sensitivity of ocean biogeochemistry to the iron supply from the Antarctic ice sheet explored with a biogeochemical model. Biogeosciences 16 (18), 3583–36035. doi: 10.5194/bg-16-3583-2019
Person R., Vancoppenolle M., Aumont O., Malsang M. (2021). Continental and sea ice iron sources fertilize the Southern Ocean in synergy. Geophys. Res. Lett. 48 doi: 10.1029/2021GL094761
Rigual-Hernández A. S., Trull T. W., Bray S. G., Closset I., Armand L. K. (2015). seasonal dynamics in diatom and particulate export fluxes to the deep sea in the Australian sector of the southern Antarctic zone. J. Mar. Syst. 142 (February), 62–74. doi: 10.1016/j.jmarsys.2014.10.002
Robinson S. A., Klekociuk A. R., King D. H., Rojas M. P., Zúñiga G. E., Bergstrom D. M. (2020). The 2019/2020 summer of Antarctic heatwaves. Global Change Biol. 26 (6), 3178–3805. doi: 10.1111/gcb.15083
Schlitzer R. (2021) Ocean Data View. Available at: https://odv.awi.de.
Schlosser E., Haumann F.A., Raphael M. N. (2018). Atmospheric influences on the anomalous 2016 Antarctic sea ice decay. The Cryosphere 12, 1103–1119. doi: 10.5194/tc-12-1103-2018
Sergi S., Baudena A., Cotté C., Ardyna M., Blain S., d’Ovidio F. (2020). Interaction of the Antarctic circumpolar current with seamounts fuels moderate blooms but vast foraging grounds for multiple marine predators. Front. Mar. Sci. 7 (June). doi: 10.3389/fmars.2020.00416
Sieber M., Conway T. M., de Souza G. F., Hassler C. S., Ellwood M. J., Vance D. (2021). Isotopic fingerprinting of biogeochemical processes and iron sources in the iron-limited surface Southern Ocean. Earth Planet. Sci. Lett. 567), 116967. doi: 10.1016/j.epsl.2021.116967
Smetacek V., Klaas C., Strass V. H., Assmy P., Montresor M., Cisewski B., et al. (2012). Deep carbon export from a Southern Ocean iron-fertilized diatom bloom. Nature 487 (7407), 313–319. doi: 10.1038/nature11229
Smith R., Mariano A. J., Ryan E. H. (2013) The Antarctic CP current. Available at: https://oceancurrents.rsmas.miami.edu/southern/antarctic-cp.html.
Sokolov S., Rintoul S. R. (2002). Structure of Southern Ocean fronts at 140°E. J. Mar. Syst. 37 (1–3), 151–184. doi: 10.1016/S0924-7963(02)00200-2
Sokolov S., Rintoul S. R. (2007). On the relationship between fronts of the Antarctic circumpolar current and surface chlorophyll concentrations in the Southern Ocean. J. Geophys. Res. 112, C07030. doi: 10.1029/2006JC004072
Sokolov S., Rintoul S. R. (2009). Circumpolar structure and distribution of the Antarctic circumpolar current fronts: 2. variability and relationship to sea surface height. J. Geophys. Res. 114 (C11), C11019. doi: 10.1029/2008JC005248
Suzuki T., Ishii M., Aoyama M., Christian J. R., Enyo K., Kawano T., et al. (2013). The Pacific Ocean interior carbon (PACIFICA) database (NCEI accession 0110865) (NOAA National Centers for Environmental Information). doi: 10.25921/N9NN-8324
Tagliabue A., Sallée J. B., Bowie A., Lévy M., Swart S., Boyd P. W., et al. (2014). Surface-water iron supplies in the Southern Ocean sustained by deep winter mixing. Nat. Geosci. 7, 314–320. doi: 10.1038/ngeo2101
Talley L. (2013). Closure of the global overturning circulation through the Indian, pacific, and Southern Oceans: Schematics and transports. Oceanography 26 (1), 80–97. doi: 10.5670/oceanog.2013.07
Talley L. D., Pickard G. L., Emery W. J. (2011). Descriptive physical oceanography: an introduction. 6th ed (Amsterdam; Boston: Academic Press).
Thomalla S. J., Fauchereau N., Swart S., Monteiro P. M. S. (2011). Regional scale characteristics of the seasonal cycle of chlorophyll in the Southern Ocean. Biogeosciences 8, 2849–2866. doi: 10.5194/bg-8-2849-2011
Timmermans K. R., Stolte W., de Baar H. J. W. (1994). Iron-mediated effects on nitrate reductase in marine phytoplankton. Mar. Biol. 121, 389–396. doi: 10.1007/BF00346749
Timmermans K., van Leeuwe M., de Jong J., McKay R., Nolting R., Witte H., et al. (1998). Iron stress in the pacific region of the Southern Ocean: Evidence from enrichment bioassays. Mar. Ecol. Prog. Ser. 166, 27–41. doi: 10.3354/meps166027
Turner J., Phillips T., Marshall G. J., Scott Hosking J., Pope J. O., Bracegirdle T. J., et al. (2017). Unprecedented springtime retreat of Antarctic sea ice in 2016. Geophys. Res. Lett. 44 (13), 6868–6755. doi: 10.1002/2017GL073656
Verlencar X. N., Somasunder K., Qasim S. Z. (1990). “Regeneration of nutrients and biological productivity in Antarctic waters,” in Marine Ecology Progress Series, vol. 61, (41–59). Available at: https://www.int-res.com/articles/meps/61/m061p041.pdf.
Walton D. W. H., Thomas J. (2018). Cruise report - Antarctic circumnavigation expedition (ACE) 20th December 2016 - 19th March 2017 (1.0) (Zenodo). doi: 10.5281/zenodo.1443511
Wang S., Bailey D., Lindsay K., Moore J. K., Holland M. (2014). Impact of sea ice on the marine iron cycle and phytoplankton productivity. Biogeosciences 11 (17), 4713–4731. doi: 10.5194/bg-11-4713-2014
Keywords: particle export, iron limitation, Southern Ocean, Antarctic circumpolar current, sea ice melt, biogeochemistry, biogeochemical cycling, dissolved organic carbon
Citation: Lopez CN and Hansell DA (2023) Anomalous DOC signatures reveal iron control on export dynamics in the Pacific Southern Ocean. Front. Mar. Sci. 10:1070458. doi: 10.3389/fmars.2023.1070458
Received: 14 October 2022; Accepted: 25 January 2023;
Published: 20 February 2023.
Edited by:
Javier Arístegui, University of Las Palmas de Gran Canaria, Las Palmas de Gran Canaria, SpainReviewed by:
Eva Ortega-Retuerta, UMR7621 Laboratoire d’océanographie microbienne (LOMIC), FranceLeticia Cotrim Da Cunha, Rio de Janeiro State University, Brazil
Raquel Avelina, Rio de Janeiro State University, Brazil
Copyright © 2023 Lopez and Hansell. This is an open-access article distributed under the terms of the Creative Commons Attribution License (CC BY). The use, distribution or reproduction in other forums is permitted, provided the original author(s) and the copyright owner(s) are credited and that the original publication in this journal is cited, in accordance with accepted academic practice. No use, distribution or reproduction is permitted which does not comply with these terms.
*Correspondence: Chelsea N. Lopez, Y2hlbHNlYS5uaWNvbGU1MTVAZ21haWwuY29t