 Johan Wikner
 Kevin Vikström
95% of researchers rate our articles as excellent or good
Learn more about the work of our research integrity team to safeguard the quality of each article we publish.
Find out more
ORIGINAL RESEARCH article
Front. Mar. Sci. , 10 March 2023
Sec. Aquatic Microbiology
Volume 10 - 2023 | https://doi.org/10.3389/fmars.2023.1070070
This article is part of the Research Topic Impact of Global Change on Marine Microbial Ecology View all 6 articles
Microbial respiration is the major process consuming oxygen in the biosphere. The relative energy demand from growth of biomass or maintenance activities determines the regulation of respiration with impact on how the development of hypoxia and CO2 emissions is controlled. This coupling is crucial for understanding the life history and associated ecological interactions of microorganisms. However, the knowledge of rate and regulating factors of maintenance respiration in the biosphere is limited. In this study, we demonstrated significant relationships in marine field samples where the prokaryotic specific growth rate predicts cell-specific respiration, in accordance with theory from culture models, over a 10-fold salinity range. This enables the first reported direct estimates of maintenance respiration in nature to show a 6-fold variation between 0.12-0.62 fmol O2 cell-1 d-1, comprising 29-72% of prokaryotic specific respiration. The lowest maintenance respiration occurred at salinity close to physiological osmolarity, suggesting osmoregulation as one of the more energy-consuming maintenance activities. A conservative global estimate of maintenance respiration accounted for 66% of the total prokaryotic respiration in the ocean´s mixed layer. This means that maintenance activities dominate the use of the energy generated by prokaryotic respiration in the sea, where osmoregulation is one significant energy consumer. Consequently, maintenance respiration and its regulation must be included in ecological and biogeochemical models to accurately project and manage the development of hypoxia and CO2 emissions from the ocean.
Bacteria and Archaea (hereafter prokaryotes) are the oldest organisms and main consumers of oxygen in the sea (Robinson and Williams, 2005), simultaneously releasing CO2 (i.e., respire). Therefore, prokaryotes are pivotal for affecting the oxygen and CO2 levels in the ocean and the biosphere (Oschlies et al., 2018). Prokaryotic respiration derives energy to drive growth and maintenance activities (van Bodegom, 2007), whose regulation is important to understand from both biogeochemical, ecological, and evolutionary aspects. Maintenance respiration is driving activities not directly related to biomass increase, including physiological maintenance of cell components, but also activities non-linearly related to specific growth rate, yield and death rate. Osmoregulation, repair, and proofreading of macromolecules and spilling reactions are proposed as the main drivers of maintenance respiration (van Bodegom, 2007), and is defined as one of the energy demanding processes (Tempest and Neijssel, 1984). The least energy for osmoregulation would be expected when extracellular osmolarity does not require adaptive synthesis of osmolytes to maintain intracellular metabolic function. Studies of osmoregulation in Escherichia coli predict that least maintenance demand should occur at a salinity corresponding to a salinity of 9 (i.e., osmolarity of 300 mmol dm-3) (i.e., brackish water) (Record et al., 1998; Yancey et al., 2014). A hyperbolic relationship would therefore be expected if osmoregulation is a significant cause of maintenance respiration over the full marine salinity range. Maintenance respiration due to the repair or proofreading of macromolecules and spilling reactions are outside the scope of this study and reviewed by Russell and Cook (1995). Estimates of maintenance respiration (ρm) in the natural environment are lacking, although its potential importance is recognized in the bacteriological literature (Carlson et al., 2007; van Bodegom, 2007; Manzoni et al., 2012).
The prokaryotic growth efficiency (PGE) for oceanic environments, today estimated to be 10% on average (Lemée et al., 2002; Reinthaler and Herndl, 2005; del Giorgio et al., 2011), suggests that ρm is substantial, but the lack of a significant relationship on an absolute scale between 1-PGE and relevant predictors prohibits reliable field estimates. In addition, 1-PGE as such is not a valid measure of maintenance respiration according to the current theory outlined above (van Bodegom, 2007). This theory was developed based on eco-physiological studies of maintenance respiration in axenic cultures and showed that maintenance respiration can be substantial (Neijssel and Tempest, 1976; Pirt, 1982).
By simplifying the model equation developed by Pirt (1982), we hypothesized that reliable absolute and weighted field estimates of maintenance respiration should be derived from variables measured under in situ conditions. However, given that the theory is developed at 10-fold higher specific growth rates than typical for marine prokaryotes and only validated with the soil dwelling potential pathogen Klebsiella aerogenes (Neijssel and Tempest, 1976), it is not obvious that the theory can be applied across marine prokaryotic taxa, substrate compositions and other environmental factors. Successful application to marine field samples would thereby also represent a valuable validation of the theory.
There is a paucity of reported analyses of prokaryotic specific growth rate (µ) vs. specific respiration rate (hereafter denoted ρ) in field data despite its proven importance for prokaryotic energy metabolism demonstrated in axenic cultures. Analyses of prokaryotic respiration at the community or cell-specific (ρ) level, in logarithm transformed (most common) or absolute form, are reported versus time (Blight et al., 1995), temperature (Hoch and Kirchman, 1993; Apple et al., 2006; López-Urrutia and Morán, 2007), bacterial biomass production (Reinthaler and Herndl, 2005), bacterial growth efficiency (Smith and Prairie, 2004; del Giorgio et al., 2006), bacterial abundance (del Giorgio et al., 1997a), chlorophyll-a (del Giorgio et al., 1997b; López-Urrutia and Morán, 2007), primary production (Preen and Kirchman, 2004; Reinthaler and Herndl, 2005), phytoplankton specific growth rate (Kirchman, 2016) and total dissolved phosphorous (lake environments) (Smith and Prairie, 2004). The only analyses of µ vs. ρ in field samples found in the literature are proof-of-concept recently reported from a sub-Arctic estuary (Vikström and Wikner, 2019). It is therefore unclear whether the theory of maintenance respiration applies to the full range of marine salinity and how that influences its rate.
We therefore investigated three marine environments representing a range of trophic levels (mesotrophic, meso-eutrophic and oligotrophic) (Wasmund et al., 2001) and salinities from 2.6-30. The following research questions were addressed: 1) Is there a significant relationship between prokaryotic specific growth rate (µ) and specific respiration rate (ρ) across taxa and substrate conditions in the field? 2) What is the rate of maintenance respiration? 3) Does the dependence of maintenance respiration on salinity comply with osmoregulation? 4) What is the overall share of prokaryotic maintenance respiration in the sea?
A significant linear relationship was found between prokaryotic specific respiration and specific growth rate in all environments investigated (Figure 1, Table 1). Consequently, significant maintenance respiration could be estimated for all environments, showing a 6-fold range of 0.12-0.62 fmol O2 cell-1 d-1 (Table 1, Figure 2). Despite clearly different slope values in the Bothnian Sea, these values were not significantly different from each other at the applied sampling effort due to high variance. The 52% higher slope in the NE Atlantic compared to the Baltic Proper was not significant.
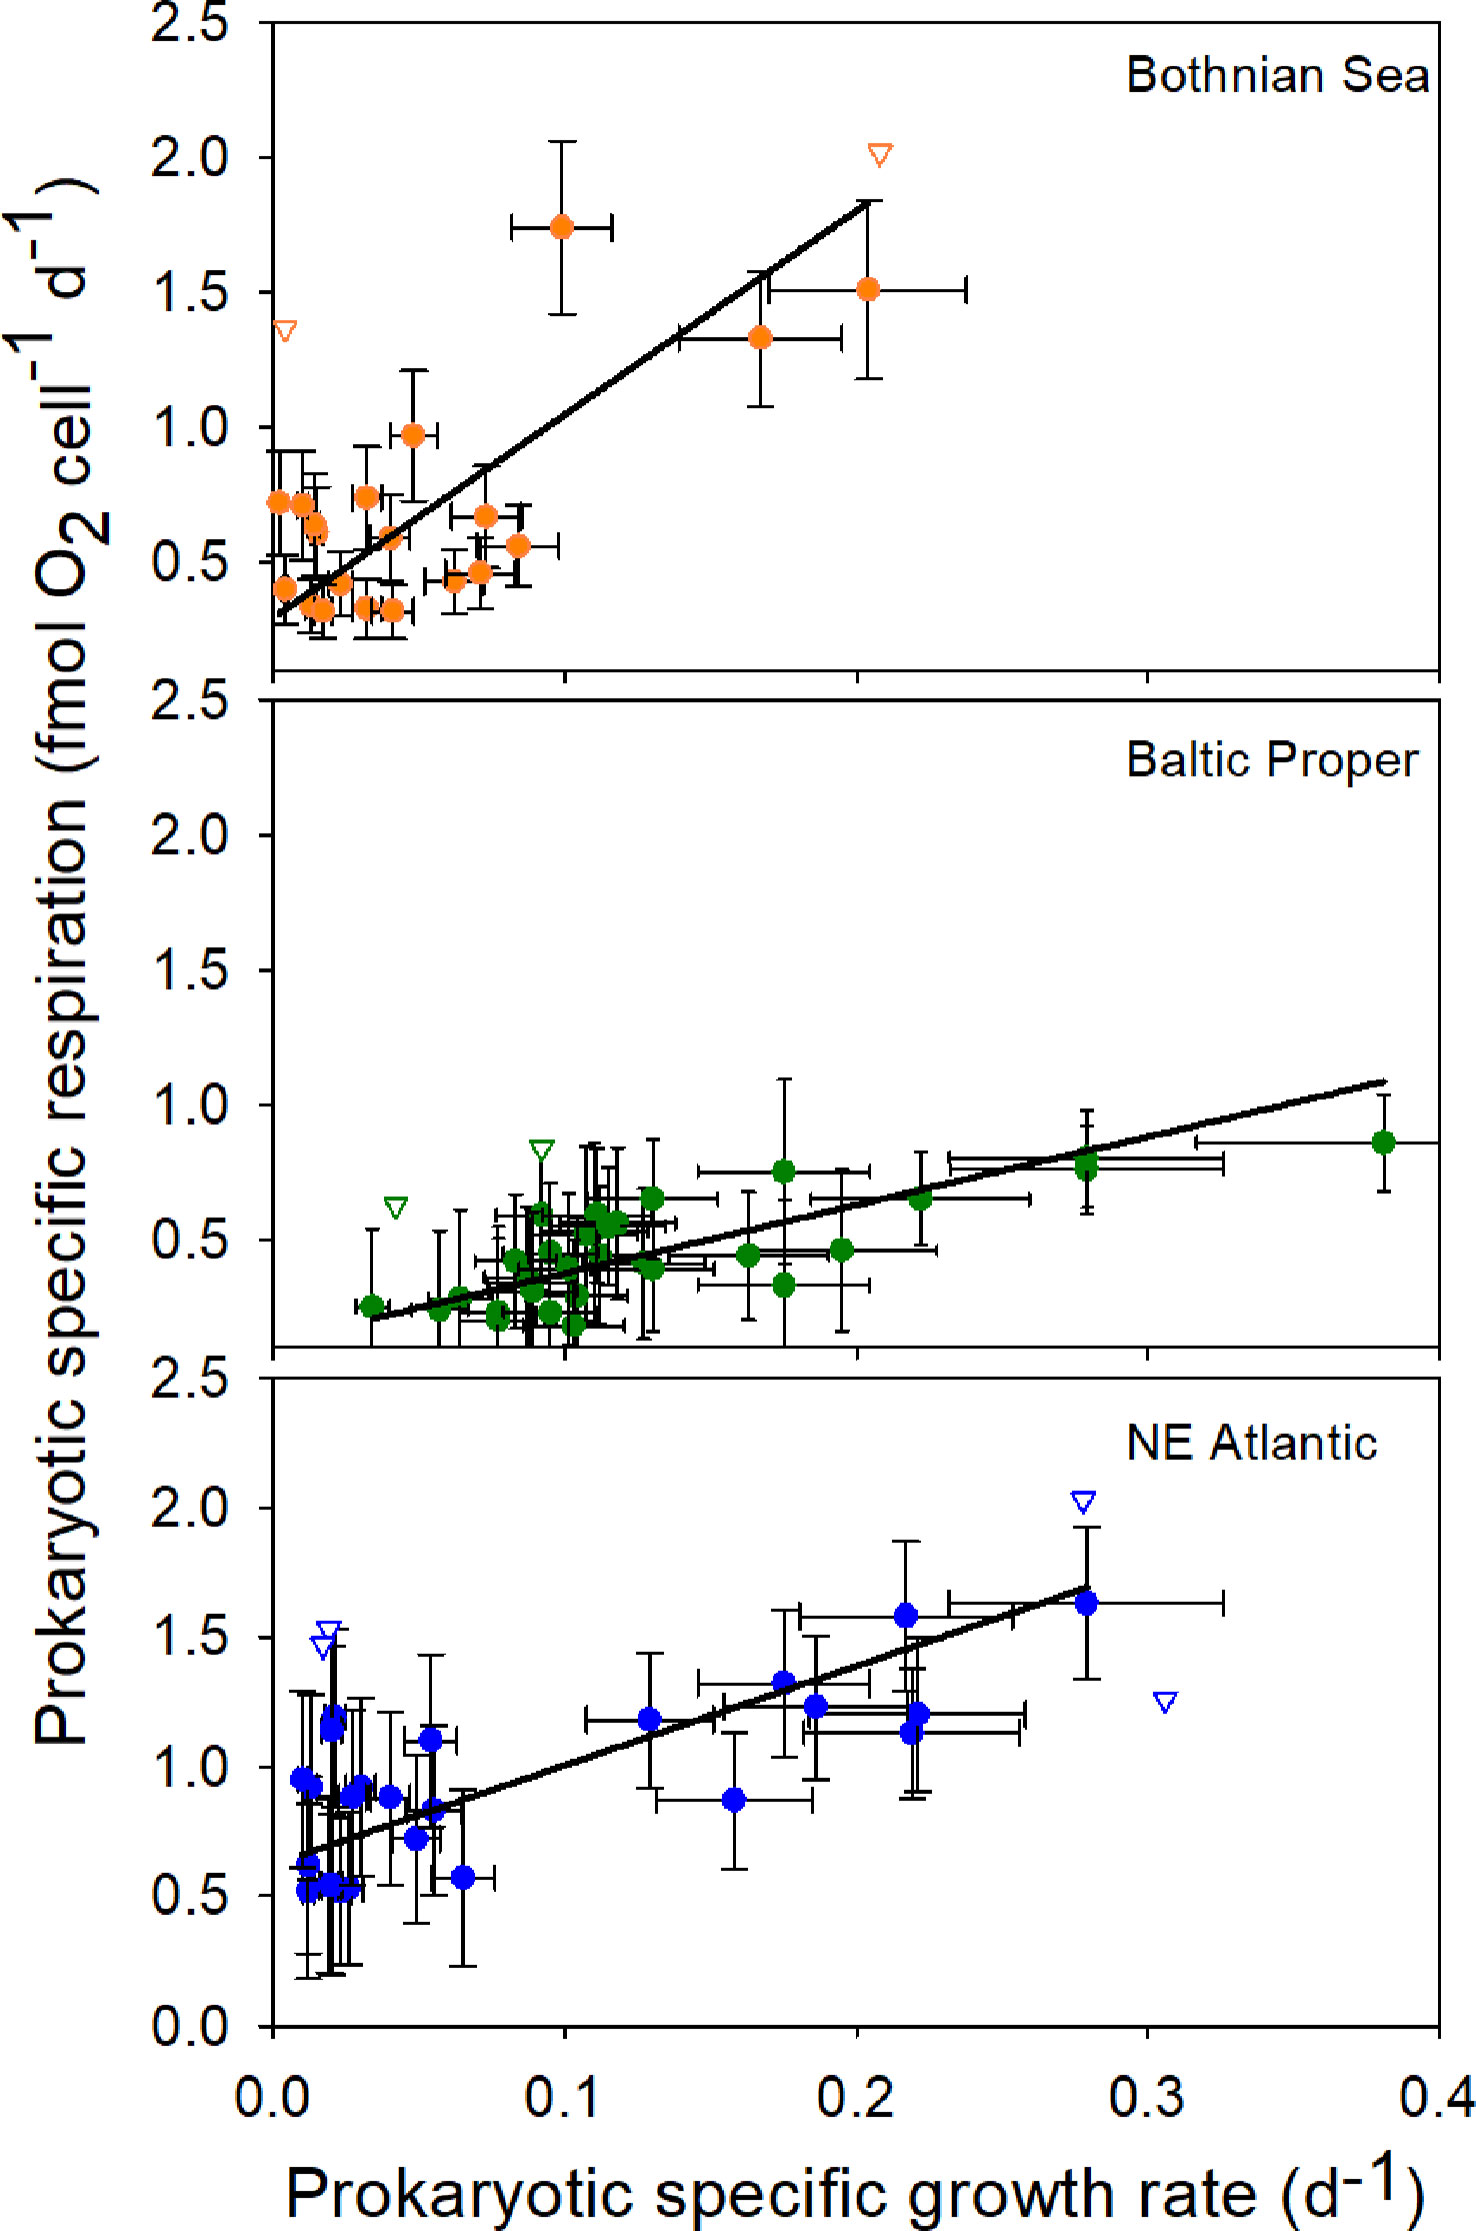
Figure 1 The prokaryotic specific respiration rate (ρ) shows a significant linear relationship with the prokaryotic specific growth rate (µ) in all sea areas. Black lines show a linear model II regression (see Table 1 for statistical results). The y-axis intercept represents the maintenance respiration rate (ρm) and varies with the environment. Error bars show ± 2 × SD (n=2) calculated from replicate sample bottles. Open triangles show excluded outliers.
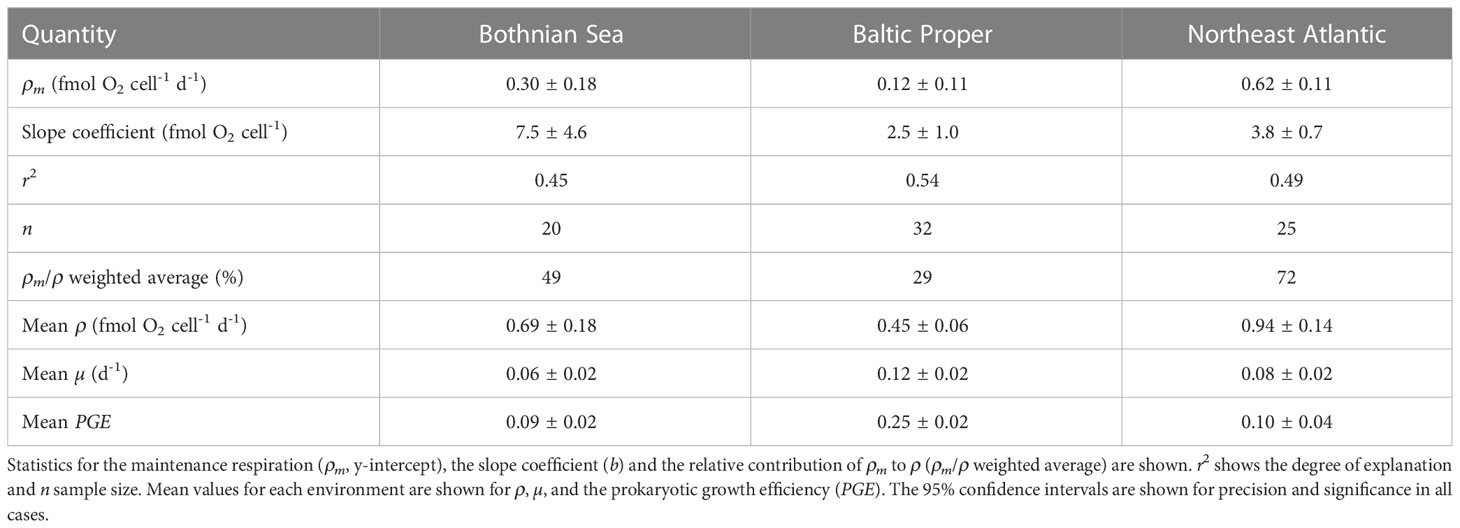
Table 1 Coefficients are shown for the model II regressions of the relationships (ρ = ρm + bµ) between the prokaryotic specific growth rate (µ) and the specific respiration rate (ρ).
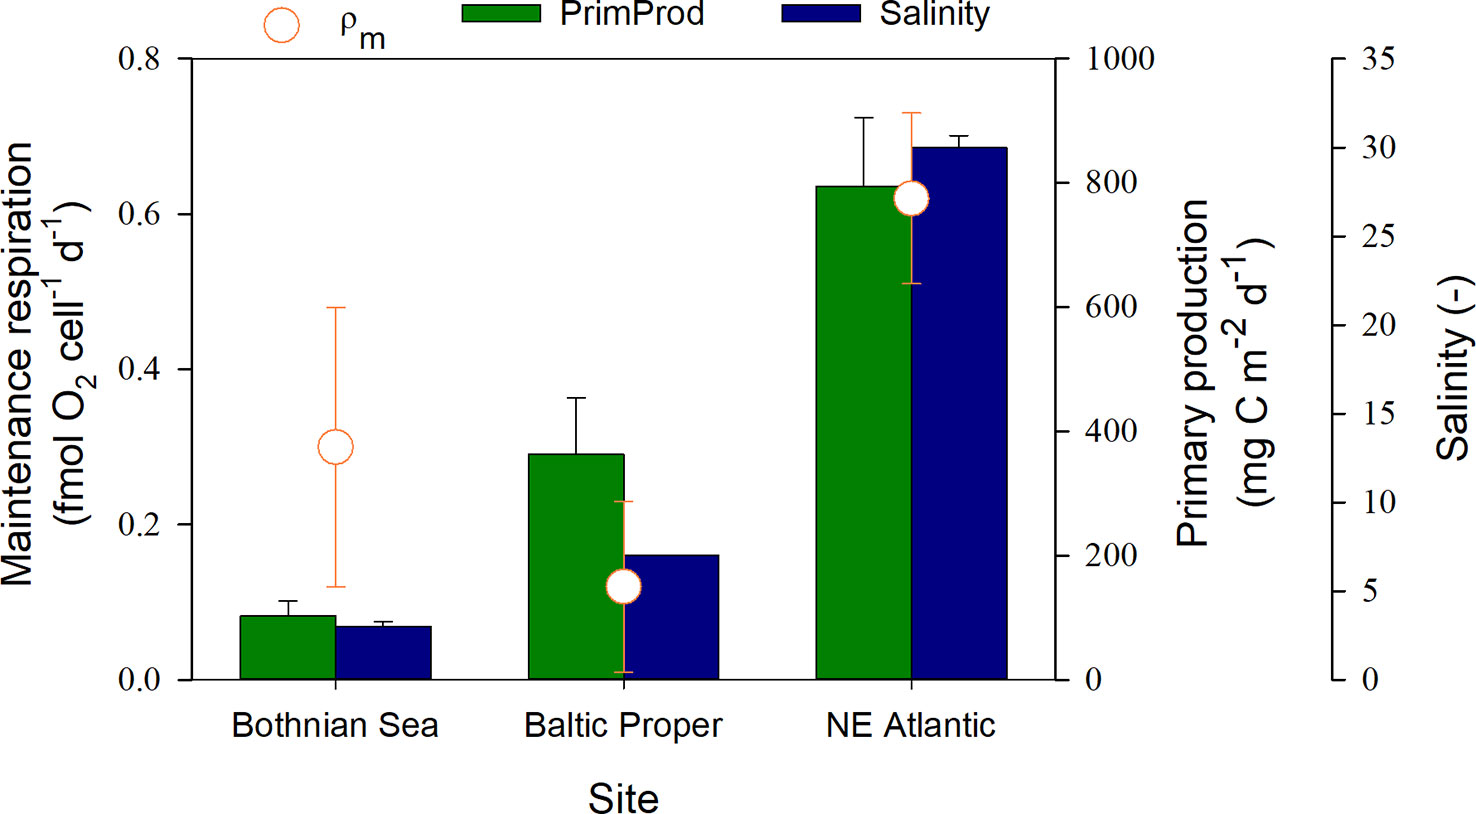
Figure 2 Relationship between maintenance respiration, salinity and primary production (August average) at the different sites. Error bars show the 95% confidence interval for ρm and ± SE for salinity and primary production.
The ρm in the coastal Northeast Atlantic (NE Atlantic) was significantly higher than that in the other two coastal environments (95% C.I., Table 1), with a lower salinity and a lower productivity in one case (Bothnian Sea, Figure 2). The lowest contribution from ρm was found in the mid-saline and meso-eutrophic environment (salinity 7, i.e., brackish water), coinciding with the highest prokaryotic growth rate (Independent-sample median test, Sig.Adj.<0.001, n=102, Table 1). The difference in ρm between the Baltic Proper and NE Atlantic was proportional to the salinity change, while ρm increased at even lower salinities in the Bothnian Sea. The reported primary production levels from the three sea areas showed a linear increase from the Bothnian Sea via Baltic Proper to the NE Atlantic (Figure 2). The specific growth rate at salinities 3 and 34 were not significantly different despite 8-fold higher primary production at salinity 34. The median growth efficiency was highest at the highest productivity and salinity, but similar at both brackish water sites (Independent-sample median test, Sig.Adj.<0.001, n=94, Table 1).
By using the estimated ρm, its relative contribution to ρ was calculated, showing an exponential and decreasing influence of maintenance respiration as the specific growth rate increased (Figure 3). For the NE Atlantic, ρm comprised more than 50% of prokaryotic respiration at µ< 0.20 d-1, while in brackish water environments, the corresponding maintenance cost was not reached until µ was less than 0.05 d-1.
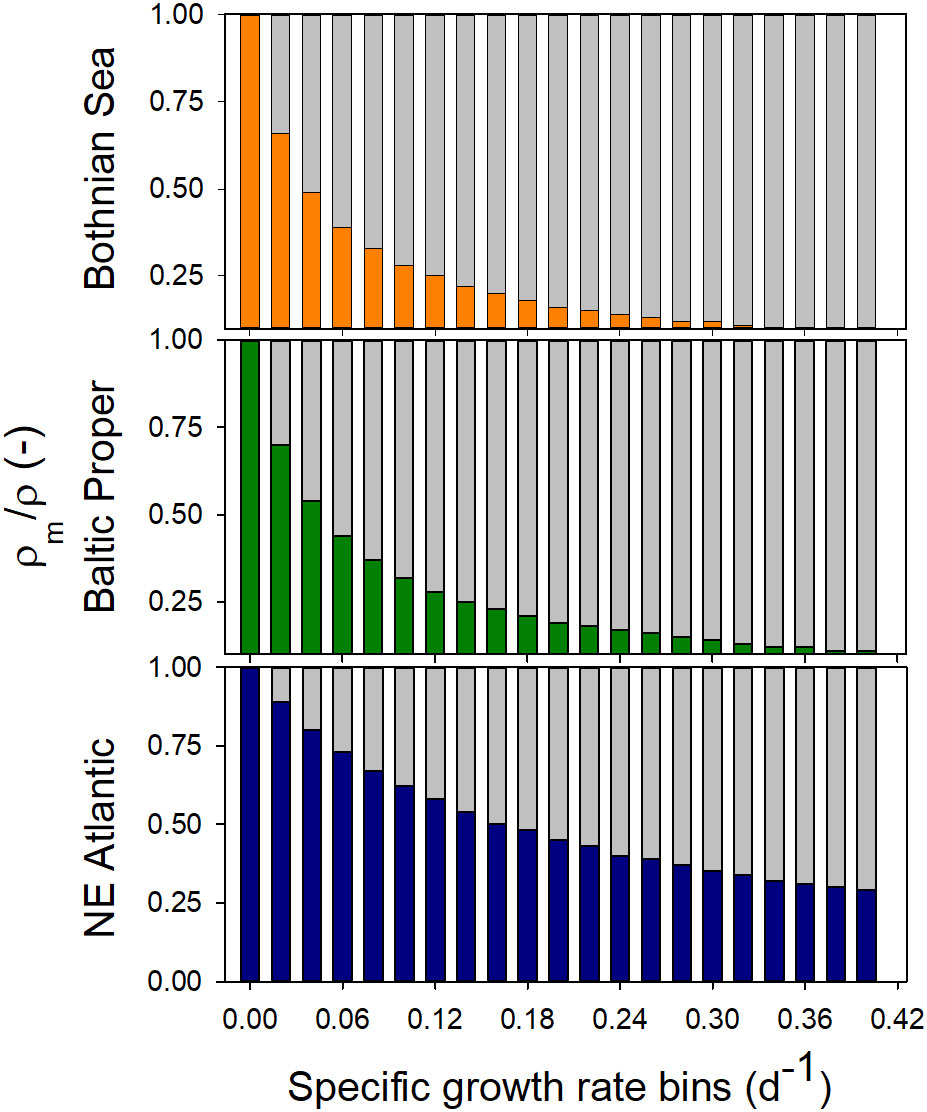
Figure 3 The contribution of specific maintenance respiration (ρm, coloured bars) and specific growth-based respiration (ρsg, grey bars) to total respiration over binned µ data (0.02 d-1 intervals) at different salinities and productivity levels (c.f., Figure 2, and Table 2). As µ decreases, the proportion of ρm increases.
It was clear from the distribution of prokaryotic specific growth rates that low values were common in all marine environments (Figure 4). Therefore, a large influence of ρm was expected in general (Figure 3). In accordance, the calculated weighted contribution of maintenance respiration (ρm/ρ) for each environment showed the highest influence of ρm for the NE Atlantic (72%) and lowest in the coastal Baltic Proper site (29%, Table 1).

Figure 4 Histograms comparing the measured µ value distribution of the current dataset to the global dataset used for modeling the contribution from maintenance respiration (Kirchman, 2016). One extreme value of 0.60 was excluded from the global dataset for better resolution.
By applying the derived relationship between µ and ρ from the NE Atlantic site, a first estimate of the global influence of ρm on ρ was calculated using a global dataset of µ (Kirchman, 2016). Maintenance respiration accounted for 56-77% of the prokaryotic specific respiration depending on sea area, resulting in a global weighted average of 66% (Table 2).
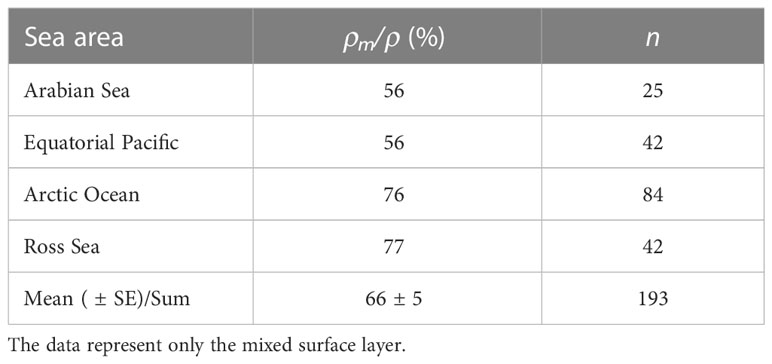
Table 2 Maintenance respiration relative to total prokaryotic respiration (ρm/ρ) as a weighted average based on reported prokaryotic specific growth rate (µ) from Kirchman (2016) and the function derived from the Northeast Atlantic (Table 1).
Combining µ in the studied environments provided a dataset similar in distribution to the most comprehensive global dataset of µ reported by Kirchman (2016) (Figure 4, Table 3, independent-samples Kolmogorov–Smirnov test, p = 0.12, n = 297). The µ range measured within the three regions described here was 0.02-0.38 d-1, resulting in 99.5% coverage of the global range when excluding one outlier (0.61 d-1). Low µ-values were, however, more common in the oceanic dataset than those reported here.
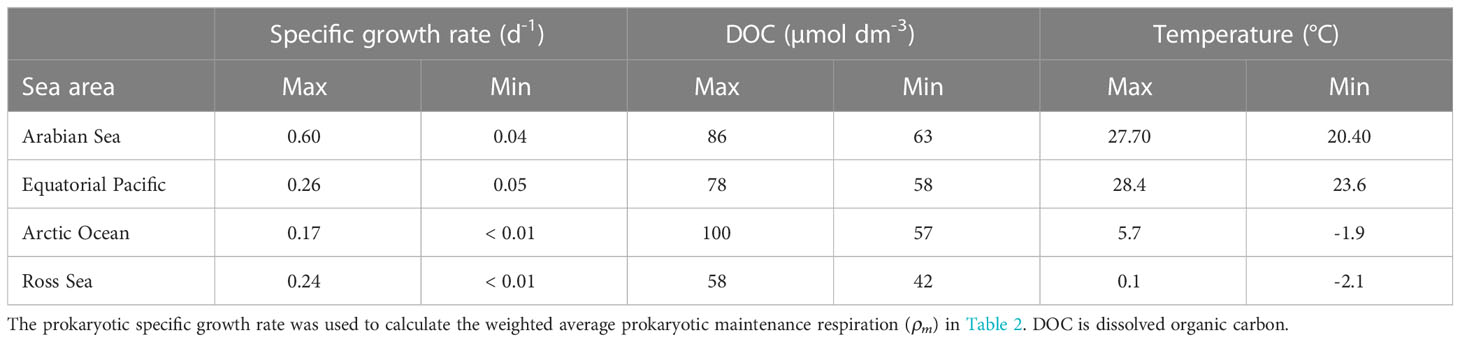
Table 3 Data are derived from Kirchman (2016) and indicate the productivity level in each environment.
A significant relationship between specific respiration and explanatory variables is rare in the literature, especially on an absolute scale (c.f. “Introduction”, Williams, 1998; Carlson et al., 2007). We demonstrated significant relationships between µ and ρ over a salinity gradient with a 10-fold range. The dominating dependence of ρ on µ is remarkable given the multiple factors that may govern prokaryotic growth and respiration. The quality of carbon substrates and the stoichiometric ratio of carbon, nitrogen and phosphorus are just two factors potentially contributing with variance to the relationship (Daufresne et al., 2008). In addition, the taxonomic composition of prokaryotes also varies markedly across the Baltic salinity gradient and across depth layers (Hagström et al., 2000; Herlemann et al., 2011; Dupont et al., 2014). The Baltic salinity gradient and depth layers are covered by our field samples and both variation in substrates and prokaryote community composition potentially contribute with variance. Despite these environmental differences, the observed relationships showed that µ was a strong predictor of ρ and thereby a composite measure of the prokaryotic growth rate in the sea, across various nutrient conditions and prokaryotic species compositions. Indeed, the relationship is valid even for model prokaryotes from other environments, as found in earlier eco-physiological studies (i.e., soil bacterium Klebsiella aerogenes, Neijssel and Tempest, 1976). We have also recently validated the field pattern between ρ and µ reported from the Bothnian Sea at low and high productivity under experimental control at the mesocosm scale, providing further confidence in the significance of maintenance respiration in the marine environment (Verma et al., 2022).
A recent article reporting lineage specific respiration rates provides valuable support for a ρ versus µ relationship (Munson-McGee et al., 2022). Despite a different methodological approach, support for the community relationships we report is found in their Figure 3B (doubling time reciprocal to µ) and 3c (assuming higher RNA:DNA ratio reflecting higher growth rates). Contribution from different lineages does not exclude a significant relationship between specific respiration and growth rate at the community level. Community relationships will be the summed product of lineage abundance and lineage-specific respiration rate, influenced by both maintenance and growth-related respiration. Community respiration rate measurements integrates the net outcome of these factors.
Taken together, we propose that the relationship between ρ and µ is universal for the prokaryotic domains, validating a general application of the prevailing theory for prokaryotic energy metabolism and maintenance respiration (Neijssel and Tempest, 1976; Pirt, 1982). An increase of the number of samples per site is, however, recommended to elevate the statistical power, as the slope estimate of the Bothnian Sea was not statistically different from the other sites despite a relatively large difference. Even if estimation of the y-intercept and its confidence interval is mathematically correct, it involves an extrapolation from the used data set. By using low field rates for prokaryotic growth in the y-estimation we minimized the range of extrapolation, but extrapolation still add uncertainty to the estimate. Development of direct methods to estimate maintenance respiration should be a future aim.
The obtained relationships between µ and ρ provided the first estimates of maintenance respiration in the field, as no other estimates in natural samples are reported to our knowledge. The 6-fold variation in maintenance respiration (0.12-0.62 fmol O2 cell-1) shows that environmental conditions can markedly influence this process. This result plausibly implies influence of regulating factors on prokaryotic respiration associated with maintenance respiration in addition to those considered for growth related respiration. In addition, this mean that respiratory demand from maintenance activities significantly reduces realized growth rates in the field. A comparison to maintenance rates observed in cultures can be derived using the cell carbon density in this study (16 fg C cell-1 and assuming 50% carbon [dry weight]-1) and the maintenance respiration rates inferred from (Neijssel and Tempest (1976), their Figure 5). The derived ρm in the field comprised 10-40% of the rate in their carbon-limited culture. Given the differences between natural marine prokaryotic communities and axenic cultures with Klebsiella aerogenes in a rich medium, the comparability of values provides some validity of our estimates.
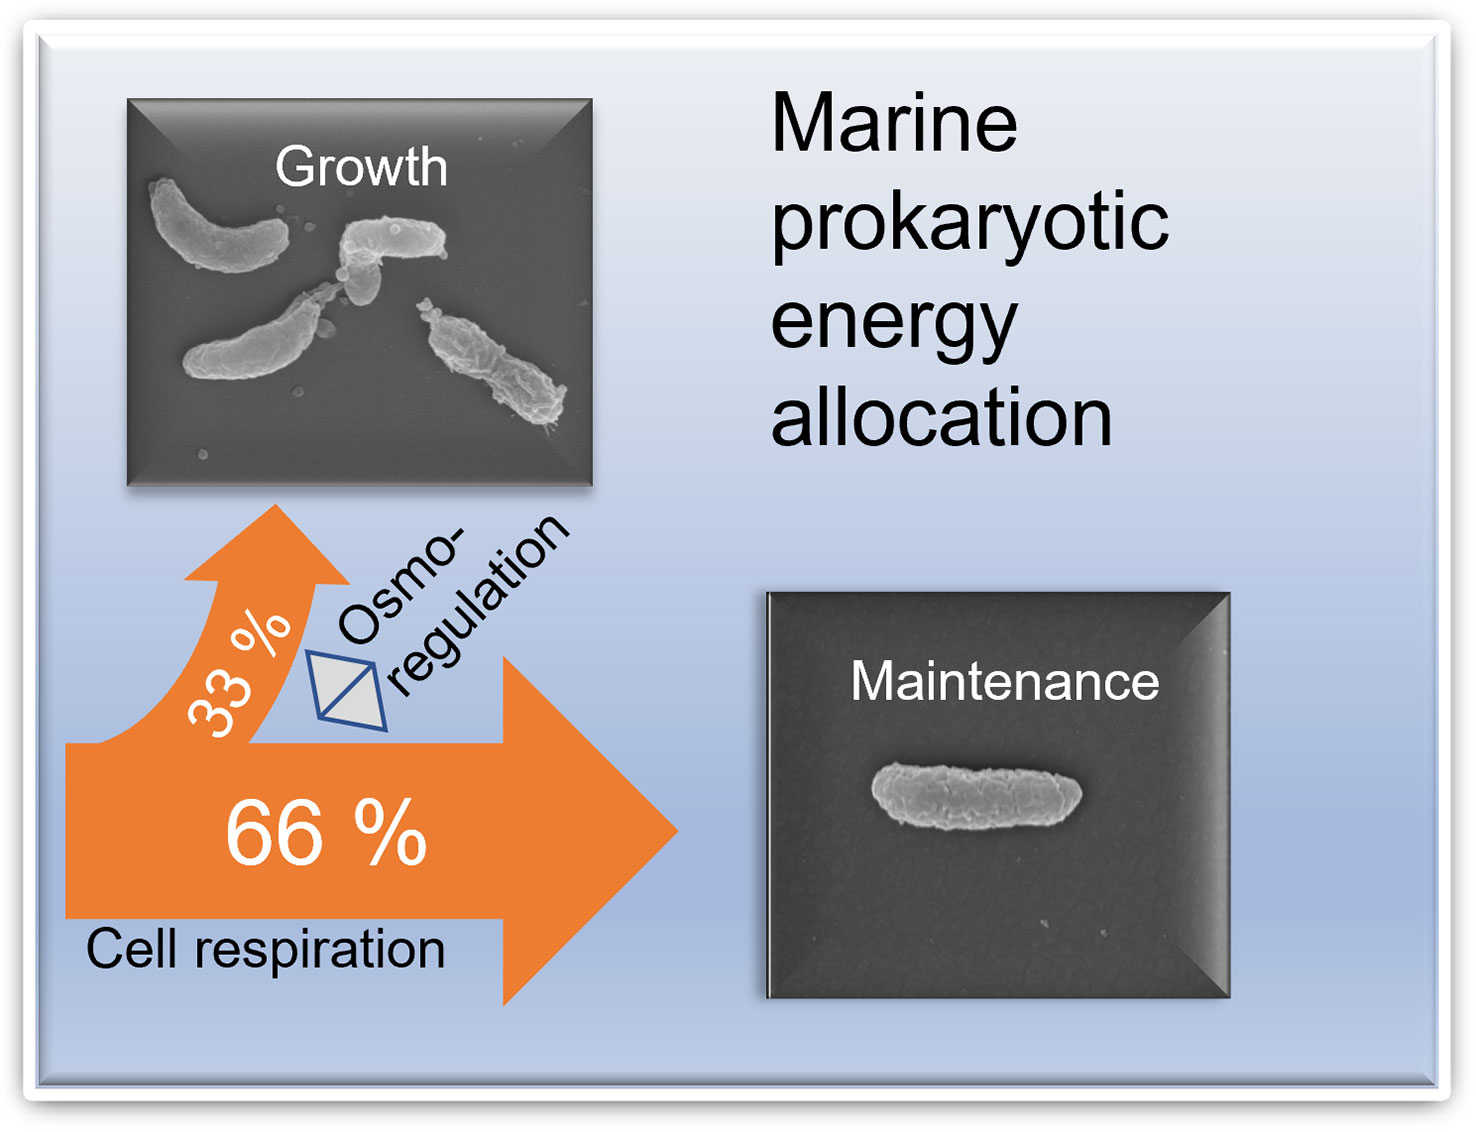
Figure 5 Conceptual image of the share of maintenance respiration of prokaryotic cells in the sea. Osmoregulation was shown to be a significant maintenance activity. Upper left: Prokaryotic cells growing in late summer conditions and with a high specific growth rate. Lower right: Scanning electron microphotograph of prokaryotic cell growth under winter conditions and a low specific growth rate. Photographer: Ph.D., Ashish Verma.
The estimated influence of maintenance respiration on a global scale suggests that maintenance activities dominate prokaryotic respiration in the sea (Figure 5). The distribution of µ-values in our data set developing the model between µ and ρ matched the global data set of µ-values reported by Kirchman (2016), with some more low values in the latter (Figure 4).The global dataset used was still relatively limited in coverage of the ocean and represents only the mixed surface layer, which is expected to have a comparably high productivity. An even higher percentage of maintenance respiration should occur in the large volume of the ocean´s deep waters, where prokaryotic specific growth rates are lower (Reinthaler et al., 2010). We inferred from this that maintenance respiration and associated activities dominate prokaryotic life in the world’s oceans, and that osmoregulation is one of the more energy-demanding activities.
The dataset used to develop the model for estimating a global weighted average was comparable to the distribution of µ globally, and the NE Atlantic environment setting parameter values had similar characteristics (Tables 1, 2, 4). The range of dissolved organic (DOC) concentrations supplying ρ in the studied marine area was comparable to reported oceanic values (Kirchman et al., 2009). Consequently, we argue that the greater temperature range and the slightly lower DOC values of the global data set (Kirchman, 2016) than that in our study, did not reduce the confidence in our estimate of ρm/ρ (Tables 2, 3, 4). The prokaryotic specific growth rate adequately represented the realized growth conditions governed by composite factors across various environments. Our estimate of the relationship between ρ and µ for the NE Atlantic environment therefore seemed relevant for upscaling to a first global estimate of the importance of maintenance respiration.
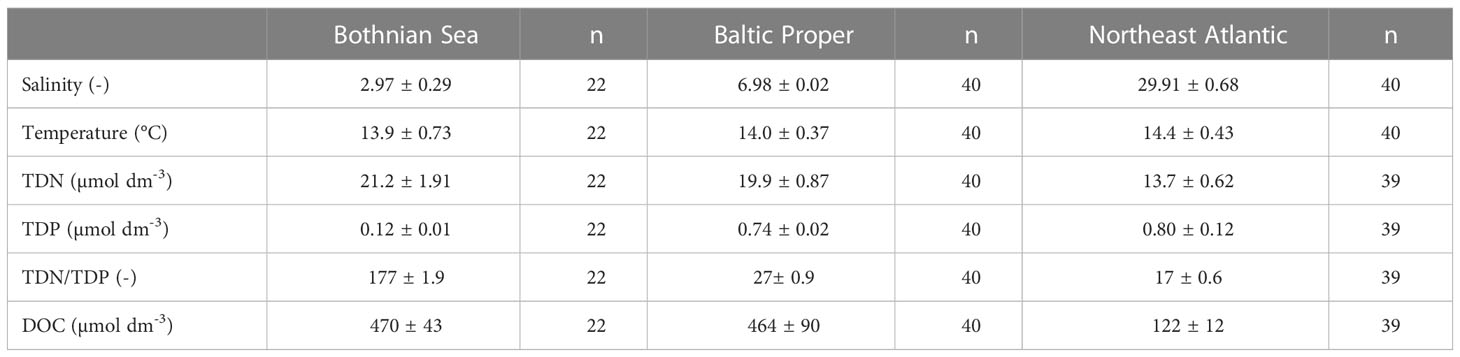
Table 4 Dataset means ± standard errors for the investigated surface water is shown.
A clear limitation of the global data coverage was the focus on surface waters. Reports compiling data on deep-water estimates of prokaryotic variables and especially ρ are scarce as research has been focused on the productive surface layer (Kirchman, 2008). However, current estimates of photosynthetic carbon fixation and prokaryotic growth indicate a lower µ in the ocean´s interior (Reinthaler et al., 2010), and therefore, a higher contribution from ρm to prokaryotic respiration is expected according to Figure 3.
The calculation of the influence of ρm on ρ assumes that ρm does not vary significantly with the specific growth rate in the sea. Models based on single-cell cultures predict a growth-dependent maintenance component but are opposite in direction depending on the study. That is, the Pirt model (Pirt, 1982) suggests that maintenance respiration decreases with increasing µ, suggesting that our calculation of ρm/ρ represents an overestimate. In contrast, the Van Bodegom model (van Bodegom, 2007) suggests that ρm increases with increasing µ (i.e., our calculation would represent an underestimate). However, the conditions in nature are more complex than model assumptions, with communities of prokaryotes using various nutrient blends and taxonomic compositions. Our assumption of negligible dependence of ρm on ρ is therefore a fair compromise of the current understanding of the growth dependence of maintenance respiration but introduces uncertainty in our estimates.
The estimates showed that maintenance respiration can vary from a minor share (29%) to a dominating influence (72%) of prokaryotic respiration depending on the environment. A salinity of 7 is closest to the physiological osmolarity of Escherichia coli, as deduced from a maximum growth rate at 300 mOsm dm-3 in minimal medium (Record et al., 1998). This osmolarity correspond to a salinity of 9 using 1100 mOsm dm-3 for sea water (Yancey et al., 2014). Assuming this to be applicable to marine prokaryotes, the least energy then needs to be spent by the cell to maintain the osmotic pressure at the Baltic Proper salinity. The low requirement for maintenance respiration at a salinity of 7 is thereby in line with the hypothesis that osmoregulation is one of the main maintenance activities explaining a large share of maintenance respiration in prokaryotes (Tempest and Neijssel, 1984, Figure 2). The observed variation of µ with salinity in the environment corresponds to the prediction based on study of Escherichia coli µ at different osmolarity (by NaCl manipulation) in minimal medium (Record et al., 1998, their Figure 1) Their review also presents the multitude of thermodynamically demanding osmo-regulating actions made by the cell to maintain favorable solute condition in the cyto- and periplasm. Indeed, Dupont et al. (2014) concluded that the large difference in central metabolism required at low and high salinity dictates phylogenetic differentiation of bacteria over the Baltic gradient. Our observation of significantly higher maintenance respiration at high salinity is in accordance with this and proposes osmoregulation, causing high maintenance respiration, as one of the central metabolic processes driving speciation. Salinity as a selective factor for prokaryotes has not been recognized to the same extent as for eukaryotes and metazoans (Snoeijs-Leijonmalm, 2017). We cannot formulate a similarly rational explanation for the nonlinear relationship between maintenance respiration and ecosystem primary productivity.
The average µ value for the sites also seemed influenced by a maintenance cost due to salinity, as no direct dependence on primary productivity was observed (Table 1). The relationship between ecosystem productivity and µ is expected to be linear and positive (Cole et al.,1988). Lower µ outside optimum salinity was, however, in accordance with expected salinity dependance in E. coli (Record et al., 1998). Temperature effects (including cold adaptations) are not applicable to this analysis, as the temperature was similar at approximately 14°C between the sites during the investigations (Table 2). However, confounding variables include lower concentrations of DOC and total nitrogen in the NE Atlantic that may have contributed to the higher ρm. Similarly, low TDP concentration and thus high TDN/TDP ratio could have influenced the elevated ρm in the Bothnian Sea. The tedious method to derive estimates of maintenance respiration imposes limited data coverage of the salinity gradient in our study. The evidence for osmoregulation should therefore be viewed as tentative. Our results do therefore not exclude that the two other forwarded main maintenance activities, turnover of macromolecules and spilling reactions, can be significant in natural environments. This report should motivate future concerted research efforts to increase the database for understanding the regulation of maintenance respiration.
What are the consequences of a high share of maintenance respiration for managing hypoxia and CO2 emissions? Prokaryotic oxygen consumption and CO2 emissions become less coupled to growth control at high influence by maintenance respiration. One biogeochemical consequence is that reducing growth by growth limiting nutrient reductions (e.g., N, P, Fe) may not lead to a corresponding reduction in oxygen consumption or CO2 emissions (Vikström and Wikner, 2019; Vikström et al., 2020). Pelagic respiration can mainly operate solely on organic carbon and other energy substrates removing CO2 form the sea and counteracting the biological carbon pump (Guidi et al., 2016). Therefore, measures aiming to alleviate hypoxia and CO2 emissions need to reduce the abundance of prokaryotes and protozoa and/or their maintenance activities. In productive environments with higher growth rates, however, a reduction of limiting nutrients should still result in a proportional reduction in both oxygen consumption and CO2 emissions due to reduction in growth of both prokaryotes and other plankton (Duarte and Agusti, 1998).
The ability of a prokaryote to be competitive regarding maintenance activities is important for evolutionary fitness, ecological interactions, and biogeochemical impact, constituting two-thirds or more of their energy expenditure (Figure 5). We argue that studies on maintenance activities require increased attention to advance our understanding of marine prokaryotic evolution and their biogeochemical and ecological performance. The dominant maintenance activities identified in the literature are osmoregulation, turnover of macromolecules, energy spilling reactions, cell motility and defense against O2 stress (van Bodegom, 2007). Maintenance activities are thereby crucial for maintaining the intracellular concentrations of solutes, functionality of enzymes, securing genetic information translation, foraging for nutrients, and coping with chemical stressors. Consequently, the limiting factors of maintenance activities will be different from those controlling growth. We advocate that future research should be directed to increase the understanding of maintenance activities in the field.
Several stations were sampled in the Baltic Proper and Northeast Atlantic in September (Figure S1). Samples were collected with Niskin (deep samples) or Ruttner (shallow samples) bottles between depths of 1 m and 70 m. Temperature and salinity were measured with a calibrated CTD probe (AAQ1186-H, Alec electronics, Japan (Baltic proper), Seabird SBE 19plus, USA (NE Atlantic)). For both areas, 10 depths were sampled in duplicate (N = 20), transported to the laboratory in dark cold boxes (within 1-3 h) and prefiltered (Millipore 142-mm polycarbonate filters, pore size 1.2 µm) at 13 kPa vacuum prior to respiration and prokaryotic production measurements. Measurements were taken from distinct samples in all cases. To have a consistent methodology throughout the three areas presented, the dataset from the Bothnia Sea (Vikström and Wikner, 2019) was included and reanalyzed using the same statistical approach as that used for the other two datasets.
Prokaryotic community respiration was measured, and rates were derived according to developed sensor methodology, improving the measurability and precision (Vikström et al., 2019). Respiration rates were measured in filtered samples (described under the sampling section) incubated in dark conditions (irradiation below the detection limit,< 0.04 μmol m–2 s–1) to specifically target prokaryote respiration. Some picocyanobacteria can occur in 1.2 µm filtrates but should not produce oxygen in the dark (Glover et al., 1986). They should however contribute to oxygen consumption. In short, filtered samples were carefully poured into 1dm3 glass bottles and sealed by specially designed stoppers with Aanderaa 4330 oxygen optodes attached. Incubation was performed for 12-24 hours under stirring (magnetic stirrer at 80 rpm) in temperature-controlled baths set to in situ temperature and equipped with a cooler to increase the control of temperature (± 0.1°C). The prokaryotic community respiration rate was derived from the incubation start by linear or nonlinear derivation depending on the observed dynamics. Values were divided by the prokaryotic abundance for each sample to obtain specific prokaryotic respiration rates (ρ) used for the analysis of maintenance respiration.
Prokaryotic abundance samples were collected in 50cm3 Falcon tubes and preserved using 37% formaldehyde (2% final concentration). From these, 5cm3 aliquots were stained with acridine orange (10 mmol dm-3, Sigma–Aldrich) on black filters (0.2µm pore size, Ø 25 mm, DHI). Abundances were then determined by automated image analysis using epifluorescence microscopy of acridine orange-stained cells (Hobbie et al., 1977; Blackburn et al., 1998) and calculated to carbon units using estimated cell volume and reported conversion functions (Simon and Azam, 1989; Norland, 1993). The extended measurement uncertainty (2 × standard error) for prokaryotic abundance was ± 23%.
Prokaryotic community growth rates were determined using 3H-thymidine incorporation into DNA (Smith and Azam, 1992) (2 mm3, 79 mCi mmol-1, 25 nmol dm-3 final concentration: GE Healthcare, Buckinghamshire, UK). Triplicate subsamples were incubated for 1 h, including triplicate controls, where growth was stopped by adding 100 mm3 ice-cold TCA (50%). A conversion factor from thymidine uptake to cells produced of 1.5 ×10¹⁸ cells [mol thymidine]-1 was applied (Wikner and Hagström, 1999). The extended measurement uncertainty (2 × standard error) for the prokaryotic community growth rate was ±14%. To comply with current models on maintenance respiration, the prokaryotic per cell growth rate (µ) was calculated by dividing estimated rates with the prokaryotic abundance.
For the total dissolved nutrient analysis, 13cm3 prefiltered sample water was filtered through 0.2µm Milli-Q rinsed sterile filters (0.2 µm, 32 mm Ø, Supor filters, Pall Corporation) prior to oxidation using potassium peroxodisulfate oxidation. Samples were stored at room temperature after autoclaving and analyzed within one month after sampling. The analyses were performed by the accredited standard operating procedure at Umeå Marine Sciences Centre following Grasshoff et al. (1999) using a four-channel autoanalyser (QuAAtro Marine, Bran & Luebbe®, Sweden). The median variation coefficient for the method was estimated to be ± 2.1% for total dissolved phosphorus (TDP) and ± 8.2% for total dissolved nitrogen (TDN) in samples from the same depth. As controls, Milli-Q samples were filtered and analyzed with the same procedure.
Dissolved organic carbon (DOC) was analyzed using duplicate 30-cm3 samples prefiltered in the same way as the nutrient samples. The samples were acidified with HCl to an approximate pH of 4 and stored at 8°C. The DOC concentration for each sample was determined using a high-temperature catalytic oxidation instrument with nondispersive infrared (NDIR) detection and a TOC-L instrument (Schimadzu Corporation, Kyoto, Japan) (Sugimura and Suzuki, 1988; Norrman, 1993). The median variation estimated for this methodology was ± 2.2% for replicated DOC samples at the same depth.
Primary production estimates for the different sea areas during August were derived from the literature and associated data deposits (SMHI, 2016; Tiselius et al., 2016; Vikström et al., 2020). Data quality was assured prior to statistical analysis using IBM SPSS (v. 24). In total, 3 incubations were unsuccessful, showing unclear declines in oxygen. Additionally, the slope of the oxygen decline was below the established detection limit for nonreplicated rates (Vikström et al., 2019), resulting in an additional 14 samples being excluded. Several tests were performed in the Explore module of IBM SPSS (v. 24) to assess the data distribution prior to data analysis.
The Pirt model (Pirt, 1982) for relating µ to ρ was simplified by combining m’ and m1 to an ρm quantity (Vikström and Wikner, 2019). The resulting model
was applied to field data, where ρ is the specific prokaryotic respiration rate, ρm is the sum of constant (m1) and growth rate-dependent (m´) maintenance respiration and µ is the specific growth rate. The level of maintenance respiration (ρm) in the natural environment was subsequently estimated as the y-axis intercept of a linear regression (µ vs. ρ) for each environment (Pirt, 1982; Vikström and Wikner, 2019). To facilitate interpretation of the slope coefficient b (Eq.1), it corresponds to the expression
in the Pirt-model, where Yg is the maximum growth yield, m´ is the growth rate-dependent maintenance respiration and µ´m is the observed maximum specific growth rate. The slope of the relationship thereby indicates the effort of the cell to increase the specific growth rate by one unit (Eq. 2), meaning that a low slope value imply good growth condition and a high slope imply poor condition.
To derive the y-intercept (i.e., x=0) in absolute units, data were kept untransformed for both ρ and µ. Additionally, outliers were identified using Cook´s distance, resulting in a reduction of data by 2 points in the Bothnian Sea, 2 points in the Baltic Proper and 4 points in the NE Atlantic. ρm, the y-intercept, was determined using a linear regression model II considering variation in both the ρ and the µ variables (see Figure 1). All estimates of uncertainties were based on two-sided tests.
The relative influence of ρm in each environment was calculated as a weighted average of the ρm/ρ quotient (ρmA/ρA), where the fraction of µ values in each bin (0.02 d-1 intervals) constituted the weight factor according to the environment-specific histogram (Equation 3, Figures 2, 3) (Vikström and Wikner, 2019).
where fh is the fraction of values in each µ-bin (i.e., calculated from a histogram), encompassing the range of µ values observed. The influence of ρm on the oceanic scale was calculated in the same way but using the model II regression coefficients obtained for the Northeast Atlantic area and the µ values extracted from Figure 1 in Kirchman (2016). The web plot digitalizing tool available online (https://automeris.io/WebPlotDigitizer/) was used for data extraction and cross-referencing the averages reported within the original article.
Differences in specific growth rate between sites was tested by an independent samples median-test with Bonferroni correction for multiple samples IBM SPSS (v. 24). Specific respiration rates were tested by One-way analysis of variance using test for homogeneity of variances. Significantly different variances advocated use of Tamhane´s Post-Hoc test for pair-wise differences.
The original contributions presented in the study are included in the article/Supplementary Material. Further inquiries can be directed to the corresponding author.
JW designed and planned the study, performed field sampling measured growth rates, quality assured, analyzed and evaluated data, and was the main author of the manuscript. KV planned the study, performed field sampling measured respiration rates, quality assured, made statistical analyses and evaluated data, and was the co-author of the manuscript. Both authors contributed to the article and approved the submitted version.
Field sampling and sample processing were made possible by the crew at the Swedish Coast Guard, technical staff at Linneaus Microbial Observatory, Linneaus University, the Kristineberg Center for Marine Research & Innovation, Gothenburg University and the Umeå Marine Sciences Centre, Umeå University. Primary production data was provided by Swedish environmental monitoring program performed by the institutes above, the Swedish Meteorological and Hydrological Institute, and funded by the Swedish Agency for Marine and Water management. Electron microscopy photographs were kindly provided by Ashish Verma, Ph. D using the SciLife microscopy infrastructure at Umeå Core facility for Electron Microscopy. This is a contribution from Umeå Centre for Microbial Research (UCMR). The study was funded by the Kempe Foundation (SMK-1854) and the EcoChange strategic program (224-919-09) (JW).
The authors declare that the research was conducted in the absence of any commercial or financial relationships that could be construed as a potential conflict of interest.
All claims expressed in this article are solely those of the authors and do not necessarily represent those of their affiliated organizations, or those of the publisher, the editors and the reviewers. Any product that may be evaluated in this article, or claim that may be made by its manufacturer, is not guaranteed or endorsed by the publisher.
The Supplementary Material for this article can be found online at: https://www.frontiersin.org/articles/10.3389/fmars.2023.1070070/full#supplementary-material
Apple J. K., del Giorgio P. A., Kemp W. M. (2006). Temperature regulation of bacterial production, respiration, and growth efficiency in a temperate salt-marsh estuary. Aquat. Microbial Ecol. 43 (3), 243–254. doi: 10.3354/ame043243
Blackburn N., Hagström Å., Wikner J., Cuadros Hansson R., Bjørnsen P. (1998). Rapid determination of bacterial abundance, biovolume, morphology and growth by neural network-based image analysis. Appl. Environ. Microbiol. 64 (9), 3246–3255. doi: 10.1128/aem.64.9.3246-3255
Blight S. P., Bentley T. L., Lefevre D., Robinson C., Rodrigues R., Rowlands J., et al. (1995). Phasing of autotrophic and heterotrophic plankton metabolism in a temperate coastal ecosystem. Mar. Ecology-Progress Ser. 128 (1-3), 61–75. doi: 10.3354/meps128061
Carlson C. A., del Giorgio P. A., Herndl G. J. (2007). Microbes and the dissipation of energy and respiration: From cells to ecosystems. Oceanography 20 (2), 89–100. doi: 10.5670/oceanog.2007.52
Cole J. J., Findlay S., Pace M.L. (1988). Bacterial production in fresh and saltwater ecosystems - a cross-system overview. Marine Ecology Progress Series 43(1-2), 1–10. doi: 10.3354/meps043001
Daufresne T., Lacroix G., Benhaim D., Loreau M. (2008). Coexistence of algae and bacteria: a test of the carbon hypothesis. Aquat. Microbial Ecol. 53 (3), 323–332. doi: 10.3354/ame01254
del Giorgio P. A., Cole J. J., Cimbleris A. (1997a). Respiration rates in bacteria exceed phytoplankton production in unproductive aquatic systems. Nature 385, 148–151. doi: 10.1038/385148a0
del Giorgio P. A., Condon R., Bouvier T., Longnecker K., Bouvier C., Sherr E., et al. (2011). Coherent patterns in bacterial growth, growth efficiency, and leucine metabolism along a northeastern pacific inshore-offshore transect. Limnology Oceanography 56 (1), 1–16. doi: 10.4319/lo.2011.56.1.0001
del Giorgio P. A., Pace M. L., Fischer D. (2006). Relationship of bacterial growth efficiency to spatial variation in bacterial activity in the Hudson river. Aquat. Microbial Ecol. 45 (1), 55–67. doi: 10.3354/ame045055
del Giorgio P. A., Prarie Y. T., Bird D. F. (1997b). Coupling between rates of bacterial production and the abundance of metabolically active bacteria in lakes, enumerated using CTC reduction and flow cytometry. Microbial Ecol. 34, 144–154.
Duarte C. M., Agusti S. (1998). The CO2 balance of unproductive aquatic ecosystems. Science 281 (5374), 234–236. doi: 10.1126/science.281.5374.234
Dupont C. L., Larsson J., Yooseph S., Ininbergs K., Goll J., Asplund-Samuelsson J., et al. (2014). Functional tradeoffs underpin salinity-driven divergence in microbial community composition. PLoS One 9 (2), 1–17. doi: 10.1371/journal.pone.0089549
Glover H. E., Campbell L., Prezelin B. B. (1986). Contribution of Synechococcus spp to size-fractionated primary productivity in 3 water masses ion the Northwest Atlantic-ocean. Mar. Biol. 91 (2), 193–203. doi: 10.1007/bf00569435
Guidi L., Chaffron S., Bittner L., Eveillard D., Larhlimi A., Roux S., et al. (2016). Plankton networks driving carbon export in the oligotrophic ocean. Nature 532 (7600), 465–470. doi: 10.1038/nature16942
Hagström A., Pinhassi J., Zweifel U. L. (2000). Biogeographical diversity among marine bacterioplankton. Aquat. Microbial Ecol. 21 (3), 231–244. doi: 10.3354/ame021231
Herlemann D. P. R., Labrenz M., Jürgens K., Bertilsson S., Waniek J. J., Andersson A. F. (2011). Transitions in bacterial communities along the 2000 km salinity gradient of the Baltic Sea. ISME J. 5 (10), 1571–1579. doi: 10.1038/ismej.2011.41
Hobbie J. E., Daley R. J., Jasper S. (1977). Use of nuclepore filters for counting bacteria by fluorescence microscopy. Appl. Environ. Microbiol. 33, 1225–1228. doi: 10.1128/aem.33.5.1225-1228
Hoch P. M., Kirchman L. D. (1993). Seasonal and inter-annual variability in bacterial production and biomass in a temperate estuary. Mar. Ecol. Prog. Ser. 98, 283–295. doi: 10.3354/meps098283
Kirchman D. L. (2008). “Introduction and overview,” in Microbial ecology of the oceans, 2nd ed. Ed. Kirchman D. L. (Hoboken: John Wiley & Sons, Inc).
Kirchman D. L. (2016). “Growth rates of microbes in the oceans,” in Annual review of marine science, vol. 8 . Eds. Carlson C. A., Giovannoni S. J., (San Mateo, USA:Annual Reviews) 285–309.
Kirchman D. L., Morán X. A. G., Ducklow H. (2009). Microbial growth in the polar oceans – role of temperature and potential impact of climate change. Nat. Rev. Microbiol. 7 (6), 451–459. doi: 10.1038/nrmicro2115
Lemée R., Rochelle-Newall E., Van Wambeke F., Pizay M. D., Rinaldi P., Gattuso J. P. (2002). Seasonal variation of bacterial production, respiration and growth efficiency in the open NW Mediterranean Sea. Aquat. Microbial Ecol. 29 (3), 227–237. doi: 10.3354/ame029227
López-Urrutia A., Morán X. A. G. (2007). Resource limitation of bacterial production distorts the temperature dependence of oceanic carbon cycling. Ecology 88 (4), 817–822. doi: 10.1890/06-1641
Manzoni S., Taylor P., Richter A., Porporato A., Agren G. I. (2012). Environmental and stoichiometric controls on microbial carbon-use efficiency in soils. New Phytol. 196 (1), 79–91. doi: 10.1111/j.1469-8137.2012.04225.x
Munson-McGee J. H., Lindsay M. R., Sintes E., Brown J. M., D’Angelo T., Brown J., et al. (2022). Decoupling of respiration rates and abundance in marine prokaryoplankton. Nature 612, 764–770. doi: 10.1038/s41586-022-05505-3
Neijssel O. M., Tempest D. W. (1976). Bioenergetic aspects of aerobic growth of Klebsiella aerogenes NCTC 418 in carbon-limited and carbon-sufficient chemostat culture. Arch. Microbiol. 107 (2), 215–221. doi: 10.1007/bf00446843
Norland S. (1993). “The relationship between biomass and volume of bacteria,” in Handbook of methods in aquatic microbial ecology. Eds. Kemp P. F., Sherr B. F., Sherr E. B., Cole J. J. (Boca Raton: Lewis Publishers), 303–307.
Norrman B. (1993). Filtration of water samples for DOC studies. Mar. Chem. 41, 239–242. doi: 10.1016/0304-4203(93)90125-8
Oschlies A., Brandt P., Stramma L., Schmidtko S. (2018). Drivers and mechanisms of ocean deoxygenation. Nat. Geosci. 11 (7), 467–473. doi: 10.1038/s41561-018-0152-2
Pirt S. J. (1982). Maintenance energy: a general model for energy-limited and energy-sufficient growth. Arch. Microbiol. 133, 300–302. doi: 10.1007/BF00521294
Preen K., Kirchman D. L. (2004). Microbial respiration and production in the Delaware estuary. Aquat. Microbial Ecol. 37 (2), 109–119. doi: 10.3354/ame037109
Record M. T. Jr., Courtenay E. S., Cayley D. S., Guttman H. J. (1998). Responses of E. coli to osmotic stress: large changes in amounts of cytoplasmic solutes and water. Trends Biochem. Sci. 23 (4), 143–148. doi: 10.1016/S0968-0004(98)01196-7
Reinthaler T., Herndl G. J. (2005). Seasonal dynamics of bacterial growth efficiencies in relation to phytoplankton in the southern north Sea. Aquat. Microbial Ecol. 39 (1), 7–16. doi: 10.3354/ame039007
Reinthaler T., van Aken H. M., Herndl G. J. (2010). Major contribution of autotrophy to microbial carbon cycling in the deep north atlantic's interior. Deep-Sea Res. Part II-Topical Stud. Oceanography 57 (16), 1572–1580. doi: 10.1016/j.dsr2.2010.02.023
Robinson C., Williams P. J. l. (2005). “Respiration and it´s measurement in surface marine waters,” in Respiration in aquatic ecosystems. Eds. del Giorgio P. A., Williams P. J. (Oxford: Oxford University Press), 147–180.
Russell J. B., Cook G. M. (1995). Energetics of bacterial growth: Balance of anabolic and catabolic reactions. Microbiological Rev. 59 (1), 48–62. doi: 10.1128/MMBR.59.1.48-62.1995
Simon M., Azam F. (1989). Protein content and protein synthesis rates of planktonic marine bacteria. Mar. Ecol. Prog. Ser. 51, 201–213. doi: 10.3354/meps051201
SMHI (2016) Swedish Meteorological and hydrological institute, Swedish oceanographic data center (SwedODC) (Norrköping, Sweden: SMHI). Available at: http://www.smhi.se/en/services/open-data/search-smhi-s-open-data-1.81004 (Accessed 2016).
Smith D. C., Azam F. (1992). A simple, economical method for measuring bacterial protein synthesis rates in seawater using 3H-leucine. Mar. Microbial Food webs 6 (2), 107–114. doi: 10.1016/j.mimet.2007.06.020
Smith E. M., Prairie Y. T. (2004). Bacterial metabolism and growth efficiency in lakes: The importance of phosphorus availability. Limnology Oceanography 49 (1), 137–147. doi: 10.4319/lo.2004.49.1.0137
Snoeijs-Leijonmalm P. (2017). “Patterns of biodiversity,” in Biological oceanography of the Baltic Sea, 1 ed. Eds. Snoeijs-Leijonmalm P., Schubert H., Radziejewska T. (Dordrecht: Springer Science+Business Media), 123–191.
Sugimura Y., Suzuki Y. (1988). A high-temperature catalytic oxidation method for determination of non-volatile dissolved organic carbon in sea water by direct injection of a liquid sample. Mar. Chem. 24 (2), 105–131. doi: 10.1016/0304-4203(88)90043-6
Tempest D. W., Neijssel O. M. (1984). The status of yatp and maintenance energy as biologically interpretable phenomena. Annu. Rev. Microbiol. 38, 459–486. doi: 10.1146/annurev.mi.38.100184.002331
Tiselius P., Belgrano A., Andersson L., Lindahl O. (2016). Primary productivity in a coastal ecosystem: a trophic perspective on a long-term time series. J. Plankton Res. 38 (4), 1092–1102. doi: 10.1093/plankt/fbv094
van Bodegom P. (2007). Microbial maintenance: A critical review on its quantification. Microbial Ecol. 53 (4), 513–523. doi: 10.1007/s00248-006-9049-5
Verma A., Amnebrink D., Pinhassi J., Wikner J. (2022). Prokaryotic maintenance respiration and growth efficiency field patterns reproduced by temperature and nutrient control at mesocosm scale. Environ. Microbiol. 1-17. doi: 10.1111/1462-2920.16300
Vikström K., Bartl I., Karlsson J., Wikner J. (2020). Strong influence of baseline respiration in an oligotrophic coastal ecosystem. Front. Mar. Sci. 7 (839). doi: 10.3389/fmars.2020.572070
Vikström K., Tengberg A., Wikner J. (2019). Improved accuracy of optode-based oxygen consumption measurements by removal of system drift and nonlinear derivation. Limnology Oceanography: Methods 17 (3), 179–189. doi: 10.1002/lom3.10297
Vikström K., Wikner J. (2019). Importance of bacterial maintenance respiration in a subarctic estuary: a proof of concept from the field. Microbial Ecol. 77 (3), 574–586. doi: 10.1007/s00248-018-1244-7
Wasmund N., Andrushaitis A., Łysiak-Pastuszak E., Müller-Karulis B., Bausch G., Neumann T., et al. (2001). Trophic status of the south-eastern Baltic Sea: A comparison of coastal and open areas. Estuar. Coast. Shelf Sci. 53, 849–864. doi: 10.1006/ecss.2001.0828
Wikner J., Hagström Å. (1999). Bacterioplankton intra-annual variability at various allochthonous loading: Importance of hydrography and competition. Aquat. Microbial Ecol. 20, 245–260. doi: 10.3354/ame020245
Williams P. J. l. (1998). The balance of plankton respiration and photosynthesis in the open oceans. Nature 394 (6688), 55–57. doi: 10.1038/27878
Keywords: CO2, bacterioplankton, regulation, oxygen, respiration, growth, maintenance, salinity
Citation: Wikner J and Vikström K (2023) Extensive prokaryotic maintenance respiration in the sea influenced by osmoregulation. Front. Mar. Sci. 10:1070070. doi: 10.3389/fmars.2023.1070070
Received: 14 October 2022; Accepted: 23 February 2023;
Published: 10 March 2023.
Edited by:
Pedro De Jesus Mendes, University of Algarve, PortugalReviewed by:
Mario Uchimiya, University of Georgia, United StatesCopyright © 2023 Wikner and Vikström. This is an open-access article distributed under the terms of the Creative Commons Attribution License (CC BY). The use, distribution or reproduction in other forums is permitted, provided the original author(s) and the copyright owner(s) are credited and that the original publication in this journal is cited, in accordance with accepted academic practice. No use, distribution or reproduction is permitted which does not comply with these terms.
*Correspondence: Johan Wikner, am9oYW4ud2lrbmVyQHVtdS5zZQ==
Disclaimer: All claims expressed in this article are solely those of the authors and do not necessarily represent those of their affiliated organizations, or those of the publisher, the editors and the reviewers. Any product that may be evaluated in this article or claim that may be made by its manufacturer is not guaranteed or endorsed by the publisher.
Research integrity at Frontiers
Learn more about the work of our research integrity team to safeguard the quality of each article we publish.