 José M. R. Alves
 Pedro M.A. Miranda
 Rui M.A. Caldeira
- 1Oceanic Observatory of Madeira - Agência Regional para o Desenvolvimento da Investigação, Tecnologia e Inovação, Funchal, Portugal
- 2Faculdade de Ciências, Institute Dom Luiz, University of Lisbon, Lisboa, Portugal
- 3Faculty of Life Sciences, University of Madeira, Funchal, Portugal
The role of low-level jets in the intra-seasonal variability of the Canary upwelling system during summer is assessed with a fully coupled, high resolution (3km) ocean-atmosphere numerical simulation. Here, low-level jets include the main continental coastal jet, the tip jets of Madeira and the tip-jets of the steep Canary Islands. The coastline shape, orography of northwest Africa and the proximity of Canary islands lead to complex interactions between the jets, that result in strong surface wind intra-seasonal variability on the multiweek time scale. That variability is forced by oscillations in the shape and position of the Azores subtropical anticyclone, through a strong oscillation in the atmospheric boundary layer height. At the coast, coastal-trapped oscillations with a propagation speed, planetary boundary height, offshore extension, and surface pressure compatible with a Kelvin wave occasionally propagate northward, against the synoptic scale surface pressure. While similar processes have already been observed in California, the mechanisms here described appear to result from interactions of continental coastal processes with a set of steep islands close to the coast. The sensitivity of these dynamics to climate change is a challenging question.
1 Introduction
The CANary Upwelling System (hereafter CANUS) extending from Cape Finisterre at the northwest tip of Iberia near 43 °N to Cape Blanc in the Africa northwest coast near 21°N (Figure 1A) is one of the major coastal upwelling systems in the world (e.g., Barton et al., 1998; Mason et al., 2011; Vazquez et al, 2022). Near its northern limit, offshore Iberia, upwelling only occurs in the boreal summer and is episodic, whereas it is restricted to the boreal winter near the southern edge (Aristegui et al., 2009). This seasonality is associated with a large-scale migration of the Azores subtropical anticyclone, reinforced by the variability of the continental Heat Low over the Sahara region, and of the non-permanent summer Heat Low in Iberia. The dynamics of these systems is not well understood. While the Heat Lows are essentially locked in position by geographical constraints, they can vary in intensity at sub-seasonal time scales. The anticyclone, however, can move freely in the NE-northeast Atlantic basin, responding to forcing from different external origins, and probably driving the regional variability in the CANUS.
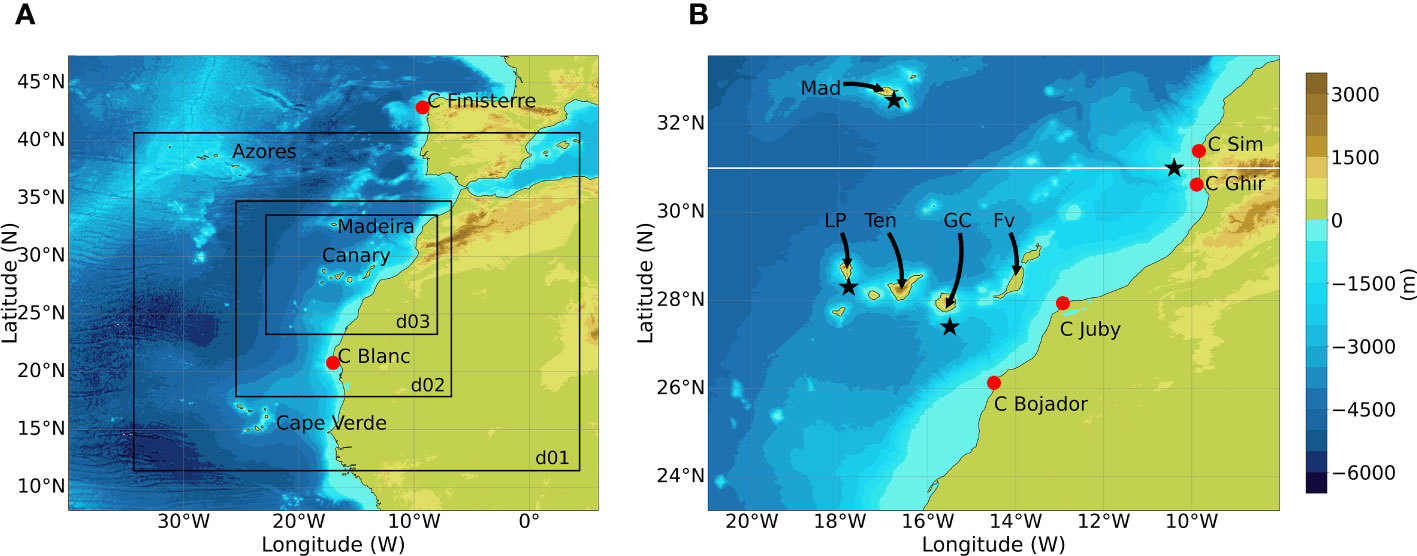
Figure 1 Topography and bathymetry from GEBCO (General Bathymetric Charts of the Oceans) 15 arc-second data. In panel (A) black rectangles represent geographic limits of the WRF domains. The outer domain (d01) with 27 km grid-spacing, and the inner ones with 9 (d02) and 3 kms (d03) grid spacing, respectively. The 9 and 3 kms grids are also common to ROMS. In panel (B) is shown the location of some islands (Mad- Madeira, LP- La Palma, Ten – Tenerife, GC- Gran Canaria, Fv- Fuerteventura). The location of main capes is shown with red points. White line at 31N parallel and black stars indicate regions where some analyses were done.
In the CANUS, upwelling is triggered by an almost coast-parallel wind with an intense northerly component. Such wind is favored at the eastern edge of the subtropical anticyclone and will be reinforced by thermal wind equilibrium in the presence of a hot continent. The combination of these two processes leads to the development of a coastal narrow zone of persistent and intensified wind, that define a coastal low-level jet (Beardsley et al., 1987), which is essential for coastal upwelling development. In the presence of islands with significant topography, tip jets will be established without (or even against) a thermal wind forcing (Ólafsson and Bougeault, 1997; Alves et al., 2020). If islands are close enough to the coast, as is the case, tip-jets and coastal jets may interact. Low level wind will also modulate the atmosphere-ocean fluxes of momentum, sensible and latent heat, and is a driving force of the Canary current flowing south-westwards along the African coast. Variability of the jets, at the coast and near the island tips, will perturb the upper ocean. In extreme cases, jets can affect the deep ocean (Pickart et al., 2003), constituting one of the few processes able to trigger deep ocean convection. In the subtropical climate, one expects more modest impacts, but in regions of high ecological and economical value, close to the islands and across the highly productive CANUS.
The dynamics of the major upwelling systems have been the subject of much research, motivated by the need to understand its variability (from sub-seasonal to decadal scales), in the context of climate change. Bakun (1990) identified a positive trend in ship-based observations, within different upwelling systems, a conclusion that has been supported by other studies with different methodologies (e.g., Schwing and Mendelssohn, 1997; Demarcq, 2009; Narayan et al., 2010; Alves and Miranda, 2013), including in simulations of future climate (Miranda et al., 2013; Bakun et al., 2015). The presence of much spatial and time variability in such systems raises, however, many questions concerning their response to changes in the atmospheric circulation and the problem is still open to discussion (Barton et al., 2013; Bograd et al., 2023).
In coastal upwelling systems the atmospheric flow creates an intense positive coastal wind-stress curl that is far from being uniform along the coast. Instead, it is characterized by strong spatiotemporal heterogeneities, due to the compression bulges and the expansion fans frequently observed on the upwind and downwind sides of the main capes, respectively (Perlin et al., 2011). The cross-shore wind profile, sometimes described as the wind drop-off, responds to a combination of various thermodynamical processes (e.g., Boé et al., 2011; Perlin et al., 2011; Desbiolles et al., 2014). At the California coast, Renault et al. (2016a) identified a strong dependency of the offshore wind shape on the coastal orography, coastline orientation and land-sea drag contrast, and to a lower extent on the cooler coastal Sea Surface Temperature (hereafter SST), which may have a stabilizing effect on the lower layers of the air column. The coastal wind heterogeneities are frequently not well represented in satellite data or in atmospheric reanalyses, due to the lack of spatial and temporal resolution. Consequently, when these are used directly to force the ocean surface in high resolution ocean numerical simulations, they may lead to a misrepresentation of the Ekman pumping, offshore transport, associated eddy activity and consequently of the biogeochemical response (Capet et al., 2004; Renault et al., 2016b).
The atmosphere-ocean interaction around Madeira Island was studied with a coupled model, for conditions in the summer 2017 (Alves et al., 2020), which coincided with a period of stronger than usual summer wind. Simulations were performed at resolutions down to 1km, for both the atmosphere and ocean. Miranda et al. (2021) proceeded to an atmosphere-only simulation at 3km grid-spacing, forced by ERA5 boundary conditions for the entire 1979-2018 period, finding evidence of a strong intra-seasonal oscillation in the summer circulation around Madeira and, more importantly, of a multidecadal trend in the regional circulation associated with a progressive lowering of the atmospheric boundary layer height. Alves et al. (2021) used results from the previous study to one-way force a 35-year ocean simulation and identified an asymmetric response of the local ocean to the atmospheric forcing.
Fully coupled atmosphere-ocean simulations at high resolution constitute the best tool to understand the processes driving the variability in CANUS, distinctive from others coastal upwelling systems. These include not only tip jets, but also island wakes (Caldeira et al., 2005; Grubišic´ et al., 2015), vortex shedding (e.g., Aristegui et al., 1994; Caldeira et al., 2002), and the corresponding wind and currents structures mutual interactions.
The main aim of this study is to assess the intra-seasonal variability of the Africa coastal low-level jet and of the tip-jets generated by the Canary and Madeira archipelagos, with a high resolution (3 km) ocean-atmosphere numerical simulation. This is particularly relevant in a region of intense gradients, for an improved knowledge of coastal thermodynamical processes linked to the jets. The impact of jets in the lower atmosphere and upper ocean variability is assessed through the analysis of oscillations in the PBL height, the occurrence of transient northward coastal trapped events along the NE Africa coast and oscillations in the Azores anticyclone.
While this study focuses on the regional circulation, it may also be relevant at a larger scale, as some of the effects with origin near the islands are observed in basin spatial scales (Xie et al., 2001). Moreover, it is estimated that upper ocean vertical velocities associated with small scale features, as those observed in the lee side of islands, are comparable in magnitude to the vertical velocities forced by the basin-scale wind stress curl (Chelton et al., 2004). The extended and lasting effects of isolated islands in the lower atmosphere and upper ocean may indicate that an upscale effect needs to be considered in global coupled simulations, which eventually would reduce some of the systematic errors observed in these simulations (Bock et al., 2020).
The study is organized as follows: section 2 describes the setup of numerical experiments; section 3 presents some comparisons against remote sensing and in-situ observations; section 4 discusses the main results; conclusions are presented in section 5.
2 Setup of numerical simulations
The simulation that follows uses the Coupled-Ocean-Atmosphere-Wave-Sediment-Transport (COAWST) modeling system (Warner et al., 2010), combining the atmospheric Weather Research and Forecasting model (WRF v4.2.2, Skamarock et al., 2008) with the Regional Ocean Modeling System model (ROMS v3.9, Shchepetkin and McWilliams, 2005). Before the 2-way coupled simulation, ROMS went through a 5-year (2014-2018) spin-up simulation forced by ERA5 atmospheric data (Hersbach et al., 2020), including 3-hourly fields of near surface wind, temperature, pressure, relative humidity, precipitation, net shortwave radiation and net longwave radiation.
Ocean boundary conditions (in both the spin-up and the main run) were taken every 24h from a global eddy resolving (1/12°) reanalysis (GLORYS12V1, Lellouche et al., 2021), which in 2019 was forced by ERA5. The coupled simulation started on 1st January 2019, but only the summer months July-August-September (hereafter JAS) were analyzed, due to the known jet’s higher intensity during this season (Alves et al., 2021). ROMS used the HSMIT horizontal and vertical advection schemes (Wu and Zhu, 2010). For the boundaries a Chapman condition was used for the free surface (Chapman, 1985), a Shchepetkin condition (Mason et al., 2010) was applied to barotropic (2D) currents and a radiation-nudging condition (Marchesiello et al., 2001) to baroclinic (3D) currents. Tidal forcing was included with 10 tidal constituents (M2, S2, N2, K2, K1, O1, P1, Q1, Mf, Mm) from the TPX09 global model (Egbert and Erofeeva, 2002). WRF used the following parameterizations: the WRF Single-Moment 6-class microphysics scheme (Hong and Lim, 2006); the Kain-Fritch cumulus scheme (Kain and Fritsch, 1990; Kain, 2004) for convective parameterization; the rapid radiative transfer model (RRTM) (Mlawer et al., 1997) for longwave radiation; the Dudhia scheme for shortwave radiation (Dudhia, 1989); the Noah scheme (Chen and Dudhia, 2001) for land surface, the Monin-Obukhov Similarity scheme (Obukhov, 1946; Monin and Obukhov, 1954) for the surface layer and the Grenier-Bretherton-McCaa (GBM) scheme (Bretherton et al., 2004) for the planetary boundary layer. The latter was chosen due to its superior performance in ocean-atmosphere interaction studies (Perlin et al., 2014; Samelson et al., 2020).
The model was configured with 3 nested grids with approximately 27, 9 and 3 km horizontal grid-spacing for the atmosphere, and 2 nested grids with approximately 9 and 3 km, for the ocean. All grids use a Mercator projection. For the vertical discretization, WRF uses 50 hybrid vertical levels, and ROMS 40 sigma-levels, both with increasing resolution near the ocean surface. This grid-spacing and nesting permitted a smooth dynamical downscaling from the nearly 30 km atmospheric ERA5 data and from the 1/12° GLORYS ocean reanalysis, to the region of interest in this study, the 3 km inner domain, represented in Figure 1A. This domain encompasses a central section of the CANUS, and the Madeira and Canaries archipelagos. In WRF and ROMS the location of 9 and 3 km grids is very similar, but to account for minor differences between atmospheric and oceanic grid cells we used the Spherical Coordinate Remapping and Interpolation Package (SCRIP, Jones, 1999) to generate interpolation weights for remapping fields among computational grids. In the coupled simulation, the data is transferred every 30 minutes between models, with the Model Coupler Toolkit (MCT, Larson et al., 2005). For a description of the coupling procedures and of the variables exchanged between models, the reader is referred to Warner et al. (2008). To accurately represent the orography, we used the Shuttle Radar Topography Mission (SRTM) 3 arc-second data and for the bathymetry the 15 arc-second General Bathymetric Chart of the Oceans (GEBCO) data (Tozer et al., 2019).
In the model domain, the highest continental coastal orography is observed near 30°N, with maximum altitude around 2000 m within 100 km of the coastline, corresponding to the southwest limit of the Atlas Mountains (Figure 1). Besides this region, in the 3 km domain, the coastal orography is relatively smooth. Figure 1B shows the location of the main capes (Sim, Ghir, Juby and Bojador), that in conjunction with the coastal orography and the presence of islands have a relevant role in coastal wind shape, as analyzed later. Madeira and some islands in the Canaries are steep obstacles to the atmospheric flow. In the ocean, their presence is associated with important bathymetric features in the coastal platform, and with steep subsurface slopes near the island edges and near some prominent submarine mountains. For instance, one major canyon is noted, near Cape Ghir. All these bathymetric features may be relevant for ocean eddy generation, by conservation of potential vorticity.
3 Simulations accuracy
3.1 Summer wind and SST
Remote sensed SST and surface wind are used to verify the model accuracy. Wind observations are from the Advanced Scatterometer (ASCAT) ascending path dataset, on an approximately 12 km grid (Verhoef et al., 2012). The analysis of SST uses the Multi-scale Ultra-high Resolution (MUR) dataset, that is made of foundation night SST values, with a daily periodicity, on a 0.01° grid. It comprises MODIS, AVHRR, microwave and in-situ retrievals. A comprehensive description of MUR can be found in Chin et al. (2017). Both wind and SST are compared on the model grid, by interpolating the 12 km satellite wind product and averaging the 0.01° SST satellite product.
Wind and SST results are presented, side by side, in Figure 2. Qualitatively, the mean WRF wind taken at 00h UTC (Figure 2B) is very similar to the ASCAT-12 km field (Figure 2A), with strong signatures of the coastal jet at Cape Ghir, and of tip jets downstream of Madeira and of the main Canary Islands. WRF wind speed bias (Figure 2C) is below ±0.5 m.s-1 away from the coasts, slightly negative in the wakes and the upstream blocked flow of the islands, slightly positive in the tip jets and on the African coast. These differences mean that WRF perceives a slightly higher impact from topography on the wind field than observed by ASCAT, which is consistent with its higher resolution and with known ASCAT sampling issues near the coast. It is important to mention that a gap free satellite product that is available on a 0.25° grid (Bentamy et al., 2021) fails to represent the tip jets in some islands, smoothing out almost all jet-like features (not shown). To further assess the realism of the simulated surface wind, we compared it with data from two meteorological stations of the Portuguese Institute for Sea and Atmosphere (IPMA) located near the East and West flanks of Madeira, which revealed a bias of -0.79 and -0.21 m.s-1 and a time correlation of 0.8 and 0.7, for the East and West meteorological stations, respectively. Moreover, the in-situ observed wind was also compared with satellite values and showed a similar or a higher bias than the one obtained with simulated data. For instance, in the West flank meteorological station the satellite bias is almost 3 m.s-1 higher than that of the modeling wind (see Figure S1). This seems to suggest that some of the difference between model and satellite based data, as seen in Figure 2C, could result from the lack of resolution of satellite data.
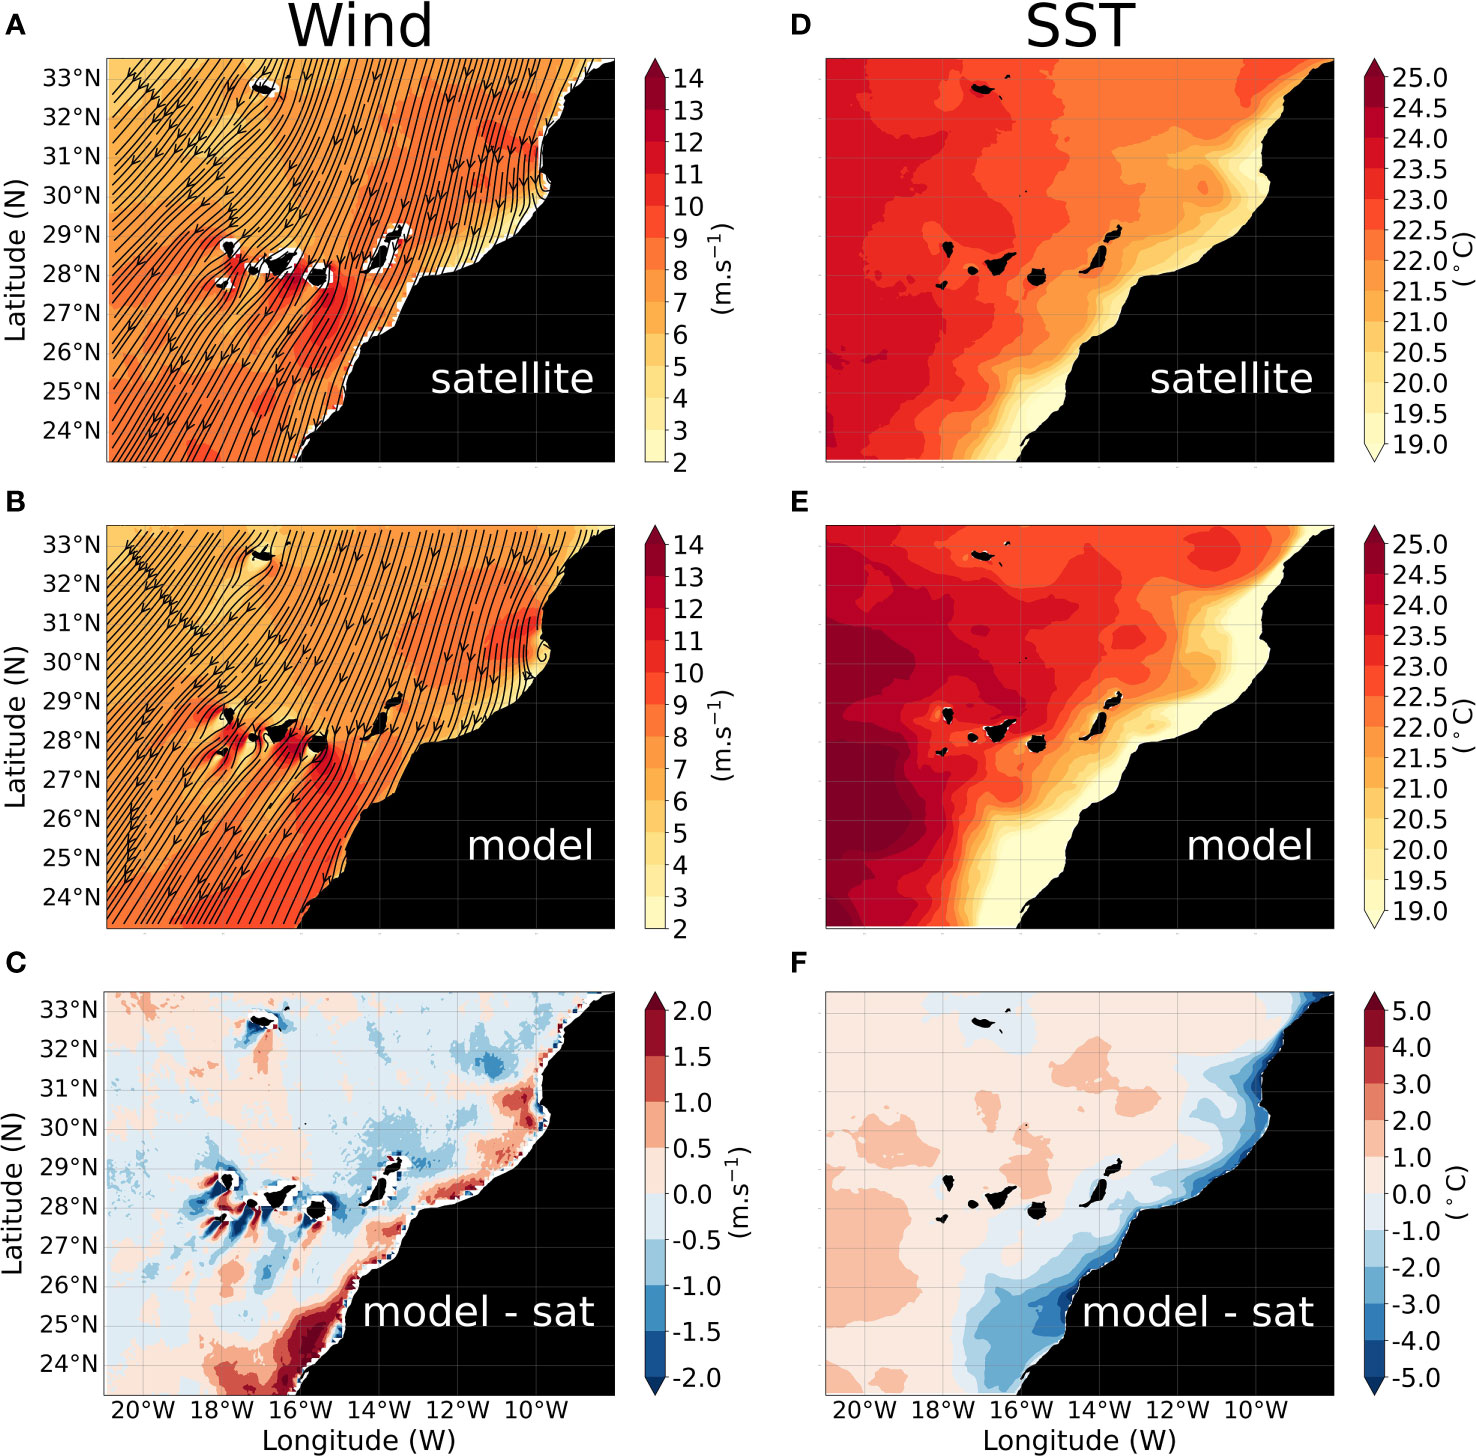
Figure 2 Mean surface wind in the model domain at 00 UTC: (A) remote sensing by ASCAT; (B) WRF at 3 km; (C) bias of the WRF simulation. Mean SST in the model domain at 00 UTC: (D) remote sensing by Multi-scale Ultra-high Resolution (MUR); (E) ROMS at 3 km; (F) bias of the ROMS simulation.
For SST, model results are taken at 00h UTC. Observations (Figure 2D) indicate a strong signature of coastal upwelling, with a persistent filament offshore Cape Ghir and a consistent zonal SST gradient perturbed by the presence of the islands. Coastal features in ROMS (Figure 2E) are qualitatively similar to observations (Figure 2D), but more intense. There is a small warm bias (Figure 2F) offshore, only slightly exceeding 1°C outside the Canary current. Near the coast there is, however, a stronger cold bias, exceeding -3°C, in places, that is consistent with the positive coastal wind bias, which result in an intensified upwelling. The coastal cold bias is possible also partially explained by the gap filling in the MUR dataset in the presence of low clouds, that tend to intensify in conditions of coastal upwelling (Samelson et al., 2021). Overall, the mean computed SST bias is +0.28°C. For SST validation, we also used in-situ data retrieved from oceanographic buoys maintained by Puertos del Estado Institute. The buoys are located near La Palma, Gran Canaria and Tenerife (see islands locations in Figure 1B), and revealed low cold biases of -0.30°C, -0.31°C and -0.54°C, respectively.
4 Discussion
4.1 Wind stress curl
The atmospheric flow drives the regional ocean circulation by wind stress, and the patterns of wind stress curl force regions of upwelling and downwelling in the coastal ocean. The simulated wind stress curl, represented in Figure 3, has a lot of small-scale noisy features, but is mostly characterized by a slight negative curl in regions away from coastal effects, a strong positive curl on the African coast, and strong dipolar features downstream of the islands. The background negative curl is the signature of the Azores subtropical anticyclone. The strong positive curl on the African coast is due to the cross-coast wind drop-off, as also found in other major upwelling systems, such as California (e.g., Renault et al., 2016a). A distinctive feature of the CANUS is the presence of islands with significant height, generating the strong curl dipoles, therefore confirming a rule of thumb in the upwelling near the islands by a -0.30 time-correlation between wind stress curl and SST nearby Gran Canaria west flank.
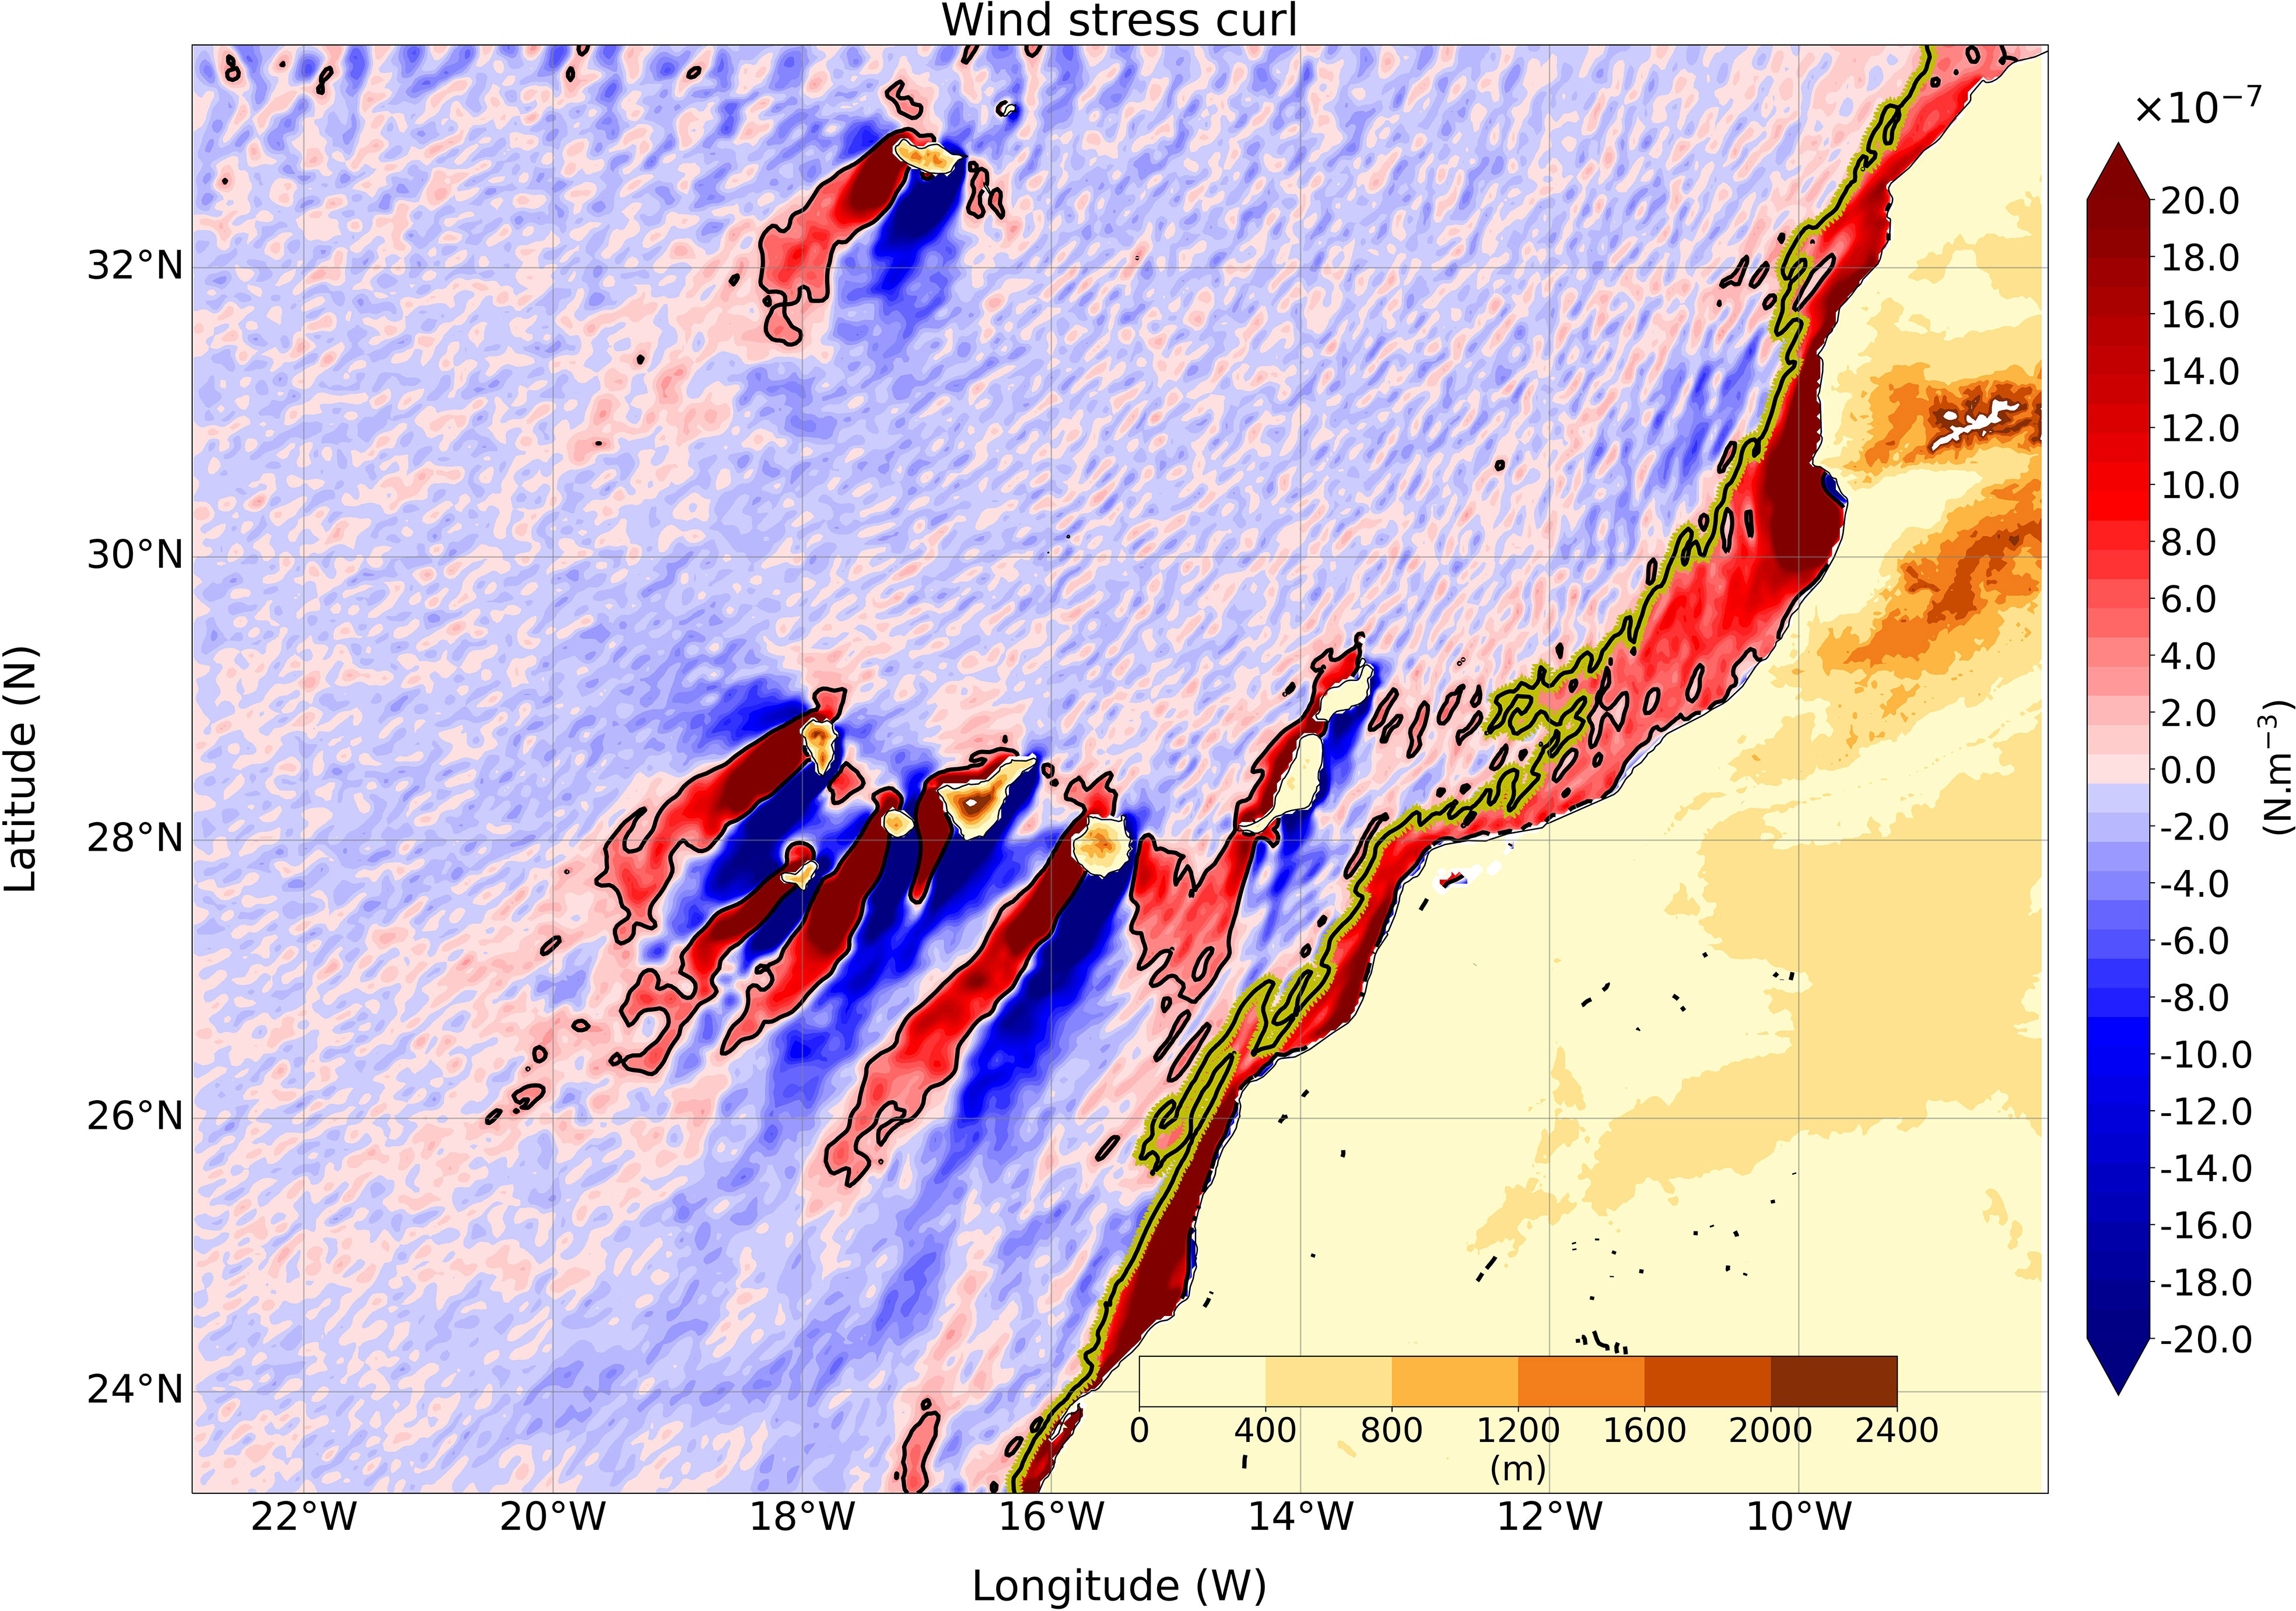
Figure 3 Mean summer (JAS) wind stress curl, after applying a 2D Gaussian filter, computed with simulated surface wind stress components at 00h UTC. Yellow-black line denotes the 3×10⁻⁷ N.m-3 contour line, used to define the wind drop-off length. Topography is represented over the continent and islands.
The offshore extension of the mean coastal positive curl anomaly is highly variable along the African coast, with potential impact in the regional ocean. Following Renault et al. (2016a), we define the wind drop-off extension as the distance from the coast of a reference contour line of the wind stress curl, here chosen as 3×10⁻⁷ N.m-3 (cf. Figure 3). Different processes may control that extension: coastal topography, coastline orientation in relation to the prevailing wind, and maybe transient processes occurring along the coast (Dorman, 1985; Beardsley et al., 1987; Dorman, 1987) or larger scale subtropical processes unconfined to the coast (Taylor et al., 2008). The maximum drop-off extension is found south of Cape Ghir, coinciding both, with the wake of the southern edge of the Atlas Mountains, and a significant perturbation of the coastline geometry. The latter has a direct impact on the wind direction relative to the coast, a parameter that will control the efficiency of Ekman pumping to generate upwelling. As shown in Figures 2A, B, C, E, the regions of intensified coastal upwelling coincide with sections of the coast which are almost parallel to the prevailing wind.
4.2 Heat fluxes
The spatial distributions of the summer mean latent and sensible heat fluxes (Figure 4) show the combined effect of coastal upwelling and low-level jets. Both fluxes are positive in the offshore region, where the ocean is warming and moistening the atmosphere. The latent heat flux presents maxima near most islands (except the two closest to the coast) coinciding with the tip jets and decreases to very low values close to the continental coast. The sensible heat flux is intensified in the Madeira eastern tip jet but is, however, very small near the Canaries and negative near the African coast, where the atmosphere is being cooled, indicating that the SST cooling by upwelling is more important than the increased transfer coefficients at the low-level jets.
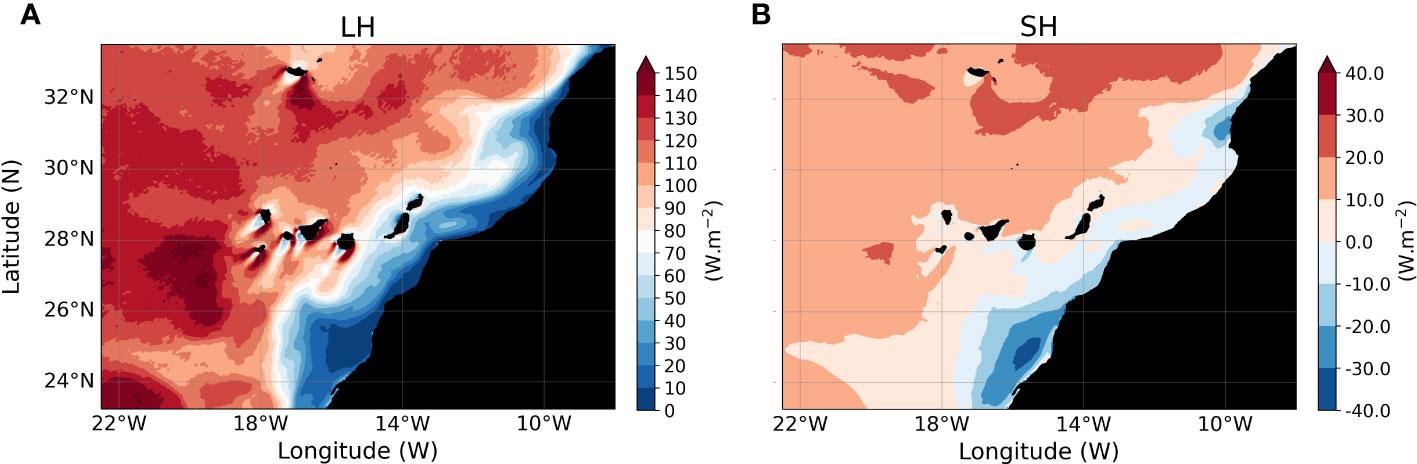
Figure 4 Summer (JAS) mean numerical simulated: (A) latent and (B) sensible heat fluxes at 00 UTC.
4.3 Planetary boundary layer height and mixed layer depth
The strong signature of both, the African coast and of the different islands, in the atmospheric circulation, with quasi-permanent maxima of low-level jets at preferred locations, even with time varying oscillations in their intensity, suggests the need to look at the spatial structure of the atmosphere and of the ocean boundary layers. The atmosphere-ocean interactions lead to a strongly perturbed mean spatial distribution of the boundary layer in the atmosphere (Figure 5A) and ocean (Figure 5B). The atmospheric PBL height varies widely from near 200 m in the more active upwelling spots on the African coast to near 1400 m in the NW of the domain, with PBL subsidence downstream of the islands and main capes. The ocean Mixed Layer Depth (MLD) is roughly a mirror image of the former, with deeper MLD in regions of stronger wind, where PBL height is lower, an indication of the role of wind stress in driving the vertical mixing in the upper ocean.
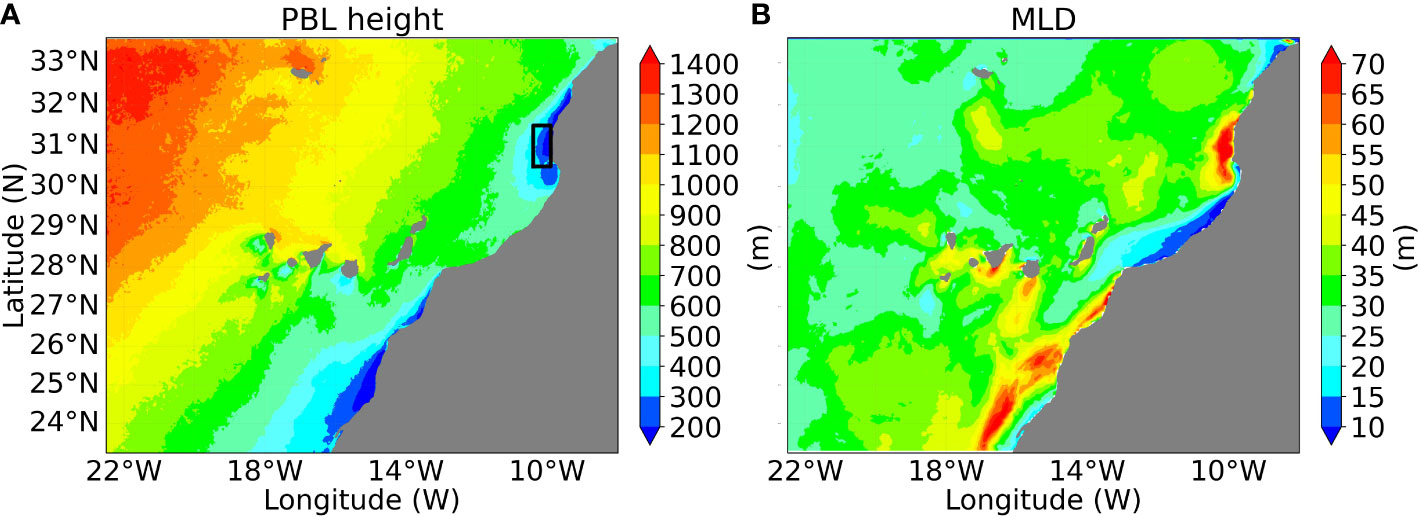
Figure 5 Summer (JAS) mean: (A) Planetary Boundary Layer height. Black rectangle near Cape Ghir shows region where the mean PBL height was taken to compute Kelvin wave phase speed; (B) Mixed Layer Depth. Values at 00h UTC. To compute the PBL height, it was considered the altitude where is attained the maximum of the square of Brunt-Väissälä frequency in the lower atmosphere. To compute the Mixed Layer Depth, it was considered a threshold of 0.3 kg.m-3 between the ocean surface density and the ocean density at the mixed layer depth.
4.4 Low-level jets variability
All major coastal upwelling systems develop low-level jets, usually observed at about 400m height (Lima et al., 2022), that eventually may interact with the islands jets. The focus here is in the intra-seasonal variability of those jets, directly associated with the corresponding variability of the underlying ocean. By intra-seasonal variability, we mean all variability with timescales less than 3 months. Miranda et al. (2021) found that, in the case of the Madeira tip jets, the variability is controlled by oscillations in the Azores Anticyclone, through a variability of the Planetary Boundary Layer (PBL) height at a time scale of weeks. Figures 6 and 7 show that such process extends throughout the Canary system, affecting both the tip jets of the different islands and the African coastal jet. While the jets are quasi-permanent features of the summer circulation, their intensity varies at week to multiweek time scales by a large factor.
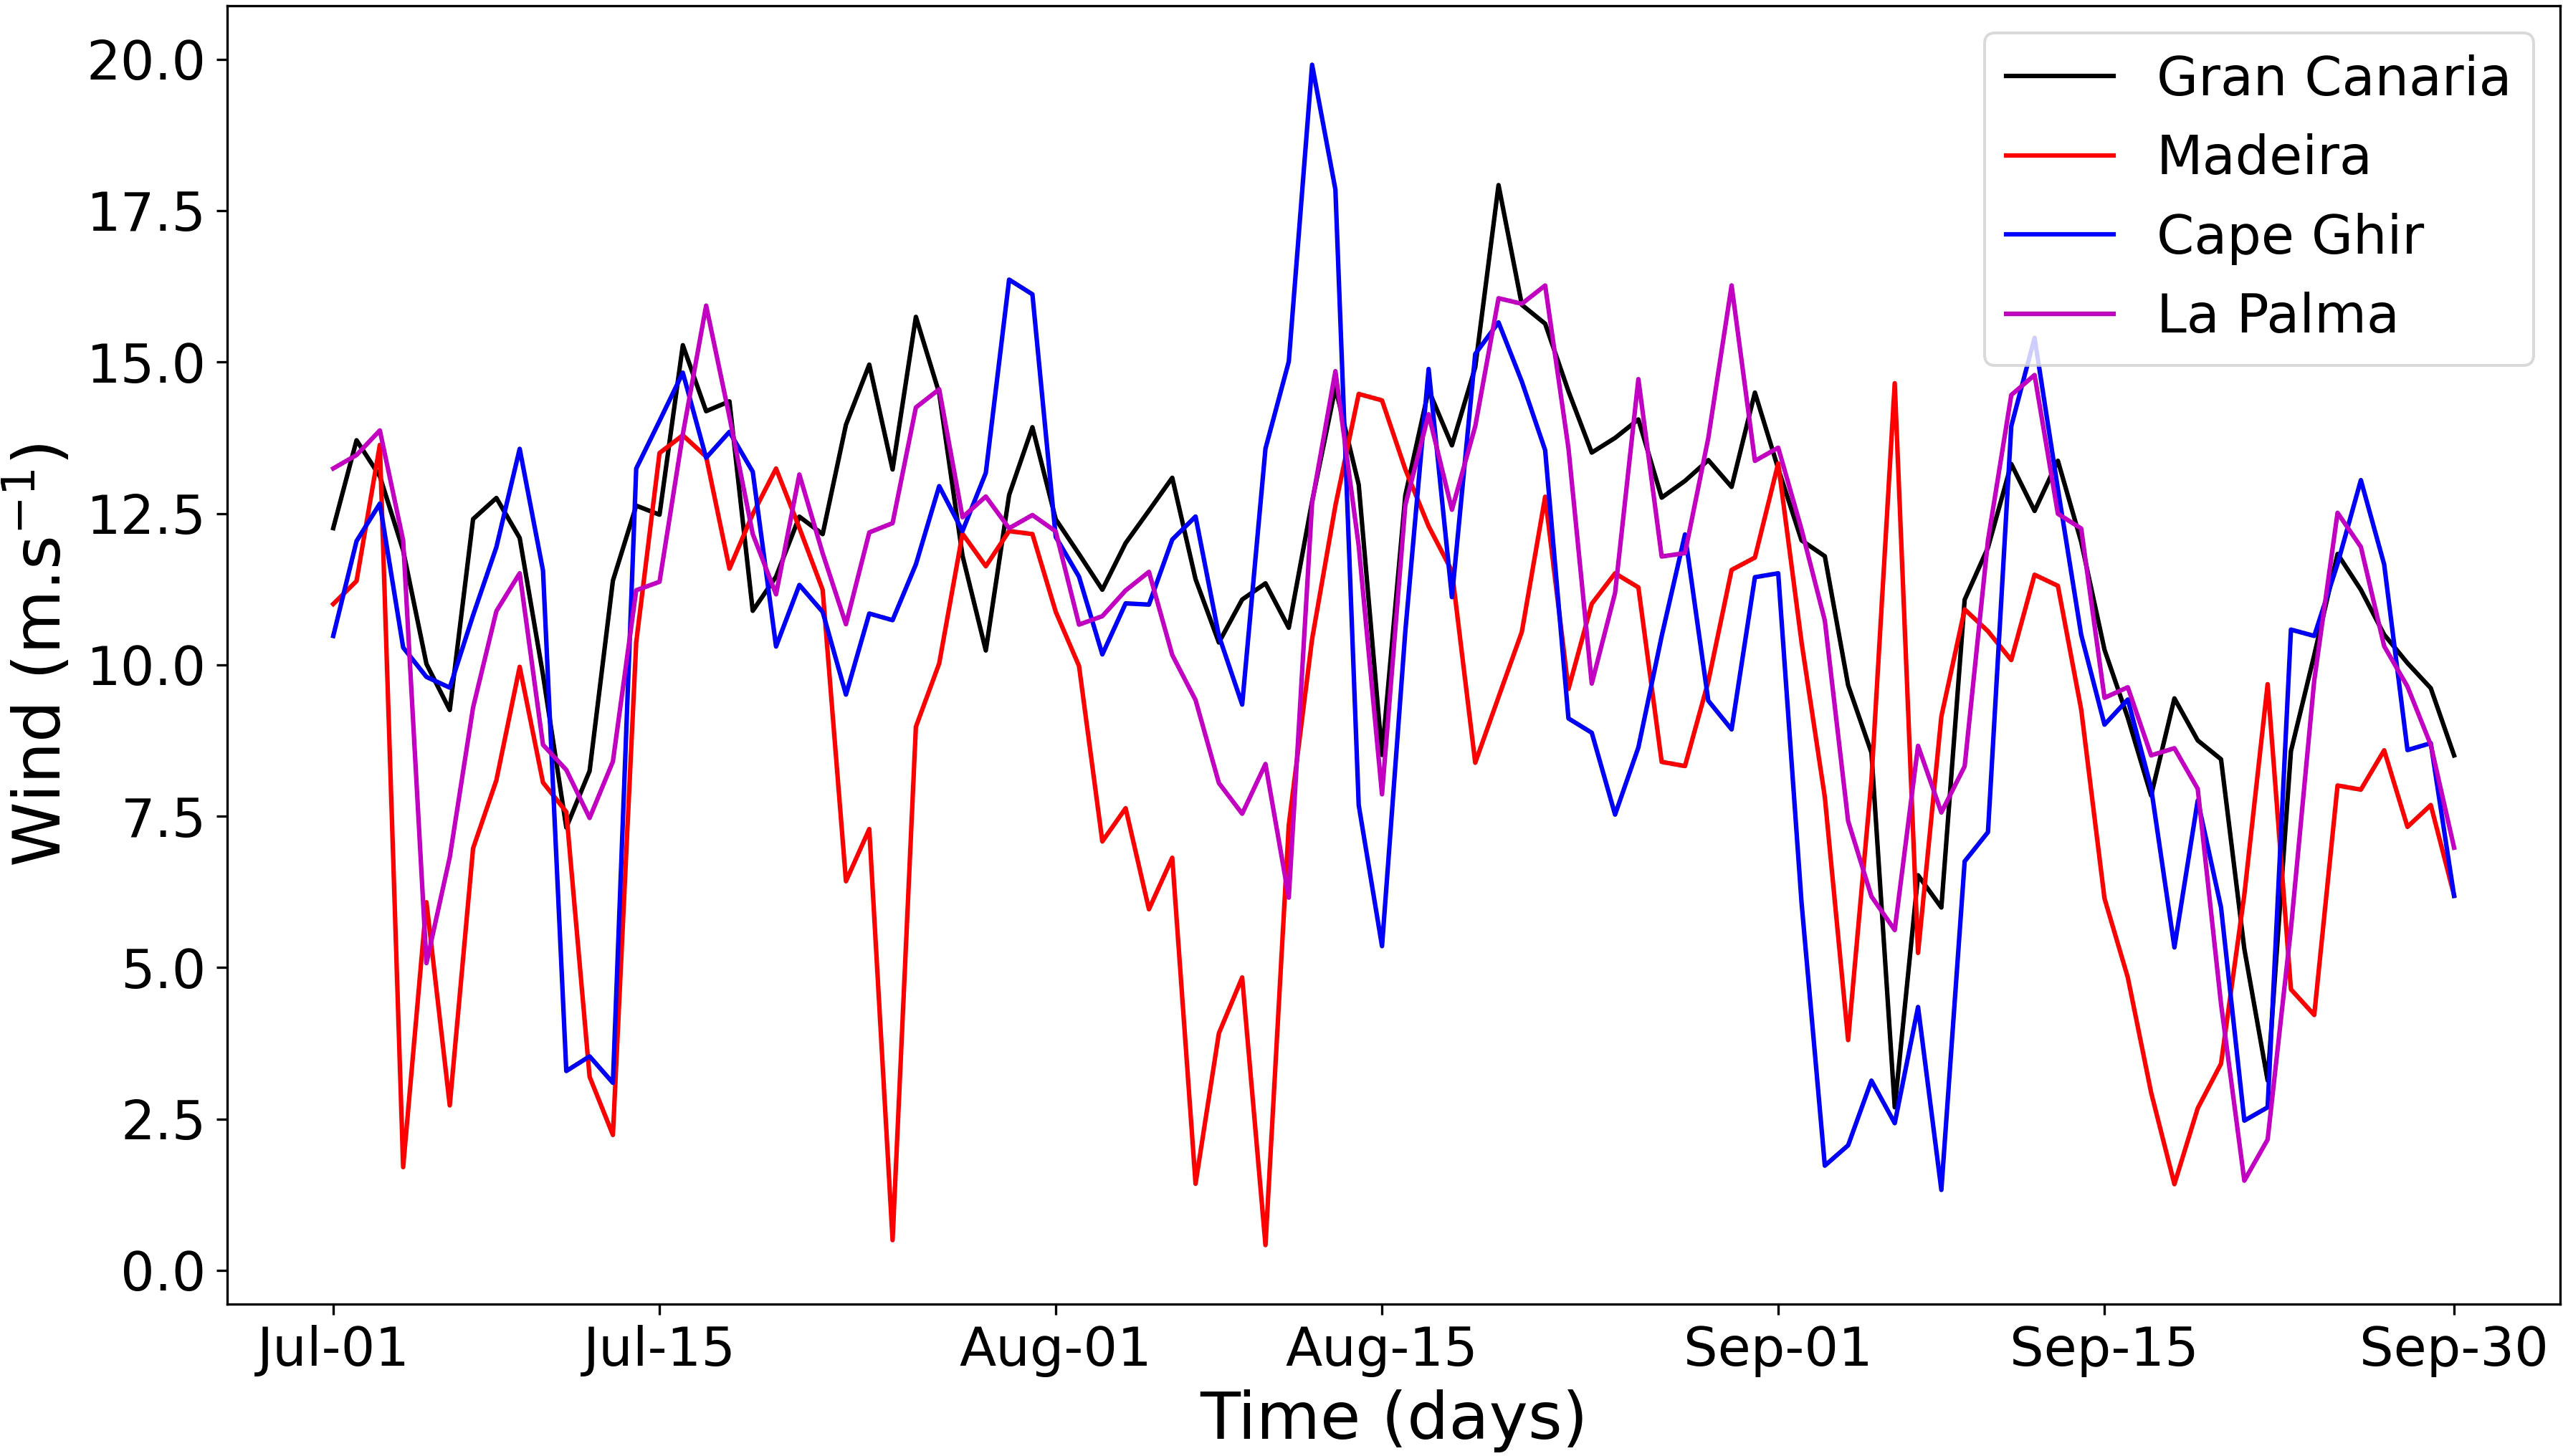
Figure 6 Time series of summer (JAS) numerical simulated (WRF) surface (10m) wind speed at 00h UTC at 4 locations representing jets in the Canary system. (Stars in Figure 1B show locations).
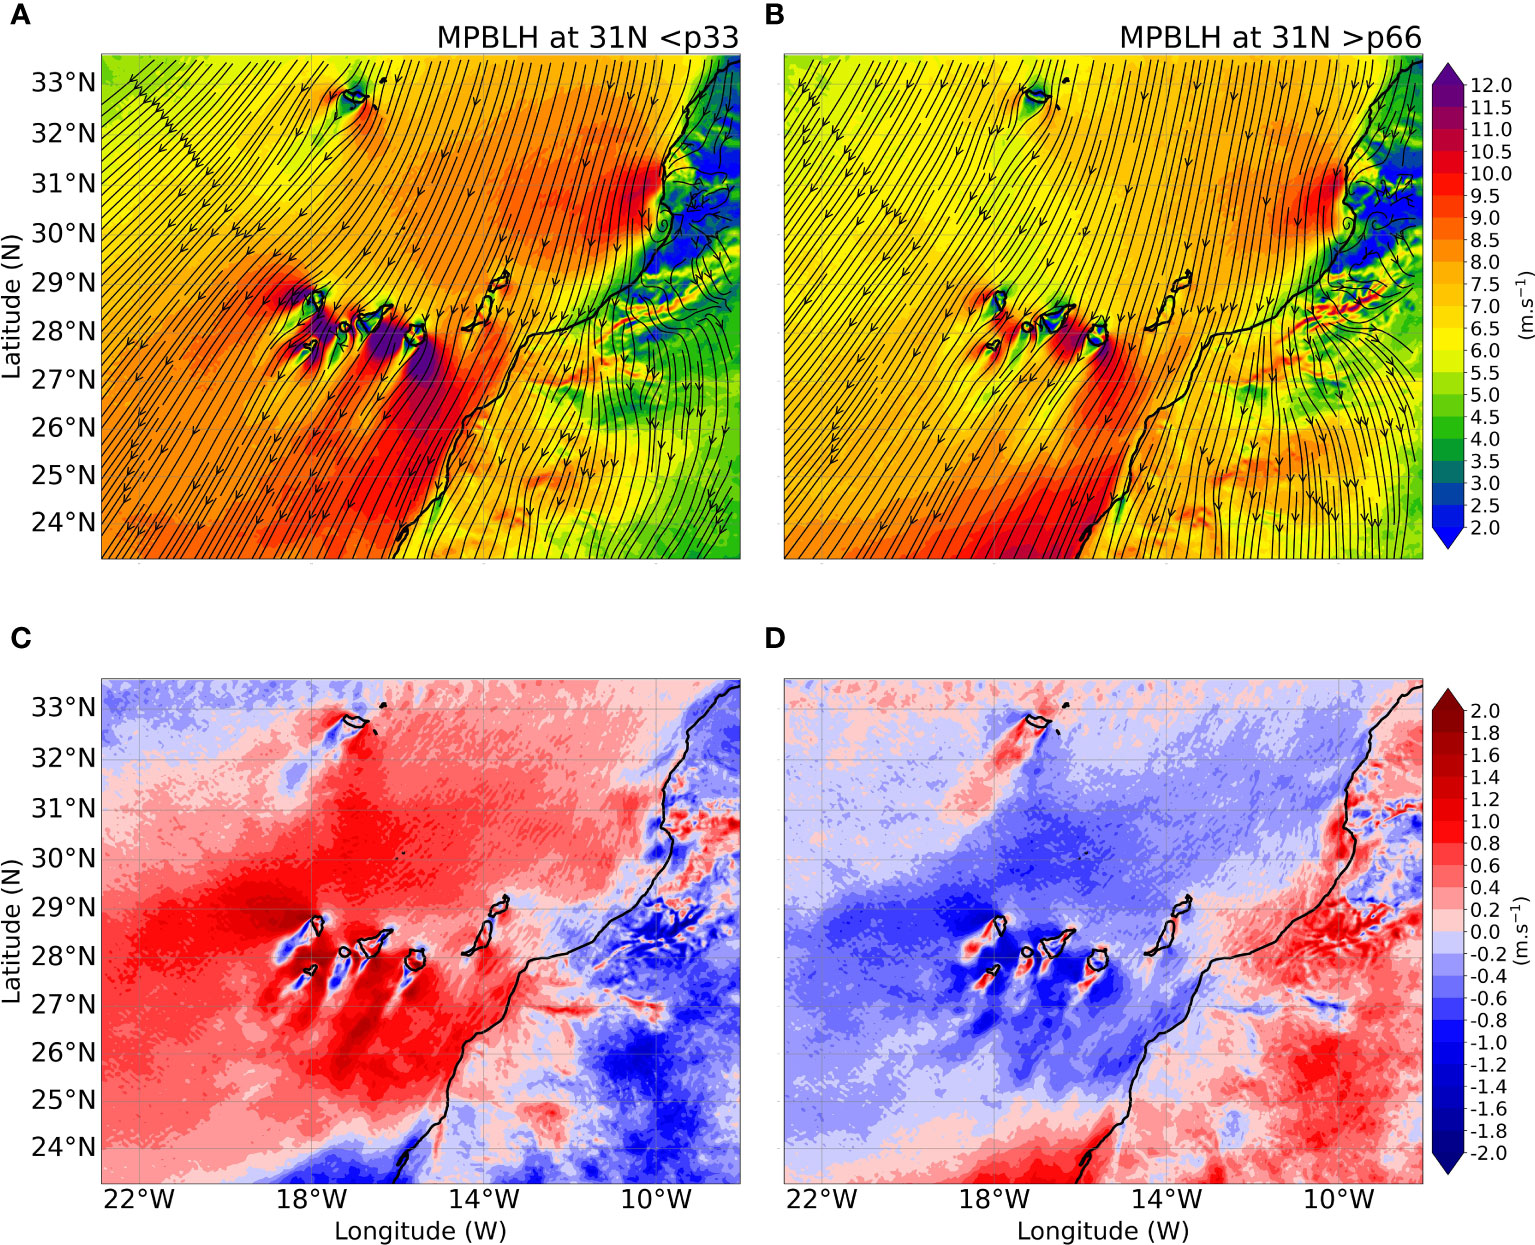
Figure 7 Composite of summer (JAS) mean surface (10m) wind speed for: (A) the lower tercile of planetary boundary layer height at 31 N (white line in Figure 1B); (B) the corresponding upper tercile. (C, D) the differences to the mean wind speed, respectively for (A, B).
The intra-seasonal variability of the jets is larger at Madeira, the island less affected by the African coastal jet, but all jets seem to oscillate at comparable timescales, and they all occasionally relax to low intensity (Figure 6). Considering the extension of CANUS, one would not expect a perfect synchronization between the jets, neither a simple connection to the PBL height at a single representative upstream location as found for Madeira (Miranda et al., 2021). Instead, Figure 7 proceeds to a more regionalized view by looking at composite means of the low-level wind speed for the lower tercile of the mean PBL height along the 31N parallel (Cape Ghir, cf. Figure 1B) and the corresponding upper tercile. With a lower PBL height (Figure 7A), the coastal jet widens throughout the CANUS almost to Madeira longitude, with strong tip jets in all islands; with higher PBL height (Figure 7B) all jets attenuate, and the continental coastal jet is more evident close to Cape Ghir and south of the Canaries. The intense dependence of surface wind on PBL height is also evident in the terciles differences to the mean wind speed (Figures 7C, D). In these panels the highest differences (about +- 2 m.s-1) are observed near the islands, particularly the Canaries, revealing the importance of island orography on the PBL height and consequently on the surface wind. Moreover, it also shows the importance of a high-resolution simulation to assess the islands effect, otherwise the islands orography and its impact would be too smooth.
The wide oscillation that takes place at the multiweek time scale in CANUS, is even more evident in Figure 8, showing vertical wind speed composite means for the lower and upper terciles of PBL height at 31N and at 00h UTC. In these panels, the PBL height varies by a factor of 2 in the whole zonal section. The jet maximum always remains close to the top of the PBL. The abrupt lowering of the PBL near the coast fits the conceptual model proposed by Beardsley et al. (1987) from observations, at a time without the support of global reanalyses.
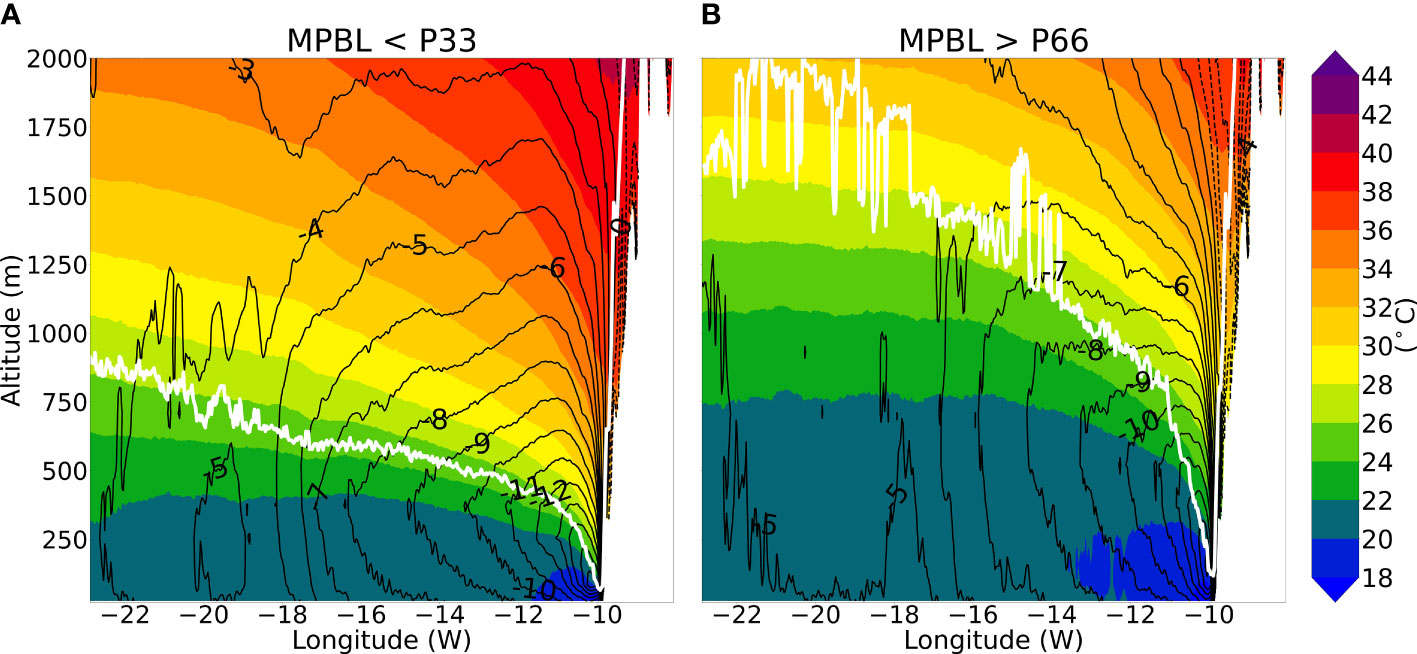
Figure 8 Composites of summer (JAS) mean wind in m.s-1 (black isolines) at 31N, 00 UTC for: (A) lower tercile of PBL height and (B) upper tercile. Potential temperature represented by color shading and PBL height represented by white line.
A more detailed view of the along coast wind (Figure 9A) reveals that most of the time the wind flows southwards along the African coast, with a clear diurnal cycle, apart from the bay south of Cape Ghir (30N) where a cyclonic circulation imposes a northward flow. Besides the diurnal cycle, visible in the power spectral density (Figure 10) by a peak at 1.16 × 10⁻⁵ Hz (24 h period) and of the two main sub-daily harmonics at 2.31 × 10⁻⁵ Hz (12 hours), at 3.52 × 10⁻⁵Hz (8 hours), it is also noted a peak at 9.26 × 10⁻⁷ Hz, corresponding to a multi-weekly frequency. This latter peak is in agreement with the week and multi-week wind variability noted before in the surface wind time series (Figure 6). The cape Ghir nearby high orography and the regional strong coast veer lead to a high variability in the along coast wind at 31N, noted by modes of oscillation clearly more intense than at other latitudes (green line in Figure 10), and by computed standard deviation and variance local maximums (not shown). The computed narrow 90% confidence band of each line (not shown), demonstrate the peaks statistical accuracy.
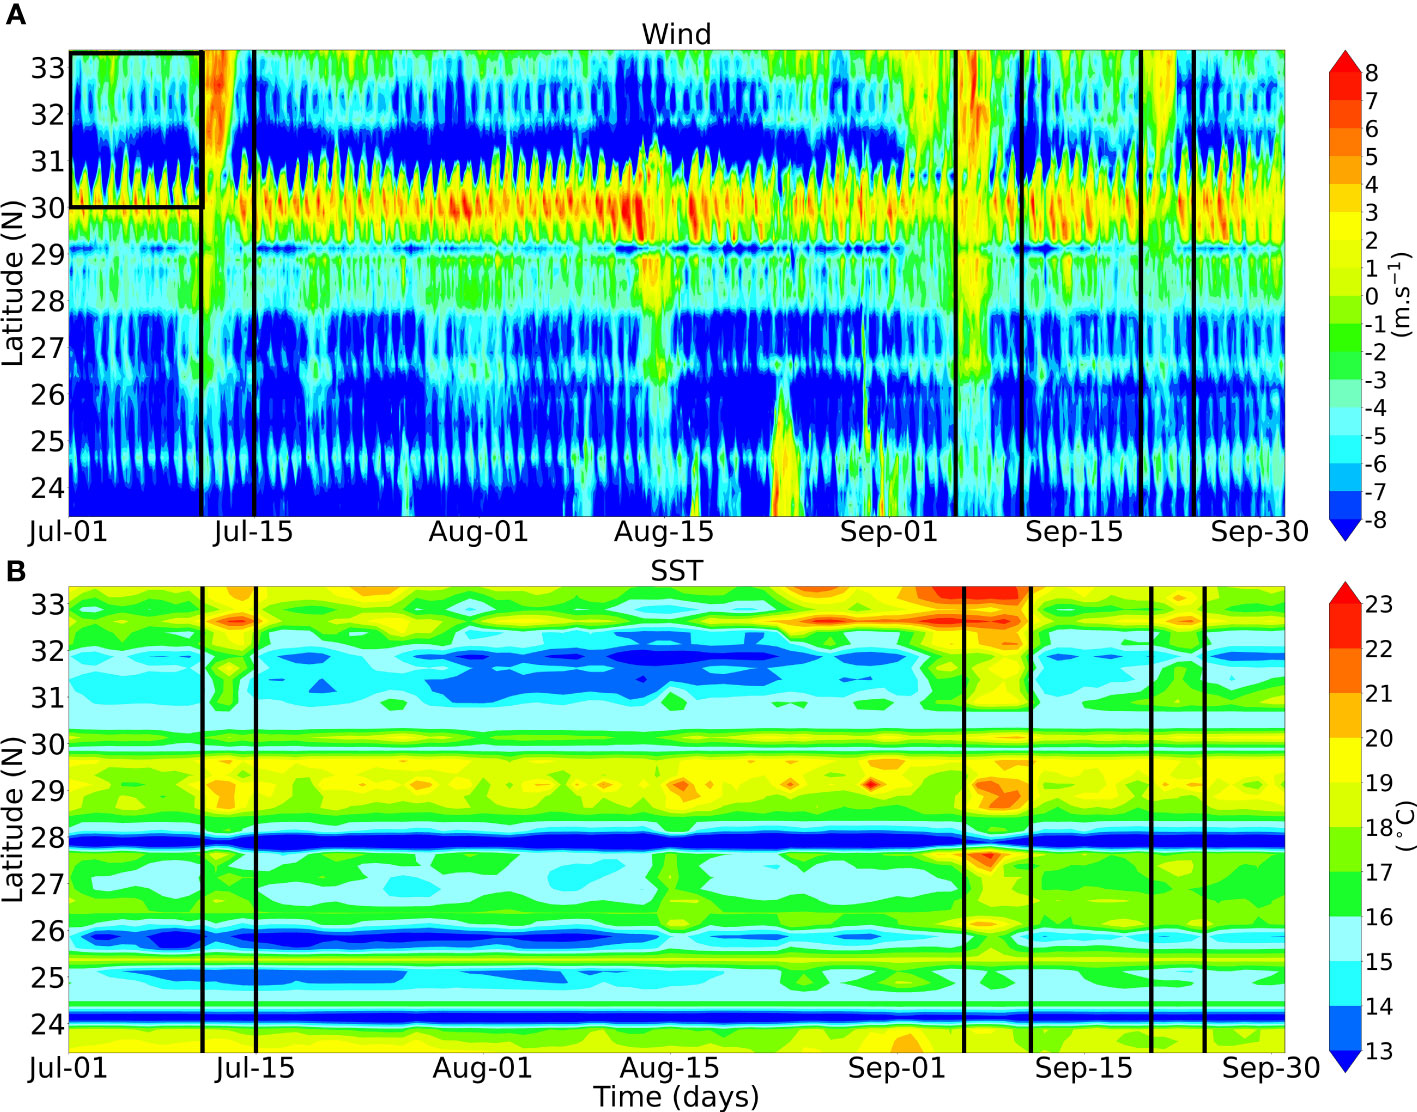
Figure 9 Hovmöllers of (A) along coast wind, and (B) along coast SST, during JAS 2019. Vertical lines show regions and dates where the Kelvin wave effect is noted. In panel (A) the black rectangle shows the area used to compute the mean upstream wind, before the July wind reversal.
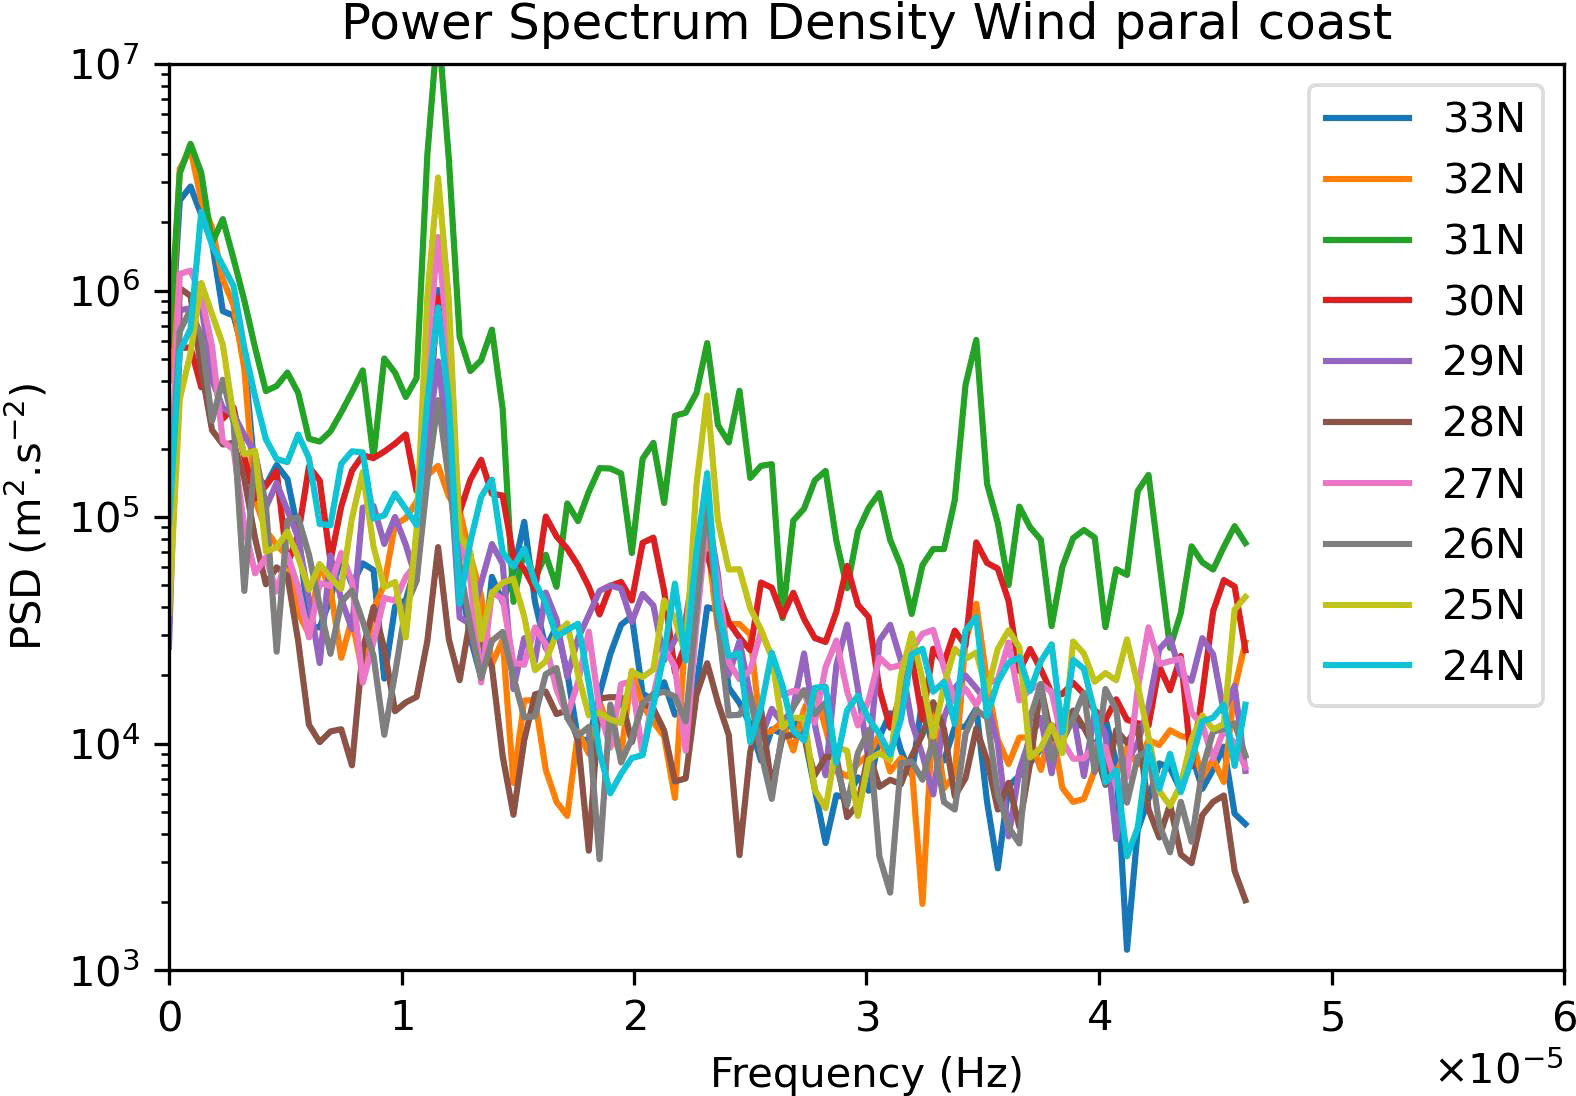
Figure 10 Power spectrum density of surface wind parallel to the coast every 3 hours, from 24N until 33N, during JAS 2019.
The evolution of the along coast wind concerning the full JAS period of 2019 (Figure 9A) also shows at least 3 northward propagating wind reversals, from south of Cape Ghir to the northern limit of the domain, lasting a few days. From 1979 until 2018, the northwest Africa, summer (JAS) Hovmöllers of ERA5 surface wind along the coast, show 2-3 northward wind reversals per summer season (not shown) despite the 30 km data spatial resolution, which shows the recurrence of this phenomena in the studied region.
However, the wind reversal events are not simultaneously observed along the coast. Indeed, a detailed view of the July event (Figures 11A, B) puts in evidence a clear northward propagation of the wind reversal accompanied by a less clear, but still visible, corresponding propagation of a positive anomaly in the PBL height. The wind speed perturbation propagates relatively to the ground at a mean speed of 3.8 m.s-1, as shown by the star’s positions, in panel 9A, that show the maximum wind northward propagation.
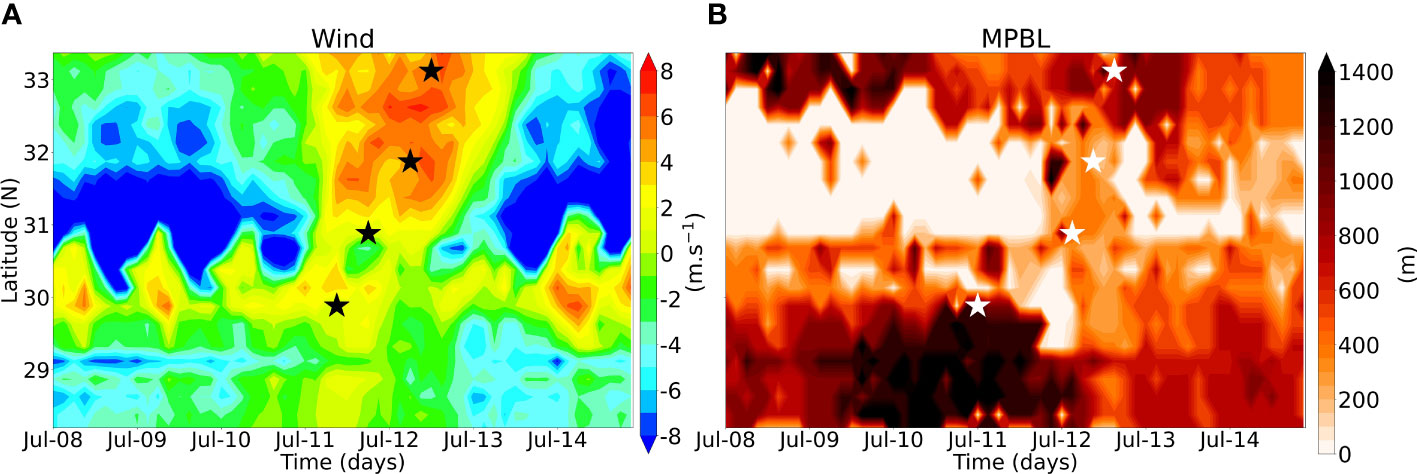
Figure 11 Hovmöllers of (A) surface (10m) along coast wind speed, and (B) near coast atmospheric boundary layer height, with data every 3 hour (00h, 03h, 06h, 09h, 12h, 15h, 18h and 21h UTC). Stars in panels (A) and (B) show the mean highest wind speed and PBL height at 30N, 31N, 32N and 33N, between 10-14 July.
Dorman (1985; 1987) and Beardsley et al. (1987) identified in the California current upwelling system the occurrence of similar short-lived episodes of near coast wind reversal, accompanied by changes in the atmospheric PBL height, propagating northward. These were described as episodes of upwelling relaxation and were attributed to coastal trapped atmospheric events.
Following the conceptual 2-layer model discussed in Dorman (1985), after analysis of potential temperature profiles in Cape Ghir zone, we computed a mean value of 293.5 K for the potential temperature of the lower layer (marine layer), that goes from ocean surface until a Brunt-Väisälä frequency square local maximum, and, a mean value of 302.5 K for the upper layer, that goes from the upper limit of the lower layer until an upper Brunt-Väisälä frequency square local maximum. These potential temperature mean layer values and the local mean 250 m PBL height, observed near cape Ghir (black rectangle in Figure 5A) permitted to compute the Kelvin wave phase speed, following eq 4 of Dorman (1985) (eq S1 in the supplementary material) with a value of 8.6 m.s-1. But because the perturbation travels against a mean upstream flow of about 4.6 m.s-1, between 30N and 33.2N, during the 10 days preceding the analyzed event (black rectangle in panel 9A), the perturbation ground-relative speed is near 4 m.s-1, a value close to the simulated value (3.8 m.s-1) of propagation to the north of maximum southerly wind.
Further evidence of a Kelvin wave is the geometry of the northward propagation event, clearly anchored at the coastline (Figure S2) excluding the hypothesis of a synoptic disturbance (like a front) as the cause of the wind anomaly. Moreover, the offshore extension of the coastal anomaly matches reasonably well the theoretical offshore extension of a Kelvin wave (eq.5 of Dorman, 1985 and eq S2 in supplementary material) that is about 53 km at 31N. Finally, the wind reversal coincides with transient positive anomalies of surface pressure (Figure S2) as would be expected for a Kelvin wave (Dorman, 1985).
4.5 The larger scale variability of the Azores anticyclone
The control of the PBL height in an extended region (Figure 5A) is certainly unrelated to coastal trapped perturbations, which, as mentioned before, decay exponentially in the cross-shore direction. Indeed, the larger scale environment driving the variability of the CANUS is predominantly dominated by the Azores anticyclone. As shown in Figure 12, built from 1979-2018 July-August-September ERA5 data, the lowering of the PBL height offshore Cape Ghir occurs when the anticyclone core is less intense, smoother and extends in ridge through the Bay of Biscay towards NE France and the English Channel, as noted by the displacement of 1020 hPa isobar, with an intensification of the geostrophic wind south-west of Iberia, leading to a stronger and wider coastal jet near Cape Ghir, extending almost to Madeira, and to intensified tip jets in both Madeira and the Canaries, as also clearly noted before in Figure 7. In contrast, higher PBL heights are associated with an anticyclone more intense in its core and more constrained in its zonal extension. These results are very similar to the 40-year mean shown in Miranda et al. (2021), but with a different compositing approach.
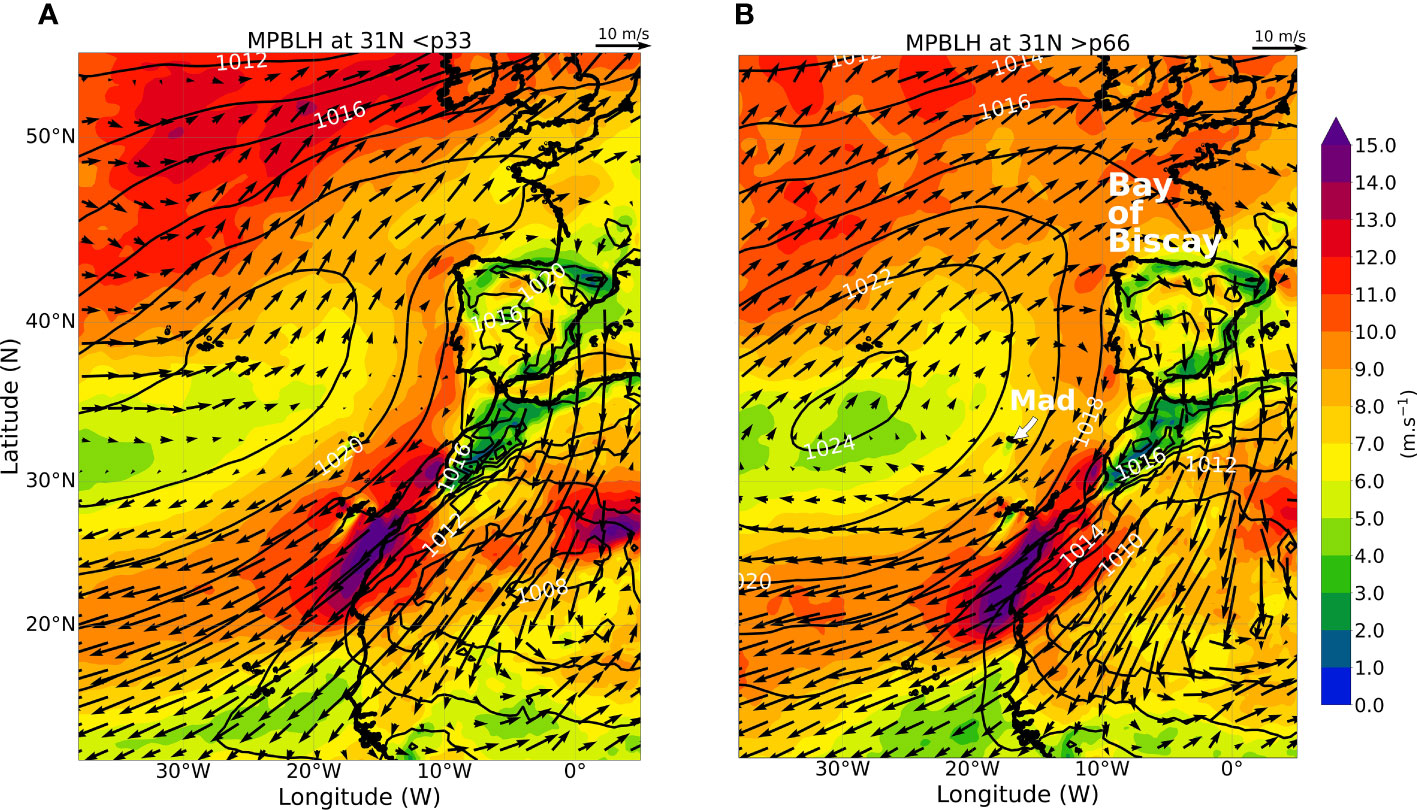
Figure 12 Summer (JAS) 10m wind (color shading and arrows) and surface pressure contours from 1979-2018 ERA5 data. Composite for the: (A) lower PBL height tercile at 31N and (B) upper tercile. In panel (B) are shown the Madeira Island and Bay of Biscay locations.
4.6 Variability in the upper ocean
Although not so intense as for surface wind, the coastal ocean surface temperature also shows variability, notably the one associated with wind reversals (Figure 9B). During the wind reversal event, of 11-13 July the coastal SST attains a relative maximum. Similarly, two other SST maxima in the same region, in the first and second fortnights of September are also coincident with the two other wind reversals events, with about one-two days of delay due to ocean inertia. In short, coastal trapped Kelvin waves are associated with periods of upwelling relaxation, as noted before in the California coast (Beardsley et al., 1987).
The cross-correlations of the SST at Cape Ghir with the surface wind at Cape Ghir, Gran Canaria, Madeira and La Palma (Figure 13A) show the co-variability of these two variables at four distinct locations where intense jets are usually observed. The maximum computed correlations, noted with a lag of one or two days, range from -0.37 at Madeira to -0.57 at La Palma. The lowest correlations are observed at Madeira jet, the one more distant from the Africa coast and consequently the less synchronized to the others, as noted before in surface wind time series (Figure 6). These values show that a significant part of the SST variability near the Africa coast is due to the jets variability. We hypothesized that some of the unexplained variability may be due to larger scale ocean and atmosphere dynamics, a research topic that is beyond the scope of the present study due to the constrains imposed by the geographic limits of the computational domain. Nevertheless, the impact on ocean surface of the different wind regimes imposed by the jets is clearly noted in Figure 13B where is shown the SST difference between the wind speed upper tercile days and the lower tercile days at Cape Ghir. Similar figures for Madeira, Gran Canaria and La Palma jets show a similar pattern (not shown). As expected, near the coast a cooler ocean surface is observed when the jets are more intense, with values, as low as, -2°C. It is interesting to note that the cooler ocean surface is still verified near the west limit of the computational domain, a possible sign of the large-scale impact of the jets. The main exception to a cooler ocean surface during windy days occurs in the lee of the islands, due to a lower cloud cover that implies an intensified incident radiation, as verified in the simulated data (not shown).
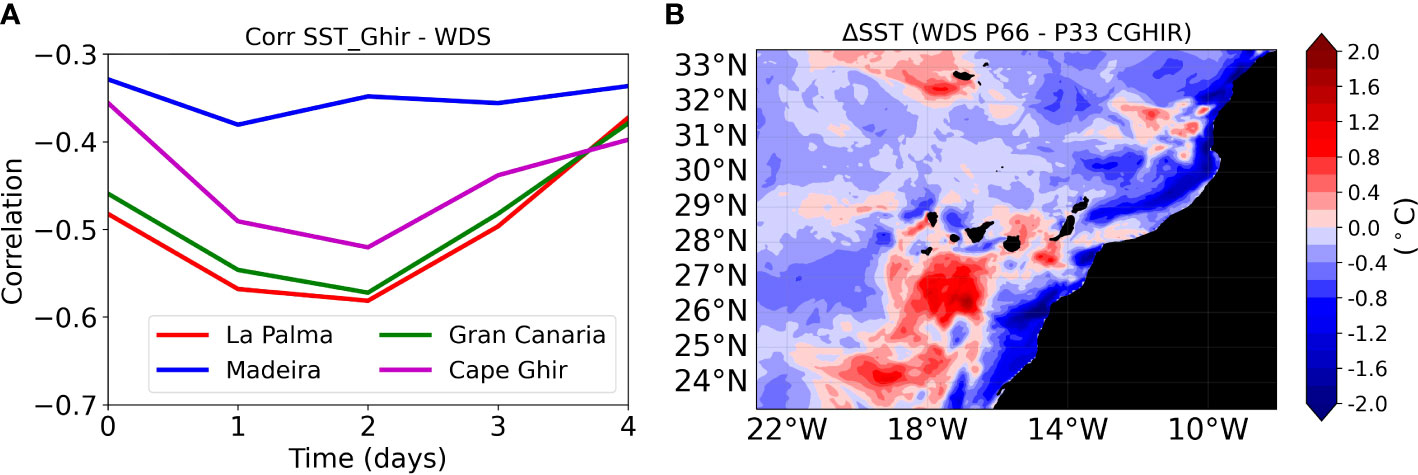
Figure 13 (A) Cross-correlation between SST and surface (10m) wind speed near Cape Ghir, Madeira, Gran Canaria and La Palma. For exact location of the time-series see stars positions in Figure 1B. (B) Mean SST difference between the surface wind speed upper tercile days (p66) and the lower tercile days (p33), near Cape Ghir.
The top-level ocean circulation (Figure 14) varies on longer timescales than its atmospheric counterpart, but is characterized by an intense mesoscale structure, with counterrotating eddies and offshore filaments, as noted in previous studies (e.g., Barton et al., 2004). Two main features, whose origin strongly depends on the jets, characterize that circulation: the southward Canary current along the African coast, and the eddy train propagating westwards in the subtropics north of 30N. The latter was identified by Sangrà et al. (2009) as the Madeira corridor. The Canary Islands, and to a lesser extent Madeira, mark the origin of eddy trains propagating south-westwards into the tropics. These eddies are a response to land-atmosphere-ocean interactions, which lead to atmosphere and ocean vortex shedding, in the most dynamic regions of the tip jets. It is well known that ocean eddies have an important role in the zonal transport of the properties of the upwelling zone to the oligotrophic open ocean. For instance, Sangrà et al. (2009) estimated that the total primary production related to westward eddies may be as high as the total primary production of the Canary upwelling system. Due to the estimated long life (>3 months) of these mesoscale eddies, we will no further analyse them here, but this is certainly a relevant issue to examine in a longer high-resolution ocean-atmosphere coupled simulation.
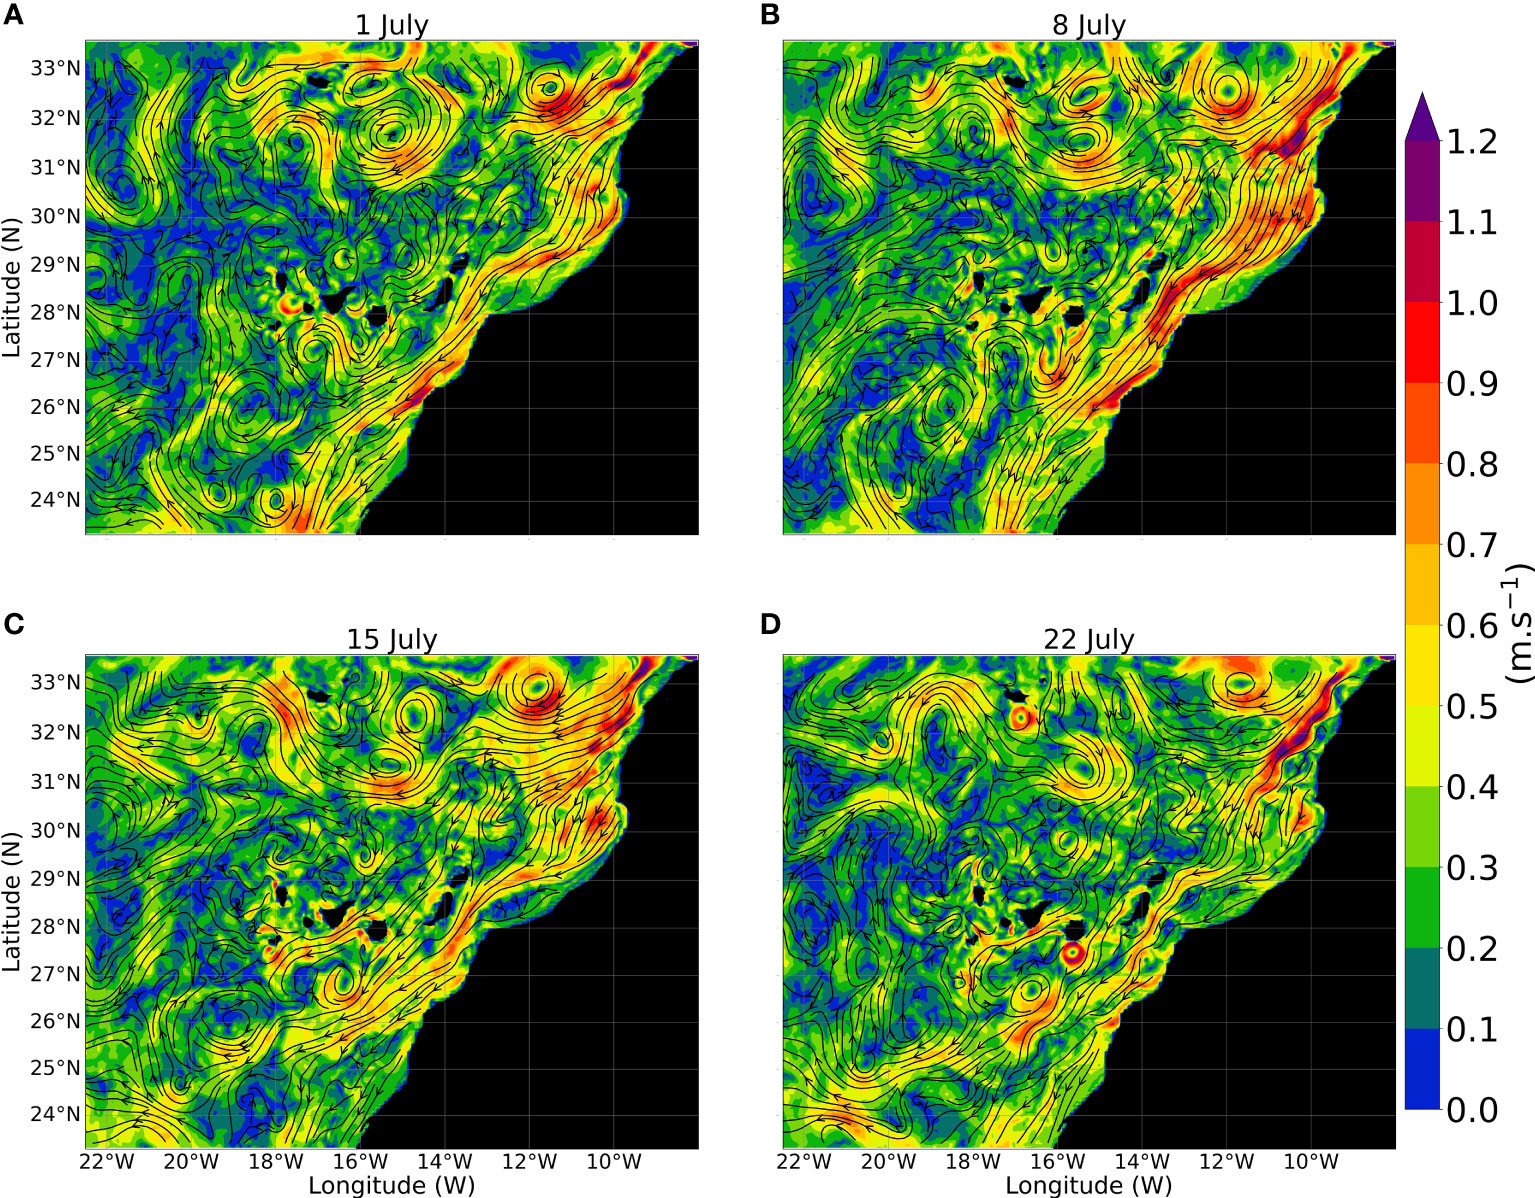
Figure 14 Weekly evolution (July 2019) of the ocean circulation. (A)1 July, (B) 8 July, (C) 15 July and (D) 22 July. Streamlines represent surface current direction and color shading indicates the currents intensity.
5 Conclusions
The complex mesoscale dynamics of coastal upwelling systems remain a source of uncertainty in the context of climate change. A realistic representation of the processes driving such dynamics, requires the development of fully coupled atmosphere-ocean simulations at high resolution. That was the approach followed here, attempting to test the applicability of proposed conceptual models in the conditions of the Canary system, and to explore specific issues that differentiate this from other upwelling regions. Due to computational constraints, the study was focused in one summer season and limited to the core of the CANUS, south of the Gulf of Cadiz, but in a domain that includes the impact of the SW limit of Atlas Mountains and the impact of the Madeira and Canary archipelagos.
The summer mean north-easterly atmospheric flow was found to be rather steady, along the edge of the Azores anticyclone, with persistent upwelling along the coast, except for the secluded bay south of Cape Ghir. At the intra-seasonal time scale, that flow varied significantly in strength, in a process that is driven by changes in the location and intensity of subtropical high and is accompanied by large oscillations in the height of the atmospheric boundary layer in a wide region, confirming a previous result from a much longer but uncoupled atmospheric simulation (Miranda et al., 2021). In the nearshore region, other oscillations that propagate against the synoptic scale surface pressure gradient, were identified, affecting the atmospheric flow near the coast. Occasionally these coastal trapped oscillations lead to a reversal of the along coast wind north of Cape Ghir associated with a northward surface wind and PBL height positive anomaly propagation at a speed, offshore extension, and surface pressure coastal anomaly compatible with an atmospheric Kelvin wave, that leads to coastal SST transient maximum, a process of upwelling relaxation already found in the California system (Dorman, 1985; Beardsley et al., 1987; Dorman, 1987).
As expected, the oceanic circulation in the region was found to vary on much slower time scales than the atmospheric circulation, but to be characterized by complex mesoscale structures, with counterrotating vortices propagating westward in the north of the domain, and south-westward in the wake of the islands, as noted in previous studies (eg. Barton et al., 1998; Sangrà et al., 2009). The ocean mixed layer was found to respond locally to both the coastal low-level atmospheric jet and the island tip-jets, by increased vertical mixing. The island tip jets were found to have a larger impact on the latent heat flux than on sensible heat flux, an impact that is asymmetric in the east-west direction, as also found in Alves et al. (2020).
The complex atmosphere-ocean circulation in the CANUS results from its geographic setting, including the coastal geometry and the presence of islands with significant height. Some of the processes are like the better studied California system, but others, as those linked to the nearby islands, are not comparable and require high resolution simulations to accurately represent the intense coastal wind and PBL height gradients. The spatial and temporal details of those processes may have impact in the biogeochemical cycling throughout the system, affecting its productivity (Renault et al., 2016b). There is evidence of multidecadal variability in the intensity of the atmospheric flow in the Canary system (Miranda et al., 2021), which may be relevant in the context of climate change. Understanding the corresponding evolution of the ocean variability is an important target for future work.
Data availability statement
The raw data supporting the conclusions of this article will be made available by the authors, without undue reservation.
Author contributions
JA carried out the numerical simulations. JA and PM analyzed the data and wrote the manuscript in close collaboration with RC. All authors contributed to the article and approved the submitted version.
Funding
This study was funded by FCT (Fundação para a Ciência e a Tecnologia, I.P./MCTES) through national funds (PIDDAC) -UIDB/50019/2020. JA was financially supported by the Oceanic Observatory of Madeira Project (M1420-01-0145-FEDER-000001-Observatório Oceânico da Madeira-OOM).
Acknowledgments
The authors thank CESGA (Supercomputing Center of Galicia) for providing the necessary resources for the numerical simulations. ECMWF ERA5 data was downloaded from the Copernicus Climate Change Service. We acknowledge the in-situ data kindly provided by IPMA (Portuguese Institute for Sea and Atmosphere) and Puertos de Estado institute.
Conflict of interest
The authors declare that the research was conducted in the absence of any commercial or financial relationships that could be construed as a potential conflict of interest.
Publisher’s note
All claims expressed in this article are solely those of the authors and do not necessarily represent those of their affiliated organizations, or those of the publisher, the editors and the reviewers. Any product that may be evaluated in this article, or claim that may be made by its manufacturer, is not guaranteed or endorsed by the publisher.
Supplementary material
The Supplementary Material for this article can be found online at: https://www.frontiersin.org/articles/10.3389/fmars.2023.1068134/full#supplementary-material
References
Alves J. M. R., Caldeira R. M. A., Miranda P. M. A. (2020). Dynamics and oceanic response of the Madeira tip-jets. Q. J. R. Meteorol. Soc 146, 3048–3063. doi: 10.1002/qj.3825
Alves J. M. R., Miranda P. M. A. (2013). Variability of Iberian upwelling implied by ERA-40 and ERA-interim reanalyses. Tellus A: Dyn. Meteorol. Oceanogr. 65, 1. doi: 10.3402/tellusa.v65i0.19245
Alves J. M. R., Tomé R., Caldeira R. M. A., Miranda P. M. A. (2021). Asymmetric ocean response to atmospheric forcing in an island wake: a 35-year high-resolution study. Front. Mar. Sci. 8, 624392. doi: 10.3389/fmars.2021.624392
Aristegui J., Barton E. D., Alvarez-Salgado X., Santos M., Figueiras F. G., Kifani S., et al. (2009). Sub-Regional ecosystem variability in the canary current upwelling. Prog. Oceanogr. 83, 33–48. doi: 10.1016/j.pocean.2009.07.031
Aristegui J., Sangrà P., Hernandez-Leon S., Cantón-Garbín M., Hernández-Guerra A., Kerling J. L. (1994). Island-induced eddies in the canary islands. Deep Sea Res. I: Oceanogr. Res. Pap. 41, 1509–1525. doi: 10.1016/0967-0637(94)90058-2
Bakun A. (1990). Global climate change and intensification of coastal ocean upwelling. Science 247, 198–201. doi: 10.1126/science.247.4939.198
Bakun A., Black B. A., Bograd S. J. (2015). Anticipated effects of climate change on coastal upwelling ecosystems. Curr. Clim. Change Rep. 1, 85–93. doi: 10.1007/s40641-015-0008-4
Barton E. D., Arístegui J., Tett P., Navarro-Pérez E. (2004). Variability in the canary islands area of filament-eddy exchanges. Prog. Oceanogr. 62, 71–94. doi: 10.1016/j.pocean.2004.07.003
Barton E. D., Arıstegui J., Tett P., Cantón M., Garcıa-Braun J., Hernández-León S., et al. (1998). The transition zone of the canary current upwelling region. Prog. Oceanogr. 41, 455–504. doi: 10.1016/S0079-6611(98)00023-8
Barton E. D., Field D., Roy C. (2013). Canary current upwelling: more or less? Prog. Oceanogr. 116, 167–178. doi: 10.1016/j.pocean.2013.07.007
Beardsley R. C., Dorman C. E., Friehe C. A., Rosenfeld L. K., Winant C. D. (1987). Local atmospheric forcing during the coastal ocean dynamics experiment: 1. a description of the marine boundary layer and atmospheric conditions over a northern California upwelling region. J. Geophys. Res. 92 (C2), 1467–1488. doi: 10.1029/JC092iC02p01467
Bentamy A., Piollé J. F., Prevost C. (2021). Global ocean wind L4 reprocessed 6 hourly observations. Copernicus Mar. Service. doi: 10.48670/moi-00185
Bock L., Lauer A., Schlund M., Barreiro M., Bellouin N., Jones C., et al. (2020). Quantifying progress across different CMIP phases with the ESMValTool. J. Geophys. Res. Atmos. 125, e2019JD032321. doi: 10.1029/2019JD032321
Boé J., Hall A., Colas F., McWilliams J. C., Qu X., Kurian J., et al. (2011). What shapes mesoscale wind anomalies in coastal upwelling zones? Clim. Dyn. 36 (11–12), 2037–2049. doi: 10.1007/s00382-011-1058-5
Bograd S., Jacox M., Hazen E., Lovecchio E., Montes I., Buil M., et al. (2023). Climate change impacts on Eastern boundary upwelling systems. Annu. Rev. Mar. Sci. 15, 1. doi: 10.1146/annurev-marine-032122-021945
Bretherton C. S., McCaa J. R., Grenier H. (2004). A new parameterization for shallow cumulus convection and its application to marine subtropical cloud-topped boundary layers. part I: description and 1D results. Mon. Weather Rev. 132, 864–882. doi: 10.1175/1520-0493(2004)132<0864:ANPFSC>2.0.CO;2
Caldeira R. M. A., Groom S., Miller D., Pilgrim P., Nezlin N. P. (2002). Sea-Surface signatures of the island mass effect phenomena around Madeira island, northeast Atlantic. Remote Sens. Environ. 80, 336–360. doi: 10.1016/S0034-4257(01)00316-9
Caldeira R. M. A., Marchesiello P., Nezlin N. P., DiGiacomo P. M., McWilliams J. C. (2005). Island wakes in the southern California bight. J. Geophys. Res. 110, C11012. doi: 10.1029/2004JC002675
Capet X. J., Marchesiello P., McWilliams J. C. (2004). Upwelling response to coastal wind profiles. Geophys. Res. Lett. 31, L13311. doi: 10.1029/2004GL020123
Chapman D. C. (1985). Numerical treatment of cross-shelf open boundaries in a barotropic coastal ocean model. J. Phys. Oceanogr. 15, 1060–1075. doi: 10.1175/1520-0485(1985)0152.0.CO;2
Chelton D. B., Schlax M. G., Freilich M. H., Milliff R. F. (2004). Satellite measurements reveal persistent small-scale features in ocean winds. Science 303, 978–983. doi: 10.1126/science.1091901
Chen F., Dudhia J. (2001). Coupling an advanced land surface-hydrology model with the Penn state-NCAR MM5 modeling system. part I: model implementation and sensitivity. Mon. Weather Rev. 129, 569–585. doi: 10.1175/1520-0493(2001)129<0569:CAALSH>2.0.CO;2
Chin T. M., Vazquez-Cuervo J., Armstrong E. M. (2017). A multi-scale high-resolution analysis of global sea surface temperature. Remote Sens. Environ. 200, 154–169. doi: 10.1016/j.rse.2017.07.029
Demarcq H. (2009). Trends in primary production, sea surface temperature and wind in upwelling systems, (1998–2007). Prog. Oceanogr. 83, 376–385. doi: 10.1016/j.pocean.2009.07.022
Desbiolles F., Blanke B., Bentamy A., Grima N. (2014). Origin of fine-scale wind stress curl structures in the benguela and canary upwelling systems. J. Geophys. Res. Oceans 119, 7931–7948. doi: 10.1002/2014JC010015
Dorman C. E. (1985). Evidence of kelvin waves in california's marine layer and related eddy generation. Mon. Weather Rev. 113.5, 827–839. doi: 10.1175/1520-0493(1985)113<0827:EOKWIC>2.0.CO;2>
Dorman C. E. (1987). Possible role of gravity currents in northern California coastal summer wind reversals. J. Geophys. Res. Oceans 92 (C2), 1497–1506. doi: 10.1029/Jc092ic02p01497
Dudhia J. (1989). Numerical study of convection observed during the winter monsoon experiment using a mesoscale two-dimensional model. J. Atmos. Sci. 46, 3077–3107. doi: 10.1175/1520-0469(1989)046<3077:NSOCOD>2.0.CO;2
Egbert G. D., Erofeeva S. Y. (2002). Efficient inverse modeling of barotropic ocean tides. J. Atmos. Ocean. Technol. 19, 183–204. doi: 10.1175/1520-04262002019<0183:EIMOBO<2.0.CO;2
Grubišic´ V., Sachsperger J., Caldeira R. M. (2015). Atmospheric wake of Madeira: first aerial observations and numerical simulations. J. Atmos. Sci. 72, 4755–4776. doi: 10.1175/JAS-D-14-0251.1
Hersbach H., Bell B., Berrisford P., Hirahara S., Horanyi A., Munoz-Sabater J., et al. (2020). The ERA5 global reanalysis. Q. J. R. Meteorol. Soc 146, 1999–2049. doi: 10.1002/qj.3803
Hong S., Lim J. (2006). The WRF single-moment 6-class microphysics scheme (WSM6). J. Korean Meteor. Soc. 42, 129–151.
Jones P. W. (1999). First- and second-order conservative remapping schemes for grids in spherical coordinates. Mon. Weather Rev. 127, 2204–2210. doi: 10.1175/1520-0493(1999)127<2204:FASOCR>2.0.CO;2
Kain J. S. (2004). The kain–fritsch convective parameterization: an update. J. Appl. Meteorol. 43 (1), 170–181. doi: 10.1175/1520-0450(2004)043<0170:TKCPAU>2.0.CO;2
Kain J. S., Fritsch J. M. (1990). A one-dimensional entraining/detraining plume model and its application in convective parameterization. J. Atmos. Sci. 47, 2784–2802. doi: 10.1175/1520-0469(1990)047<2784:AODEPM>2.0.CO;2
Larson J., Jacob R., Ong E. (2005). The model coupling toolkit: a new Fortran90 toolkit for building multiphysics parallel coupled models. Int. J. High Perform. Comput. Appl. 19 (3), 277–292. doi: 10.1177/1094342005056115
Lellouche J. M., Greiner E., Bourdallé-Badie R., Garric G., Melet A., Drévillon M., et al. (2021). The Copernicus global 1/12° oceanic and Sea ice GLORYS12 reanalysis. Front. Earth Sci. 9, 698876. doi: 10.3389/feart.2021.698876
Lima D. C. A., Soares P. M. M., Nogueira M., Semedo A. (2022). Global coastal low-level wind jets revisited through the new ERA5 reanalysis. Int. J. Climatol. 2 (9), 4491–4507. doi: 10.1002/joc.7482
Marchesiello P., McWilliams J. C., Shchepetkin A. (2001). Open boundary conditions for long-term integration of regional oceanic models. Ocean Model. 3, 1–20. doi: 10.1016/S1463-5003(00)00013-5
Mason E., Colas F., Molemaker J., Shchepetkin A. F., Troupin C., McWilliams J. C., et al. (2011). Seasonal variability of the canary current: a numerical study. J. Geophys. Res. 116, C06001. doi: 10.1029/2010JC006665
Mason E., Molemaker J., Shchepetkin A. F., Colas F., McWilliams J. C., Sangrà P. (2010). Procedures for offline grid nesting in regional ocean models. Ocean Model. 35, 1–15. doi: 10.1016/j.ocemod.2010.05.007
Miranda P. M. A., Alves J. M. R., Serra N. (2013). Climate change and upwelling: response of Iberian upwelling to atmospheric forcing in a regional climate scenario. Clim. Dyn 40, 2813–2824. doi: 10.1007/s00382-012-1442-9
Miranda P. M. A., Tomé R., Frois L., Nogueira M., Alves J. M. R., Prior V., et al. (2021). Speed-up of the Madeira tip jets in the ERA5 climate highlights the decadal variability of the Atlantic subtropics. Q. J. R. Meteorol. Soc. 147, 679–690. doi: 10.1002/qj.3940
Mlawer E. J., Taubman S. J., Brown P. D., Iacono M. J., Clough S. A. (1997). Radiative transfer for inhomogeneous atmosphere: RRTM, a validated correlated-k model for the long wave. J. Geophys. Res. 102, 16663–16682. doi: 10.1029/97JD00237D14
Monin A. S., Obukhov A. M. (1954). Basic laws of turbulent mixing in the atmosphere near the ground. Tr. Inst. Teor. Geofiz., Akad Nauk SSSR 24, 1963–1987.
Narayan N., Paul A., Mulitza S., Schulz M. (2010). Trends in coastal upwelling intensity. Ocean Sci. 6, 815–823. doi: 10.5194/os-6-815-2010
Obukhov A. M. (1946). Turbulence in thermally non-homogeneous atmosphere. Teor. Geofiz., Akad Nauk SSSR 1, 95–115. doi: 10.1007/BF00718085
Ólafsson H., Bougeault P. (1997). The effect of rotation and surface friction on orographic drag. J. Atmos. Sci. 54, 193–210. doi: 10.1175/1520-0469(1997)0542.0.CO;2
Perlin N., Skyllingstad E. D., Samelson R. M. (2011). ). coastal atmospheric circulation around an idealized cape during wind-driven upwelling studied from a coupled ocean-atmosphere model. Mon. Weather Rev. 139, 3, 809–829. doi: 10.1175/2010MWR3372.1
Perlin N., Szoeke S. P., Chelton D. B., Samelson R. M., Skyllingstad E. D., O’Neill L. W. (2014). Modeling the atmospheric boundary layer wind response to mesoscale sea surface temperature perturbations. Mon. Weather Rev. 142, 4284–4307. doi: 10.1175/MWR-D-13-00332.1
Pickart R. S., Spall M. A., Ribergaard M. H., Moore G. W. K., Milliff R. F. (2003). Deep convection in the irminger Sea forced by the Greenland tip jet. Nature 424, 152–156. doi: 10.1038/nature01729
Renault L., Deutsch C., McWilliams, Frenzel H., Liang J. H., Colas F. (2016b). Partial decoupling of primary productivity from upwelling in the California current system. Nat. Geosci. 9, 505–508. doi: 10.1038/ngeo2722
Renault L., Hall A., McWilliams J. C. (2016a). Orographic shaping of US West coast wind profiles during the upwelling season. Clim. Dyn. 46, 1–2, 273-289. doi: 10.1007/s00382-015-2583-4
Samelson R. M., de Szoeke S. P., Skyllingstad E. D., Barbour P. L., Durski S. M. (2021). Fog and low-level stratus in coupled ocean–atmosphere simulations of the northern California current system upwelling season. Mon. Wea. Rev. 149, 1593–1617. doi: 10.1175/MWR-D-20-0169.1
Samelson R. M., O’Neill L. W., Chelton D. B., Skyllingstad E. D., Barbour P. L., Durski S. M. (2020). Surface stress and atmospheric boundary layer response to mesoscale SST structure in coupled simulations of the northern California current system. Weather Rev. 148, 1, 259–287. doi: 10.1175/MWR-D-19-0200.1
Sangrà P., Pascual A., Rodríguez-Santana A., Machín F., Mason E., McWilliams J. C., et al. (2009). The canary eddy corridor: a major pathway for long-lived eddies in the subtropical north Atlantic. Deep Sea Res. I: Oceanogr. Res. Pap. 56, 2100–2114. doi: 10.1016/j.dsr.2009.08.008
Schwing F. B., Mendelssohn R. (1997). Increased coastal upwelling in the California current system. J. Geophys. Res. Oceans 102, 3421–3438. doi: 10.1029/96JC03591
Shchepetkin A. F., McWilliams J. C. (2005). The regional oceanic modeling system (ROMS): a split-explicit, free-surface, topography-following-coordinate oceanic model. Ocean Model. 9 (4), 347–404. doi: 10.1016/j.ocemod.2004.08.002
Skamarock W. C., Klemp J. B., Dudhia J., Gill D. O., Barker D., Duda M. G., et al. (2008). A description of the advanced research WRF version 3. NCAR technical note, 475+STR. (University Corporation for Atmospheric Research). doi: 10.5065/D68S4MVH
Taylor S. V., Cayan D. R., Graham N. E., Georgakakos K. P. (2008). Northerly surface winds over the eastern north pacific ocean in spring and summer. J. Geophys. Res. 113, D02110. doi: 10.1029/2006JD008053
Tozer B., Sandwell D. T., Smith W. H. F., Olson C., Beale J. R., Wessel P. (2019). Global bathymetry and topography at 15 arc sec: SRTM15+. Earth Space Sci. 6, 1847–1864. doi: 10.1029/2019EA000658
Vazquez R., Parras-Berrocal I., Cabos W., Sein D. V., Mañanes R., Izquierdo A. (2022). Assessment of the canary current upwelling system in a regionally coupled climate model. Clim. Dyn. 58, 69–85. doi: 10.1007/s00382-021-05890-x
Verhoef A., Portabella M., Stoffelen A. (2012). High-resolution ASCAT scatterometer winds near the coast. IEEE Trans. Geosci. Remote Sens. 50, 7, 2481–2487. doi: 10.1109/TGRS.2011.2175001
Warner J. C., Armstrong B., He R. Y., Zambon J. B. (2010). Development of a coupled ocean–atmosphere–wave–sediment transport (COAWST) modeling system. Ocean Model. 35, 230–244. doi: 10.1016/j.ocemod.2010.07.010
Warner J. C., Perlin N., Skyllingstad E. D. (2008). Using the model coupling toolkit to couple earth system models. Environ. Model. Software 23, 1240–1249. doi: 10.1016/j.envsoft.2008.03.002
Wu H., Zhu J. (2010). Advection scheme with 3rd high-order spatial interpolation at the middle temporal level and its application to saltwater intrusion in changjiang estuary. Ocean Model. 33, 33–35. doi: 10.1016/j.ocemod.2009.12.001
Keywords: Canary upwelling system, low-level jets, intra-seasonal variability, Kelvin waves, Azores anticyclone, numerical modelling
Citation: Alves JMR, Miranda PMA and Caldeira RMA (2023) Low-level jets drive the summer intra-seasonal variability of the Canary upwelling system. Front. Mar. Sci. 10:1068134. doi: 10.3389/fmars.2023.1068134
Received: 12 October 2022; Accepted: 14 June 2023;
Published: 13 July 2023.
Edited by:
Francisco Machín, University of Las Palmas de Gran Canaria, SpainReviewed by:
David Rahn, University of Kansas, United StatesXiaobiao Xu, Florida State University, United States
Copyright © 2023 Alves, Miranda and Caldeira. This is an open-access article distributed under the terms of the Creative Commons Attribution License (CC BY). The use, distribution or reproduction in other forums is permitted, provided the original author(s) and the copyright owner(s) are credited and that the original publication in this journal is cited, in accordance with accepted academic practice. No use, distribution or reproduction is permitted which does not comply with these terms.
*Correspondence: José M. R. Alves, am9zZS5hbHZlc0Bvb20uYXJkaXRpLnB0