 Xia Li1,2,3†
 Yanzi Cai2,4†
 Zezheng Liu2,4
 Xiaobiao Mo5
 Li Zhang3,6,7
 Cheng Zhang1,8
 Baoshan Cui2,4*
 Ze Ren1,2*
- 1Research and Development Center for Watershed Environmental Eco-Engineering, Beijing Normal University, Zhuhai, China
- 2State Key Laboratory of Water Environment Simulation, School of Environment, Beijing Normal University, Beijing, China
- 3Southern Ocean Science and Engineering Guangdong Laboratory (Guangzhou), Guangzhou, China
- 4School of Environment, Beijing Normal University, Beijing, China
- 5Faculty of Arts and Sciences, Beijing Normal University, Zhuhai, China
- 6South China Sea Institute of Oceanology, Chinese Academy of Sciences (CAS), Guangzhou, China
- 7University of Chinese Academy of Sciences, Beijing, China
- 8School of Engineering Technology, Beijing Normal University, Zhuhai, China
Introduction: Recently, accelerated sea-level rise (SLR) has raised major concerns on estuarine management and restoration because it modifies estuarine hydrodynamics, such as tidal inundation extent and amplitude, tidal current asymmetry, flood frequency, etc. Understanding underlying processes which regulate estuarine tidal dynamics is critical for mitigating potential impacts on the coastal population and development.
Methods: We selected the Pearl River Estuary (PRE), an estuary with a higher regional SLR compared to the global SLR as the study area. To identify the effects of regional SLR on tidal dynamics, we analyzed long-term records of four tidal variables from 19 gauge stations between 1952 and 2020, including annual highest tidal levels (AHTLs), annual lowest tidal levels (ALTLs), annual mean tidal ranges (AMTRs), and annual mean tidal levels (AMTLs).
Results: Results suggested that variability in tidal variables was site-specific. The AMTRs decreased gradually from offshore regions to the upper reaches of rivers with a maximum at the mouth of the estuary. In contrast, the magnitudes of the AHTLs, AMTLs, and ALTLs decreased when approaching the coastline. Distance to the coastline had the highest correlations with the AHTLs, ALTLs, and AMTLs, followed by river width and river depth. The local SLR was responsible for the temporal variability in AHTLs, ALTLs, and AMTLs at the estuarine mouth with correlation coefficients from 0.43 to 0.85 (P < 0.001) but showed low correlations with these three tidal variables at the upper reaches of rivers (P > 0.001). Instead, the tidal variables were highly correlated with river discharge at the upper reaches of rivers, especially for the AHTLs (correlation coefficient = 0.83, P < 0.0001).
Conclusions: Our study demonstrated that the tidal dynamics demonstrate significant spatial-temporal variability. Geomorphology, river discharge, and sea levels have jointly affected estuarine hydrodynamics.
1. Introduction
Estuaries are transition zones from rivers to the ocean and provide irreplaceable services such as natural habitat, recreation, navigation, and energy generation. Recently, concerns have been mounting around the vulnerability of estuaries to oceanic sea-level rise (SLR) (Khojasteh et al., 2020). Rising water levels in estuaries can potentially elevate proportions of inundation in surrounding low-lying lands, leading to severe flooding, intensification of storm surge, coastal erosion, and soil salinization (FitzGerald et al., 2008; Haigh et al., 2010; Burgos et al., 2018; Khojasteh et al., 2020; Khojasteh et al., 2021b). According to the Sixth Assessment Report (AR6) of the Intergovernmental Panel on Climate Change (IPCC), the global sea level could rise by 0.63-1.01 m under higher greenhouse gas (GHG) emission scenarios by 2100 and may even exceed 2 m due to a possible melt of the Antarctic and Greenland Ice Sheet (Bamber et al., 2019; Horton et al., 2020; Masson-Delmotte et al., 2021). Moreover, increased anthropogenic pressures from urbanization, land reclamation, and agricultural development reduce streamflow, change estuarine hydrological patterns, and threaten ecological integrity and environmental services (Zhang et al., 2010; Gao et al., 2014; Ma et al., 2019; Xie et al., 2020).
Tides (e.g., tidal range, prism, current) are key components of estuarine hydrology. In most estuaries, the gravitational effects of the Moon and Sun on the ocean are the dominant forces that cause water vertical or horizontal movements. These movements are usually referred to as tides. Dynamics in tides reflect the joint impacts of coastal processes and anthropogenic pressures on salt-fresh water mixture, circulation, sedimentation, nutrient transport, and primary productivity (Dieckmann et al., 1987; Mao et al., 2004; Bouillon et al., 2007; Liu et al., 2021a). For example, high tide is often associated with flooding and tidal asymmetry, which causes traffic problems and damage to low-lying infrastructure (Dronkers, 1986; Cherqui et al., 2015; Nabangchang et al., 2015; Fant et al., 2021). Tidal range and current have been identified as the predominant factors controlling the transport of suspended particulate matters, ultimately changing subsidence dynamics and primary productivity distributions in flat tidal zones (Dieckmann et al., 1987; Fitzgerald, 1996; Raw et al., 2019; Wang et al., 2021). Moreover, an enlarged tidal range would significantly influence water quality due to increased hydraulic gradient and saltwater intrusion (Vandenbohede and Lebbe, 2006). Therefore, an improved understanding of tidal variability will be beneficial for better environment assessments and management in coastal areas.
Geometry (e.g., length, width, depth, and shapes of the estuary) and energy drivers (e.g., river discharges, waves) are the main external drivers causing the spatial and temporal variability in tidal dynamics due to their impacts on friction, stratification, reflection, and resonance processes (Mao et al., 2004; Haigh et al., 2020; Khojasteh et al., 2021b; Khojasteh et al., 2021a; Talke et al., 2021). Channel shapes impact the tides through controlling concentrations of energy fluxing to estuaries. In converging (upstream narrowing) estuaries, the tide- and wave-driver energy funneled from sea to estuaries has been considered as the main factor determining tidal range (Van Rijn, 2011). Bathymetric characteristics of an estuary, as another geometric driver, also influence tides because the tidal levels may increase with decreased depth under a constant energy flux (Van Rijn, 2011). The additional source of energy, such as upland flows, tends to reduce the tidal range in upstream areas (Godin, 1999; Horrevoets et al., 2004). Climate change in conjunction with intensifying human activities, has further complicated the coastal hydrodynamics, such as tidal amplitude changes in response to sea level rises (SLRs) and tidal velocity decreases due to human-induced siltation (Wolanski et al., 2001; Pelling et al., 2013a; Pelling et al., 2013b). Since estuarine hydrodynamics have been receiving increasing attention (Moftakhari et al., 2017; Khojasteh et al., 2021b; Talke et al., 2021), a comprehensive understanding of river discharge, coastal geomorphology, and their combined impacts on tidal variability is essential and can provide a necessary basis for evaluating SLR influences on estuaries in the context of environmental changes.
The Pearl River Estuary (PRE) is located at the northern margin of the South China Sea, with tides propagating from the Pacific Ocean. According to the SOA (2020) the estuary suffers from an extremely high regional SLR. The global average rate of SLR was about 3.3 mm yr-1 between 1993 and 2020, but PRE experienced an increased rate of 3.9 mm yr-1 in SLR during the same period. Although the higher regional SLR in PRE has enhanced the surface elevation of peak storm surge and typhoon intensity (Yin et al., 2017; Zhang et al., 2017; Jian et al., 2021), it did not significantly increase the submerged area in PRE, as was predicted by Li et al. (Li et al., 1993). Instead, intensified human activities, such as dam construction and reclamation, have led to changes in upstream discharge, accelerated losses of the shoals and waterways, alterations in inundation area distributions, and landward migration of coastlines (Chen et al., 2005; Li and Damen, 2010; Shao et al., 2020; Liu et al., 2021b). Tidal changes in our study area have never been systemically analyzed, posing challenges to climate change mitigation and environmental risk management. The long-term and spatially-explicit study can help us better understand the tidal changes under regional SLR, which is urgent for flood control and coastal ecosystem management in the Pearl River Bay area. Therefore, our study aims to investigate the long-term tide variability under climate change and human disturbances. The objectives of this study are to 1) investigate spatial and temporal variability in tides in PRE and 2) explore to which extent the SLR dominates the tidal dynamics.
2. Study area
As the second largest estuary in China, the PRE is located along the coast of Guangdong Province, with a longitude of 113°E-115°E and a latitude of 21°N-23°N. The mean annual rainfall ranges from 1600 to 2300 mm, and the mean annual temperature ranges from 14 to 22 °C. Tides propagate from offshore to the estuary, resulting in a mean tidal range from 1.0 to 1.7m. The Pearl River, including three main branches - West River, North River, and East River, flows into the South China Sea through PRE. The annual average freshwater discharge of Pearl River is 10,000 m3 s-1, with a maximum of 20,000 m3 s-1 in the wet seasons and a minimum of 3,600 m3 s-1 in the dry seasons (Zhang et al., 2008). In total, the Pearl River delivers 350 × 109 m3 of freshwater and 85 × 106 tons of sediment loads to PRE per year.
The PRE is subject to intensive human interventions and climate change. Anthropogenic activities have caused sustainable changes in ecology, environments, and hydrology. From 1990 to 2015, construction land increased about two times (Liu et al., 2019). Accelerated urbanization resulted in landscape fragmentation (Hu et al., 2021), notorious pollution (Wang and Hao, 2020), hydrological connectivity changes (Shao et al., 2020), and discharge reduction (Horrevoets et al., 2004; Liu et al., 2022), leading to the irreversible structural and functional deterioration of the estuarine ecosystem (Zhang et al., 2010).
3. Methods and materials
3.1. Data collection
We collected annual highest tidal levels (AHTLs), annual lowest tidal levels (ALTLs), annual mean tidal ranges (AMTRs), and annual mean tidal levels (AMTLs) from 19 gauge stations in the PRE area to explore the hydrodynamics of the estuary (Figure 1). The AHTL group refers to the largest tidal level over a year at a station, caused by storm surges (Talke and Jay, 2020). On the contrary, the ALTL is the lowest tidal level at a station over a year. The AMTL is the mean daily tidal level obtained by averaging the daily high mean tidal level and low mean tidal level. The tidal range is defined as the differences between the high mean tidal level and the low mean tidal level per day, and the AMTR is the annual averaged value of tidal ranges. The start times of the gauge observations vary with stations with the earliest observations being in 1951. Besides tidal levels, we also collected streamflow data of the Pearl River from Makou, Sanshui, and Bolou stations. We digitalized all the above data from the Hydrological Yearbooks of the People’s Republic of China.
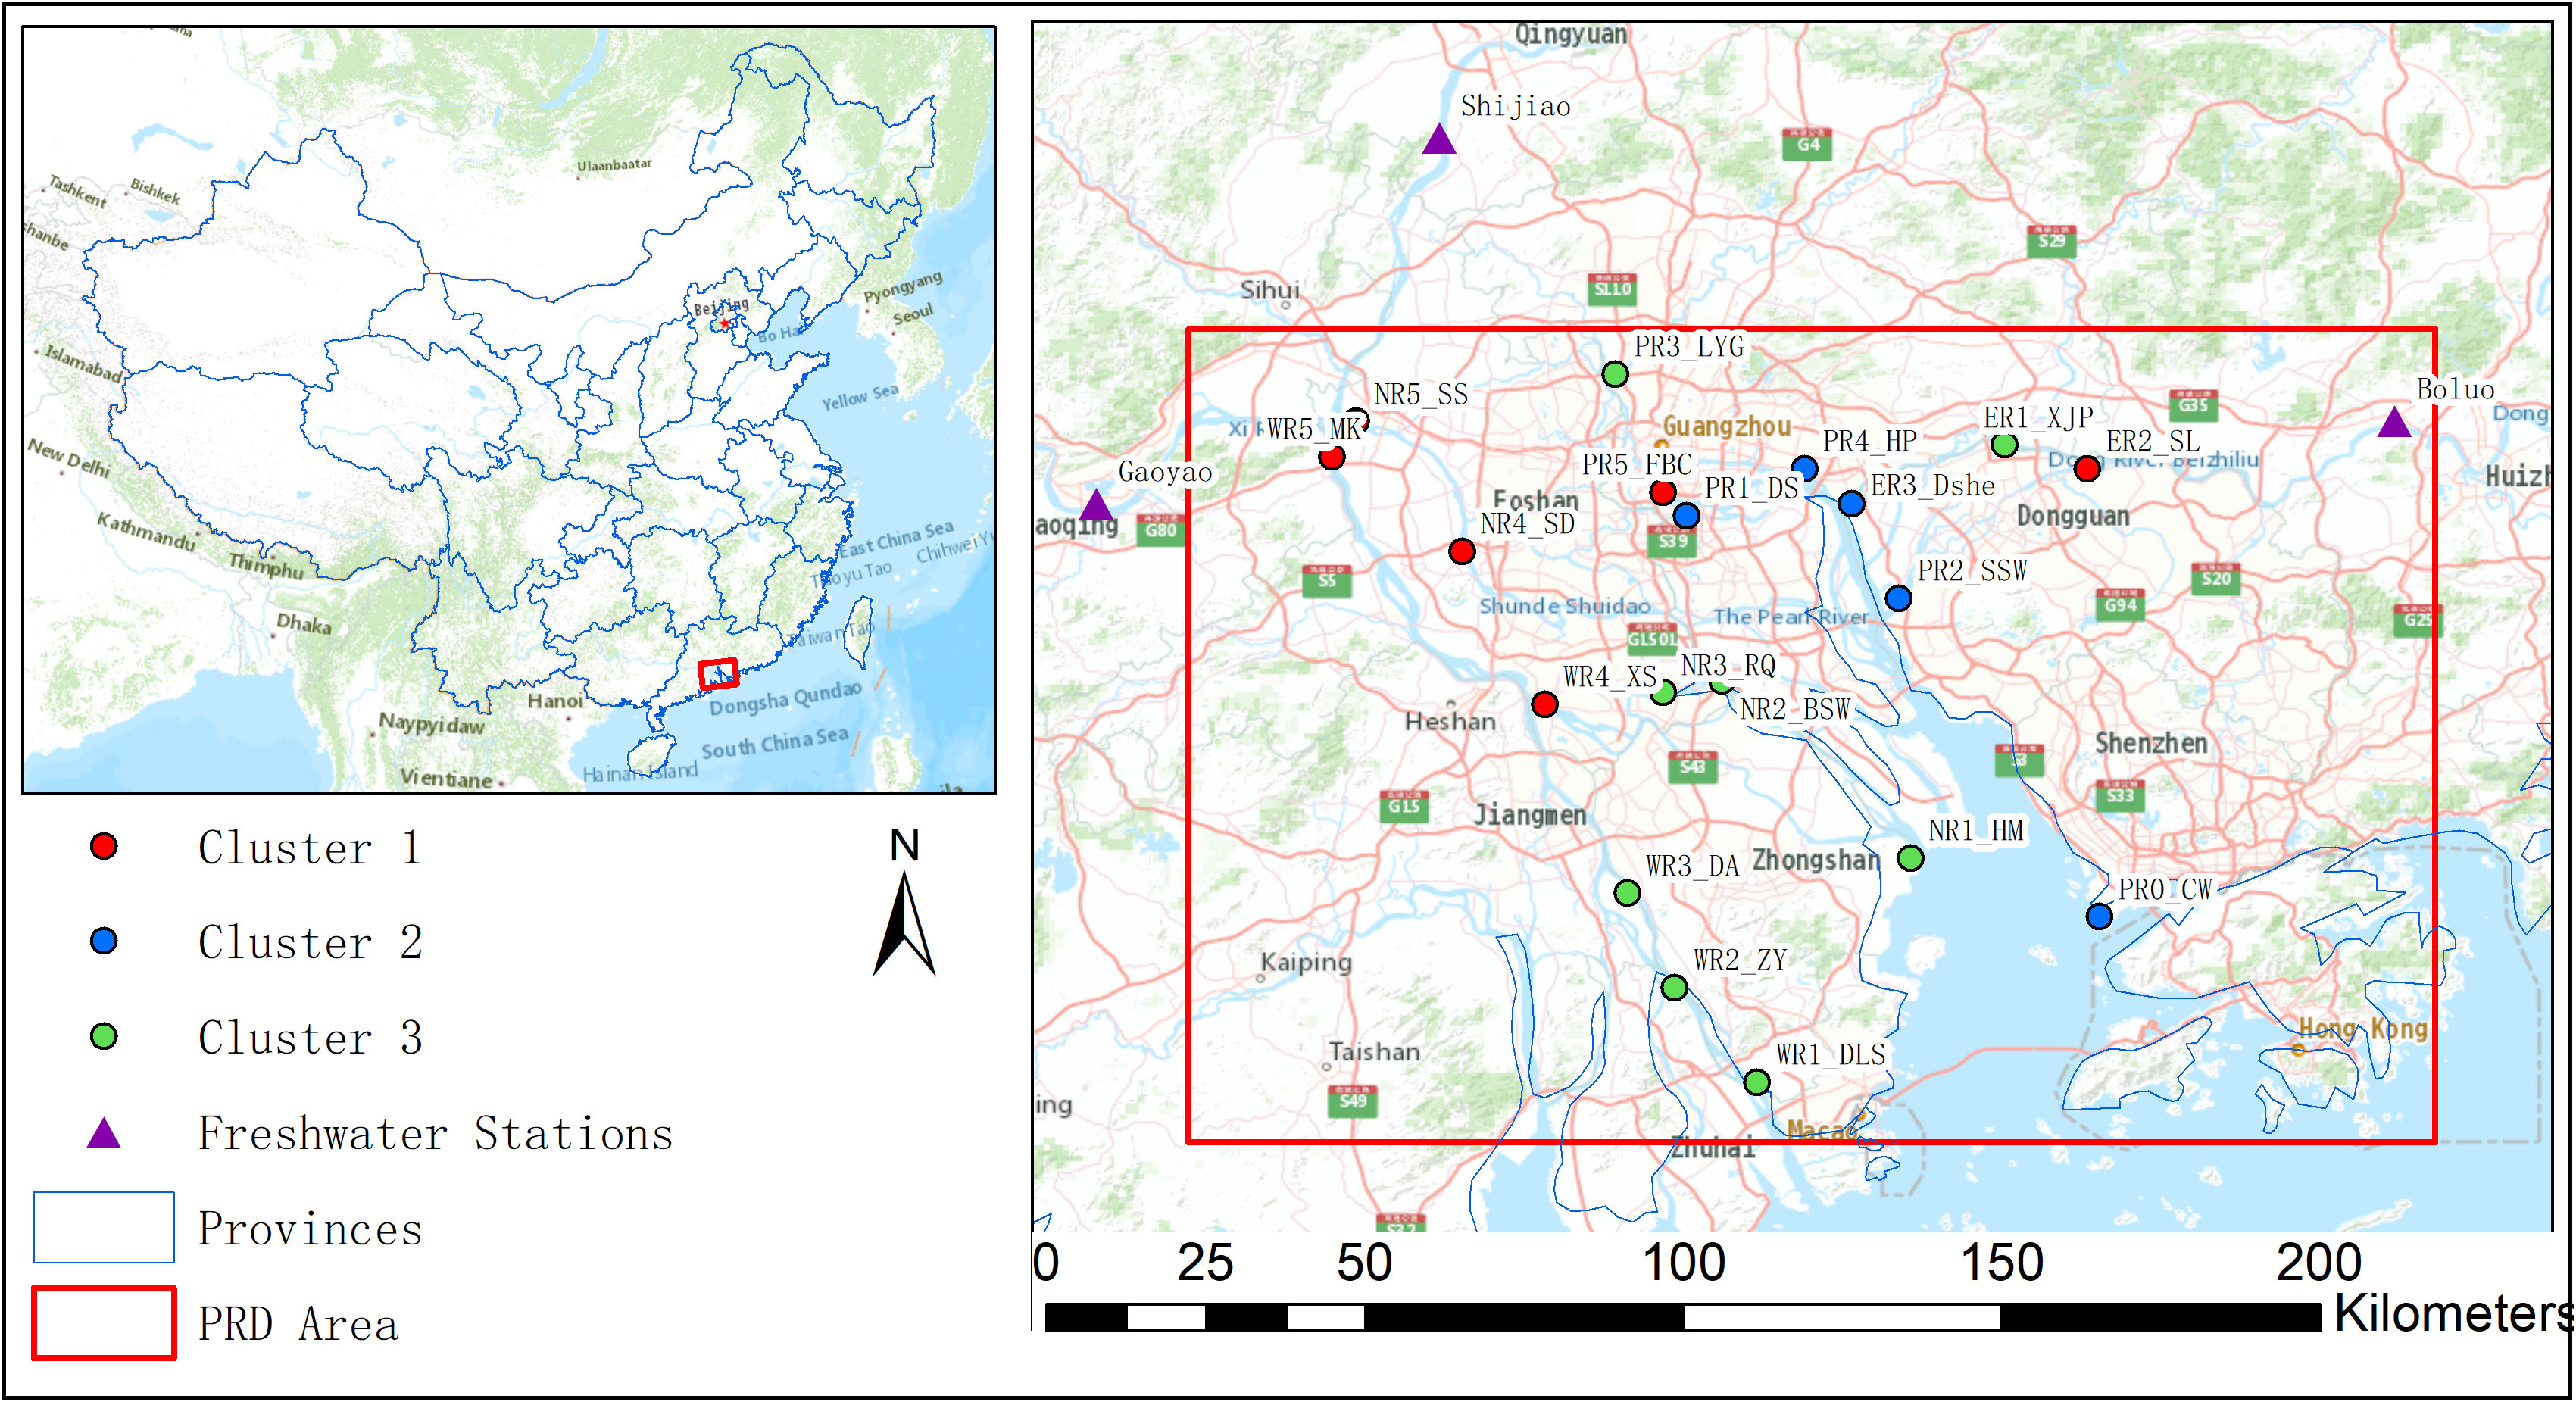
Figure 1 Location of Pearl River Estuary (PRE) and the selected stations (Stations of different clusters were grouped in the Results).
Geomorphological variables, such as distances of hydrological stations to the estuary (DTE), distances to the coastline (DTC), river channel width (RW), and water depth (WD), were derived from multiple sources (Table 1). The DTE is defined as the distance of a station to the estuary. This variable was digitalized from the Hydrological Yearbooks of the People’s Republic of China. Based on the locations and DTE, we renamed the stations using the abbreviations of main branches plus the ranking of stations according to the DTE values from the lowest to the highest. The river channel width was an averaged width over a 400 - 500 m waterway around a station based on the high-resolution basemap imagery in the ArcMap software package. We derived the river depth (WD) through ETOPO1 Global Relief Model (https://www.ngdc.noaa.gov/mgg/global/global.html). The river depth is the average water depth within a 400 - 500 m buffer zone around each station. We also quantified DTC values since tidal dynamics are closely related to the travel paths of ocean waves. The coastline of PRE was derived from the Coastline Extractor program, the GEODAS-NG (GEOphysical DAta System - Next Generation) software developed by NOAA/National Geophysical Data center (https://www.ngdc.noaa.gov/mgg/geodas/trackline.html). We used the “Point Distance” command in ArcGIS 10.3 to measure the distance of each station to the closest coastline (DTC). The rates of sea-level changes were collected from the SOA (2020) and tidal gauge records from the study of Church and White (Church and White, 2006).
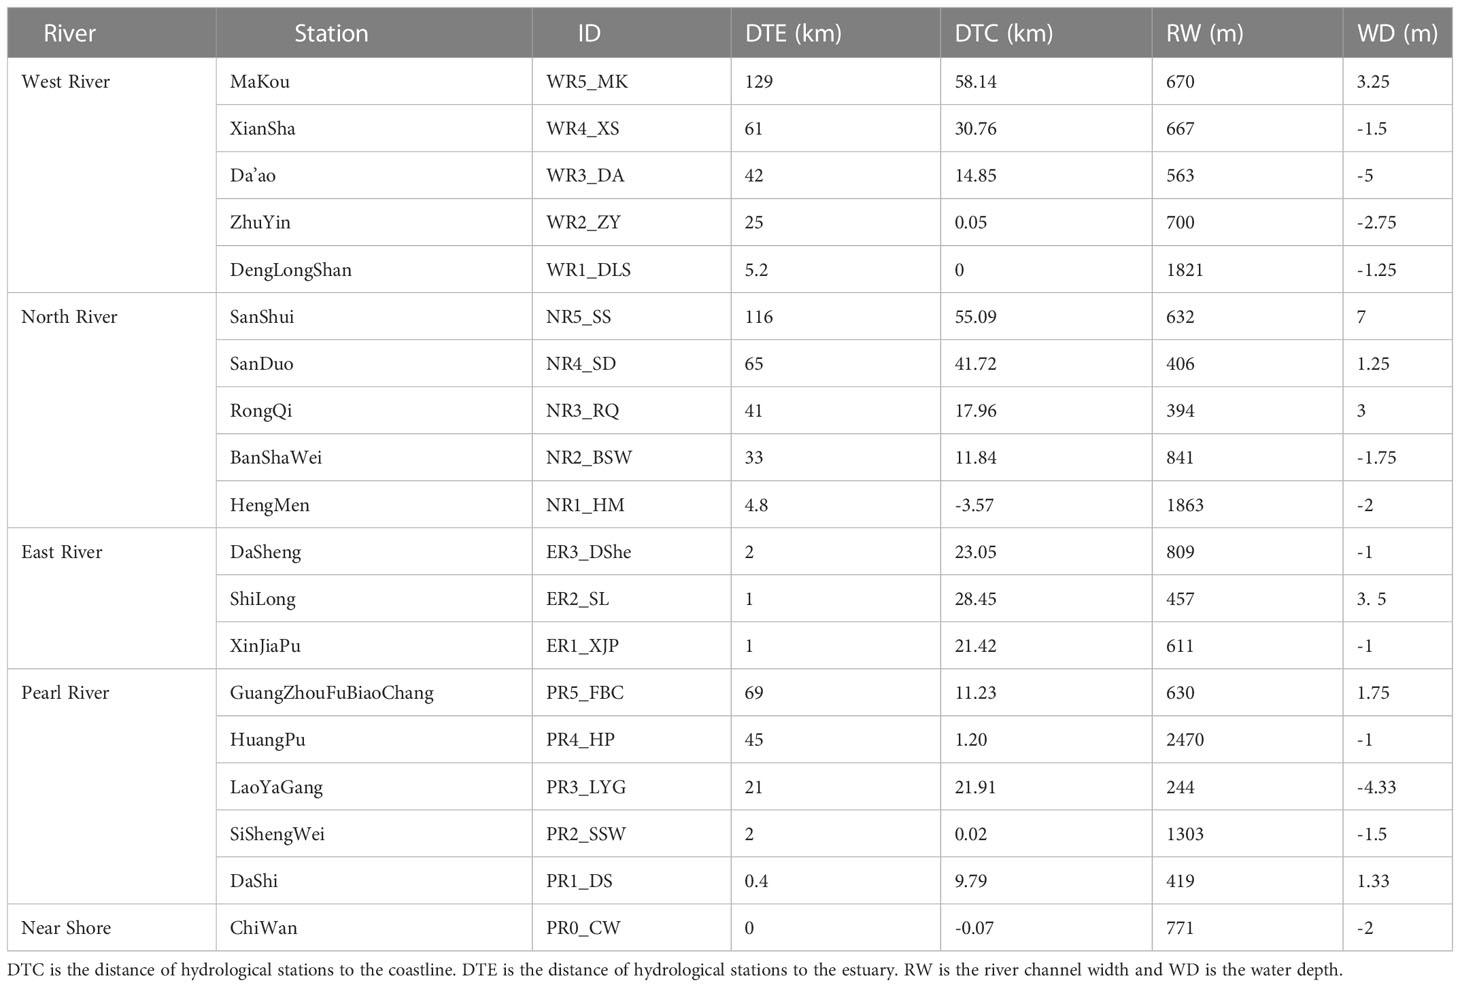
Table 1 The morphological characteristics at hydrological stations.
3.2. Statistical analyses
To better understand the factors causing the spatial variability of tidal variables, we performed the Spearman’s rank correlation to test relationships between the selected variables and geomorphological features, river discharge, and SLR. Spearman’s rank correlation is a nonparametric technique and evaluating the degree of correlation of two independent variables through the ranks of the data (Gauthier, 2001). The nonparametric characteristics of Spearman’s rank correlation can limit the impacts of non-normal distribution on data analysis. We further conducted clustering analysis to understand mechanisms regulating spatial patters of the tides. The K-mean cluster with Elbow Method was applied to classify the 19 stations into several groups based on the four tidal variables’ similarity (mean values). We then calculated long-term trends of tidal variables in each cluster using linear regression and tested the statistical significance of the regression slopes for trend detections. We used the P-values (statistical significance) of 0.05 to test whether trends and correlations were statistically significant.
In addition, the Complex Morlet wavelet (CMW) transform was applied to detect periodical changes in each cluster. It is a complex sine wave localized by a real-valued Gaussian window. The CMW is useful in extracting time-frequency characteristics of non-stationary vibration signals, such as tidal dynamics (Flinchem and Jay, 2000; Lopes and Tenreiro Machado, 2017). The time domain and frequency domain of CMW can be defined as follows:
where t is the time; i is the imaginary operator; w0 is the non-dimensional frequency. In this study, w0 is set to 6.0 to satisfy the wavelet admissibility condition. The transform coefficient ΨCMW (t) represents the signal strength (local wavelet spectra) of time scales. The real parts of transform coefficients extract intensify (amplitude) and phase information of time scales, showing the periodic distribution of the signal in the time domain. The global wavelet power spectra V (a) of clusters were also calculated to identify the dominant periodic components:
where n is the length of the time series. Therefore, higher values of the wavelet variance at a given scale suggest more times of peaks and greater intensified values of the time series signal. All statistical analyses were carried out using R version 4.1.0.
4. Results
4.1. Spatial variability of tidal dynamics
Tidal variables presented substantial spatial variability in the PRE. The AHTLs, ALTLs, and AMTLs increased with the increasing distances from coastlines, but the AMTRs decreased from near-shore regions to upper reaches (Table 2). AHTLs and ALTLs in the lower reaches of PRE were less than those in the higher reaches, while tidal ranges were higher for stations located closer to river inlets of the estuary (Table 2). For stations (WR5_MK and NR5_SS) located along the West and North rivers, the AHTLs were the highest, with values of more than 6.90 m. Extremely high inter-annual fluctuations of AHTLs were also found at the mentioned upstream stations (WR5_MK and NR5_SS), as indicated by the largest SD values than at the other stations. AHTLs tend to be smaller at the mouth of the PRE. Similar statistical characteristics with the highest tidal levels and SD values at the upper-reach stations and lowest tidal levels and SD values at the lower-reaches stations were observed for ALTLs and AMTLs. The annual mean tidal ranges (AMTRs) showed relatively low values at the upper reaches and high values at the lower reaches, suggesting increasing deviations between the daily high and low tidal levels for stations closer to the coastline. The near-shore station PR0_CW exhibited the highest AMTR of 1.36 m, which was about 3.8 times the lowest AMTR value observed at WR5_MK in the upstream region of the West River (Figure 1).
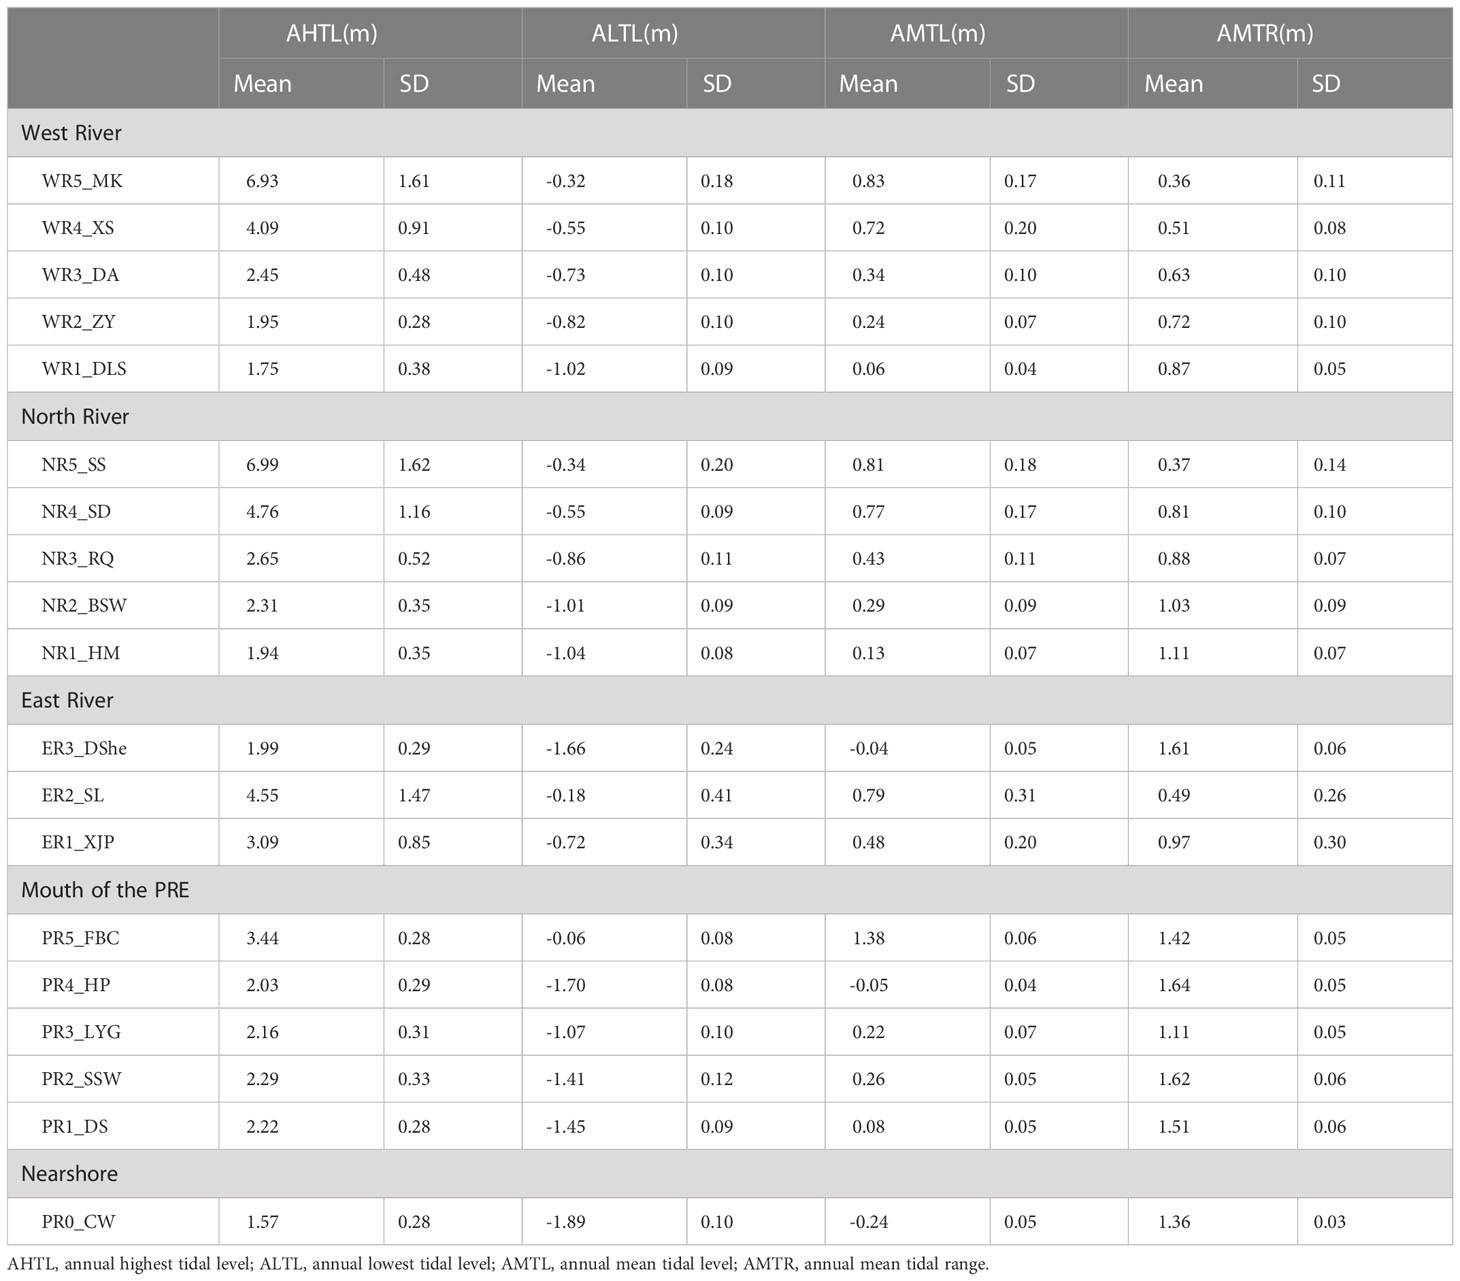
Table 2 Mean values and standard deviations (SDs) of the tidal currents and tidal ranges at 20 hydrological stations in PRE.
To better understand factors leading to the differences in the mean and SD values of tidal dynamic variables at different stations, we quantified controls of geomorphological variables on tidal levels through Spearman’s Rank Correlation (Table 3). The DTC significantly influenced all tidal variables, as suggested by the highest correlation coefficients with tidal variables among all factors. DTE and WD controls on tides were similar to DTC, but the correlation coefficients were smaller. RW demonstrated significantly negative correlations with AHTLs and AMTLs (Table 3).
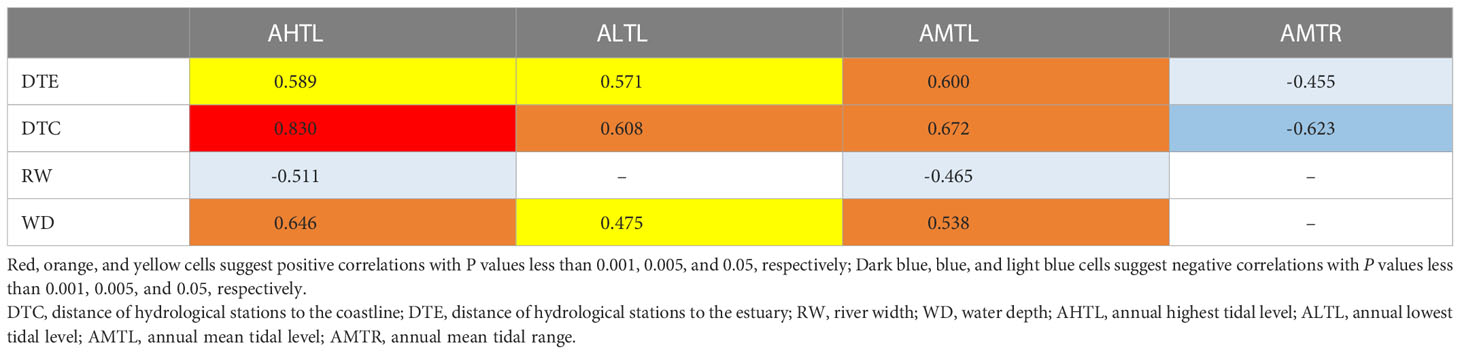
Table 3 Correlations between geomorphological variables and tidal level variables.
Since the variables showed significant variability in mean and SD values, we tried the k-mean cluster analysis to sort all 19 stations into clusters based on AHTLs, ALTLs, AMTLs, and AMTRs. After exploring the optimal number of clusters, we grouped the stations into three clusters, which present strong spatial patterns (Figure 2). The first cluster are stations in the upper reaches of the rivers, including WR5_MK, WR4_XS, NR5_SS, NR4_SD, ER2_SL, and PR5_FBC; cluster 2 are stations in the mouth of PRE, including ER3_Dshe, PR4_HP, PR2_SSW, PR1_DS, and PR0_CW; and cluster 3 are stations in middle and lower reaches of the rivers, including WR3_DA, WR2_ZY, WR1_DLS, NR3_RQ, NR2_BSW, NR1_HM, ER1_XJP, and PR3_LYG.
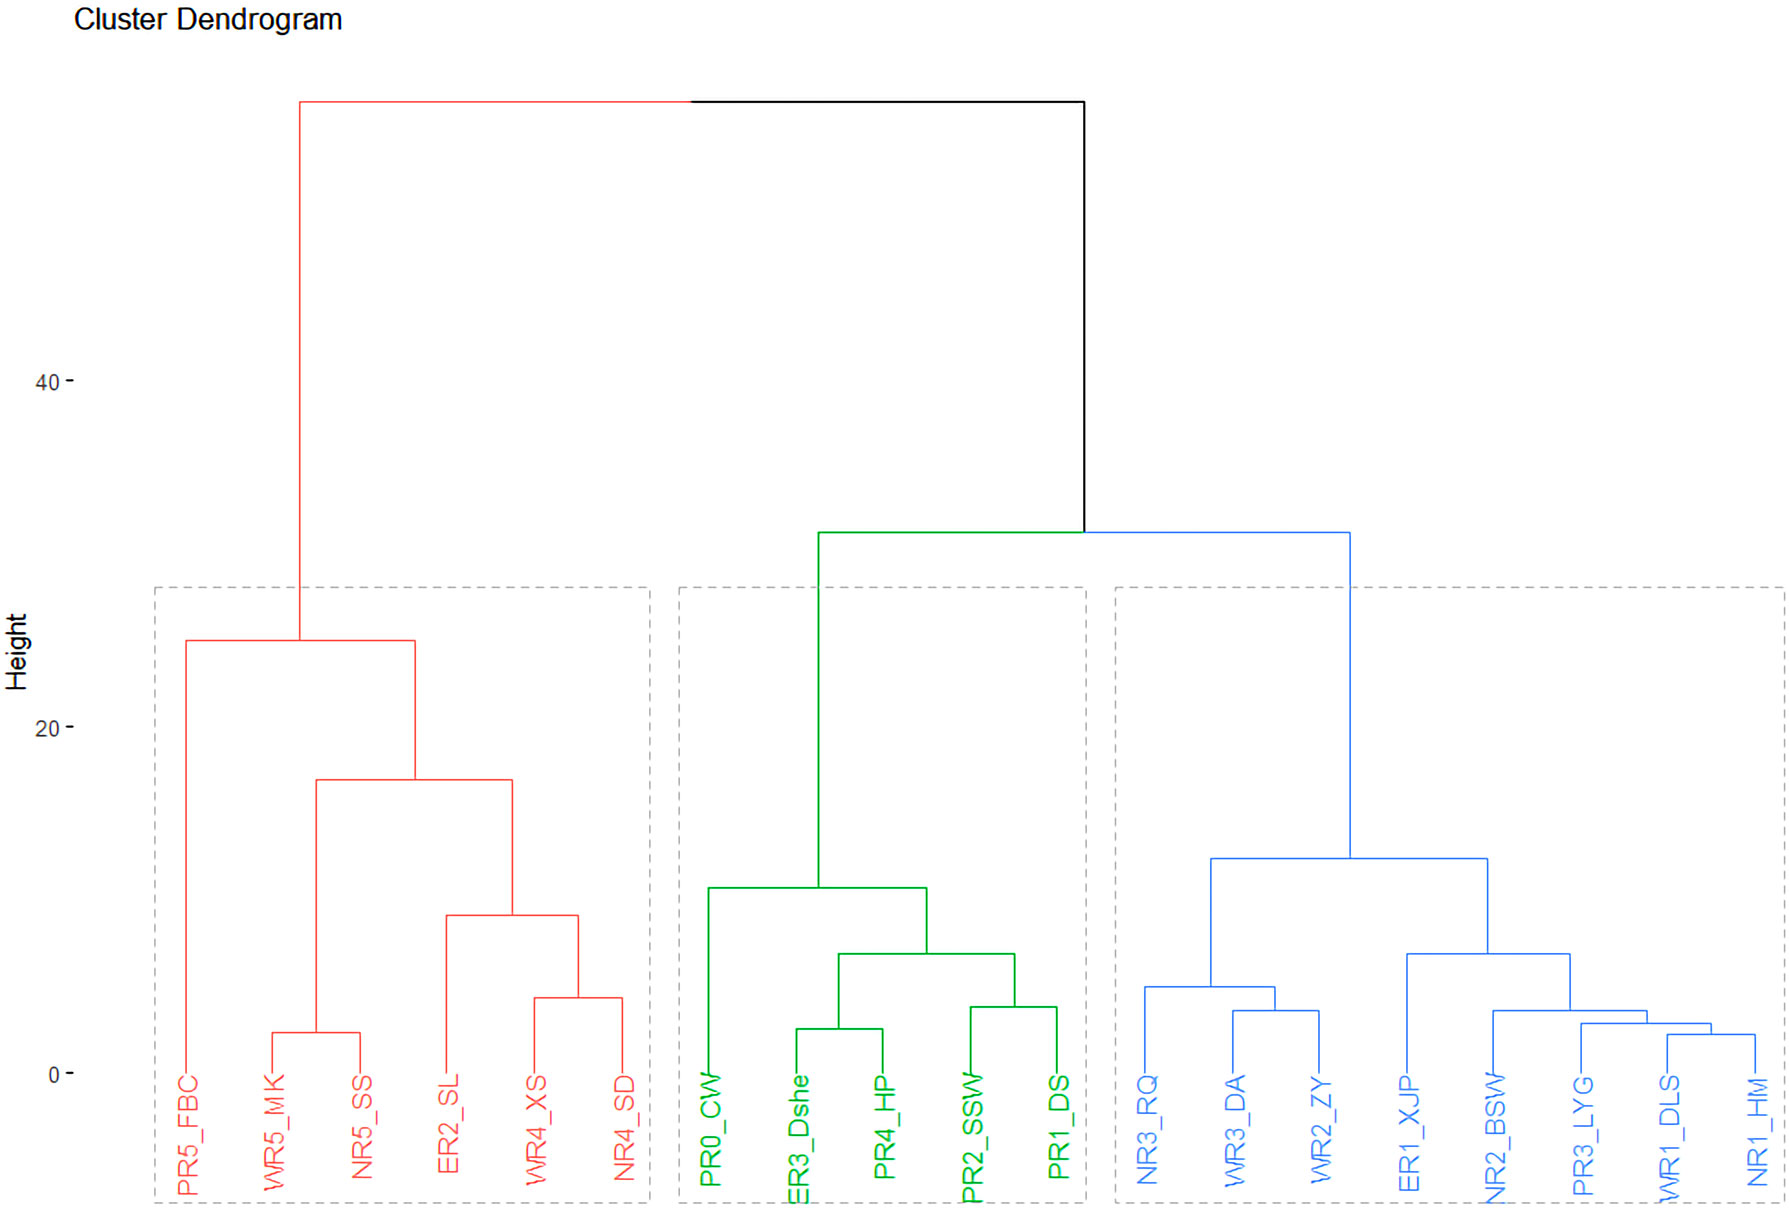
Figure 2 K-mean cluster diagram of the hydrological stations based on standardized tidal variables in the PRE, China.
We obtained different temporal variability and trends at different clusters (Table 4). For AHTLs, the highest value of 5.23 m was found in Cluster 1, which was more than two times higher than that in Clusters 2 (2.02 m) and 3 (2.29 m). A significant downward trend (slope -0.044, P< 0.0001) was observed in Cluster 1. The decreasing rate of 0.044 m/yr was the highest trend value in all clusters. Although the mean values of AHTLs were both around 2 m in Clusters 2 and 3, the trends in the annual time series were different from each other. The mean values of AHTLs in Cluster 2 showed a significant upward trend (slope 0.0074, P< 0.001) with the lowest variability (lowest SD value, 0.38 m). In contrast, the mean values of AHTLs in Cluster 3 did not show any significant trend, and the variability among stations was higher (0.63 m) than that in Cluster 2. Similarly, we also found the highest mean values of ALTLs (-0.34 m) and AMTLs (0.86 m) in Cluster 1 and the lowest values of ALTLs (-1.63 m) and AMTLs (0.0007 m) in Cluster 2. The mean values of these two tides were significantly decreased with time in Cluster 1 (ALTL: slope -0.0081, P< 0.0001; AMTL: slope -0.0091, P< 0.0001) and increased with time in Cluster 3 (ALTLs: slope 0.0034, P< 0.0001; AMTLs: slope 0.0022, P< 0.0001). As for AMTRs, we found upward trends in all clusters, but the increased rates varied with clusters. The mean value of AMTRs was 0.59 m, the lowest in Cluster 1, but experienced the highest increase with the rate of 0.0067 m/yr. The mean value of AMTRs was the highest in Cluster 2 (1.55 m) with the lowest increasing rate of 0.0016 m/yr.
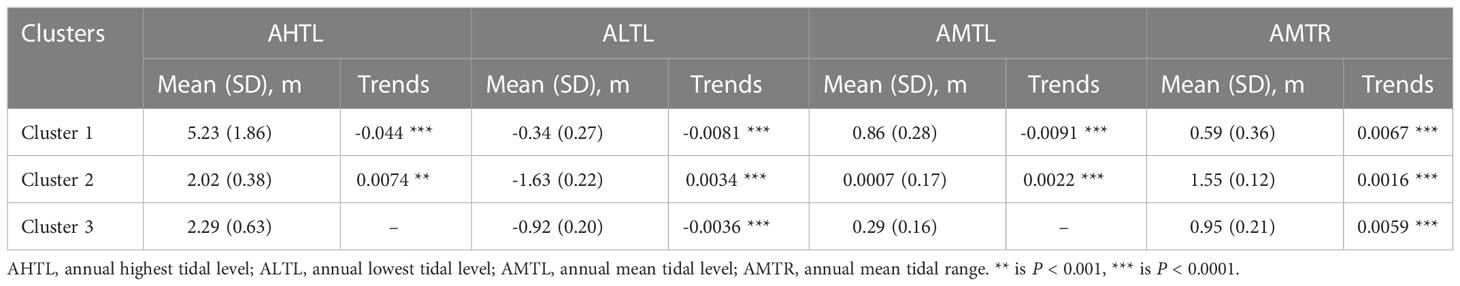
Table 4 Mean, Standard Deviations (SDs), and the temporal trends of four tidal variables in different clusters.
4.2. Temporal variability of tidal variables
In addition to magnitudes and trends, periodic patterns in different clusters were also compared to further understand long-term changes in tidal levels. Most tidal variables showed high proportions of long-period components of 30 years, in which relatively stable tidal cycles were observed and oscillated over the whole studied years (Figure 3). For AHTLs, a shift was observed from a 12-year period component to 6- year and 16-year period components in Cluster 1. A shift to a shorter year-period component was also found for AHTLs in Cluster 3 (middle and lower reaches), while slight changes were found in the periodic analyses in Cluster 2 (mouth of the PRE). For ALTLs and AMTRs, evident periodic pattern shifts were found in Cluster 1, but relative symmetric patterns were observed in Cluster 2. The short-period component shifts in AMTLs occurred after 50 years and 20 years in Clusters 1 and 3, respectively. High proportions of 10- and 25-year periodic components were observed in local and global wavelet spectra in AMTLs in Cluster 2.
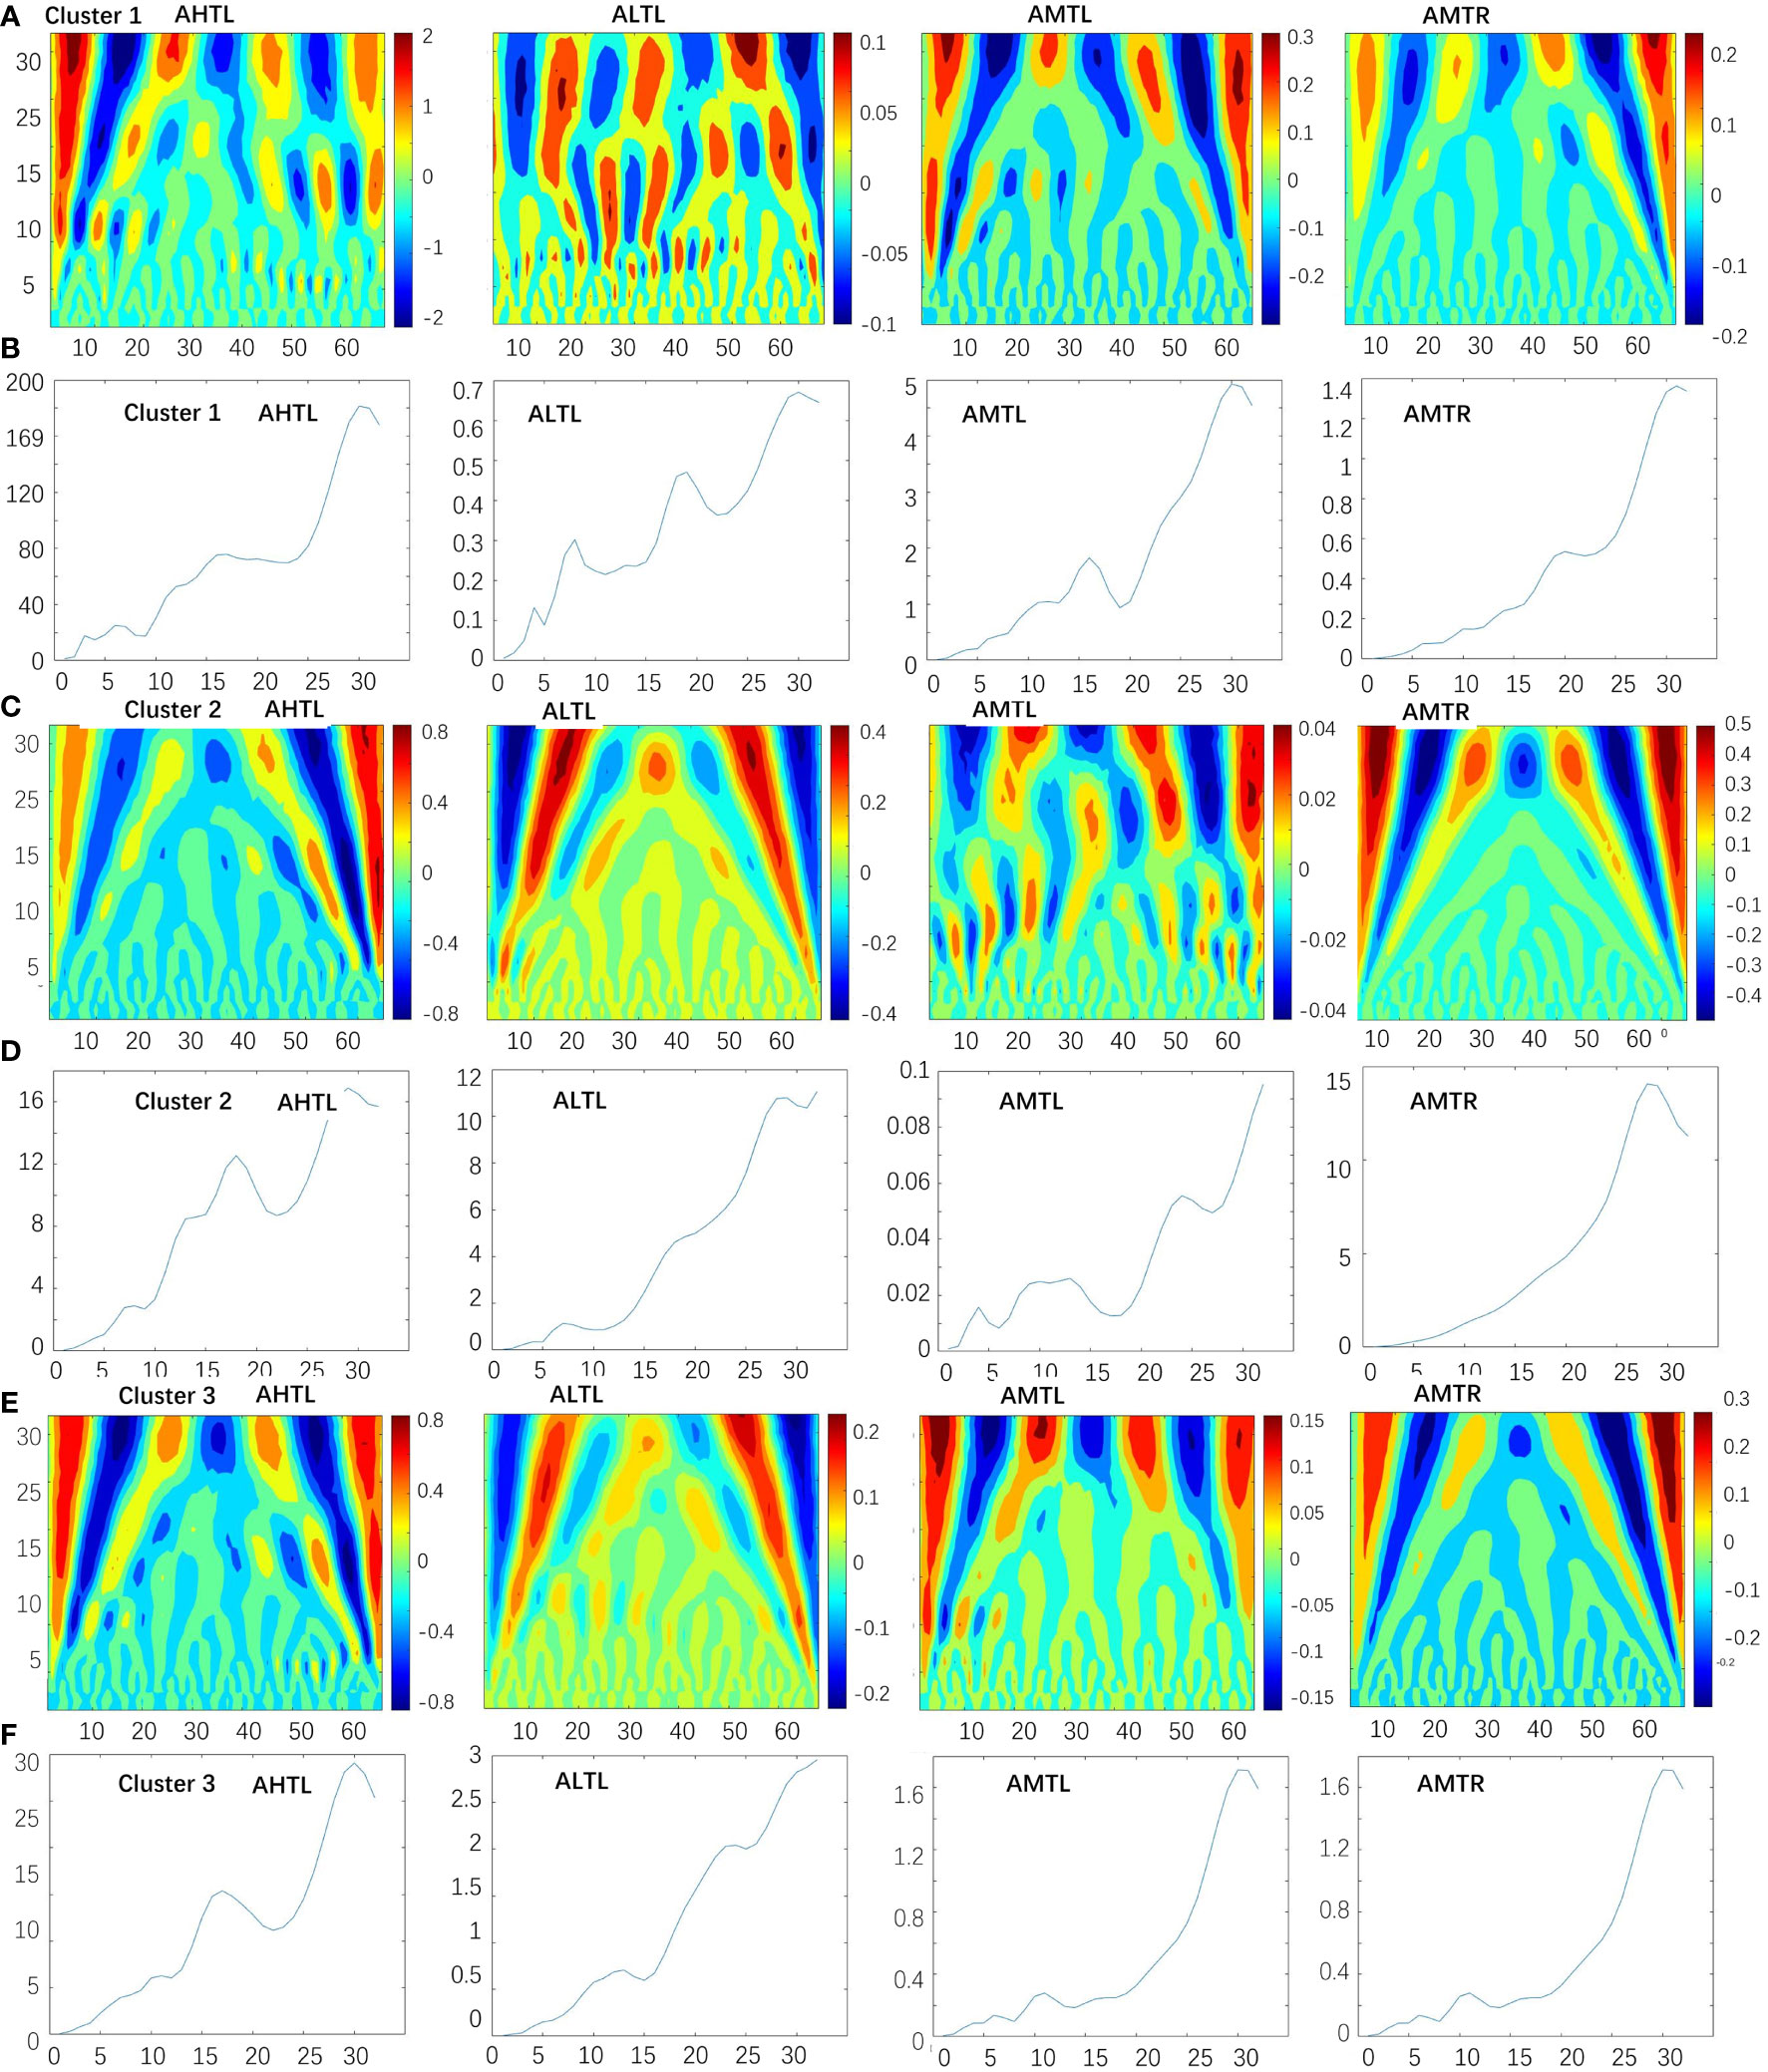
Figure 3 The local and global power wavelet spectrum of the tidal variables in PRE. (A, B) are the local and global power wavelet spectrum of AHTLs, ALTLs, AMTLs, and AMTRs in Cluster 1; (C, D) are the local and global power wavelet spectrum of AHTLs, ALTLs, AMTLs, and AMTRs in Cluster 2; (E, F) are the local and global power wavelet spectrum of AHTLs, ALTLs, AMTLs, and AMTRs in Cluster 3.
Since there were significant differences in tidal level variables among different periods, we further tested the primary energy drivers influencing tidal dynamics. The sea level has gradually increased in the recent 80 years. The mean SLR between 1950 and 2020 was about 2.6 mm yr-1, with an accelerated increased rate of 3.4 mm yr-1 in recent decades between 1980 and 2020 (Figure 4). The increased sea level would directly influence the temporal variability of AHTLs, ALTLs, AMTLs, and AMTRs. Generally, the mean AMTRs in Clusters 1 and 3 enlarged with the increased SLR, in which the correlation coefficients were larger than 0.87 (P< 0.0001, Table 5). However, no statistically significant SLR control on AMTR (P > 0.05) was found in Cluster 2. For the other three tidal level variables, the sea level changes showed stronger impacts on the mean values of AHTLs and ALTLs in the uppers (Cluster 1) and mouth of the estuary (Cluster 2) (AHTLs in Cluster 1: r = -0.55, P< 0.0001, ALTLs in Cluster 1: r = -0.64, P< 0.0001; AHTLs in Cluster 2: r = 0.43, P< 0.001, ALTLs in Cluster 2: r = 0.57, P< 0.0001) than in the middle and lower reaches of rivers (AHTLs in Cluster 3: r = -0.30, P< 0.05, ALTLs in Cluster 3: r = -0.38, P< 0.05). In Cluster 1 (located in the upper reaches of rivers), significantly negative relationships were found between SLR and the mean AHTLs, ALTLs, and AMTLs. While in Cluster 2 (located at the mouth of PRE), mean AHTLs, ALTLs, and AMTLs showed similar upward trends as the SLR. In Cluster 3, mean ALTLs and AMTLs showed negative correlations with SLR, but no significant correlation was observed between mean AHTLs and SLR.
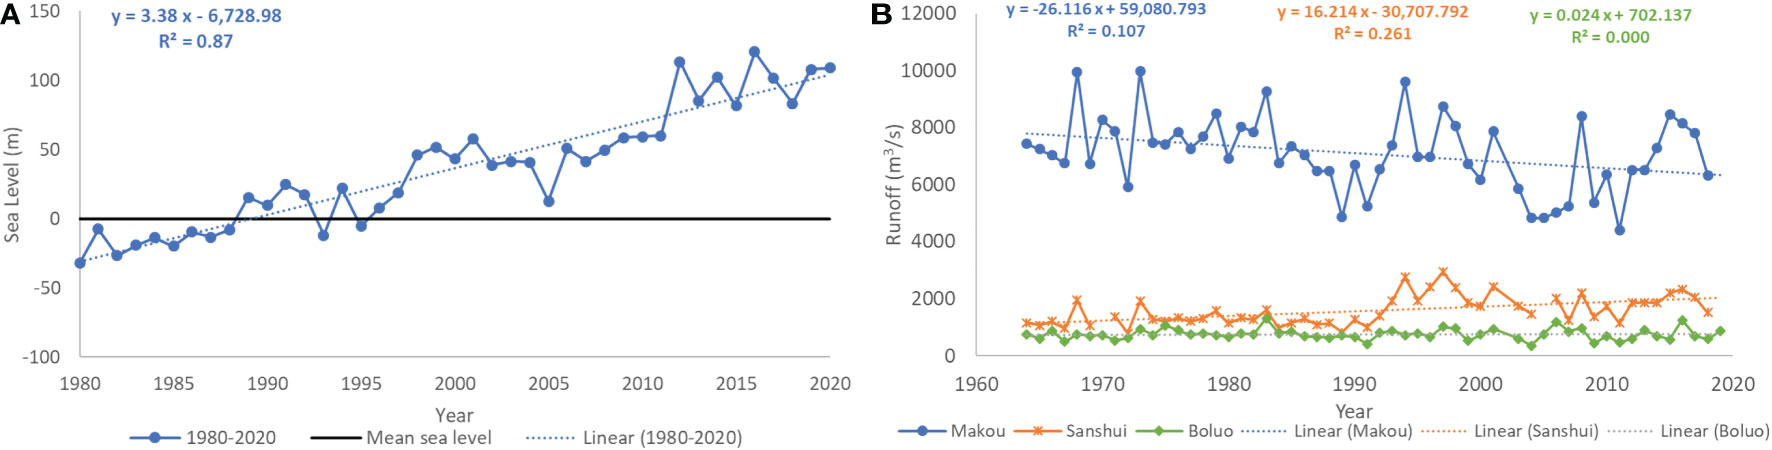
Figure 4 Time series of (A) sea level and (B) runoff. Sea level data was collection from Church and White (2006) and the SOA (2020). Zero in 4 (A) represents the 1961–2020 averages for the sea level data.
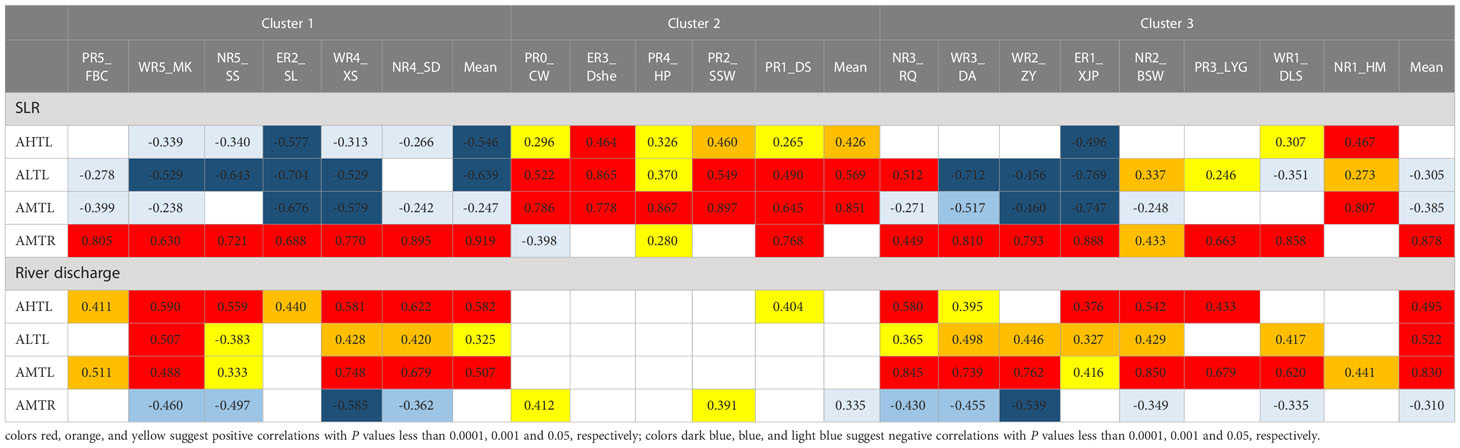
Table 5 Correlations between tidal level variables and sea level rise (SLR) and river discharge.
We further tested how SLR correlated with different tidal dynamic variables for each station (Table 5). The results showed high consistency with SLR controls on mean tidal dynamic variables for Clusters 1 and 2. Negative correlations between SLR and AHTLs, ALTLs, and AMTLs were observed for Cluster 1 stations. In contrast, positive correlations between SLR and AHTLs, ALTLs, and AMTLs were observed at the mouth of the estuary (Cluster 2). However, large inconsistencies were observed for stations of Cluster 3. Specifically, both positive and negative correlations between SLR and tidal dynamic variables were found for stations of this cluster.
Besides SLR, we also analyzed the correlations between runoff and tidal variables to investigate the river discharge controls on tides (Table 5). For the river discharge time series data, only the river discharge collected from the Makou station in the West River showed a slightly downward trend (Figure 4B, R2 = 0.11 P< 0.05). Significantly increased river discharge with time in the North Rivers was recorded at the Sanshui station (Figure 4B, R2 = 0.26, P< 0.0001). We found no significant decreasing or increasing trend for the river discharge collected from the Bolou station in the East River (P > 0.05). When relating the river discharge data with tides, we discovered that the river discharge changes were highly correlated with the AHTLs, ALTLs, AMTLs, and AMTRs in Clusters 1 and 3. Significantly high correlation coefficients were observed between the river discharge and mean values of AHTLs (r = -0.50, P< 0.0001), ALTLs (r = -0.52, P< 0.0001), and AMTLs (r = -0.83, P< 0.0001) in Cluster 3, in which insignificant or weak SLR effects were found. However, for the stations at the mouth of the estuary (Cluster 2), river discharge only had weak controls on mean values of tidal ranges (r = 0.34, P< 0.05) and no impacts on other variables (P > 0.05). Specifically, not all stations of the same cluster showed similar correlations with river discharge. The larger volume of river discharge led to higher AHTLs, ALTLs, and AMTLs across most stations in Clusters 1 and 3. Effects of river discharge on AMTRs varied with the main flow path changes. Negative correlations were found between the river discharge of the Makou station and AMTRs in the West River, and between the river discharge of the Sanshui station and AMTRs. No correlations or weak positive correlations were found between river discharge and AMTRs for most stations of the East River and the mouth of PRE.
5. Discussion
5.1. Geomorphological impacts on tidal dynamics
Although the tide is an astronomical force-caused phenomenon, it can be influenced by geomorphological variability, river discharge, and climate change (Hoitink and Jay, 2016; Burgos et al., 2018; Sulaiman et al., 2021). When the tidal wave propagates up the river, the crest and trough of the wave also move up progressively. Such a progressive wave can be significantly influenced by river width and depth. The increased amplitude of tides would be expected if river width/depth decreased since the same amount of water is passing from a larger cross-section to a smaller cross-section (Hinton, 1996; Talke et al., 2021). The tidal amplification due to the gradual decline of the estuarine width is called funneling; and the tidal amplification caused by the gradual decline of the estuarine depth is called shoaling. Van Rijn (2011) further clarified that the funneling and shoaling phenomena could be explained by the concept of tidal wave energy flux. The squared tidal range would negatively linearly correlate with the width if there was no energy loss and no reflection at the head. Our study did not find significant correlations between AMTRs and RWs or between AMTRs and squared RWs (r = 0.365, P > 0.05). Instead, positivity correlations were found between water depth and AHTLs, ALTLs, as well as AMTLs. The insignificant RW effects and significant WD effects on tidal levels can be explained by the bottom friction that increased energy dissipates as the WD decreases (Hinton, 1996; Huess and Andersen, 2001; Yu et al., 2017).
Furthermore, decreasing tidal ranges over the DTC were observed due to the tidal wave reflection. This may be related to the impacts of waterway lengths that the DTC reflects. During the tide transformation, the wave propagation is reflected back from a sudden decrease in width or close end, combined with the incident wave, forming a standing tide wave (Van Rijn, 2011; Díez-Minguito et al., 2012). The waterway length along its travel can significantly influence this standing tidal wave because of the energy loss (Davies and Woodroffe, 2010). If the waterway is long enough, the tidal range will decrease when moving up along river waterways. The reason is that the reflected wave may coincide with the incident wave, and the two waves can cancel out parts of the wave energy (Khojasteh et al., 2020; Khojasteh et al., 2021a; Khojasteh et al., 2022). In the PRE, the tidal limits could reach as far as hydrological stations Gaoyao, Shijiao, and Boluo stations in the West River, North River, and East River, respectively (Figure 1), which are located further up from the 19 selected stations for tide analysis (Zhang et al., 2010). The long waterway length may be responsible for the negative relationship between tidal ranges and DTC values. Similar attenuation effects caused by the waterway length were also observed in the study of Khojasteh et al. (2020), which analytically demonstrated decreased tidal ranges along with waterway lengths less than 100 km.
5.2. Energy driving forces on tidal dynamics
The astronomical forces lead to variations in tides, including daily cycles induced by the rotation of the Earth, fortnightly cycles caused by the rotation of the Moon, semi-annual cycles caused by the annual revolution of the Earth around the Sun, as well as 4.4-, 8.8-, and 18.6-year cycles induced from the orbital inclination between the Moon and the Earth (Khojasteh et al., 2021b). However, previous studies also reported inter-annual cycle changes in estuaries during the 20th and 21st centuries due to external forces, such as river discharge changes and sea-level rise (Houston and Dean, 2011; Ezer and Atkinson, 2014; Lee et al., 2017; Thompson et al., 2021). Increases in river discharge and sea-level rise would enlarge water volume in the head of PRE, causing a reduction in bed friction and increases in minor flood, which can lead to high recurrent high-tide flooding in the coastal areas (Pelling et al., 2013a; Ezer and Atkinson, 2014; Thompson et al., 2021). Our study also found similar decreases in tidal inter-annual cycles over the past 70 years. Specifically, AHTLs changed from around a 10-year to around a 6-year cycle at the rivers’ upper and middle reaches, suggesting an increase in the frequency of high tidal level periods. Similarly, higher proportions in ALTL’s longer-term cycles in recent decades suggested decreased frequencies in extremely low tidal events, which may also be explained by the friction reduction due to river discharge changes and sea-level rise (Pelling et al., 2013a).
River discharge from upper reaches has been reported as other main forces influencing estuarine hydrodynamics (Horrevoets et al., 2004; Hoitink and Jay, 2016; Talke et al., 2021). The flow volume is determined by surface runoff and groundwater discharge, which can be amplified or reduced due to natural processes (e.g., precipitation and evapotranspiration) or anthropogenic activities (e.g., damming and urbanization). In the PRE region, surprisingly, as an estuary suffered from intensive human activities, only a slightly decreasing trend in discharge was observed in one branch of the Pearl River (Zhang et al., 2008). However, we still found changes in circular periods as well as decreases in tidal heights in the upper and middle reaches, where the river discharge significantly affected the tidal variables. One possible explanation is the joint effects of river discharge and SLR. Due to the bottom friction, river inflow interacts with tides and distorts tidal hydrodynamics. During high tide periods, the river current and the tidal current are in the opposite direction, leading to an asymmetric effect that causes tidal distortions and increases high tidal frequency, inducing a sharply increased tidal level (Ensing et al., 2015; Thompson et al., 2021). SLR further changes estuarine tidal energy and alters the circular patterns at different locations (Khojasteh et al., 2021b). River flow attenuates tidal ranges due to the increased low tidal levels when the ebb is larger than the increased high tidal levels during a flood (Horrevoets et al., 2004). Therefore, positive correlations were found between inflows and AHTLs, ALTLs, and AMTLs, while negative correlations were observed between inflows and AMTRs at the upper and middle reaches of the rivers. However, the river flow impacts decreased due to the increased SLR and the widening of river channels when approaching the mouth of the estuary (Davies and Woodroffe, 2010; Khojasteh et al., 2020).
The SLR significantly influenced tidal dynamics. The AHTLs, ALTLs, AMTLs, and AMTRs have been reported to increase with SLR, which possible because the increasing volumes of exchange water in and out of the PRE (Khojasteh et al., 2021b; Khojasteh et al., 2022). However, the controls of SLR decreased with the DTC. At the upper reaches, increasing energy losses of tides due to the bottom friction may loosen the SLR controls (Khojasteh et al., 2022). Furthermore, interactions of the SLR with other factors pose even complex influences on estuarine tidal dynamics (Ensing et al., 2015; Palmer et al., 2019). Khojasteh et al. (2020) suggested that tidal responses to SLR would perform differently between restricted and unrestricted estuaries. The friction loss and head loss led to the initial attenuation of tides, causing a reduction of tidal range at locations close to the mouth of the estuary (Hanslow et al., 2018; Kumbier et al., 2018). Therefore, the amplification of the tidal range under SLR enlarged with increased longitudinal distance (Ensing et al., 2015). Our study also observed increased SLR controls and enlarged upward trends of AMTRs. In addition to the interactions between geomorphology and SLR, decreased river discharges can offset or even exceed controls of SLR at the upper reaches (Horrevoets et al., 2004). Coastal recession would also interact with SLR, perturbating the natural period of oscillation of the tides and increasingly causing a reduction in tidal range (Pickering et al., 2017).
6. Implications from tidal changes
The latest Intergovernmental Panel on Climate Change (IPCC) Sixth Assessment Reports emphasized that the interactions between SRL and tidal changes can lead to extreme water level changes (Masson-Delmotte et al., 2021). A number of studies have suggested that an allowance should be considered in studying the SLR impacts due to the SLR effect on surge elevations and tidal levels (Greenberg et al., 2012; Pickering et al., 2012; Pelling and Mattias Green, 2013; Pelling et al., 2013a; Pelling et al., 2013b; Schuerch et al., 2018). For example, the Dutch Delta committee applied a 10% allowance for the SLR imposed effect on the storm surge and tides (Vellinga et al., 2009). In this study, the AHTL changes exceed 10% of the SLR at 7 of the 19 stations between 1950 and 2019 (See Table S1). They are WR1_DLS, NR1_HM, ER3_Dashe, PR4_HP, PR2_SSW, PR1_DS, and PR0_CW. The results suggest the extremely high tidal levels in the coastline and the main Pearl River have exceeded the allowance for normal variations and should be considered specially in PRE management.
Our results have demonstrated that levels and amplitudes of tides would be significantly affected by runoff discharge and geomorphology, and the responses get even more complicated due to climate change-induced SLR. The combined effects caused significant differences in tidal dynamics over time and space. We found significant upward trends in AHTLs, ALTLs, and AMTLs at stations close to the coastline (Cluster 2). The elevated tidal levels, especially the AMTLs would be one of the problems causing major concerns since it would lead to more instances of nuisance flooding (Chaumillon et al., 2017; Moftakhari et al., 2017; Burgos et al., 2018). At stations upstream reaches, the extremely high decrease rate in mean values of AHTLs suggests a decreased possibility of being threatened by storm surge. However, we also found decreases in the circular patterns, which led to a reduction in the durations of wet-dry periods and an increase in the frequencies of high and dry seasons. The acceleration in the wet-dry circle but the lower in the highest tides would influence the hydrological regimes in the upper reaches of the PRE, and ultimately impact the environment and ecology of the coast and threaten human health (Mao et al., 2004; Zhang et al., 2010; Liu et al., 2018). Therefore, it is of considerable importance to include tidal level and circular pattern dynamics analysis in coastal hydrodynamic studies to better assess possible risks due to climate change and anthropogenic disturbances. This investigation is expected to benefit efficient coastal habitat protection and contribute to achieving sustainable development goals.
7. Further studies
Our analysis is based on long-term observations and widely used statistical methods. It demonstrated that the spatial and temporal changes occurred, and the change characteristics varied between the mouth and the upper reaches of PRE. This time series analysis of tides is the basis for understanding tidal hydrodynamics of this region in recent decades and would provide valuable information on coastal habitat and ecology protection. Further studies, such as how changes in tides influenced sediment and nutrient transport in PRE, how changes in tides influenced the vegetation composition and fishery in PRE, and how changes in tides increase/decrease the risk of flooding in PRE, can be developed based on this study.
Data availability statement
The tidal dataset was collected from the Hydrological Yearbooks of the People’s Republic of China, which is not a publicly accessible dataset. However, part of the data can be sent individually by request to the corresponding authors. Requests to access these datasets should be directed to XL,bGl4aWFibnVAYm51LmVkdS5jbg==.
Author contributions
XL is the primary author who analyzed the datasets, generated results, and wrote the draft. YC is the author who contributed equally to this work and is mainly responsible for data collection, analysis, and result interpretation. ZL provided critical technique support. XM and LZ contributed to the data collection. CZ helped interpret the results. BC was responsible for the overall design of the work and provided constructive suggestions in the discussion section. ZR contributed to the manuscript review and editing and provided comments for the data analyses. All authors provided comments and suggestions for the manuscript revision. All authors contributed to the article and approved the submitted version.
Funding
This study was funded by the Key Project of National Natural Science Foundation of China (U1901212), the National Natural Science Foundation of China (42206170), the Key Special Project for Introduced Talents Team of Southern Marine Science and Engineering Guangdong Laboratory (Guangzhou) (GML2019ZD0402), the GuangDong Basic and Applied Basic Research Foundation (2021A1515110830), the Shandong key research and development program (2021CXGC011201), and the National key research and development program (2021YFC3101701).
Conflict of interest
The authors declare that the research was conducted in the absence of any commercial or financial relationships that could be construed as a potential conflict of interest.
Publisher’s note
All claims expressed in this article are solely those of the authors and do not necessarily represent those of their affiliated organizations, or those of the publisher, the editors and the reviewers. Any product that may be evaluated in this article, or claim that may be made by its manufacturer, is not guaranteed or endorsed by the publisher.
Supplementary material
The Supplementary Material for this article can be found online at: https://www.frontiersin.org/articles/10.3389/fmars.2023.1065100/full#supplementary-material
References
Bamber J. L., Oppenheimer M., Kopp R. E., Aspinall W. P., Cooke R. M. (2019). Ice sheet contributions to future sea-level rise from structured expert judgment. Proc. Natl. Acad. Sci. U. S. A. 166, 11195–11200. doi: 10.1073/pnas.1817205116
Bouillon S., Middelburg J. J., Dehairs F., Borges A. V., Abril G., Flindt M. R., et al. (2007). Importance of intertidal intertidal sediment processes and porewater exchange on the water column biogeochemistry in a pristine mangrove creek (Ras dege, Tanzania). Biogeosciences 4, 311–322. doi: 10.5194/bg-4-311-2007
Burgos A. G., Hamlington B. D., Thompson P. R., Ray R. D. (2018). Future nuisance flooding in Norfolk, VA, from astronomical tides and annual to decadal internal climate variability. Geophys. Res. Lett. 45, 12,432–12,439. doi: 10.1029/2018GL079572
Chaumillon E., Bertin X., Fortunato A. B., Bajo M., Schneider J. L., Dezileau L., et al. (2017). Storm-induced marine flooding: Lessons from a multidisciplinary approach. Earth-Science Rev. 165, 151–184. doi: 10.1016/j.earscirev.2016.12.005
Chen S., Chen L. F., Liu Q. H., Li X., Tan Q. (2005). Remote sensing and GIS-based integrated analysis of coastal changes and their environmental impacts in lingding bay, pearl river estuary, south China. Ocean Coast. Manage. 48, 65–83. doi: 10.1016/j.ocecoaman.2004.11.004
Cherqui F., Belmeziti A., Granger D., Sourdril A., Le Gauffre P. (2015). Assessing urban potential flooding risk and identifying effective risk-reduction measures. Sci. Total Environ. 514, 418–425. doi: 10.1016/j.scitotenv.2015.02.027
Church J. A., White N. J. (2006). A 20th century acceleration in global sea-level rise. Geophys. Res. Lett. 33, 94–97. doi: 10.1029/2005GL024826
Davies G., Woodroffe C. D. (2010). Tidal estuary width convergence: Theory and form in north Australian estuaries. Earth Surf. Process. Landforms 35, 737–749. doi: 10.1002/esp.1864
Dieckmann R., Osterthun M., Partenscky H. W. (1987). Influence of water-level elevation and tidal range on the sedimentation in a German tidal flat area. Prog. Oceanogr. 18, 151–166. doi: 10.1016/0079-6611(87)90031-0
Díez-Minguito M., Baquerizo A., Ortega-Sánchez M., Ruiz I., Losada M. A. (2012). Tidal wave reflection from the closure dam in the guadalquivir estuary (Sw Spain). Coast. Eng. Proc. 1, 58. doi: 10.9753/icce.v33.currents.58
Dronkers J. (1986). Tidal asymmetry and estuarine morphology. Netherlands J. Sea Res. 20, 117–131. doi: 10.1016/0077-7579(86)90036-0
Ensing E., de Swart H. E., Schuttelaars H. M. (2015). Sensitivity of tidal motion in well-mixed estuaries to cross-sectional shape, deepening, and sea level rise: An analytical study. Ocean Dyn. 65, 933–950. doi: 10.1007/s10236-015-0844-8
Ezer T., Atkinson L. P. (2014). Accelerated flooding along the U.S. East coast: On the impact of sea-level rise, tides, storms, the gulf stream, and the north Atlantic oscillations. Earth’s Futur. 2, 362–382. doi: 10.1002/2014ef000252
Fant C., Jacobs J. M., Chinowsky P., Sweet W., Weiss N., Sias J. E., et al. (2021). Mere nuisance or growing threat? the physical and economic impact of high tide flooding on US road networks. J. Infrastruct. Syst. 27, 04021044. doi: 10.1061/(asce)is.1943-555x.0000652
Fitzgerald D. M. (1996). Geomorphic variability and morphologic and sedimentologic controls on tidal inlets. J. Coast. Res. 23, 47–71.
FitzGerald D. M., Fenster M. S., Argow B. A., Buynevich I. V. (2008). Coastal impacts due to sea-level rise. Annu. Rev. Earth Planet. Sci. 36, 601–647. doi: 10.1146/annurev.earth.35.031306.140139
Flinchem E. P., Jay D. A. (2000). An introduction to wavelet transform tidal analysis methods. Estuar. Coast. Shelf Sci. 51, 177–200. doi: 10.1006/ecss.2000.0586
Gao G. D., Wang X. H., Bao X. W. (2014). Land reclamation and its impact on tidal dynamics in jiaozhou bay, qingdao, China. Estuar. Coast. Shelf Sci. 151, 285–294. doi: 10.1016/j.ecss.2014.07.017
Gauthier T. D. (2001). Detecting trends using spearman’s rank correlation coefficient. Environ. Forensics 2, 359–362. doi: 10.1006/enfo.2001.0061
Godin G. (1999). The propagation of tides up rivers with special considerations on the upper saint Lawrence river. Estuar. Coast. Shelf Sci. 48, 307–324. doi: 10.1006/ecss.1998.0422
Greenberg D. A., Blanchard W., Smith B., Barrow E. (2012). Climate change, mean sea level and high tides in the bay of fundy. Atmos. - Ocean 50, 261–276. doi: 10.1080/07055900.2012.668670
Haigh I. D., Nicholls R., Wells N. (2010). A comparison of the main methods for estimating probabilities of extreme still water levels. Coast. Eng. 57, 838–849. doi: 10.1016/j.coastaleng.2010.04.002
Haigh I. D., Pickering M. D., Green J. A. M., Arbic B. K., Arns A., Dangendorf S., et al. (2020). The tides they are a-changin’: A comprehensive review of past and future nonastronomical changes in tides, their driving mechanisms, and future implications. Rev. Geophys. 58, 1–39. doi: 10.1029/2018RG000636
Hanslow D. J., Morris B. D., Foulsham E., Kinsela M. A. (2018). A regional scale approach to assessing current and potential future exposure to tidal inundation in different types of estuaries. Sci. Rep. 8, 1–13. doi: 10.1038/s41598-018-25410-y
Hinton A. C. (1996). Tides in the northeast Atlantic: Considerations for modelling water depth changes. Quat. Sci. Rev. 15, 873–894. doi: 10.1016/S0277-3791(96)00061-3
Hoitink A. J. F., Jay D. A. (2016). Tidal river dynamics: Implications for deltas. Rev. Geophys. 54, 240–272. doi: 10.1002/2015RG000507
Horrevoets A. C., Savenije H. H. G., Schuurman J. N., Graas S. (2004). The influence of river discharge on tidal damping in alluvial estuaries. J. Hydrol. 294, 213–228. doi: 10.1016/j.jhydrol.2004.02.012
Horton B. P., Khan N. S., Cahill N., Lee J. S. H., Shaw T. A., Garner A. J., et al. (2020). Estimating global mean sea-level rise and its uncertainties by 2100 and 2300 from an expert survey. NPJ Cnlimate Atmos. Sci. 3, 18. doi: 10.1038/s41612-020-0121-5
Houston J. R., Dean R. G. (2011). Sea-Level acceleration based on U.S. tide gauges and extensions of previous global-gauge analyses. J. Coast. Res. 27, 409–417. doi: 10.2112/JCOASTRES-D-10-00157.1
Huess V., Andersen O. B. (2001). Seasonal variation in the main tidal constituent from altimetry. Geophys. Res. Lett. 28, 567–570. doi: 10.1029/2000GL011921
Hu P., Li F., Sun X., Liu Y., Chen X., Hu D. (2021). Assessment of land-use/cover changes and its ecological effect in rapidly urbanized areas-taking pearl river delta urban agglomeration as a case. Sustainability 13, 5075. doi: 10.3390/su13095075
Jian W., Lo E. Y. M., Pan T. C. (2021). Probabilistic storm surge hazard using a steady-state surge model for the pearl river delta region, China. Sci. Total Environ. 801, 149606. doi: 10.1016/j.scitotenv.2021.149606
Khojasteh D., Chen S., Felder S., Heimhuber V., Glamore W. (2021a). Estuarine tidal range dynamics under rising sea levels. PloS One 16, 1–25. doi: 10.1371/journal.pone.0257538
Khojasteh D., Glamore W., Heimhuber V., Felder S. (2021b). Sea Level rise impacts on estuarine dynamics: A review. Sci. Total Environ. 780, 146470. doi: 10.1016/j.scitotenv.2021.146470
Khojasteh D., Hottinger S., Felder S., De Cesare G., Heimhuber V., Hanslow D. J., et al. (2020). Estuarine tidal response to sea level rise: The significance of entrance restriction. Estuar. Coast. Shelf Sci. 244, 106941. doi: 10.1016/j.ecss.2020.106941
Khojasteh D., Lewis M., Tavakoli S., Farzadkhoo M., Felder S., Iglesias G., et al. (2022). Sea Level rise will change estuarine tidal energy: A review. Renew. Sustain. Energy Rev. 156, 111855. doi: 10.1016/j.rser.2021.111855
Kumbier K., Carvalho R. C., Woodroffe C. D. (2018). Modelling hydrodynamic impacts of sea-level rise on wave-dominated Australian estuaries with differing geomorphology. J. Mar. Sci. Eng. 6, 66. doi: 10.3390/jmse6020066
Lee S. B., Li M., Zhang F. (2017). Impact of sea level rise on tidal range in Chesapeake and Delaware bays. J. Geophys. Res. Ocean. 122, 3917–3938. doi: 10.1038/175238c0
Li X., Damen M. C. J. (2010). Coastline change detection with satellite remote sensing for environmental management of the pearl river estuary, China. J. Mar. Syst. 82, S54–S61. doi: 10.1016/j.jmarsys.2010.02.005
Li P., Fang G., Huang G. (1993). Impacts of sea level rising on the economic development of zhujiang delta and countermeasures. Acta Geogr. Sin. 48, 527–534. doi: 10.11821/xb199306006
Liu Z., Fagherazzi S., Cui B. (2021a). Success of coastal wetlands restoration is driven by sediment availability. Commun. Earth Environ. 2, 1–9. doi: 10.1038/s43247-021-00117-7
Liu Z., Fagherazzi S., Li J., Cui B. (2021b). Mismatch between watershed effects and local efforts constrains the success of coastal salt marsh vegetation restoration. J. Clean. Prod. 292, 126103. doi: 10.1016/j.jclepro.2021.126103
Liu Z., Fagherazzi S., Liu X., Shao D., Miao C., Cai Y. (2022). Long-term variations in water discharge and sediment load of the pearl river Estuary : Implications for sustainable development of the greater bay area 9, 983517. doi: 10.3389/fmars.2022.983517
Liu H., Gao C., Wang G. (2018). Understand the resilience and regime shift of the wetland ecosystem after human disturbances. Sci. Total Environ. 643, 1031–1040. doi: 10.1016/J.SCITOTENV.2018.06.276
Liu W., Zhan J., Zhao F., Yan H., Zhang F., Wei X. (2019). Impacts of urbanization-induced land-use changes on ecosystem services: A case study of the pearl river delta metropolitan region, China. Ecol. Indic. 98, 228–238. doi: 10.1016/j.ecolind.2018.10.054
Lopes A. M., Tenreiro Machado J. A. (2017). Tidal analysis using time-frequency signal processing and information clustering. Entropy 19, 29–33. doi: 10.3390/e19080390
Ma C., Ai B., Zhao J., Xu X., Huang W. (2019). Change detection of mangrove forests in coastal guangdong during the past three decades based on remote sensing data. Remote Sens. 11, 921. doi: 10.3390/rs11080921
Mao Q., Shi P., Yin K., Gan J., Qi Y. (2004). Tides and tidal currents in the pearl river estuary. Cont. Shelf Res. 24, 1797–1808. doi: 10.1016/j.csr.2004.06.008
Masson-Delmotte V., Zhai P., Pirani A., Connors S., Péan C., Berger S., et al. (2021)IPCC: Climate change 2021: the physical science basis. Available at: https://www.ipcc.ch/report/ar6/wg1/.
Moftakhari H. R., AghaKouchak A., Sanders B. F., Matthew R. A. (2017). Cumulative hazard: The case of nuisance flooding. Earth’s Futur. 5, 214–223. doi: 10.1002/2016EF000494
Nabangchang O., Allaire M., Leangcharoen P., Jarungrattanapong R., Whittington D. (2015). Economic costs incurred by households in the 2011 GreaterBangkok flood. Water Resour. Res. 51, 58–77. doi: 10.1002/2013WR014979.Reply
Palmer K., Watson C., Fischer A. (2019). Non-linear interactions between sea-level rise, tides, and geomorphic change in the Tamar estuary, Australia. Estuar. Coast. Shelf Sci. 225, 106247. doi: 10.1016/j.ecss.2019.106247
Pelling H. E., Mattias Green J. A. (2013). Sea Level rise and tidal power plants in the gulf of Maine. J. Geophys. Res. Ocean. 118, 2863–2873. doi: 10.1002/jgrc.20221
Pelling H. E., Mattias Green J. A., Ward S. L. (2013a). Modelling tides and sea-level rise: To flood or not to flood. Ocean Model. 63, 21–29. doi: 10.1016/j.ocemod.2012.12.004
Pelling H. E., Uehara K., Green J. A. M. (2013b). The impact of rapid coastline changes and sea level rise on the tides in the bohai Sea, China. J. Geophys. Res. Ocean. 118, 3462–3472. doi: 10.1002/jgrc.20258
Pickering M. D., Horsburgh K. J., Blundell J. R., Hirschi J. J. M., Nicholls R. J., Verlaan M., et al. (2017). The impact of future sea-level rise on the global tides. Cont. Shelf Res. 142, 50–68. doi: 10.1016/j.csr.2017.02.004
Pickering M. D., Wells N. C., Horsburgh K. J., Green J. A. M. (2012). The impact of future sea-level rise on the European shelf tides. Cont. Shelf Res. 35, 1–15. doi: 10.1016/j.csr.2011.11.011
Raw J. L., Godbold J. A., van Niekerk L., Adams J. B. (2019). Drivers of mangrove distribution at the high-energy, wave-dominated, southern African range limit. Estuar. Coast. Shelf Sci. 226, 106296. doi: 10.1016/j.ecss.2019.106296
Schuerch M., Spencer T., Temmerman S., Kirwan M. L., Wolff C., Lincke D., et al. (2018). Future response of global coastal wetlands to sea-level rise. Nature 561, 231–234. doi: 10.1038/s41586-018-0476-5
Shao X., Fang Y., Cui B. (2020). A model to evaluate spatiotemporal variations of hydrological connectivity on a basin-scale complex river network with intensive human activity. Sci. Total Environ. 723, 138051. doi: 10.1016/j.scitotenv.2020.138051
SOA (State Oceanic Administration People’s Republic of China). (2020). Bulletin of Chinese sea level rise 2020. Available at: http://gi.mnr.gov.cn/202104/t20210426_2630186.html.
Sulaiman Z. A., Viparelli E., Torres R., Yankovsky A., Grego J. (2021). The influence of tides on coastal plain channel geomorphology: Altamaha river, Georgia, USA. J. Geophys. Res. Earth Surf. 126, 1–17. doi: 10.1029/2020JF005839
Talke S. A., Familkhalili R., Jay D. A. (2021). The influence of channel deepening on tides, river discharge effects, and storm surge. J. Geophys. Res. Ocean. 126, 1–24. doi: 10.1029/2020JC016328
Talke S. A., Jay D. A. (2020). Changing tides: The role of natural and anthropogenic factors. Ann. Rev. Mar. Sci. 12, 121–151. doi: 10.1146/annurev-marine-010419-010727
Thompson P. R., Widlansky M. J., Hamlington B. D., Merrifield M. A., Marra J. J., Mitchum G. T., et al. (2021). Rapid increases and extreme months in projections of united states high-tide flooding. Nat. Clim. Change 11, 584–590. doi: 10.1038/s41558-021-01077-8
Vandenbohede A., Lebbe L. (2006). Occurrence of salt water above fresh water in dynamic equilibrium in a coastal groundwater flow system near de panne, Belgium. Hydrogeol. J. 14, 462–472. doi: 10.1007/s10040-005-0446-5
Van Rijn L. C. (2011). Analytical and numerical analysis of tides and salinities in estuaries; part I: Tidal wave propagation in convergent estuaries. Ocean Dyn. 61, 1719–1741. doi: 10.1007/s10236-011-0453-0
Vellinga P., Katsman C., Sterl A., Beersma J. J., Hazeleger W., Church J., et al. (2009). Exploring high-end climate change scenarios for flood protection of the Netherlands. KNMI Sci. Rep. WR-2009-05 KNMI/Alterra Netherlands.
Wang F., Hao R. J. (2020). Environmental pollution in pearl river delta, China: Status and potential effects. J. Environ. Inf. Lett. 3, 110–123. doi: 10.3808/jeil.202000033
Wang F., Sanders C. J., Santos I. R., Tang J., Schuerch M., Kirwan M. L., et al. (2021). Global blue carbon accumulation in tidal wetlands increases with climate change. Natl. Sci. Rev. 8, nwaa296. doi: 10.1093/nsr/nwaa296
Wolanski E., Moore K., Spagnol S., D’Adamo N., Pattiaratchi C. (2001). Rapid, human-induced siltation of the macro-tidal ord river estuary, Western Australia. Estuar. Coast. Shelf Sci. 53, 717–732. doi: 10.1006/ecss.2001.0799
Xie C., Cui B., Xie T., Yu S., Liu Z., Chen C., et al. (2020). Hydrological connectivity dynamics of tidal flat systems impacted by severe reclamation in the yellow river delta. Sci. Total Environ. 739, 139860. doi: 10.1016/j.scitotenv.2020.139860
Yin K., Xu S., Huang W., Xie Y. (2017). Effects of sea level rise and typhoon intensity on storm surge and waves in pearl river estuary. Ocean Eng. 136, 80–93. doi: 10.1016/j.oceaneng.2017.03.016
Yu H., Yu H., Wang L., Kuang L., Wang H., Ding Y., et al. (2017). Tidal propagation and dissipation in the Taiwan strait. Cont. Shelf Res. 136, 57–73. doi: 10.1016/j.csr.2016.12.006
Zhang W., Cao Y., Zhu Y., Wu Y., Ji X., He Y., et al. (2017). Flood frequency analysis for alterations of extreme maximum water levels in the pearl river delta. Ocean Eng. 129, 117–132. doi: 10.1016/j.oceaneng.2016.11.013
Zhang S., Lu X. X., Higgitt D. L., Chen C. T. A., Han J., Sun H. (2008). Recent changes of water discharge and sediment load in the zhujiang (Pearl river) basin, China. Glob. Planet. Change 60, 365–380. doi: 10.1016/j.gloplacha.2007.04.003
Keywords: tidal dynamics, climate change, estuarine hydrology, temporal trends, spatial variability
Citation: Li X, Cai Y, Liu Z, Mo X, Zhang L, Zhang C, Cui B and Ren Z (2023) Impacts of river discharge, coastal geomorphology, and regional sea level rise on tidal dynamics in Pearl River Estuary. Front. Mar. Sci. 10:1065100. doi: 10.3389/fmars.2023.1065100
Received: 09 October 2022; Accepted: 09 January 2023;
Published: 24 January 2023.
Edited by:
Weijie Wang, China Institute of Water Resources and Hydropower Research, ChinaReviewed by:
Lili Wang, Agro-Environmental Protection Institute (CAAS), ChinaLaibin Huang, University of California, Davis, United States
Bowen Zhang, Ball State University, United States
Copyright © 2023 Li, Cai, Liu, Mo, Zhang, Zhang, Cui and Ren. This is an open-access article distributed under the terms of the Creative Commons Attribution License (CC BY). The use, distribution or reproduction in other forums is permitted, provided the original author(s) and the copyright owner(s) are credited and that the original publication in this journal is cited, in accordance with accepted academic practice. No use, distribution or reproduction is permitted which does not comply with these terms.
*Correspondence: Baoshan Cui, Y3VpYnNAYm51LmVkdS5jbg==; Ze Ren, cmVuemVkeWtAZ21haWwuY29t
†These authors have contributed equally to this work