 Igor Fernández-Urruzola1*
 Antonio Bode2
 Natalie Loick-Wilde3
 Wolfgang Schneider1,4
 Dhugal Lindsay5
 Ruben Escribano1,4
- 1Millennium Institute of Oceanography (IMO), University of Concepción, Concepción, Chile
- 2Oceanographic Center of A Coruña, Spanish Institute of Oceanography (IEO-CSIC), A Coruña, Spain
- 3Department of Biological Oceanography, Leibniz Institute for Baltic Sea Research (LG), Rostock, Germany
- 4Department of Oceanography, Faculty of Natural and Oceanographic Sciences, University of Concepción, Concepción, Chile
- 5Institute for Extra-Cutting-Edge Science and Technology Avant-Garde Research, Japan Agency for Marine-Earth Science and Technology (JAMSTEC), Yokosuka, Japan
The environmental regulation of planktonic food web structure is a key determinant for the efficiency of energy transfer through trophic levels, with direct implications for the amount of energy that is available to top-consumers and deep-sea communities. Yet, the complex trophic interplay between the different components of plankton communities under contrasting environmental conditions remains unresolved. Here, we present a comprehensive field study based on compound-specific isotope analysis of amino acids that aims to explore depth-resolved changes in the trophic strategies of various size-classes of mesozooplankton from distinct habitats across the Southeast Pacific. According to the δ15N values of the so-called source amino acids such as phenylalanine, we first identified a clear shift in nitrogen sources for biological production, from nitrate in the productive upwelling waters of the Humboldt Current System to increased inputs of diazotroph-N within the ultra-oligotrophic South Pacific gyre. These shifts in the productivity and in the source of N at the base of the food web were not accompanied by significant changes in the trophic position (TP) of mesozooplankton, which were mainly omnivores (TP = 2.8 ± 0.3, n = 65) in all ecoregions. However, although the planktonic food web length remained relatively unaltered along the productivity gradient, the microbial contribution to mid-trophic level consumers appeared to be more important at relatively high productivities, likely due to more intense remineralization processes in a late successional stage of the upwelling throughout the coastal-transition zone. Altogether, this research work will contribute to a better understanding of the food web functioning in one of the least explored marine regions of the world’s oceans.
1. Introduction
The Southeast Pacific basin holds one of the steepest environmental and productivity gradients in the world’s oceans. In its eastern part, the upwelling of deep cold waters within the Humboldt Current System (HCS) sustains one of the most productive coastal ecosystems, which is further characterized by the presence of an important oxygen minimum zone (e.g. Strub et al., 1998). In its western part, by contrast, the blue temperate waters of the oligotrophic gyre are considered the largest oceanic desert globally, a marine region that has suffered chronic undersampling (Appeltans et al., 2016). Although some efforts have recently been made to explore the longitudinal patterns of zooplankton biodiversity (González et al., 2020; Medellín-Mora et al., 2021), metabolism (Frederick et al., 2018) and trophic ecology (González et al., 2018; Espinosa-Leal et al., 2020) across the Southeast Pacific, these either lacked enough resolution to cover the whole oceanographic gradient or were focused on the upper water column. Our current understanding of the environmental controls on planktonic food web structure in the Southeast Pacific is therefore incomplete, as is also the question of the extent to which the biological communities inhabiting the oligotrophic ocean rely on organic material synthesized in the more eutrophic waters of the Peru-Chile coastal current.
Zooplankton play a key ecological role in all marine ecosystems, as they represent the main trophic link between primary production and apex predators. The higher the zooplankton trophic position, the less energy will be available to organisms higher up the food chain. The position the zooplankton occupy in the food web is thus crucial for the efficiency of the energy transfer through the pelagic community and ultimately, for the functioning of the entire ecosystem. Discordant lines of evidence suggest that herbivores dominate the zooplankton assemblage in the upwelling waters of the HCS (Massing et al., 2022), promoting one of the world’s largest fisheries, or that the primary production is mostly channeled through the microbial food web (Vargas et al., 2007). Either way, there is consensus that the trophic interactions associated with upwelling environments are more complex and dynamic than in the oligotrophic ocean, where zooplankton carnivory consistently prevails (e.g. Hunt et al., 2015; Loick-Wilde et al., 2019; Espinosa-Leal et al., 2020). Furthermore, whether zooplankton trophic ecology in the deep ocean mirrors that in the sunlit surface layer along the productivity gradient is yet to be resolved. Although surface productivity has been correlated with deep-sea ecosystem processes in the region (Fernández-Urruzola et al., 2021; Glud et al., 2021), an apparent imbalance in the carbon budget throughout the twilight zone suggests the presence of compensatory mechanisms that may shape the food web structure in the deep sea (Fernández-Urruzola et al., 2021). Alternative feeding strategies fueling midwater food webs might include, among others, microbial gardening, i.e. the stimulation of nutritious microbial biomass production by fragmenting particles (Mayor et al., 2014), and vertical migrations in search of prey (Hannides et al., 2020), which together would lead to a lengthening of the food chain at depth.
Here, we used compound-specific isotope analyses of amino acids (CSIA-AA) of size-fractionated zooplankton to investigate trophic shifts across distinct biogeochemical regions in the Southeast Pacific, from surface waters to the bathypelagic realm, and to identify the environmental factors that drive possible changes in the structure of the planktonic food web. Applying the CSIA-AA technique, we obtained a more accurate picture of the trophic relationships relative to classic bulk measurements, as it provides the ability to disentangle the influences of baseline δ15N signatures and trophic fractionation on consumer isotope nitrogen values (McMahon and McCarthy, 2016; Ishikawa, 2018). Accordingly, both the nitrogen source and the trophic position can be estimated in a single sample, the latter as an offset between the heavily fractionating trophic amino acids such as glutamic acid and the so-called source amino acids (e.g. phenylalanine), which remain relatively unchanged during trophic transfer (Chikaraishi et al., 2009). The internal normalization of this approach thus prevents the need of baseline samples, minimizing the potential bias caused by temporal decoupling between consumers and their diet. Moreover, we further explored spatial differences in the contribution of protistan microzooplankton and detrital material to zooplankton diet by using a set of proxies derived from CSIA-AA (McCarthy et al., 2007; Décima and Landry, 2020). Our results show an increased role of protist consumers in the trophic transfer within the coastal-transition upwelling zone off northern Chile. Overall, these findings challenge to some extent the classical view of marine food webs, according to which shorter food chain lengths would consistently be expected in the most productive ecosystems. Factors other than only the resource availability may thus regulate the food web structure in the upwelling environment from the Southeast Pacific.
2. Methods
2.1. Study site and sampling
Samples were collected on a longitudinal transect across the Southeast Pacific during the East/central Pacific International Campaign (EPIC) MR 18-06-03 cruise on board the RV Mirai (Japan Agency for Marine-Earth Science and Technology), between 29th January and 18th February 2019. The 8 sampling stations were located across the 4 oceanographic regions defined by González et al. (2018) according to the productivity regime (see Figure 1): (i) a highly productive upwelling zone (UPZ), with NPP values > 750 mg C m-2 d-1, (ii) a coastal transition zone (CTZ), with NPP values between 400 - 750 mg C m-2 d-1, (iii) an oligotrophic zone (OligoZ), with NPP values between 100-400 mg Cm-2 d-1 and (iv) an ultra-oligotrophic zone (U-OligoZ), with NPP values < 100 mg C m-2 d-1.
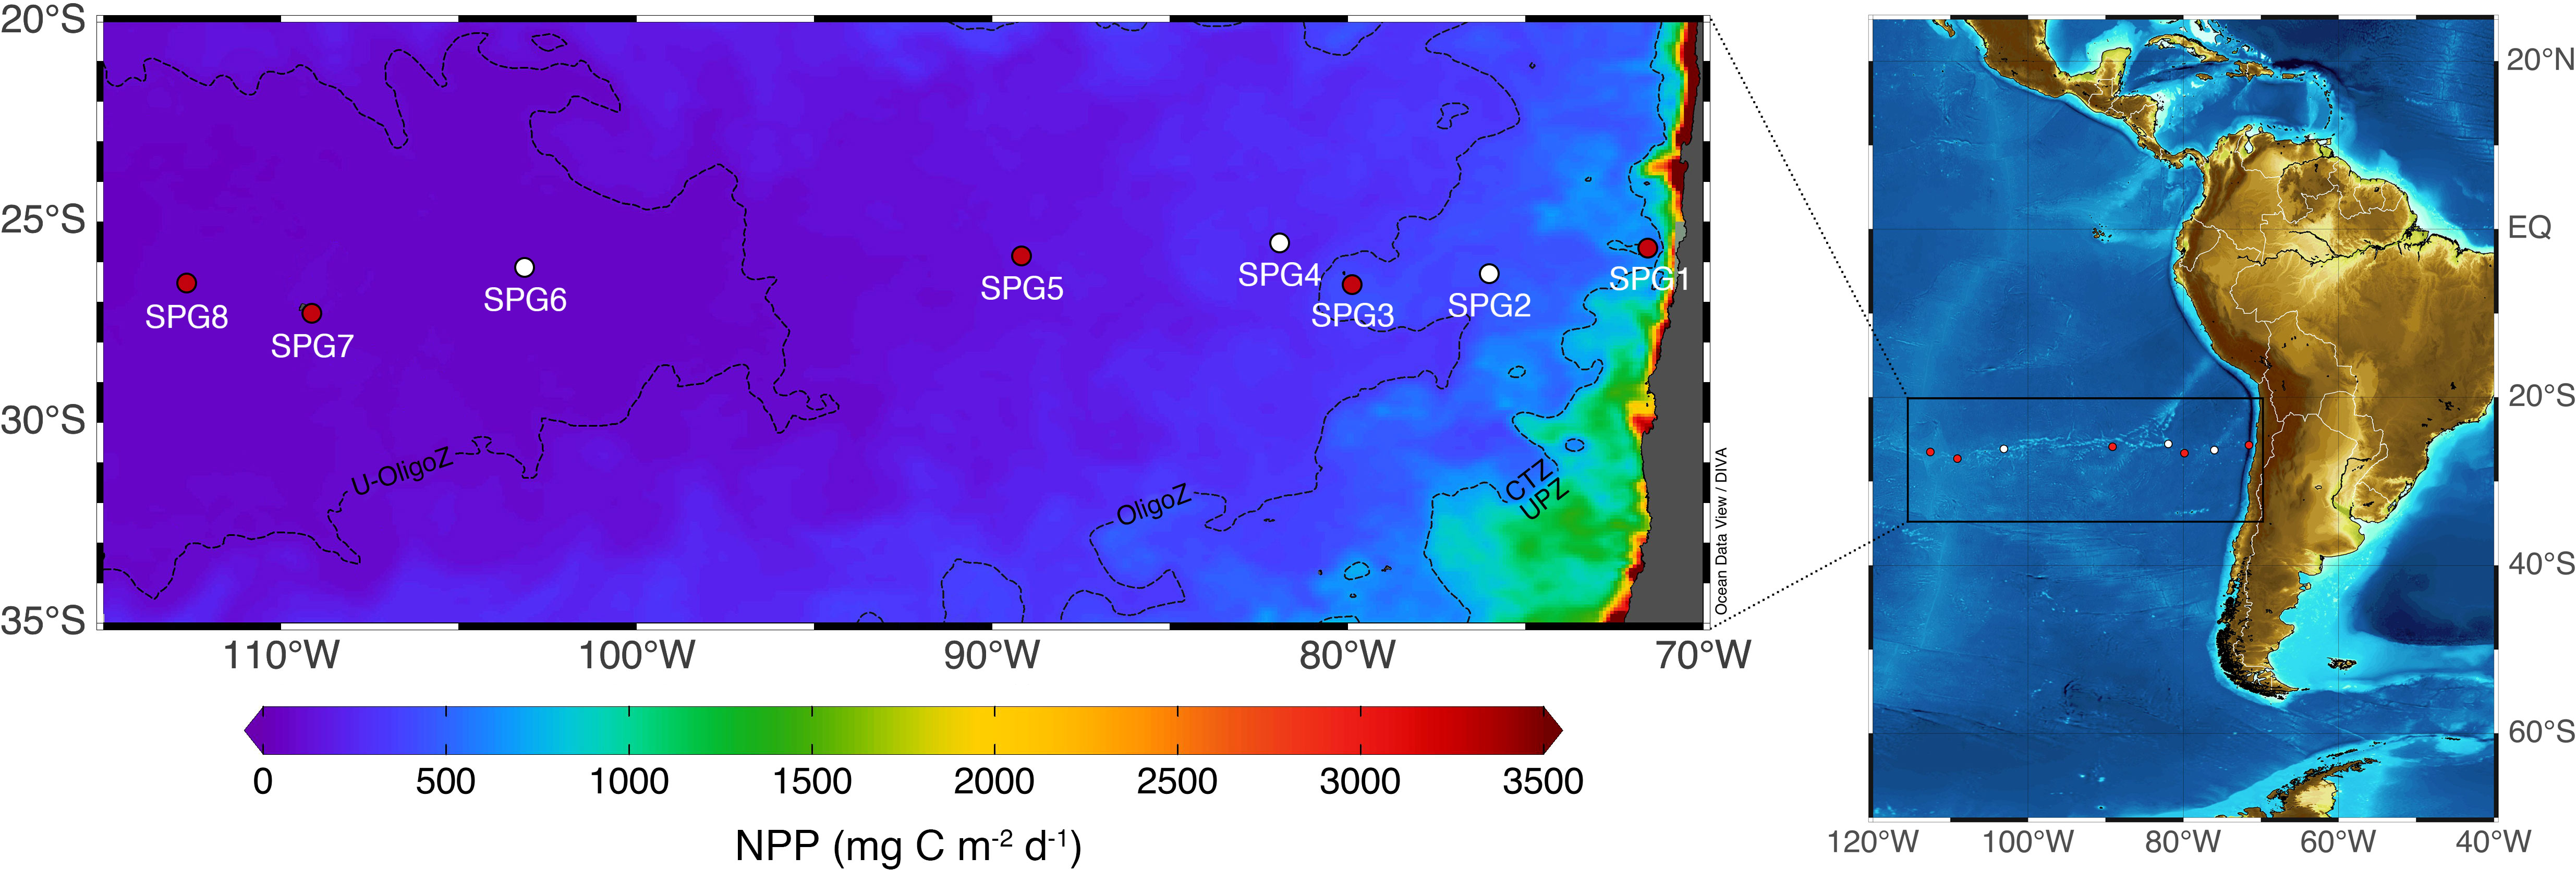
Figure 1 Transect surveyed across the Southeast Pacific Ocean during the EPIC cruise (February 2019). Circles stand for those stations where size-fractionated plankton samples were collected for stable isotope analyses in the bulk material (all stations) and in the amino acids (red circles). Monthly averaged net primary production (NPP, left panel) was derived from remote sensing data available at the Ocean Productivity site (http://www.science.oregonstate.edu/ocean.productivity) and following the vertical generalized production model (VGPM) developed by Behrenfeld and Falkowski (1997). The 4 oceanographic regions described in González et al. (2018) are delimited by black dashed lines.
Hydrographic data and seawater samples for nutrient, chlorophyll-a (Chl-a) and particulate organic matter (POM) determinations were obtained at all 8 stations by deployment of a Seabird SBE-911 plus CTD equipped with an oxygen sensor and mounted on a rosette sampler with 36 10 L-Niskin bottles. Dissolved inorganic nitrogen (nitrate, nitrite and the total ammonia –including ammonium–) concentrations at 9 depths from 200 m to the surface were measured directly on board following the protocols of Hansen and Koroleff (1999) and Kimura (2000), while the Chl-a samples were analyzed fluorometrically according to Welschmeyer (1994). Seawater volumes up to 5 L were sieved through a 50 µm mesh and subsequently filtered onto pre-combusted (450°C, 24 h) Whatman GF/F filters (47 mm ø, nominal pore size 0.7 µm) for elemental and stable isotope analyses of the bulk material. Additional water samples (10-45 L depending on the in situ conditions) were gently filtered using pressurized canisters onto Nuclepore filters (0.8 µm pore size) for CSIA-AA. All filters with the particulate material were transferred into criovials and immediately snap-frozen in liquid nitrogen, where they were maintained at -196°C until lyophilization in the land-based laboratory.
Zooplankton was gathered during daytime at 8 depth strata from 1600 m to surface (1600 - 1200 m, 1200 - 800 m, 800 - 600 m, 600 - 400 m, 400 - 200 m, 200 - 100 m, 100 - 50 m, 50 - 0 m) by oblique tows of an Intelligent Operative Net Environmental Sampling System (IONESS) net with a 1.8 m2 mouth opening and 333 µm mesh aperture netting (Kitamura et al., 2001), making a total of 64 samples before size fractionation. The net system was equipped with conductivity, pressure, oxygen and temperature sensors, as well as with a flowmeter mounted in the net frame to quantify the volume of seawater filtered at each haul. Once on deck, zooplankton samples were gently subsampled with a Motoda splitter for taxonomic, biomass and stable isotope analyses. Subsamples for taxonomy were stored in 4% buffered formalin-seawater, while all other samples were stored in liquid nitrogen (-196°C) until analyses. Prior to preservation, the subsamples for dry mass, bulk stable isotopes and CSIA-AA were fractionated for the 333-500 µm, 500-1000 µm, 1000-2000 µm, 2000-5000 µm size classes. The smallest size class was not considered for CSIA-AA analyses due to the low biomass concentration in most samples. Although the gap between the largest seston size (50 µm) and the smallest zooplankton considered here (500 µm) may hide important information, it usually contains a hardly quantifiable mixture of phytoplankton aggregates and zooplankton which potentially obscures the trophic comparison between marine ecosystems.
Hydrographic and biological data for the epipelagic (0 m - euphotic zone depth), mesopelagic (200-800 m) and bathypelagic (800-1600 m) layers were eventually presented as depth-weighed averages for comparison between oceanographic regions. Calculations followed the trapezoidal rule, multiplying the sample concentration by the depth interval and dividing the sum of these values by the total profile depth. A slightly modified version was applied for some ecological parameters such as δ15N and C:N, as shown in Eq. 1:
where [S]i is the sample concentration in the seawater, Δzi is the depth interval represented by sample i and P is the parameter under consideration (e.g., δ15N, C:N, etc.).
2.2. Community structure
The samples preserved in 10% formalin-seawater were analyzed for a broad characterization of the taxonomic composition of the mesozooplankton community. All different zooplankton groups were assessed through the RAPID approach (Benfield et al., 2007), which uses the Hydroptic Zooscan to digitize images and subsequently analyze them in an automated process managed by the ZooProcess v1.5 software. The method applied a machine-learning technique based on a training set specifically built to identify the major groups in the region. Each specimen was classified into one of the 23 taxonomic and/or functional categories using the Random Forest algorithm. The automatic classification of the images was validated, and the error of the training set was calculated to be 19% based on 4913 images analyzed. Technical details are fully described in Gorsky et al. (2010).
2.3. Biomass, elemental composition and stable isotope analyses
Dry mass, total carbon and nitrogen content, as well as their respective bulk stable isotope ratios, in the POM and mesozooplankton were measured at the aforementioned depths for all 8 stations. Frozen samples were freeze-dried (Alpha 1-2 LDplus, Christ, Germany) for 48 h, and subsequently weighed to determine dry weight biomass. Filters were placed overnight in a dessicator saturated with HCl fumes to remove the inorganic carbonate; they were then moved into a new dessicator, eventually packed into tin capsules and fed via flash combustion (1020°C) into a Thermo Scientific Flash 2000 CHN elemental analyzer (EA) coupled to a Thermo DeltaV Advantage isotope ratio mass spectrometer (IRMS). Size-fractionated zooplankton samples were first ground to a fine powder using a mortar and pestle, and subsamples of mixed material were subsequently weighed (~1 mg) into tin capsules. The C and N elemental composition together with the natural abundance of their isotopes in the biological material were analyzed using a Finnigan Delta Plus IRMS in continuous flow mode connected to a Carlo Erda CHNSO 1108 EA. Analytical error in the organic C and N determinations was lower than 14 and 2 µg, respectively. The precision of the stable isotope analyses, as determined by triplicate samples and standards, was 0.05‰ for δ13C and 0.10‰ for δ15N.
2.4. Sample derivatization for CSIA-AA
We selected 5 stations according to the oceanographic region (SPG1 and SPG3 in the UP-CTZ; SPG5 in the OligoZ; SPG7 and SPG8 in the U-OligoZ) and 5 depth strata (0 - 100 m, 100 - 200 m, 200 - 400 m, 400 - 800 m, 800 - 1600 m) for CSIA-AA. A total of 29 samples of seston retained in the nuclepore filters and 65 subsamples from the size-fractionated zooplankton mixed material were derivatized before analysis. The derivatization step increases the chemical reactivity of individual amino acids in the sample, thus improving their chromatographic behavior. The procedure has been fully detailed and discussed elsewhere (e.g. Hofmann et al., 2003). In short, ~2-10 mg of dry particulate material was hydrolyzed using 6 M hydrochloric acid to cleave peptide bonds. After 24 h in the oven (110 °C), residues were removed from the hydrolysate by filtration through cellulose acetate membranes (0.2 µm pore size) and a known amount of norleucine was added to the solution as an internal standard. The HCl was evaporated under a stream of N2 and the dried hydrolyzed samples, esterified with 2.5 mL of 5:1 isopropanol:acetyl chloride. After 60 min at 110°C, samples were dried again and immediately acylated with 1 mL of 3:1 dichloromethane (DCM):trifluoroacetic anhydride (TFA). The solution was heated at 110°C for 15 min and then, evaporated before sample purification with 1:2 chloroform:phosphate buffer. Both phases were separated by centrifugation (13×103 rpm, 10 min); the contaminants retained in the P-buffer were removed and the chloroform phase containing the acylated samples, dried under a stream of N2. Finally, 0.25 mL of DCM was added to the TFAA-derivatives, which were stored at –20°C until CSIA-AA analyses.
2.5. CSIA-AA analyses of TFA-derivatives
Compound-specific δ15N values were analyzed for 13 individual amino acids: alanine (Ala), aspartic acid (Asx), glycine (Gly), glutamic acid (Glx), isoleucine (Ile), leucine (Leu), lysine (Lys), methionine (Met), phenylalanine (Phe), proline (Pro), serine (Ser), threonine (Thr) and valine (Val). Here, Asx and Glx also include the amide forms asparagine and glutamine, respectively. δ15NAA were analyzed using a continuous flow system consisting of a Thermo DeltaV Advantage IRMS interfaced to a Thermo Trace1310 gas chromatograph via Conflo IV (Thermo-Finnigan/Germany).
2.6. Ecological parameters determined from CSIA-AA
The percentage incorporation of diazotroph N (% ND) into the planktonic food web was estimated within the epipelagic layer from the baseline δ15NPhe signatures both in POM and size-fractionated zooplankton samples (baseline δ15NSample-Phe), following the simple mixing model given in Montoya et al. (2002):
where δ15N s assumed to be -3.6‰, a rather conservative value measured in Trichodesmium sp. cultures grown in N-free medium (McClelland et al., 2003), and δ15, the isotopic signature of (9.3 ± 2.7‰) measured in the region off central-northern Chile for the range of concentrations found in our study (Pantoja, 2006). The baseline δ15NPhe values in the samples were calculated after Xing et al. (2020) to compare resource utilization by different trophic levels, as it considers the effect of trophic discrimination in phenylalanine (0.4‰ for each trophic level according to Chikaraishi et al., 2009):
with TP representing the trophic position of each individual sample. The TPs were estimated from CSIA results by using the general equation from Chikaraishi et al., 2009):
where Tr stands for the so-called trophic amino acids Glu or Ala, β represents the difference between Tr and Phe at the base of the food web (3.4‰ and 3.2‰ for Glu and Ala, respectively), and TEF is the 15N enrichment of Tr in each trophic step. According to Chikaraishi et al. (2009), the trophic enrichment factor was assumed to be 7.6‰ for Glu and 5.7‰ for Ala. While the TPGlu accounts only for metazoa steps, the TPAla considers both the protozoa and metazoa steps (Décima and Landry 2020); the relative contribution to the microbial loop to the zooplankton food web can be then calculated from the difference between TPAla and TPGlu (ΔTP) as follows:
We additionally assessed the trophic enrichment in the bulk material (δ15NBulk-Phe) following Mompeán et al. (2016) and the heterotrophic resynthesis of AA (ΣV) in all zooplankton size-classes, the latter as a proxy for microbial reworking of proteinaceous material ingested by zooplankton (McCarthy et al., 2007). The ΣV parameter was calculated as the average deviation in the δ15N values of 7 trophic-AAs (Ala, Asx, Glx, Ile, Leu, Pro and Val):
where n is the number of trophic-AAs used for the calculation and χi is the deviation of the δ15N value of each individual trophic-AA from the averaged δ15N value of n trophic-AAs. All trophic proxies used in this study together with their most relevant information are summarized in Table S1.
2.7. Statistical analyses
An analysis of variance (ANOVA) was applied to study the significance of the differences in the zooplankton δ15N, baseline δ15NPhe, the trophic position (TP), the contribution of protists to the metazoan food web (ΔTPs) and the heterotrophic re-synthesis parameter (ΣV) between stations, depths and size classes. Prior to analysis, the normality and homoscedasticity of the data were confirmed through the Shapiro-Wilk and Levene’s tests, respectively, using SPSS v25.0 (IMB Corp, 2017). Given that 10% and 7% of the total values used to calculate ecological indices for mesozooplankton and seston, respectively, were below the detection limit of the instrument, we first performed a multiple imputation to replace the missing data by taking covariates into account. The three-step procedure was done using the “mice” and “mitml” packages in Rstudio v2021.09.1 (van Buuren and Groothuis-Oudshoorn, 2011; RStudio Team, 2021). The datasets were first copied a hundred times and the missing values, replaced with slightly different imputed values subjected to a random variation. Each imputed dataset was analyzed independently and the results were then pooled into the final study result following Rubin’s rule (Rubin, 1987). The degrees of freedom for observations were corrected according to Barnard and Rubin (1999). Post-hoc pairwise multiple comparisons between groups were subsequently evaluated through the Tukey’s HSD test.
We further performed a redundancy analysis (RDA) to model the effect of environmental variables (i.e., temperature, dissolved oxygen and inorganic nitrogen concentrations, euphotic zone and mixed layer depths, chlorophyll-a concentration) on the ecological indices (DM, C:N, δ15N, baseline δ15NPhe, TP, ΔTPs) of the plankton community across stations and to observe trends and clusters. We first checked for correlations between variables to avoid collinearities. The environmental variables were then standardized and centered to limit the skew of the explanatory matrix. The response variables were likewise pretreated through the log (x+1) transformation to reduce the dimensional variation. The aforementioned issue with missing values was circumvented by applying the “missMDA” package (Josse and Husson, 2016), and the RDA analysis was computed using the “vegan” package in Rstudio v2021.09.1 (RStudio Team, 2021; Oksanen et al., 2022)
3. Results
3.1. Hydrography
There was a strong productivity gradient along the surveyed transect, with net primary production (NPP) decreasing by an order of magnitude from 765.4 mg C m-2 d-1 at SPG1 to 72.3 mg C m-2 d-1 at SPG8 (Figure 1). The shift in the primary productivity was accompanied by a change in the oceanographic conditions, particularly within the euphotic zone, with warmer temperatures, higher salinities and more oxygenated waters in the core of the South Pacific gyre (Figure 2). It is also worth noting the presence of nearly anoxic waters (< 0.5 mL O2 L-1) within the ~50-400 m depth layer, which extended from the coast almost to 85°W. Oligotrophic conditions were associated with deeper euphotic zone depths and lower Chl-a, particulate organic nitrogen (PON) and nutrient concentrations (Table 1 and Supplementary Figure S1); however, no clear trend was found between the seawater productivity and the depth of the mixed layer. All these oceanographic features aligned well with the four regions previously delineated by González et al. (2018) for the Southeast Pacific (shown in Figure 1).
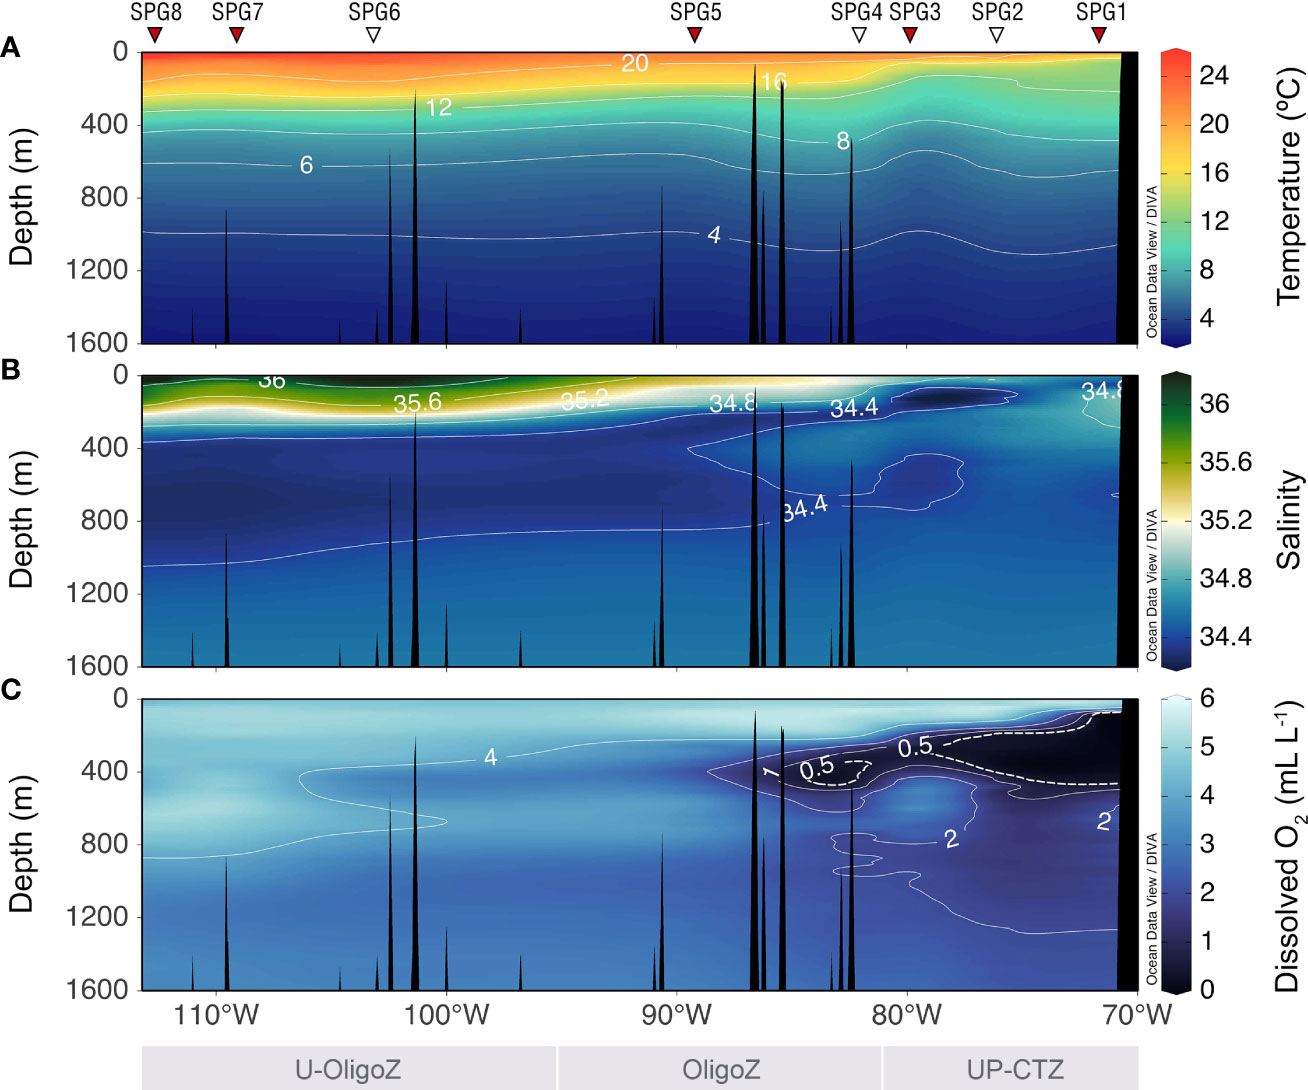
Figure 2 Vertical distribution of (A) potential temperature, (B) salinity and (C) dissolved oxygen concentration along the transect surveyed during the EPIC cruise. Dashed line in panel C indicates the oxygen minimum zone typical in the coastal region. Triangles in the top represent the sampling sites, including oceanographic stations (white) and stations for CSIA-AA analyses (red). The upwelling-coastal transition (UP-CTZ), oligotrophic (OligoZ) and ultra-oligotrophic (U-OligoZ) zones are delimited at the bottom.
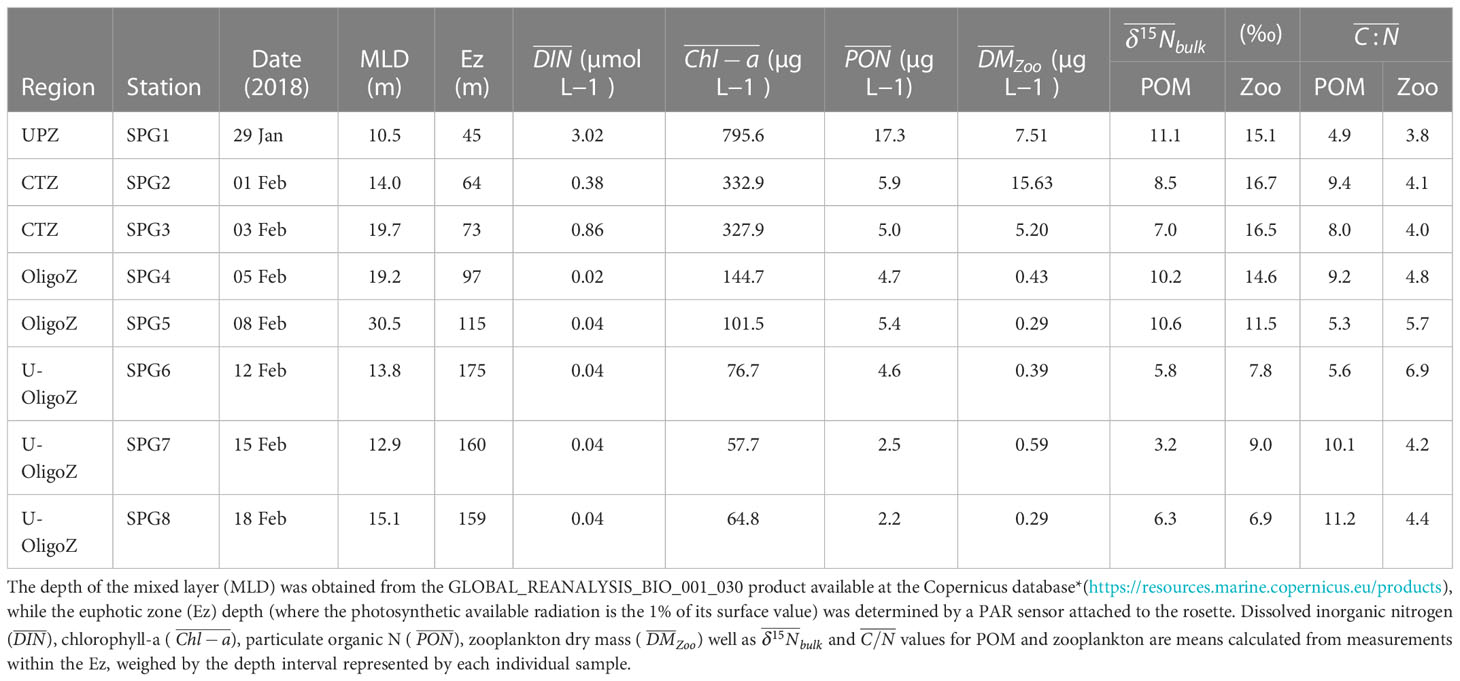
Table 1 Environmental characteristics of those stations sampled during the EPIC cruise.
3.2. Zooplankton biomass and community structure
The zooplankton biomass followed a similar spatial pattern as NPP. Zooplankton dry mass (DM) integrated throughout the water column peaked at the more coastal station SPG1 (Figure 3A) and decreased towards the oligotrophic gyre. Accordingly, the zooplankton biomass dropped by more than an order of magnitude across the euphotic zones, from 7.51 mg DM m-3 at SPG1 to 0.29 mg DM m-3 at SPG8. Even in the mesopelagic layer of SPG1, the zooplankton dry mass (2.64 mg m-3) was significantly higher than in the sunlit oligotrophic waters. There was also a clear shift in the size structure of the zooplankton community, both in the vertical and horizontal directions. This was particularly evident through the upwelling and coastal transition zones (UP-CTZ), with the smaller size class (500-1000 m) dominating the euphotic layer at SPG1 while contributing less to total zooplankton biomass at SPG3. Conversely, the latter station was dominated by the larger zooplankton (2000-5000 m), which indeed showed maximum values of dry mass in the study (11.53 mg m-3 between 50-100 m). Similar trends were found with water depth; the smaller organisms appeared almost exclusively within the upper water column, while the mesopelagic and bathypelagic layers were mainly dominated by organisms > 1000 µm. Regardless of these spatial changes in the size structure, the contribution of the main zooplankton groups to the community composition remained relatively unaltered (Figure 3B). Calanoid and cyclopoid copepods represented the most abundant zooplankton at all stations and in all depth layers. Other groups, such as chaetognaths, euphausids and ostracods, appeared consistently along the transect as well, being particularly abundant within the 1000 - 2000 m and the 2000 - 5000 m size classes (Supplementary Figures S2–S4). It was also noteworthy the relatively high abundances of eggs at mesopelagic waters near the coast and the importance of salps at great depths, these latter organisms dominating the largest size class in the mesopelagic and bathypelagic layers at SPG5 (Supplementary Figure S4). Overall, the zooplankton diversity was lower in the bathypelagic realm.
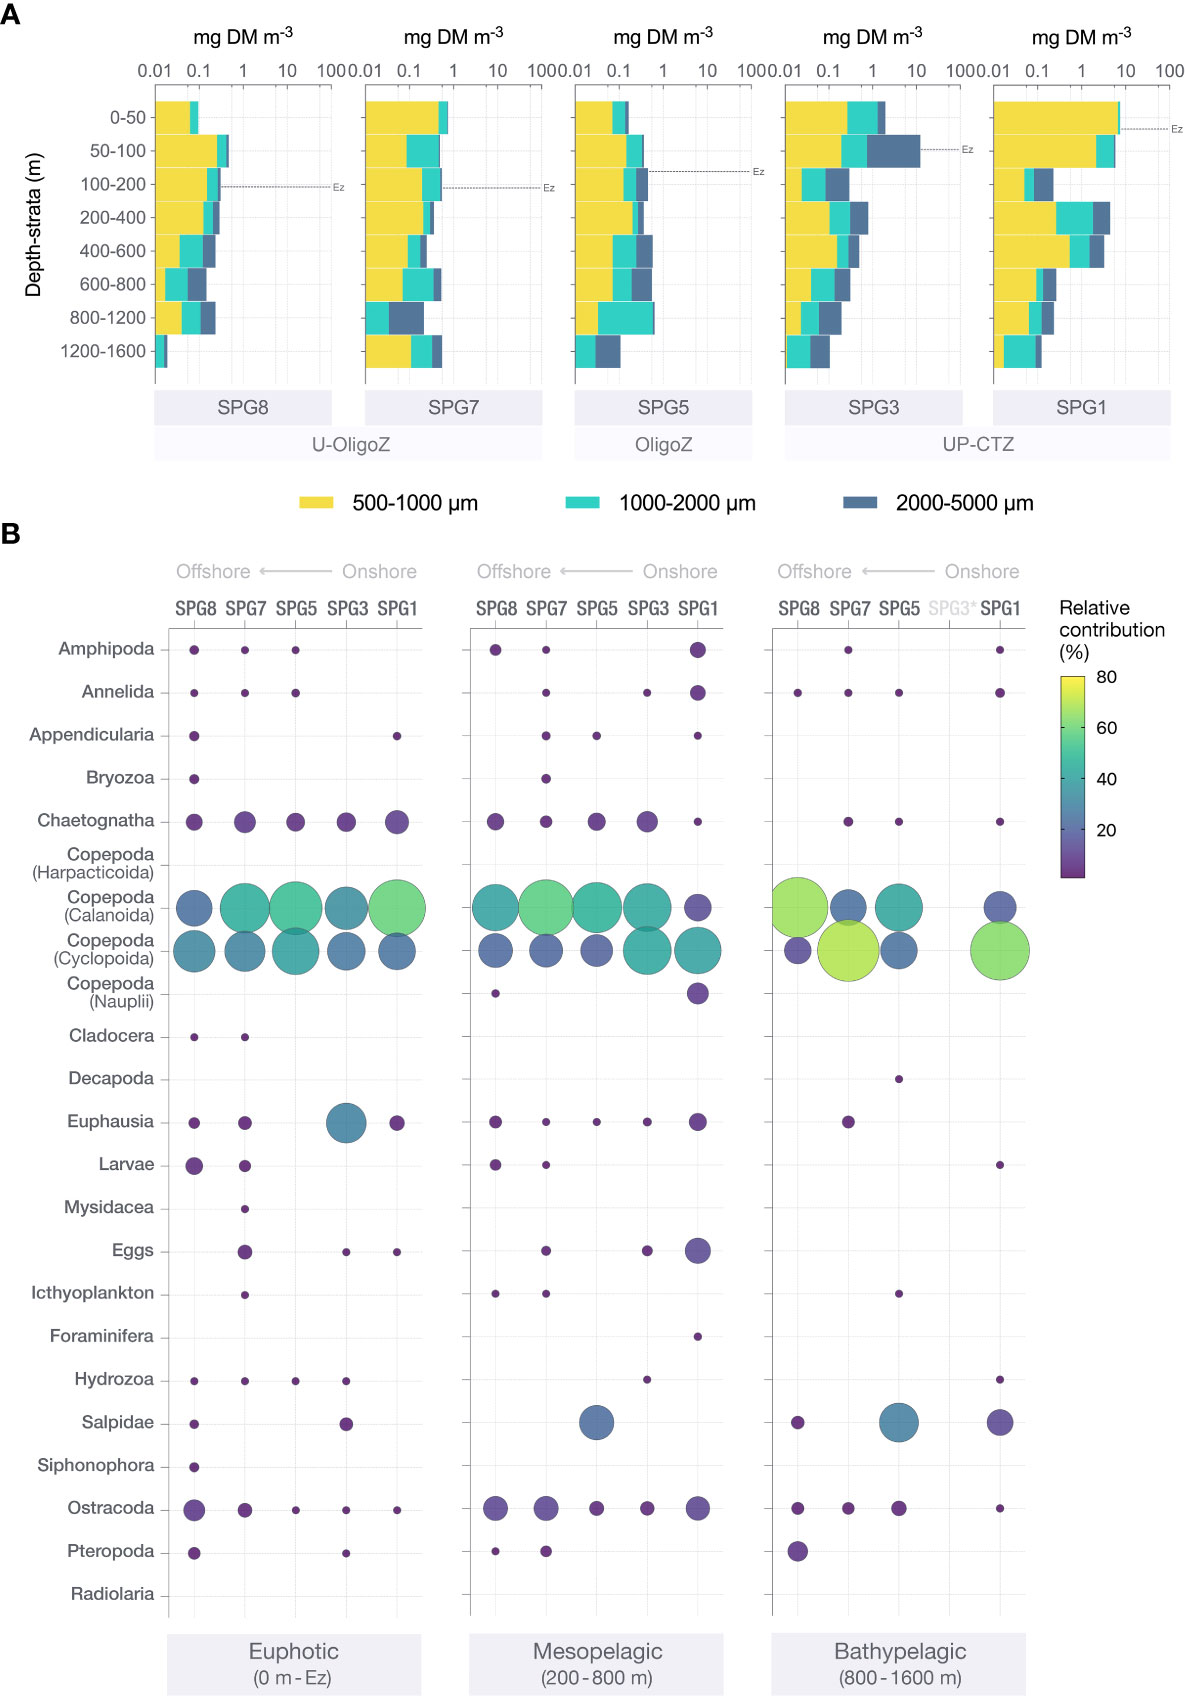
Figure 3 (A) Vertical profiles of the logarithm of zooplankton dry mass (DM) for those stations sampled for CSIA-AA along the productivity gradient in the Southeast Pacific. The horizontal black dashed line stands for the euphotic zone (Ez) at each station. (B) Relative contribution (in percentage) of each zooplankton group to the total community abundance in the euphotic, mesopelagic and bathypelagic zones from the 5 stations where the CSIA-AA analyses were performed. Circle size is proportional to the corresponding percentage, also represented by the color bar. No circles means no presence, except for the bathypelagic layer of SPG3 (marked with an asterisk), where no sample for taxonomy was available.
3.3. Nitrogen sources sustaining the planktonic food web
The stable nitrogen isotopes of bulk material and individual amino acids of seston and zooplankton were used to trace the source of nitrogen entering into the base of the planktonic food web. Bulk δ15N values in the POM and zooplankton samples decreased towards the ultra-oligotrophic region (Table 1), which may indicate a shift in the nitrogen used for primary production. This pattern, however, might be influenced not only by the origin of the nitrogen, but also by its movement and transformation through the trophic chain. In this sense, the δ15NPhe values derived from the CSIA-AA analyses provide a more reliable proxy for the dominant inorganic nitrogen source, since they remain relatively unaffected by trophic fractionation. According to Figure 4, there was a clear gradient in the δ15NPhe values of POM across the Southeast Pacific that was likewise reflected in the isotopic signatures of zooplankton. Highest baseline δ15NPhe values both in POM and zooplankton were found at the UP-CTZ (Figure 4), with maximum values of 9.0‰ and 11.7‰, respectively (Supplementary Tables S2–S5). On the contrary, the baseline δ15NPhe values were lowest in the blue oligotrophic waters from the South Pacific gyre, where they decreased to a minimum of –1.9‰ in POM. This trend in the δ15NPhe values of POM was thus highly correlated with the NPP (Supplementary Figure S5). Strikingly, zooplankton baseline δ15NPhe values from the oligotrophic station SPG5 were akin to those observed in the more coastal stations, differing significantly from those measured at SPG7 and SPG8 (one-way ANOVA, F4,53 = 43.96, P value<0.001, Supplementary Table S6).
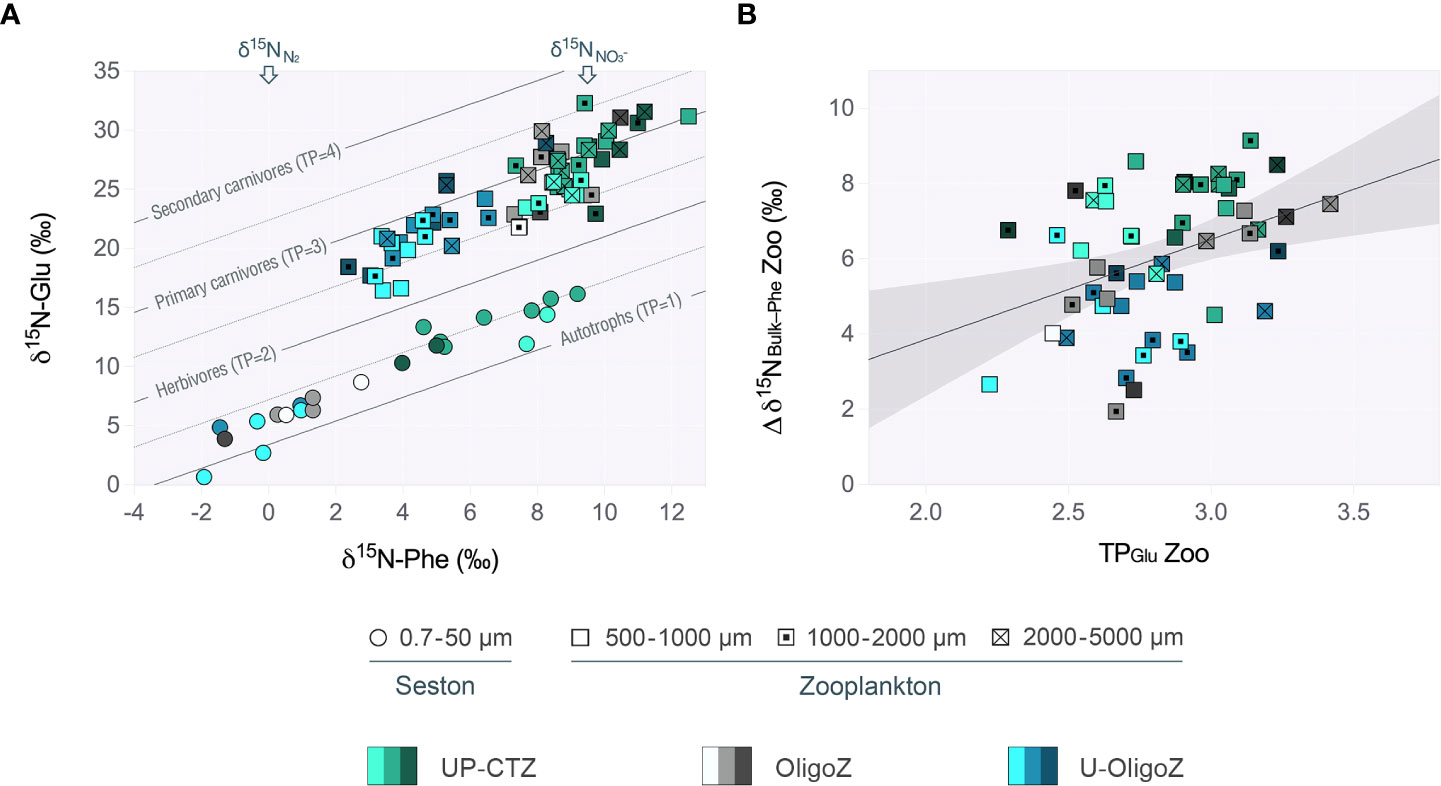
Figure 4 (A) Cross-plot for δ15N values of Glu and Phe of seston and size-fractionated zooplankton measured at the upwelling-coastal transition (UP-CTZ), the oligotrophic (OligoZ) and the ultra-oligotrophic (U-OligoZ) regions from the Southeast Pacific. The color gradient stands for the depth layer, including epipelagic (bright tones), mesopelagic (half-tones) and bathypelagic waters (dark tones). The amino acid isotope compositions in the samples are arrayed across trophic isoclines representing various trophic positions (TP=1, 2, 3, and 4, plotted as solid lines). Above are given the reference δ15N values for atmospheric N2 (0‰) and (mean value of 9.3±2.7‰, considering the range of δ15 signatures given by Pantoja, 2006, for this same region and concentrations). (B) Trophic enrichment in zooplankton from all different habitats of the Southeast Pacific, assessed as the slope of the regression line between δ15NxtBulk-Phe and TPGlu (Δδ15NBulk-Phe = 2.66 TPGlu - 1.47, R2 = 0.16, P value = 0.003, n = 54). Shadow grey bands stand for the 95% confidence intervals.
Applying a two-source mixing model (Eq. 2), which considers the two sources of new nitrogen (nitrate and nitrogen from diazotrophic N2-fixation), we estimated the contribution of each N-species to the Phe newly synthesized by the primary producers and subsequently incorporated into zooplankton biomass (Table 2). While nitrate fueled new production within the first ~500 km off the northern Chilean coast, contributing from 82.1% to 95.7% of the amino acid nitrogen in zooplankton at SPG1 and SPG3, most biological production within the core of the oligotrophic gyre (stations SPG7 and SPG8) relied largely on nitrogen of diazotrophic origin (74.0 ± 2.0%, n = 2, in seston and 45.5 ± 2.1%, n = 4, in zooplankton). A greater difference in the contribution of diazotrophic nitrogen between seston (55.1%) and zooplankton (14.9 ± 0.1%, n = 2) was found at SPG5 (Table 2). This apparent mismatch in the baseline δ15NPhe values between seston and zooplankton was comparatively lower within the UP-CTZ region (Figure 5), although it became larger in all cases with increasing water depth.
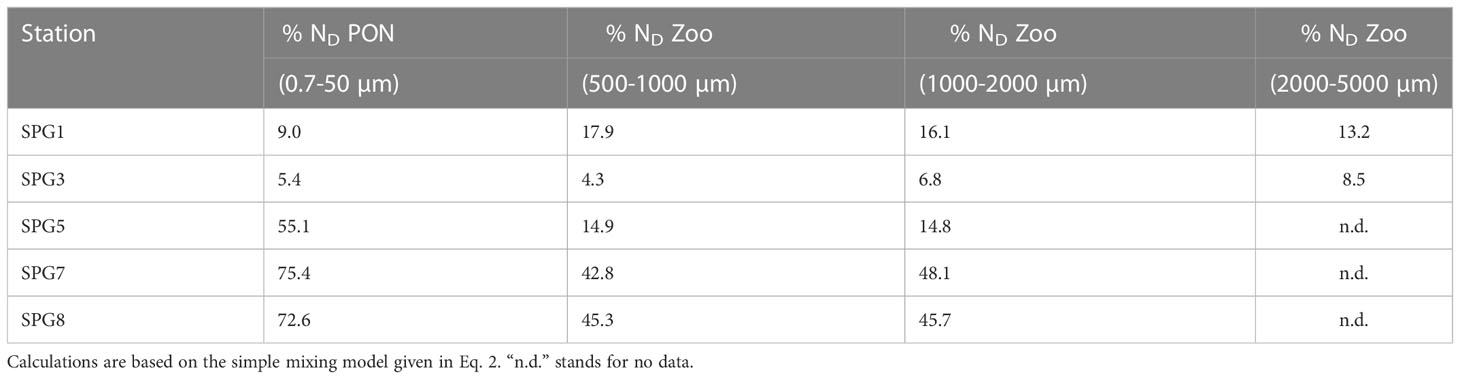
Table 2 Contribution of diazotrophic N (% ND) to the particulate organic nitrogen (PON) and the three zooplankton size classes within the epipelagic layer.
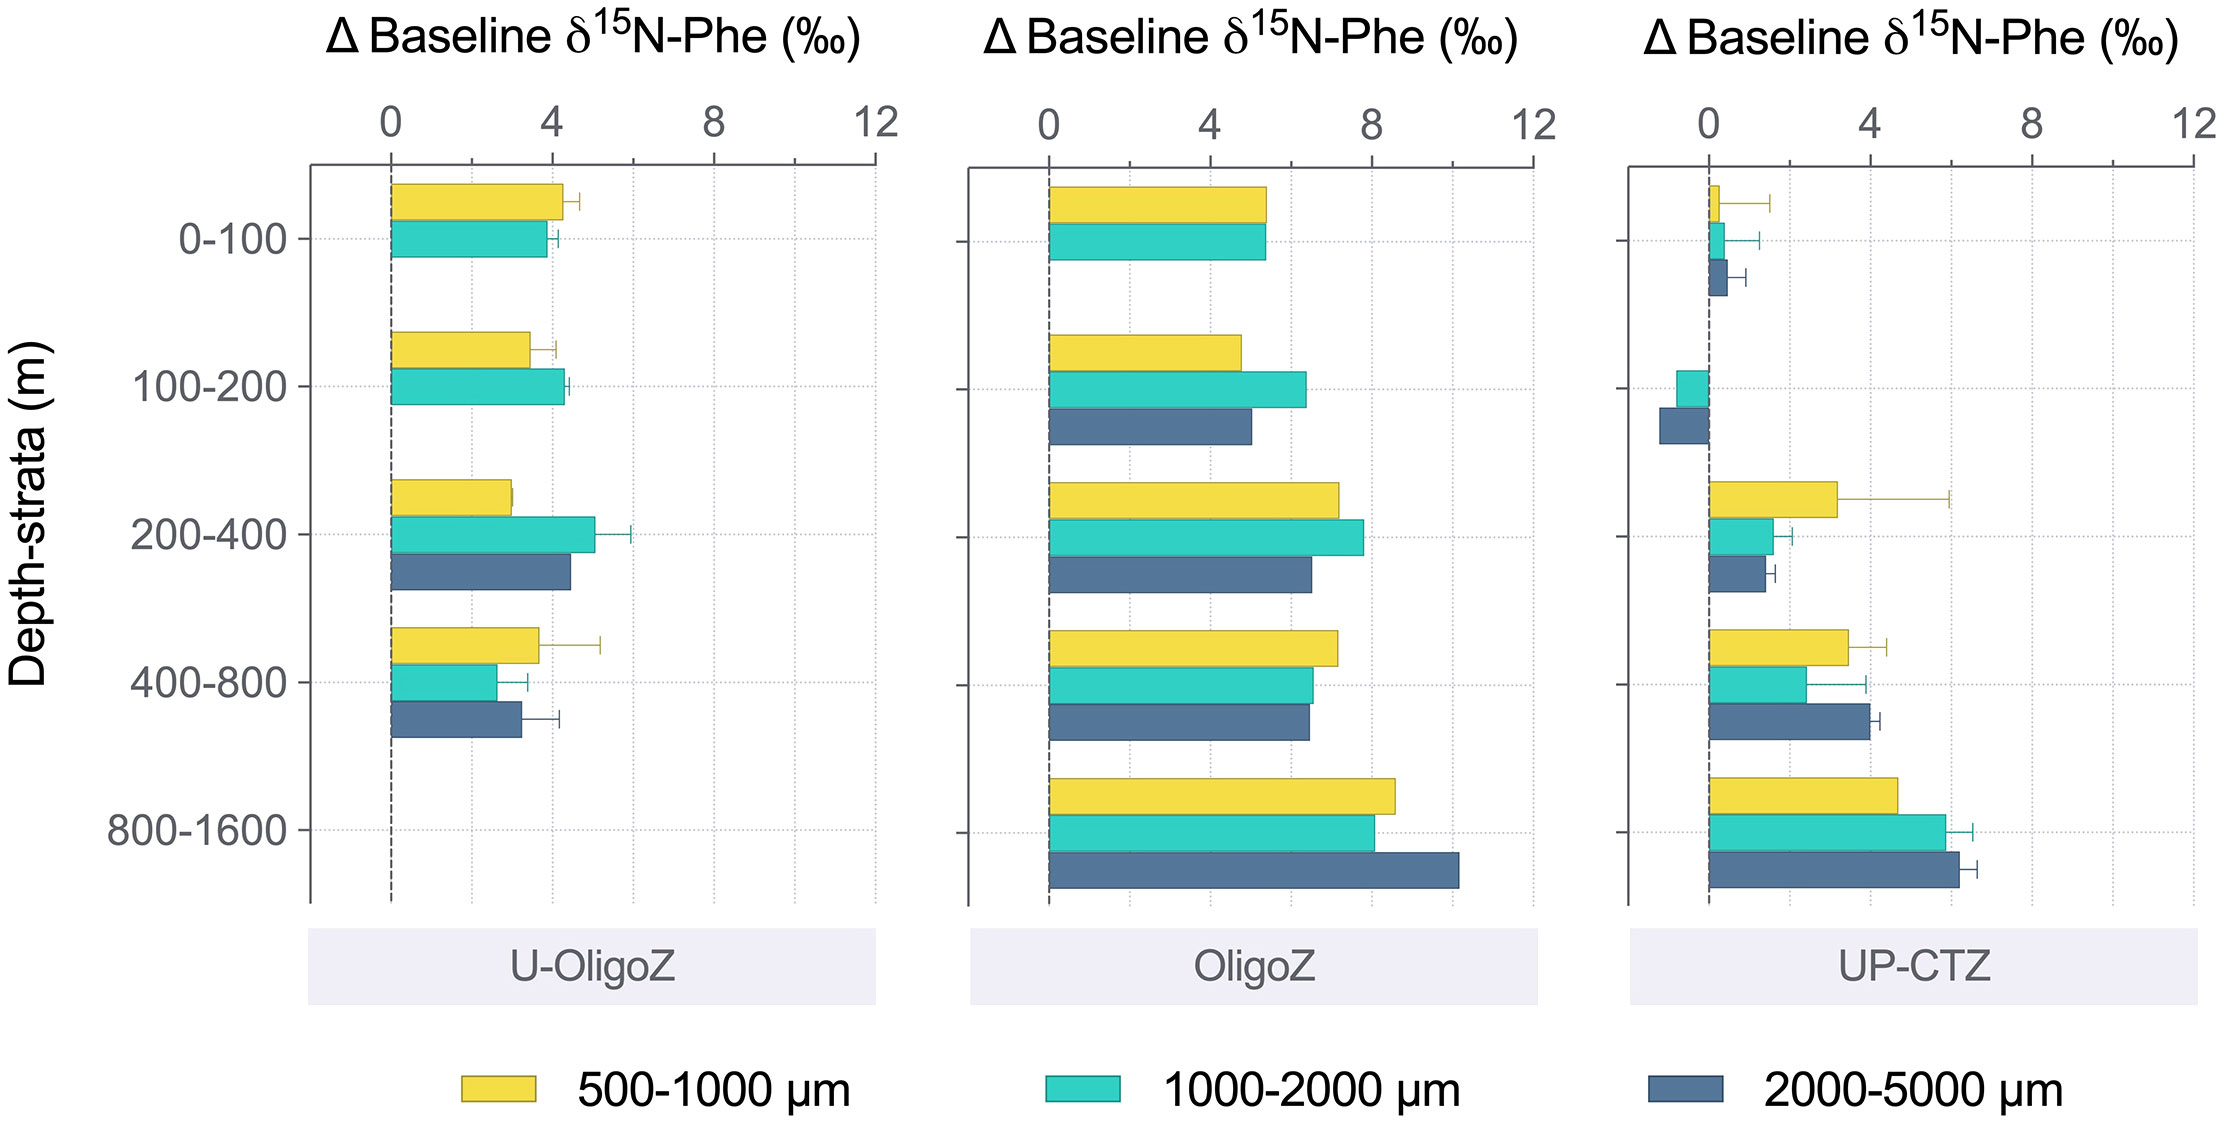
Figure 5 Differences between the baseline δ15N-Phe values (Eq. 3) measured in the size-fractionated zooplankton and seston (i.e., baseline δ15N-Phezoo – δ15N-Pheseston) throughout the water column at the upwelling and coastal transition zones (UP-CTZ), the oligotrophic region (OligoZ) and the ultra-oligotrophic waters (U-OligoZ) in the Southeast Pacific.
3.4. Trophic ecology of size-fractionated zooplankton
The TPs of seston and zooplankton through the metazoan food web were derived from the relationship between the δ15N of Glu and Phe (see Eq. 4), and the values are shown across the trophocline in Figure 4A. According to this ecological index, there was a clear shift in the trophic level between the seston and the zooplankton size classes. TPs in seston ranged typically from autotrophy (TP = 1) to mixotrophy (TP = 1.5), while the zooplankton were predominantly omnivores (TP = 2.8 ± 0.3, n = 65). It was remarkable the lack of strict herbivory even at the coastal upwelling zone, where the plankton community indeed showed slightly higher TPs compared to those in oligotrophic waters. Although there were no statistical differences in the TPs between the zooplankton size-classes (one-way ANOVA, F2,53 = 1.66, P value = 0.055, Supplementary Table S6), the largest zooplankton were usually calculated to be at higher trophic positions (TP = 3.0 ± 0.3, n = 18) than their smaller counterparts (TP = 2.8 ± 0.3, n = 24, and 2.7 ± 0.2, n = 23, for the 1000 - 2000 µm and 500 - 1000 µm size fractions, respectively). Moreover, a significant variability in the TPs was found throughout the water column, with the surface layer containing zooplankton of lower TPs in all stations (one-way ANOVA, F3,53 = 7.35, P value< 0.001, Supplementary Table S6). Based on the relationship between Δδ15NBulk-Phe and TPs we further estimated the trophic enrichment factor in zooplankton from all ecoregions (Figure 4B). The slope of the linear regression that relates both variables was particularly significant at the oligotrophic region, but it still indicated a significant trophic enrichment of 2.7‰ in zooplankton bulk biomass between trophic steps when considering all datapoints.
We additionally used the ΔTPs as a proxy for the microbial contribution to the zooplankton diet. On this basis, we found that the microbial food web was significantly more important within the UP-CTZ (i.e., in the SPG1 and SPG3) than in the ultra-oligotrophic stations SPG7 and SPG8 (one-way ANOVA, F4,42 = 5.47, P value< 0.001, Supplementary Table S6). This was particularly evident in the zooplankton >1000 m (Figure 6A). Following Eq. 5, we thus estimated that up to 26.2 ± 2.8 % of the zooplankton diet was based on protozoa at the productive station SPG1, a percentage that decreased to 19.4 ± 2.9 % at SPG8 (Figure 6B). The difference in the percentages would indeed be greater by nearly 2-fold if the smaller zooplankton (500-1000 µm) were excluded from the calculations. However, this change in the diet composition was not accompanied by differences in the ΣV parameter (one-way ANOVA, F4,45 = 1.13, P value = 0.342, Supplementary Table S6), meaning that the microbial reworking in detrital materials eventually ingested by zooplankton was homogeneous across the longitudinal transect and depth layers. This implies little variability in the freshness of the organic matter incorporated into the zooplankton food web.
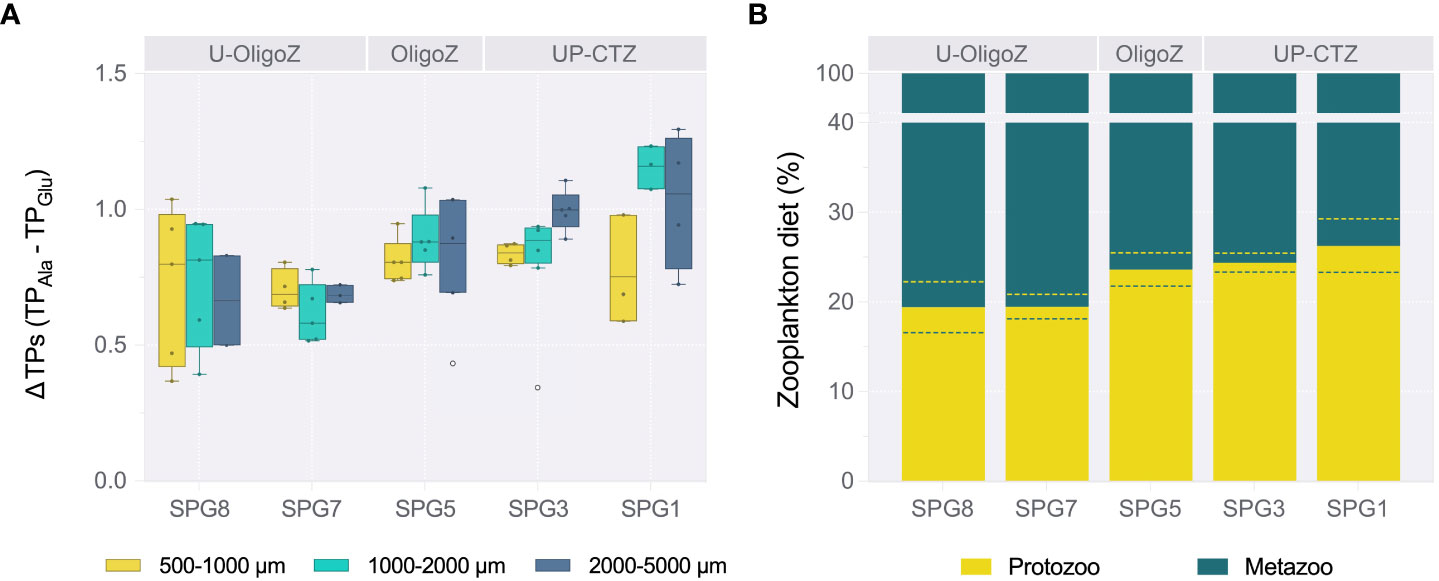
Figure 6 (A) Box-plot diagram showing the differences between trophic positions (ΔTPs) calculated for the size-fractionated zooplankton after using alanine (TPAla) or glutamate (TPGlu) as trophic amino acids. Values were integrated through the water column given that there were no statistical differences in the TPs with depth (Supplementaey Table S6). Each whisker plot represent the 10-90% percentiles, with the upper and lower limits indicating the maximum and minimum values (colored circles), respectively, and the horizontal line showing the mean. The two white circles were detected as statistical outliers through the Tukey’s approach, and hence not considered in the corresponding bars. (B) Relative contribution (in percentage) of protozoa and metazoa to the zooplankton diet along the productivity gradient, estimated following Eq. 5. Dashed lines in each bar stand for the 95% confidence interval. The corresponding upwelling-coastal transition (UP-CTZ), oligotrophic (OligoZ) and ultra-oligotrophic (U-OligoZ) zones are indicated in the top of both panels.
3.5. Environmental regulation of the food web structure in the Southeast Pacific
A redundancy analysis (RDA) was applied to identify how the oceanographic conditions shape the trophic ecology of the plankton community along the productivity gradient in the Southeast Pacific, from the Ez to bathypelagic depths (Figure 7). The first two canonical axes accounted for most of the variance generated by the 6 variables considered in the analysis. Other explanatory variables such as the salinity (S) and the particulate organic nitrogen (PON) concentration were highly correlated with the temperature and the chlorophyll-a (Chl-a) concentration, respectively (see Supplementary Figure S6), and therefore, excluded from the RDA. The included environmental variables explained 69.4 % of the variation in the ecological indices of the plankton community across stations, with the euphotic zone depth (Ez) being the most important explanatory variable in the analysis (F = 11.13, P value = 0.002). Conversely, the dissolved oxygen concentration and the temperature made little contribution to explain changes in the trophic regulation across the Southeast Pacific. Overall, dimension 1 explained most of total variation (53.8%) and was primarily driven by the Ez, leading to higher bulk and baseline Phe δ15N values at lower Ez depths as well as to higher ΔTPs. The dimension 2 (8.5%) was most influenced by the dissolved inorganic nitrogen (DIN), the mixed layer depth (MLD) and the Chl-a concentration, which together explained the patterns in the zooplankton biomass as well as in the elemental and isotope composition of seston. Overall, the three distinct ecoregions were easily distinguished in the RDA (Figure 7): (1) the UP-CTZ (stations SPG1 and SPG3), characterized by the highest nutrient and Chl-a concentrations, with higher zooplankton biomass and isotopic signatures both in seston and zooplankton; (2) the more oxygenated oligotrophic station SPG5, also characterized by the deepest MLD; (3) the warmer ultra-oligotrophic region (stations SPG7 and SPG8), with deeper Ez depths. The greatest differences with the water depth was found in those stations located at the UP-CTZ, mainly driven by the steep vertical gradient both in the DIN and Chl-a concentrations throughout the water column.
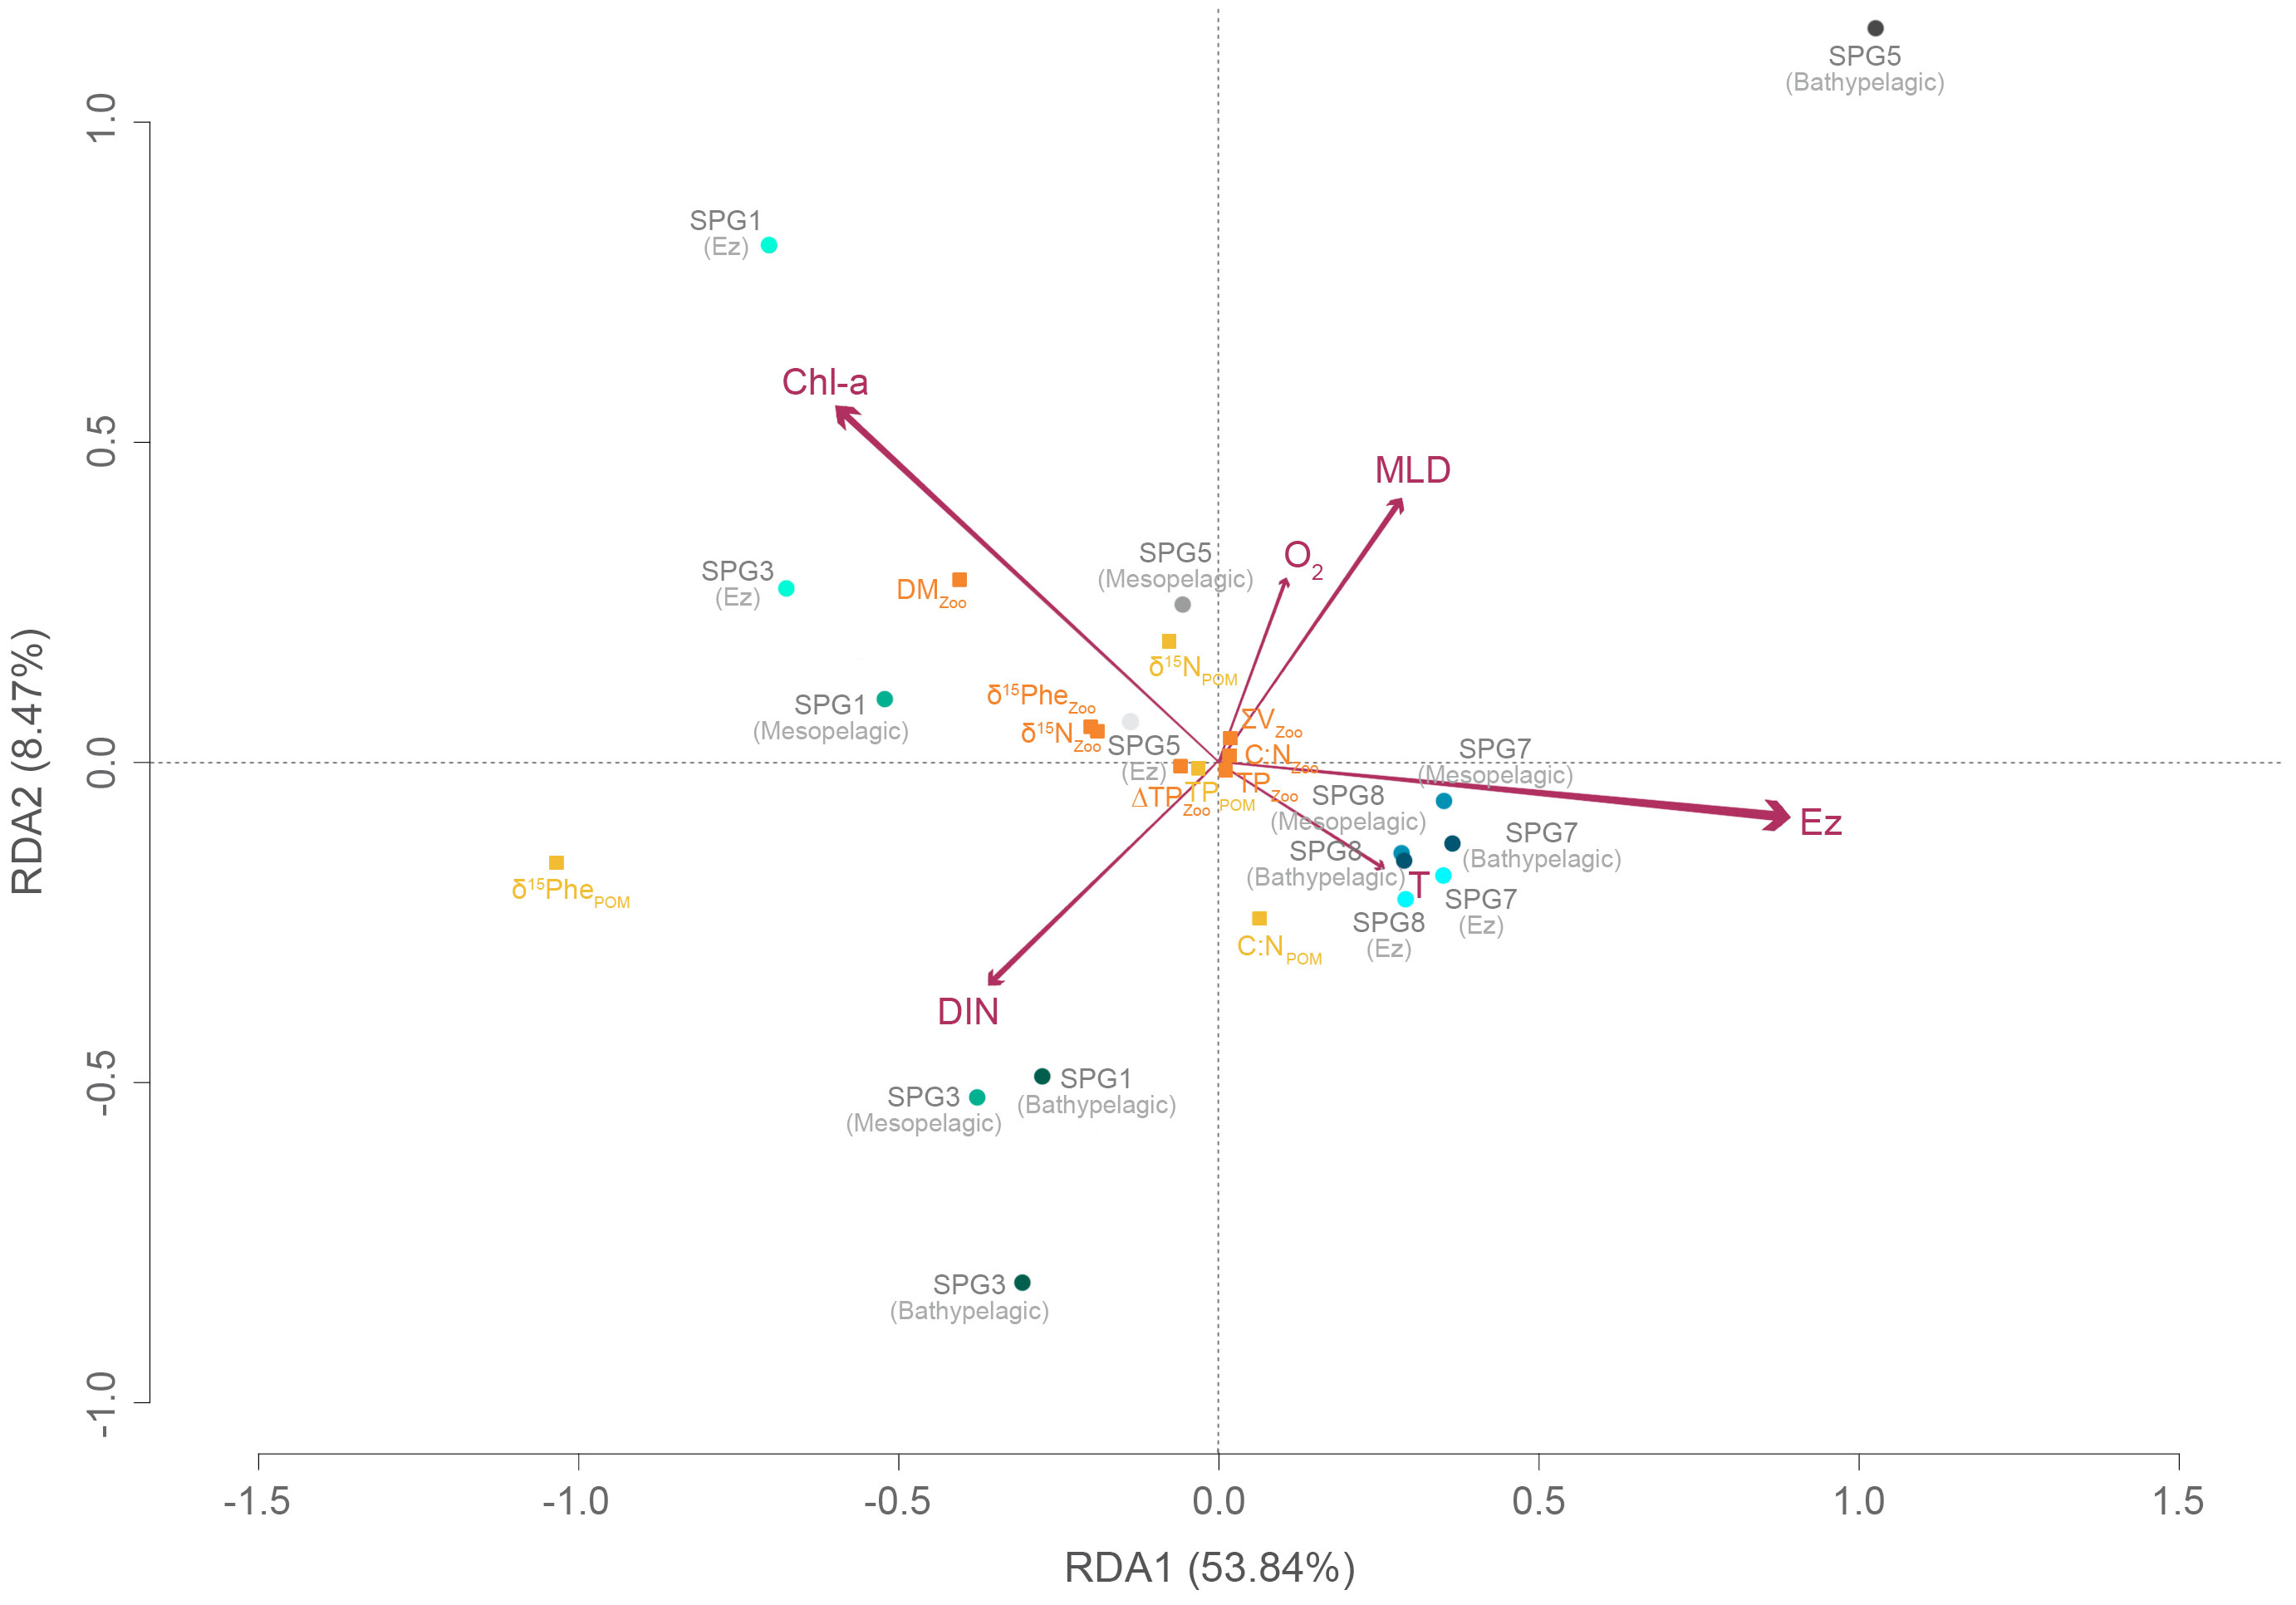
Figure 7 Redundancy analysis (RDA) triplot ordination with various ecological indices of seston and zooplankton as variable responses (yellow and orange squares, respectively) against selected environmental variables (arrows) on 5 stations and 3 depth strata (circles) studied across the longitudinal transect in the Southeast Pacific. The explanatory (environmental) variables are labeled as follows: chlorophyll-a, Chl-a; dissolved inorganic nitrogen concentration, DIN; temperature, T; euphotic zone, Ez; mixed layer depth, MLD; dissolved oxygen concentration, O2. The length of the arrows indicate the strength of the explanatory variable to drive variation in the community matrix. The first two canonical axes explain 62.3 % of variability (F = 3.02, P value = 0.028, R2 = 0.46).
4. Discussion
Here we characterize the structure of the planktonic food web and elucidate the sources of new nitrogen used for primary production across biogeochemical regions in the Southeast Pacific. Our findings show that, despite the increased importance of diazotrophic nitrogen towards the oligotrophic ocean, the trophic position of size-fractionated zooplankton remained relatively constant, being primarily omnivorous in all ecoregions. These results contradict somewhat the classical oceanic food web paradigm that assumes fewer trophic steps in highly productive environments dominated by large phytoplankton cells (Steele, 1974). On the contrary, we found a greater contribution of the microbial food web to the overall energy transfer within the coastal-transition upwelling zone. Whether these results hold across time will still require a further evaluation through temporally-integrated analyses of the food web efficiency in the region.
4.1. Environmental and community variability in the Southeast Pacific
The longitudinal transect surveyed during the austral summer showed the typical oceanographic gradient across the Southeast Pacific described elsewhere (e.g. Silva et al., 2009; Peters et al., 2018). The wind-driven upwelling of nutrient-rich cold Subantarctic Waters (SAAW) promoted high productivity along the Chilean coast (Figure 1), which is eventually exported farther offshore by mesoscale features (Wang et al., 2018). This resulted in shallow thermoclines and Ez depths between 71-80°W, as well as in less salty surface waters. Just below the SAAW, the Equatorial Subsurface Water (ESSW) introduced oxygen-deficient waters between ~100-400 m, with profound trophic and biogeochemical implications, as it forces most zooplankton into a thin surface oxygenated layer (Donoso and Escribano, 2014) while limiting their vertical migrations (Tutasi and Escribano, 2020). The water mass distribution in the upper water column changed drastically towards the oligotrophic gyre at ~90°W, which may pose an ecological barrier to certain organisms (González et al., 2020). Here the vertical gradient was less marked, with the warmer Subtropical Water (STW) dominating from the surface down to ∼350 m. The limited nutrient availability in these oceanic waters lead to low productivities all-year round, resulting altogether in one of the deepest Ez in the world’s oceans (Siegel et al., 2014). Strikingly, this was not accompanied by a deepening of the mixed layer depth (Table 1), which in the South Pacific summer varies within a narrow range despite the contrasting physicochemical properties of the surface water masses (Montégut et al., 2004). Below ∼400 m, the hydrography was comparatively more homogeneous along the whole transect, with the Antarctic Intermediate Water (AAIW) occupying the ∼400-1000 m depth range and the Pacific Deep Water (PDW), the bottom layer.
All these oceanographic features caused a pronounced shift in the zooplankton biomass along the longitudinal gradient (Figure 3A). Productive upwelling regions such as the Peru-Chile coastal current are known to hold high standing stocks of zooplankton biomass even at depth (Proud et al., 2017), which in turn sustain large fisheries (Espinoza and Bertrand, 2008). Although our more coastal station SPG1 was outside the direct influence of the upwelling core, we still found 7.51 mg m-3 of zooplankton dry mass in the epipelagic layer, a figure slightly below those reported in waters over the central Chilean shelf (Escribano et al., 2012). Even at the coastal mesopelagic zone, the zooplankton biomass exceeded by an order of magnitude the one found in the surface oligotrophic waters, indicating a potential linkage between deep-sea ecosystem processes and overlying dynamics, as previously argued by Fernández-Urruzola et al. (2021). The subsequent transport of zooplankton towards the open ocean by lateral advection might further explain the biomass peaks that we found at the offshore stations SPG2 and SPG3 (Table 1 and Figure 3A), both dominated by larger zooplankton that were likely derived from succession processes within the community (Vinogradov and Shushkina, 1978). The lateral transport would similarly explain the presence of eggs farther offshore (Figure 3B), as spawning usually occurs near the coast in recently upwelled waters (Soto-Mendoza et al., 2012; Shen et al., 2017). All this means that the coastal upwelling may effectively enhance the food availability for higher trophic levels even in oceanic waters (González et al., 2023). These spatial changes in terms of biomass did not greatly impact, however, the community composition (Figure 3B). As expected from previous studies in the region (e.g. González et al., 2018; González et al., 2020; Medellín-Mora et al., 2021), copepods by and large represented the bulk zooplankton biomass in all different habitats, either in surface or deep waters, thus implying little effect of broad taxonomic categories on food web structure across the Southeast Pacific. Still, copepods are known to occupy a wide range of trophic niches and adapt their diet to local resource changes (Schukat et al., 2014), so there will be intra- and interspecific variability in the trophic role of coexisting copepod species (Massing et al., 2022). Altogether the zooplankton community removes about half of the surface primary production in the northern Humboldt Current System, with the small-sized copepods playing a role comparable to the larger key herbivorous species Calanus chilensis (González et al., 2000).
4.2. Nitrogen supply across distinct biogeochemical regions
The productivity gradient along the transect was intrinsically linked to the DIN concentration within the sunlit layer (Table 1 and Supplementary Figure S1A). Understanding the distribution as well as the nature of the nitrogen available for new production is necessary to better interpret the trophic dynamics and the nitrogen flow through the pelagic food web. While nitrate is assumed to be the main source of new nitrogen in upwelling ecosystems (Mulholland and Lomas, 2008), N2-fixation by diazotrophs has consistently been detected in the presence of DIN along coastal margins, with high rates up to 14 nmol N L-1 d-1 at specific sites in the Peru-Chile current (Raimbault and Garcia, 2008; Fernandez et al., 2011). Nevertheless, according to the simple mixing model applied here, between 85.9 % and 99.0 % of the biological production at the UP-CTZ region relied on upwelled (Table 2), which was particularly enriched in 15N (mean δ15N value of 9.3‰ as reported by Pantoja, 2006) by denitrification in the oxygen-depleted subsurface coastal waters (Dalsgaard et al., 2012). Our results align with other N2 fixation studies in eastern boundary upwelling systems (e.g. Benavides et al., 2014; Chang et al., 2019), confirming a minor role for diazotrophy in the nitrogen supply across coastal-transition surface waters off central Chile. Differences in the relative contribution of to new production between SPG1 and SPG3 were likely due to isotopic fractionation processes associate with the nitrogen uptake of phytoplankton (Montoya, 2007), which ultimately modify the isotopic composition of the recently upwelled pool. Accordingly, a positive discrimination of primary producers in favor of the lighter isotope (14N) might have progressively enriched the residual pool as it was horizontally advected.
An effective decline in the DIN availability occurred in the oligotrophic gyre (Supplementary Figure S1A), where nutrient limitation provides a potential ecological niche for the proliferation of N2-fixers, which have the ability to use the inexhaustible and isotopically lighter dissolved N2 gas. The low iron deposition in surface waters in the eastern South Pacific gyre, however, may limit the grown of diazotrophs (Knapp et al., 2016), so their regional occurrence and impact on the nitrogen cycle remain unclear, with studies arguing for their importance as suppliers of allochtonous nitrogen to the ecosystem (Raimbault and Garcia, 2008; Benavides et al., 2022) and others diminishing their role (e.g. Knapp et al., 2016; Chang et al., 2019). Beyond these discrepancies, there is also the question about how these unicellular autotrophs influence the planktonic food web structure. Although large zooplankton may prey directly upon filamentous diazotrophs (Conroy et al., 2017), these are mostly unpalatable, so both free-living and colonial cyanobacteria are rather incorporated into zooplankton biomass through microheterotrophs (Loick-Wilde et al., 2019). Either by direct or indirect grazing on diazotrophs, our estimates reveal that about half of the zooplankton nitrogen in the highly stratified ultra-oligotrophic waters in the Southeast Pacific originated from N2-fixation (Table 2). Whether this substantial contribution of diazotrophy to new production is a general trend in the region or just a patchy process will require further finer-scale studies (e.g. Benavides et al., 2021).
A striking case was found in SPG5, located at the outer edge of the gyre, where the mismatch between seston and zooplankton δ15NPhe values, i.e. in the nitrogen source fueling each plankton assemblage, was more apparent than in any other region (Figure 5 and Table 2). While physiological and temporal decoupling between consumers and resources may explain some differences in their isotopic signatures (Post, 2002), the zooplankton from SPG5 showed a closer resemblance in the δ15NPhe values to their coastal counterparts than to those inhabiting the ultra-oligotrophic core (Figure 4A), even though N2-fixation accounted for most of the fixed nitrogen in the particulate material from SPG5 (54.1 % of PON, Table 2). This suggests strong mesoscale activity in the region that may have advected zooplankton grown on a nitrate-based production environment to ca. 2000 km offshore, despite the oceanographic barriers associated with the water mass distribution detailed above. These findings concur with previous investigations on the distribution patterns of euphausiids which demonstrated that eddies can effectively retain zooplankton for long periods of time while transporting them to the oligotrophic region (Riquelme-Bugueño et al., 2015).
4.3. Planktonic food web structure along the productivity gradient
Despite the contrasting physico-chemical conditions and productivity patterns that we found across the Southeast Pacific, the trophic level of the three zooplankton size classes remained relatively constant, ranging from omnivorous to carnivorous feeding habits through the metazoan food web (Figure 4A). Each size category likely contained a wider range of TPs at the individual and species level (e.g., Espinosa-Leal et al., 2020; Massing et al., 2022), but they still represented the dominant TP of the bulk community. A higher level of carnivory was detected along the UP-CTZ region, with zooplankton TPs up to 3.5, even though these waters were expected to be dominated by herbivorous zooplankton grazing on large phytoplankon cells, which would presumably result in shorter and more efficient food webs (Décima, 2022; Massing et al., 2022). Although the missing 50-500 µm size class could have filled, to some extent, the gap between autotrophs and omnivores, the fact that the seston also exhibited greater TPs in the more productive UP-CTZ waters, where mixotrophy (i.e., TP values around 1.5) actually prevailed, points to a comparatively major role of protists in this region. A growing body of evidence indeed suggests an enhanced complexity of trophic flows in upwelling and mesotrophic environments (Vargas et al., 2007), in which microzooplankton in general, and dinoflagellates in particular, would act as the main grazers (Calbet, 2008). In this context, the offset between zooplankton TPs calculated from the trophic amino acids Glu and Ala have been proven to be a useful proxy to detect the microbial trophic step in a multivorous food web (Gutiérrez-Rodríguez et al., 2014), here revealing that either protozoa or bacteria bound to aggregates made up a significant portion of the zooplankton diet (Figure 6B). The trophic transfer through microheterotrophs, however, shifted as much as 12% towards a metazoan diet along the transect, from a maximum of 29.0% at SPG1 to a minimum of 16.9% at the ultra-oligotrophic SPG8. These dietary contributions of microbial organic matter to zooplankton are within the ranges given for contrasting marine environments (Calbet and Saiz, 2005), and confirm the relevance of zooplankton feeding to link the microbial loop with the classical food chain in the Southeast Pacific, especially under mesotrophic or post-bloom conditions (Vargas et al., 2007; Mitra et al., 2014; Décima and Landry, 2020), where the small calanoid and cyclopoid copepods account for a relatively large portion of the zooplankton grazing (González et al., 2000). The enhanced trophic interactions between intermediate trophic levels further points to the ecosystem resilience to disturbance, and would also explain the wide trophic niches shown by González et al. (2018) for zooplankton. Nevertheless, it needs to be considered that the more coastal station SPG1 was slightly displaced offshore of the upwelling front (Figure 1), so we cannot discount a higher level of herbivory (i.e., a shorter food web) at a less mature successional stage of the community in the newly upwelled waters off central Chile. Moreover, factors other than the trophic steps (e.g., the transfer efficiency, nutritional quality or loss processes) will also determine the efficiency of the food web; in this sense, Décima (2022) recently argued that the classical paradigm for food webs mainly holds for the mesozooplankton at the productivity extremes in the North Pacific, while all other factors would be key for the trophic efficiency at intermediate productivities in comparable upwelling environments. Likewise, the trophic enrichment factor found in this study (Figure 4B) resembled the one reported for the subtropical North Pacific (Hannides et al., 2009), with the zooplankton showing a linear enrichment of 2.7‰ per trophic level in both ecosystems. This value, which falls at the lower end of the range given for various marine environments (Weber et al., 2021), reflects that the dietary nitrogen fulfilled the basal metabolic requirements of zooplankton across the Southeast Pacific and most particularly, at the oligotrophic region (Adams and Sterner, 2000).
Regardless of the surface productivity, the main trophic shift was found with water depth (Supplementary Table S6). All zooplankton size classes tended to occupy higher trophic positions below the euphotic zone, likely due to an enhanced role of suspended particles, with higher C:N ratios (Supplementary Table S2), on sustaining the food web through the twilight zone (Hannides et al., 2020; Bode et al., 2021). According to Hannides et al. (2020), the highly abundant cyclopoid copepods (Figure 3B) are able to access small particle resources and link them with the larger zooplankton and micronekton. Still, the small amount of variation in the heterotrophic re-synthesis index (ΣV) suggests the assimilation of relatively fresh organic matter at depth. While the low differences in the baseline δ15NPhe values throughout the water column (Supplementary Table S6) point to the importance of the export flux in this ecosystem (Fernández-Urruzola et al., 2021), the migrant zooplankton would also serve as an alternative source of energy for resident carnivores in the deep ocean (Steinberg and Landry, 2017). The active transport of photosynthetically fixed carbon to depth by eucalanid copepod species may indeed represent a potential trophic pathway below the ESSW considering the inability of other zooplankters to penetrate into these oxygen deficient waters (Escribano et al., 2009; Tutasi and Escribano, 2020). The high abundance of salps at mesopelagic and bathypelagic depths during the day (Figure 3B) together with their vertical migration patterns (Purcell and Madin, 1991) might also point to their role in supplying fresh organic matter to depth. All this together argues for an interplay of diverse feeding strategies within the mesopelagic and bathypelagic realms, resulting in wider ecological niches compared to the surface layer as also revealed by the greater differences in the baseline δ15NPhe values between seston and zooplankton at depth (Figure 5).
4.4. Conclusions
Our survey along a steep oceanographic gradient shows that factors other than just the system productivity control the planktonic food web structure in the Southeast Pacific. The results here challenge the classical paradigm of higher herbivory with increasing the ecosystem productivity by demonstrating an increased role of the microbial food web in the energy transfer at intermediate productivities within the coastal-transition waters of the Humboldt Current System. Still, a simple mixing model based on the isotopic signatures of mesozooplankton revealed that the coastal upwelling system may act as an important subsidiary for secondary production at the edge waters of the oligotrophic gyre. We encourage further, finer-scale and temporally-integrated, studies following the ageing upwelled waters of the Humboldt Current System to track and better understand the lengthening of the coastal planktonic food web off Chile and its impact on the fish stocks in the region.
Data availability statement
The original contributions presented in the study are included in the article/Supplementary Material. Further inquiries can be directed to the corresponding author.
Author contributions
IF-U and RE contributed conception and design of the study; IF-U, RE, WS, and DL collected samples during field samplings; IF-U, RE, AB, NL-W, and WS analyzed the samples and processed oceanographic data. IF-U drafted the manuscript with contributions from RE, AB, DL, and NL-W. All authors contributed to the article and approved the submitted version.
Funding
IF-U was supported by ANID-FONDECYT research projects 3180352 and 11221079 during the field sampling and the writing process, respectively. CSIA-AA analyses were partially funded by ANID-REDES 10039 and ANID-FONDECYT 1181682 projects granted to RE. The authors also acknowledge support from the Millennium Institute of Oceanography (IMO) of ANID Chile (Grant ICN12_019).
Conflict of interest
The authors declare that the research was conducted in the absence of any commercial or financial relationships that could be construed as a potential conflict of interest.
Publisher’s note
All claims expressed in this article are solely those of the authors and do not necessarily represent those of their affiliated organizations, or those of the publisher, the editors and the reviewers. Any product that may be evaluated in this article, or claim that may be made by its manufacturer, is not guaranteed or endorsed by the publisher.
Supplementary material
The Supplementary Material for this article can be found online at: https://www.frontiersin.org/articles/10.3389/fmars.2023.1057502/full#supplementary-material
References
Adams T. S., Sterner R. W. (2000). The effect of dietary nitrogen content on trophic level 15N enrichment. Limnol. Oceanogr. 45, 601–607. doi: 10.4319/lo.2000.45.3.0601
Appeltans W., Dujardin F., Flavell M., Miloslavich P., Webb T. J. (2016). “Biodiversity baselines in the global ocean,” in The open ocean: Status and trends (Nairobi: United Nations Environment Programm), 206–223. UNESCO IOC and UNEP.
Barnard J., Rubin D. B. (1999). Small-sample degrees of freedom with multiple imputation. Biometrika 86, 948–955. doi: 10.1093/biomet/86.4.948
Behrenfeld M. J., Falkowski P. G. (1997). Photosynthetic rates derived from satellite-based chlorophyll concentration. Limnol. Oceanogr. 42, 1–20. doi: 10.4319/lo.1997.42.1.0001
Benavides M., Caffin M., Duhamel S., Foster R. A., Grosso O., Guieu C., et al. (2022). Anomalously high abundance of crocosphaera in the south pacific gyre. FEMS Microbiol. Lett. 369 (1), fnac039. doi: 10.1093/femsle/fnac039
Benavides M., Conradt L., Bonnet S., Berman-Frank I., Barrillon S., Petrenko A., et al. (2021). Fine-scale sampling unveils diazotroph patchiness in the south pacific ocean. ISME. Comm. 1, 3. doi: 10.1038/s43705-021-00006-2
Benavides M., Santana-Falcón Y., Wasmund N., Arístegui J. (2014). Microbial uptake and regeneration of inorganic nitrogen off the coastal Namibian upwelling system. J. Mar. Sys. 140, 123–129. doi: 10.1016/j.jmarsys.2014.05.002
Benfield M.C., Grosjean P., Culverhouse P. F., Irigoien X., Sieracki M. E., Lopez-Urrutia A., et al (2007). RAPID: Research on Automated Plankton Identification. Oceanography 20 (2), 172–187. doi: 10.5670/oceanog.2007.63
Bode A., Olivar M. P., Hernández-León S. (2021). Trophic indices for micronektonic fishes reveal their dependence on the microbial system in the north Atlantic. Sci. Rep. 11, 8488. doi: 10.1038/s41598-021-87767-x
Calbet A. (2008). The trophic roles of microzooplankton in marine systems. ICES. J. Mar. Sci. 65, 325–331. doi: 10.1093/icesjms/fsn013
Calbet A., Saiz E. (2005). The ciliate-copepond link in marine ecosystems. Aquat. Microb. Ecol. 38, 157–167. doi: 10.3354/ame038157
Chang B. X., Jayakumar A., Widner B., Bernhardt P., Mordy C. W., Mulholland M. R., et al. (2019). Low rates of dinitrogen fixation in the eastern tropical south pacific. Limnol. Oceanogr. 64, 1913–1923. doi: 10.1002/lno.11159
Chikaraishi Y., Ogawa N. O., Kashiyama Y., Takano Y., Suga H., Tomitani A., et al. (2009). Determination of aquatic food-web structure based on compound-specific nitrogen isotopic composition of amino acids. Limnol. Oceanogr. Meth. 7, 740–750. doi: 10.4319/lom.2009.7.740
Conroy B. J., Steinberg D. K., Song B., Kalmbach A., Carpenter E. J., Foster R. A. (2017). Mesozooplankton graze on cyanobacteria in the Amazon river plume and Western tropical north Atlantic. Front. Microbiol. 8. doi: 10.3389/fmicb.2017.01436
Dalsgaard T., Thamdrup B., Farías L., Revsbech N. P. (2012). Anammox and denitrification in the oxygen minimum zone of the eastern south pacific. Limnol. Oceanogr. 57, 1331–1346. doi: 10.4319/lo.2012.57.5.1331
Décima M. (2022). Zooplankton trophic structure and ecosystem productivity. Mar. Ecol. Progr. Ser. 692, 23–42. doi: 10.3354/meps14077
Décima M., Landry M. (2020). Resilience of plankton trophic structure to an eddy-stimulated diatom bloom in the north pacific subtropical gyre. Mar. Ecol. Progr. Ser. 643, 33–48. doi: 10.3354/meps13333
Donoso K., Escribano R. (2014). Mass-specific respiration of mesozooplankton and its role in the maintenance of an oxygen-deficient ecological barrier (BEDOX) in the upwelling zone off Chile upon presence of a shallow oxygen minimum zone. J. Mar. Syst. 129, 166–177. doi: 10.1016/j.jmarsys.2013.05.011
Escribano R., Hidalgo P., Fuentes M., Donoso K. (2012). Zooplankton time series in the coastal zone off Chile: Variation in upwelling and responses of the copepod community. Progr. Oceanogr. 97-100, 174–186. doi: 10.1016/j.pocean.2011.11.006
Escribano R., Hidalgo P., Krautz C. (2009). Zooplankton associated with the oxygen minimum zone system in the northern upwelling region of Chile during march 2000. Deep-Sea Res. II.: Top. Stud. Oceagogr. 56, 1083–1094. doi: 10.1016/j.dsr2.2008.09.009
Espinosa-Leal L., Bode A., Escribano R. (2020). Zonal and depth patterns in the trophic and community structure of hyperiid amphipods in the southeast pacific. Deep-Sea Res. I. 165, 103402. doi: 10.1016/j.dsr.2020.103402
Espinoza P., Bertrand A. (2008). Revisiting Peruvian anchovy (Engraulis ringens) trophodynamics provides a new vision of the Humboldt current system. Progr. Oceanogr. 79, 215–227. doi: 10.1016/j.pocean.2008.10.022
Fernandez C., Farías L., Ulloa O. (2011). Nitrogen fixation in denitrified marine waters. PloS One 6, e20539. doi: 10.1371/journal.pone.0020539
Fernández-Urruzola I., Ulloa O., Glud R. N., Pinkerton M. H., Schneider W., Wenzhöfer F., et al. (2021). Plankton respiration in the atacama trench region: Implications for particulate organic carbon flux into the hadal realm. Limnol. Oceanogr. 66, 3134–3148. doi: 10.1002/lno.11866
Frederick L., Escribano R., Morales C. E., Hormazabal S., Medellín-Mora J. (2018). Mesozooplankton respiration and community structure in a seamount region of the eastern south pacific. Deep-Sea Res. I. 135, 74–87. doi: 10.1016/j.dsr.2018.03.008
Glud R. N., Berg P., Thamdrup B., Larsen M., Stewart H. A., Jamieson A. J., et al. (2021). Hadal trenches are dynamic hotspots for early diagenesis in the deep sea. Commun. Earth Environm. 2 (21), 1–8. doi: 10.1038/s43247-020-00087-2
González C. E., Bode A., Fernández-Urruzola I., Hidalgo P., Oerder V., Escribano R. (2023). The lateral transport of zooplankton explains trophic and taxonomic similarities over the zonal gradient of central Chile. J. Mar. Syst. 238, 103840. doi: 10.1016/j.jmarsys.2022.103840
González C. E., Escribano R., Bode A., Schneider W. (2018). Zooplankton taxonomic and trophic community structure across biogeochemical regions in the Eastern south pacific. Front. Mar. Sci. 5, 1–13.
González C. E., Medellín-Mora J., Escribano R. (2020). Environmental gradients and spatial patterns of calanoid copepods in the southeast pacific. Front. Ecol. Evol. 8. doi: 10.3389/fevo.2020.554409
González H., Sobarzo M., Figueroa D., Nöthig E. (2000). Composition, biomass and potential grazing impact of the crustacean and pelagic tunicates in the northern Humboldt current area off chile:differences between El niño and non-El niño years. Mar. Ecol. Progr. Ser. 195, 201–220. doi: 10.3354/meps195201
Gorsky G., Ohman M. D., Picheral M., Gasparini S., Stemmann L., Romagnan J.-B., et al. (2010). Digital zooplankton image analysis using the ZooScan integrated system. J. Plank. Res. 32, 285–303. doi: 10.1093/plankt/fbp124
Gutiérrez-Rodríguez A., Décima M., Popp B. N., Landry M. R. (2014). Isotopic invisibility of protozoan trophic steps in marine food webs. Limnol. Oceanogr. 59, 1590–1598. doi: 10.4319/lo.2014.59.5.1590
Hannides C. C. S., Popp B. N., Close H. G., Benitez-Nelson C. R., Ka’apu-Lyons C. A., Gloeckler K., et al. (2020). Seasonal dynamics of midwater zooplankton and relation to particle cycling in the north pacific subtropical gyre. Prog. Oceanography. 182, 102266. doi: 10.1016/j.pocean.2020.102266
Hannides C. C. S., Popp B. N., Landry M. R., Graham B. S. (2009). Quantification of zooplankton trophic position in the north pacific subtropical gyre using stable nitrogen isotopes. Limnol. Oceanogr. 54, 50–61. doi: 10.4319/lo.2009.54.1.0050
Hansen H. P., Koroleff F. (1999). Determination of nutrients. In Methods of seawater analysis (third edition) Eds Grasshold K., Kremling K., Ehrhardt M. (Wiley-VCH Verlag GmbH), 193–262. doi: 10.1002/9783527613984.ch10
Hofmann D., Gehre M., Jung K.. (2003). Sample preparation techniques for the determination of natural 15N/14N variations in amino acids by gas chromatography-combustion-isotope ratio mass spectrometry (GC-C-IRMS). Isotopes Environ. Health Stud. 39 (3), 233–244. doi: 10.1080/1025601031000147630
Hunt B., Allain V., Menkes C., Lorrain A., Graham B., Rodier M., et al. (2015). A coupled stable isotope-size spectrum approach to understanding pelagic food-web dynamics: A case study from the southwest sub-tropical pacific. Deep-Sea Res. II.: Top. Stud. Oceagogr. 113, 208–224. doi: 10.1016/j.dsr2.2014.10.023
Ishikawa N. F. (2018). Use of compound-specific nitrogen isotope analysis of amino acids in trophic ecology: assumptions, applications, and implications. Ecol. Res. 33, 825–837. doi: 10.1007/s11284-018-1616-y
Josse J., Husson F. (2016). missMDA: A package for handling missing values in multivariate data analysis. J. Stat. Soft. 70, 1–31. doi: 10.18637/jss.v070.i01
Kimura S. (2000). Determination of ammonia in seawater using a vaporization membrane permeability method. 7th. auto. Analyzer. Study. Group, 39–41.
Kitamura M., Tanaka Y., Ishimaru T., Mine Y., Noda A., Hamada H. (2001). Sagami bay research report: improvement of multiple opening/closing net, IONESS (intelligent operative net sampling system). J. Tokyo. Univ. Fish. 10, 149–158.
Knapp A. N., Casciotti K. L., Berelson W. M., Prokopenko M. G., Capone D. G. (2016). Low rates of nitrogen fixation in eastern tropical south pacific surface waters. Proc. Nat. Ac. Sci. 113, 4398–4403. doi: 10.1073/pnas.1515641113
Loick-Wilde N., Fernández-Urruzola I., Eglite E., Liskow I., Nausch M., Schulz-Bull D., et al. (2019). Stratification, nitrogen fixation, and cyanobacterial bloom stage regulate the planktonic food web structure. Global Change Biol. 25, 794–810. doi: 10.1111/gcb.14546
Massing J. C., Schukat A., Auel H., Auch D., Kittu L., Arteaga E. L. P., et al. (2022). Toward a solution of the “Peruvian puzzle”: Pelagic food-web structure and trophic interactions in the northern Humboldt current upwelling system off Peru. Front. Mar. Sci. 8. doi: 10.3389/fmars.2021.759603
Mayor D. J., Sanders R., Giering S. L. C., Anderson T. R. (2014). Microbial gardening in the ocean’s twilight zone: Detritivorous metazoans benefit from fragmenting, rather than ingesting, sinking detritus. BioEssays 36, 1132–1137. doi: 10.1002/bies.201400100
McCarthy M. D., Benner R., Lee C., Fogel M. L. (2007). Amino acid nitrogen isotopic fractionation patterns as indicators of heterotrophy in plankton, particulate, and dissolved organic matter. Geochim. Cosmochim. Acta 71, 4727–4744. doi: 10.1016/j.gca.2007.06.061
McClelland J. W., Holl C. M., Montoya J. P. (2003). Relating low δ15N values of zooplankton to N2-fixation in the tropical north Atlantic: insights provided by stable isotope ratios of amino acids. Deep-Sea Res. I.: Oceanogr. Res. Papers. 50, 849–861. doi: 10.1016/s0967-0637(03)00073-6
McMahon K. W., McCarthy M. D. (2016). Embracing variability in amino acid δ15N fractionation: mechanisms, implications, and applications for trophic ecology. Ecosphere 7, e01511–e01526. doi: 10.1002/ecs2.1511
Medellín-Mora J., Escribano R., Corredor-Acosta A., Hidalgo P., Schneider W. (2021). Uncovering the composition and diversity of pelagic copepods in the oligotrophic blue water of the south pacific subtropical gyre. Front. Mar. Sci. 8. doi: 10.3389/fmars.2021.625842
Mitra A., Flynn K. J., Burkholder J. M., Berge T., Calbet A., Raven J. A., et al. (2014). The role of mixotrophic protists in the biological carbon pump. Biogeosciences 11, 995–1005. doi: 10.5194/bg-11-995-2014
Mompeán C., Bode A., Gier E., McCarthy M. D. (2016). Bulk vs. amino acid stable n isotope estimations of metabolic status and contributions of nitrogen fixation to size-fractionated zooplankton biomass in the subtropical n Atlantic. Deep-Sea Res. I.: Oceanogr. Res. Papers. 114, 137–148. doi: 10.1016/j.dsr.2016.05.005
Montégut C., Madec G., Fischer A. S., Lazar A., Iudicone D. (2004). Mixed layer depth over the global ocean: An examination of profile data and a profile-based climatology. J. Geophys. Res.: Oceans 109 (C12), 1–20. doi: 10.1029/2004jc002378
Montoya J. P. (2007). Natural abundance of 15N in marine planktonic ecosystems (Blackwell publishing Ltd), stable isotopes in ecology and environmental science (second edition). Eds: Michener R., Lajtha K.. 176–201. doi: 10.1002/9780470691854.ch7
Montoya J. P., Carpenter E. J., Capone D. G. (2002). Nitrogen fixation and nitrogen isotope abundances in zooplankton of the oligotrophic north Atlantic. Limnol. Oceanogr. 47, 1617–1628. doi: 10.4319/lo.2002.47.6.1617
Mulholland M. R., Lomas M. W. (2008). “Nitrogen uptake and assimilation,” in Nitrogen in the marine environment, 2nd ed. Eds. Capone D. G., Bronk D. A., Mulholland M. R., Carpenter E. J. (San Diego: Academic Press), 303–384. doi: 10.1016/B978-0-12-372522-6.00007-4
Oksanen J., Simpson G. L., Blanchet G. F., Kindt R., Legendre P., Michin P. R., et al. (2022). Vegan: Community ecology package. r package version 2. 6–4.
Pantoja S. (2006). Biogeochemistry of the OMZ of Chile. Gayana 70, 62–67. doi: 10.4067/S0717-65382006000300013
Peters B. D., Jenkins W. J., Swift J. H., German C. R., Moffett J. W., Cutter G. A., et al. (2018). Water mass analysis of the 2013 US GEOTRACES eastern pacific zonal transect (GP16). Mar. Chem. 201, 6–19. doi: 10.1016/j.marchem.2017.09.007
Post D. M. (2002). Using stable isotopes to estimate trophic position: Models, methods, and assumptions. Ecology 83, 703–718. doi: 10.1890/0012-9658(2002)083[0703:USITET]2.0.CO;2
Proud R., Cox M. J., Brierley A. S. (2017). Biogeography of the global ocean’s mesopelagic zone. Curr. Biol. 27, 113–119. doi: 10.1016/j.cub.2016.11.003
Purcell J. E., Madin L. P. (1991). Diel patterns of migration, feeding, and spawning by salps in the subarctic pacific. Mar. Ecol. Progr. Ser. 73, 211–217. doi: 10.3354/meps073211
Raimbault P., Garcia N. (2008). Evidence for efficient regenerated production and dinitrogen fixation in nitrogen-deficient waters of the south pacific ocean: impact on new and export production estimates. Biogeosciences 5, 323–338. doi: 10.5194/bg-5-323-2008
Riquelme-Bugueño R., Correa-Ramírez M., Escribano R., Núñez S., Hormazábal S. (2015). Mesoscale variability in the habitat of the Humboldt current krill, spring 2007. J. Geophys. Res. Oceans. 120, 2769–2783. doi: 10.1002/2014jc010460
Rubin D. B. (1987). “Multiple imputation for nonresponse in surveys,” in Wiley Series in Probability and Statistics (New York, USA: John Wiley & Sons).
Schukat A., Auel H., Teuber L., Lahajnar N., Hagen W. (2014). Complex trophic interactions of calanoid copepods in the benguela upwelling system. J. Sea. Res. 85, 186–196. doi: 10.1016/j.seares.2013.04.018
Shen S. G., Thomson A. R., Correa J., Fietzek P., Ayón P., Checkley J. D.M. (2017). Spatial patterns of anchoveta (Engraulis ringens) eggs and larvae in relation to pCO2 in the Peruvian upwelling system. Proc. R. Soc B. 284, 20170509. doi: 10.1098/rspb.2017.0509
Siegel D. A., Buesseler K. O., Doney S. C., Sailley S. F., Behrenfeld M. J., Boyd P. W. (2014). Global assessment of ocean carbon export by combining satellite observations and food-web models. Global Biogeochem. Cy. 28, 181–196. doi: 10.1002/2013GB004743
Silva N., Rojas N., Fedele A. (2009). Water masses in the Humboldt current system: Properties, distribution, and the nitrate deficit as a chemical water mass tracer for equatorial subsurface water off Chile. Deep-Sea Res. II.: Top. Stud. Oceanogr. 56, 1004–1020.
Soto-Mendoza S., Parada C., Castro L., Colas F., Schneider W. (2012). Modeling transport and survival of anchoveta eggs and yolk–sac larvae in the coastal zone off central-southern Chile: Assessing spatial and temporal spawning parameters. Progr. Oceanogr. 92, 178–191. doi: 10.1016/j.pocean.2011.07.001
Steele J. H. (1974). The structure of marine ecosystems (Cambridge, Massachusetts: Harvard University Press).
Steinberg D. K., Landry M. R. (2017). Zooplankton and the ocean carbon cycle. Annu. Rev. Mar. Sci. 9, 413–444. doi: 10.1146/annurev-marine-010814-015924
Strub T. P., Mesías J. M., Montecino V., Rutllant J., Salinas S. (1998). “Coastal ocean circulation off western south America,” in The Sea Eds: Robinson A. R., Brink K. H. (John Wiley & Sons, Inc) 11, 273–313.
Tutasi P., Escribano R. (2020). Zooplankton diel vertical migration and downward c flux into the oxygen minimum zone in the highly productive upwelling region off northern Chile. Biogeosciences 17, 455–473. doi: 10.5194/bg-17-455-2020
van Buuren S., Groothuis-Oudshoorn K. (2011). Mice: Multivariate imputation by chained equations in r. J. Stat. Soft. 45, 1–. doi: 10.18637/jss.v045.i03
Vargas C. A., Martínez R. A., Cuevas L. A., Pavez M. A., Cartes C., GonzÁlez H. E., et al. (2007). The relative importance of microbial and classical food webs in a highly productive coastal upwelling area. Limnol. Oceanogr. 52, 1495–1510. doi: 10.4319/lo.2007.52.4.1495
Vinogradov M. E., Shushkina E. A. (1978). Some development patterns of plankton communities in the upwelling areas of the pacific ocean Mar. Biol 48, 357–366.
Wang Y., Zhang H.-R., Chai F., Yuan Y. (2018). Impact of mesoscale eddies on chlorophyll variability off the coast of Chile. PloS One 13, e0203598. doi: 10.1371/journal.pone.0203598
Weber S. C., Loick-Wilde N., Montoya J. P., Bach M., Doan-Nhu H., Subramaniam A., et al. (2021). Environmental regulation of the nitrogen supply, mean trophic position, and trophic enrichment of mesozooplankton in the Mekong river plume and southern south China Sea. J. Geophys. Res. Oceans. 126 (8), 1–19. doi: 10.1029/2020jc017110
Welschmeyer N. A. (1994). Fluorometric analysis of chlorophyll-a in the presence of chlorophyll be and pheopigments. Limnol. Oceanogr. 39, 1985–1992. doi: 10.4319/lo.1994.39.8.1985
Keywords: zooplankton, trophodynamics, stable isotopes, amino acids, food web, diazotrophy
Citation: Fernández-Urruzola I, Bode A, Loick-Wilde N, Schneider W, Lindsay D and Escribano R (2023) Trophic ecology of midwater zooplankton along a productivity gradient in the Southeast Pacific. Front. Mar. Sci. 10:1057502. doi: 10.3389/fmars.2023.1057502
Received: 29 September 2022; Accepted: 13 January 2023;
Published: 15 February 2023.
Edited by:
Xosé Anxelu G. Morán, Spanish Institute of Oceanography, SpainReviewed by:
Carmen García-Comas, Institute of Marine Sciences (CSIC), SpainAngus Atkinson, Plymouth Marine Laboratory, United Kingdom
Copyright © 2023 Fernández-Urruzola, Bode, Loick-Wilde, Schneider, Lindsay and Escribano. This is an open-access article distributed under the terms of the Creative Commons Attribution License (CC BY). The use, distribution or reproduction in other forums is permitted, provided the original author(s) and the copyright owner(s) are credited and that the original publication in this journal is cited, in accordance with accepted academic practice. No use, distribution or reproduction is permitted which does not comply with these terms.
*Correspondence: Igor Fernández-Urruzola, aWdvci5mZXJuYW5kZXpAaW1vLWNoaWxlLmNs