
95% of researchers rate our articles as excellent or good
Learn more about the work of our research integrity team to safeguard the quality of each article we publish.
Find out more
ORIGINAL RESEARCH article
Front. Mar. Sci. , 24 January 2023
Sec. Physical Oceanography
Volume 10 - 2023 | https://doi.org/10.3389/fmars.2023.1054669
 Junying Zhu1,2
 Quanyi Zhou1Qianqing Zhou1
 Xinxing Geng1
 Jie Shi3,4*Xinyu Guo5
 Yang Yu6*Ziwei Yang1Renfu Fan7
Coastal upwelling around Hainan Island has a significant impact on the physical environment, ecological environment, and fishery resources of the surrounding waters. Based on the satellite-observed sea surface temperature (SST) from 2003 to 2021, this study analyzed the interannual variations of SST around Hainan Island and the influence of the sea surface forcing on them, with special attention to the upwelling regions in Qiongdong and Qiongxi. The results show that satellite-observed SST can identify three upwelling regions located in the west (WS), east (ES), and northeast (NES) sides of the Hainan Island. The SSTs in the WS, ES, and NES showed warming trends of 0.045 °C/y, 0.010 °C/y, and 0.036 °C/y, respectively. The range of low-temperature water around Hainan Island has gradually shrunk over the past two decades, and this shrinkage trend was more prominent in the WS upwelling region than in the ES and NES upwelling regions. Both the EOF analysis and the SST difference between upwelling regions and non-upwelling regions suggests that the upwelling becomes stronger after 2013. However, it seems not to compete with the overall SST warming in the northwest area of the South China Sea. The interannual SST variations in the ES upwelling region were affected by the local wind stress curl in summer. Except for the wind stress curl, the interannual SST variations in NES upwelling are influenced by the stratification associated with local precipitation and wind direction, especially in 2018. In addition, the interannual SST variation in the WS upwelling region is closely related to the bottom cold water in the central Gulf of Tonkin, which was preserved from the previous winter and is influenced by winter atmospheric conditions. These results are helpful for understanding the variations in SST and ecosystem in the upwelling regions around Hainan Island.
Upwelling refers to the phenomenon in which lower or subsurface seawater flows upward into the surface or near-surface layers. It is widespread in global oceans (Di Lorenzo, 2015; Hu and Wang, 2016). As an important part of offshore ocean circulation and material transport, coastal upwelling has considerable impacts on the physical and biogeochemical environment, climatic characteristics, ecosystems, and global carbon cycle (Bakun, 1990; Deng et al., 1995; Xie et al., 2003; Largier, 2020; Wang et al., 2020; Stukel and Barbeau, 2020; Lu et al., 2021). With climate change, the interannual variation and trend of coastal upwelling have become a research hotspot in recent years (Wang et al., 2015a; Shu et al., 2018; Xiu et al., 2018; Yang et al., 2020; Sousa et al., 2020).
Hainan Island is located on the northern shelf of the South China Sea (Figure 1A). To the east of Hainan Island, a broad continental shelf of the South China Sea is present with a depth less than 200 m and isobaths approximately parallel to the coastline. To the west, there is a semi-enclosed bay with an average depth of 42 m, Gulf of Tonkin, adjacent to the central basin of the South China Sea. To the north, Qiongzhou Strait, a narrow and deep channel, separates the island from the Chinese mainland (Figure 1A). Upwelling occurs almost every summer in the eastern and western coastal waters of Hainan Island and is referred to as Qiongdong upwelling (east coast of Hainan Island) and Qiongxi upwelling (west coast of Hainan Island), respectively (Lü et al., 2008; Xie et al., 2012; Wang et al., 2015b; Wang et al., 2016; Bai et al., 2020). Compared to the Qiongxi upwelling, the Qiongdong upwelling was known earlier (Guan and Chen, 1964) and has been in the spotlight (Jing et al., 2011; Jing et al., 2015; Hu and Wang, 2016). The Qiongdong upwelling includes two parts on the east and northeast sides of Hainan Island (Lin et al., 2016b, Figure 1B). It occurs from April to September, becomes strongest in summer, and is mainly driven by the summer southwest monsoon (Xie et al., 2012). The prevailing southwesterly wind in summer causes Ekman transport away from the coast of Hainan Island (Figure 1C). Meanwhile, the Ekman suction induced by the positive wind stress curl also causes upward replenishment of deep water and forms upwelling (Jing et al., 2009; Xu et al., 2013; Lin et al., 2016a; Lin et al., 2016b). In addition to the wind stress, the spatiotemporal distribution of the Qiongdong upwelling is adjusted by other factors, such as topography, rivers, and tides (Su and Pohlmann, 2009; Wang et al., 2015b).
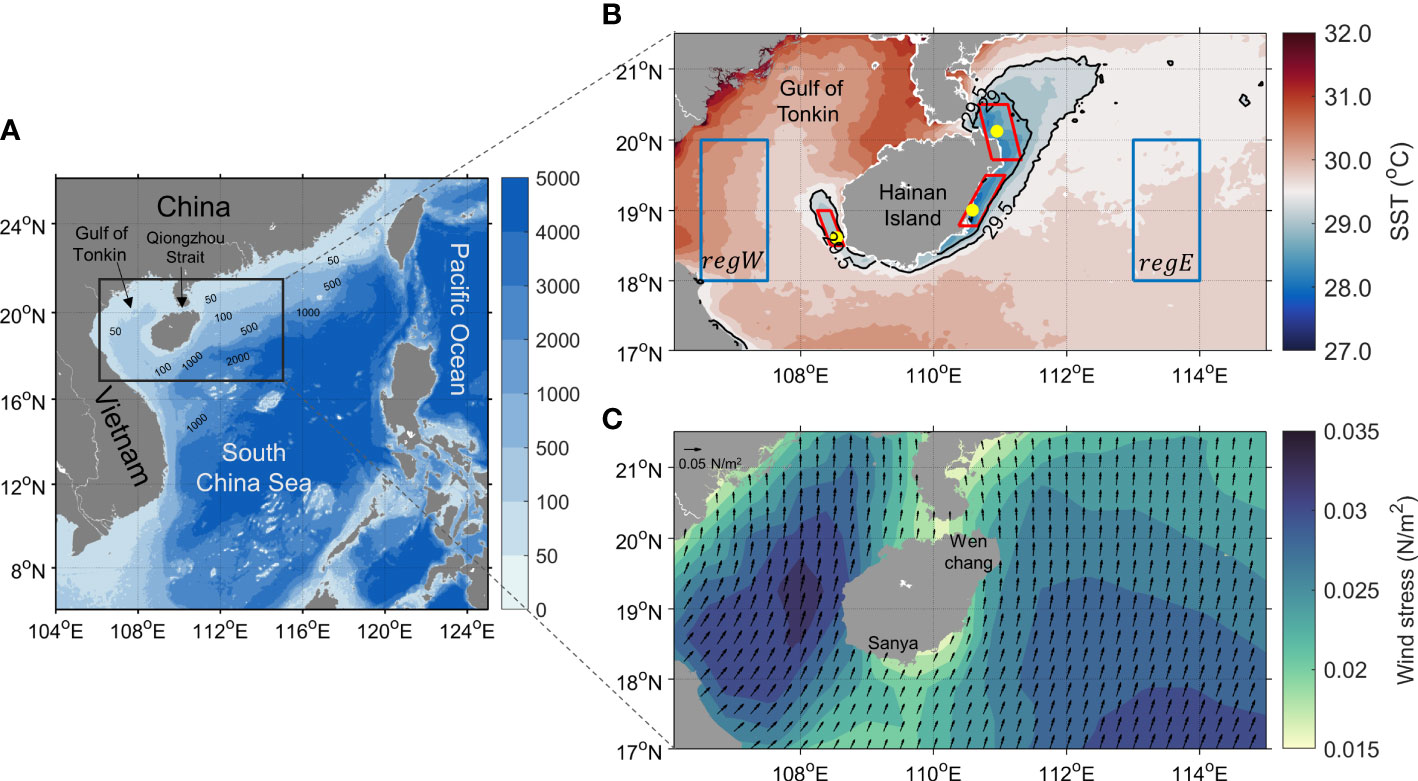
Figure 1 Location and topography (m) of study area (A). The spatial distribution of multi-year (2003-2021) mean summer sea surface temperature (B) and wind stress (C). Yellow solid circles indicate the locations of the three upwelling cores, the red boxes represent three upwelling regions, and blue rectangles represent the surrounding non-upwelling sea regions in (B) where regE represents 18-20°N, 113-114°E and regW represents 18-20°N, 106.5-107.5°E.
In contrast to the Qiongdong upwelling, the Qiongxi upwelling was mainly induced by tides (Li et al., 2018). Hainan Island is adjacent to Gulf of Tonkin to the west. On one hand, stratification forms over the central Gulf of Tonkin with an increase in air-sea heat flux in spring and summer. The water retained from the previous winter forms a bottom cold water mass below the thermocline (Chen et al., 2015; Gao et al., 2017). On the other hand, the water column is well mixed due to strong tidal mixing over the coastal area on the western side of Hainan Island. A tidal front forms between the mixing areas on the west side of Hainan Island and the stratification area in the central Gulf of Tonkin region. Qiongxi upwelling has been reported to form because of the difference in the pressure gradient on both sides of the tidal front (Lü et al., 2008; Bai et al., 2019; Bai et al., 2020).
With climate change, the sea surface temperature (SST) over the global continental shelf has gradually increased (Park et al., 2015; Chen et al., 2020). Climate change can affect the coastal upwelling systems around Hainan Island (Huynh et al., 2016; Liu et al., 2020). Previous studies have shown that the intensity of Qiongdong upwelling has gradually weakened in recent decades (Su et al., 2013). In addition, the upwelling along the coast of Hainan Island shows evident interannual changes. Jing et al. (2011) pointed out that the Qiongdong upwelling was enhanced considerably during the El Niño event in the summer of 1998. By conducting numerical simulation, Li et al. (2012) found that the interannual variation in upwelling on the east coast of Hainan Island from 2000 to 2007 was related to the South China Sea monsoon index. Xie et al. (2016) pointed out that the changes in Qiongdong upwelling from 1982 to 2012 were related to the local wind stress curl.
Although we are knowledgeable to some extent about the interannual variation of the Qiongdong upwelling and its influencing factors, we still need to update our understanding of it using recently observed data. In addition, the difference between the Qiongdong and Qiongxi upwellings remains unclear. For these reasons, this study focuses on both the Qiongdong and Qiongxi upwellings. Based on an 18-year satellite observed SST and reanalysis wind field from 2003 to 2021, this study analyzed the interannual variations and long-term trends of the Qiongdong and Qiongxi upwellings, compared their differences, and explored their influencing factors. These findings could be of great importance for understanding and predicting the water temperature in upwelling regions around Hainan Island.
In this study, we used the monthly average SST measured by MODIS-Aqua (https://oceandata.sci.gsfc.nasa.gov/directaccess/MODIS-Aqua/Mapped/Monthly/4km/sst/) from 2003–2021 with a spatial resolution of 4 km. Low-quality data were eliminated according to the quality control policy of the MODIS products (quality levels>0). Meanwhile, due to the apparent distortion of the SST in the shallow water region of the nearshore bay, we also eliminated the SST where the water depth was less than 2 m using the ETOPO1 topography (https://sos.noaa.gov/catalog/datasets/etopo1-topography-and-bathymetry/). The SST data from June to August were averaged to obtain the summer SST data.
Since the SST variation is influenced by atmospheric conditions, the atmospheric reanalysis data is analyzed in this study. The monthly sea surface forcing (including 10 m wind speed, air-sea heat flux and 2 m air temperature) from 2003–2019 were derived from the ERA-interim reanalysis dataset (https://apps.ecmwf.int/datasets/data/interim-full-moda/levtype=sfc/) with a horizontal resolution of 0.125°. Monthly precipitation data were obtained from the Integrated Multi-satellite Retrievals for GPM (IMERG) (https://disc.gsfc.nasa.gov/datasets/GPM_3IMERGM_06/summary), which had a horizontal resolution of 0.1° (Huffman et al., 2019). When exploring the relationships between SST variation and sea surface forcing, the corresponding local forcing are used.
To analyze the influence of the sea surface wind on upwelling, the wind stress and wind stress curl were calculated. The wind stress was calculated using the quadratic law:
where, =τxi+τyj is the wind stress vector, τx and τy are the zonal and meridional wind stresses, respectively. ρa is the air density, is the 10 m wind vector, u and v are the zonal and meridional components of the wind velocity, respectively. Cd is the drag coefficient whose calculation formula is as follows (Yelland and Taylor, 1996; Yelland et al., 1998):
Since Ekman transport is a key dynamic process inducing the Qiongdong upwelling, we also calculated the along-coast wind stress component in the eastern part of Hainan Island (the angle between the coastline and the north direction is approximately 30°).
The wind stress curl is calculated using the wind stress:
Empirical orthogonal function (EOF), also known as eigenvector analysis, is a method for analyzing the structural features in matrix data and extracting the main data features. EOF has been widely used to analyze temporal and spatial variations in atmospheric and oceanic space fields (Dong et al., 2018; Syamsuddin, 2020). In this study, we used the EOF to obtain the main modes of temporal and spatial variations in SST around Hainan Island (18–21.5°N, 108–112°E) and analyze its interannual variation characteristics. Univariate linear regression was used to fit the long SST trend in the upwelling region. Interannual SST anomalies were obtained by subtracting the SST regression values from the corresponding SST observations. The Pearson correlation analysis method was used to calculate the correlation coefficient and its significance level when analyzing the correlation between different factors.
Upwelling along the coast of Hainan Island occurred almost every summer. The average summer SST from 2003–2021 is shown in Figure 1B. The Qiongdong upwelling is located on the east side and northeast side of Hainan Island (18–21°N, 110–112°E). The SST over the Qiongdong upwelling region was 1–2°C lower than the surrounding waters. The southernmost part of the low-temperature region of Qiongdong upwelling reaches the coastal waters of Sanya City and the northernmost part reaches a latitude of 21°N latitude. The Qiongxi upwelling on the west side of Hainan Island has a relatively small area (18–19.5°N, 108–109°E) with a SST of 0.5–1°C lower than the surrounding waters. The Qiongdong upwelling covers a larger area than the Qiongxi upwelling, and the SST over the Qiongdong upwelling region is lower than that over the Qiongxi upwelling region. This indicates that the Qiongdong upwelling was stronger than the Qiongxi upwelling.
The SST in Qiongdong and Qiongxi upwelling regions have evident interannual variations. To explore SST changes in the two upwelling, the region surrounded by the 29.0°C isotherm on the east side of Hainan Island (Aeast) is used to represent the waters affected by the Qiongdong upwelling, and the region surrounded by the 29.5°C isotherm on the west side of Hainan Island (Awest) represents the waters influenced by Qiongxi upwelling (Figure 1B). The two areas (Aeast and Awest) and the mean temperature within the marked areas ( and ) were calculated to characterize surface low-temperature water.
Figure 2 shows the interannual variations and long-term trends of SSTs in Qiongdong and Qiongxi upwelling regions during 2003–2021. This shows that both the mean temperature and area affected by upwelling showed evident interannual variations. For the Qiongxi upwelling, the showed a significant increasing trend of 0.012°C/year (p< 0.01) and the Awest showed a significant decreasing trend of -428 km²/year (p< 0.05) (Figure 2B). The interannual changes in and Awest were significantly correlated (r = -0.80, p< 0.01). As for the Qiongdong upwelling, the showed an increasing trend of 0.0047 °C/year (p = 0.30) and the Aeast showed a decreasing trend of -401 km²/year (p = 0.28) (Figure 2A), although the trend was not significant. In addition, the interannual variation in and Aeast showed a correlation coefficient of -0.74 (p< 0.01). Therefore, the SSTs in both the Qiongdong and Qiongxi upwelling regions exhibit warming trends, and the tendency is more pronounced in the Qiongxi upwelling region than in the Qiongdong upwelling region, as SST trend in Qiongxi upwelling region is higher than that in Qiongdong upwelling region. Meanwhile, the areas of the surface low-temperature regions exhibit decreasing trends.
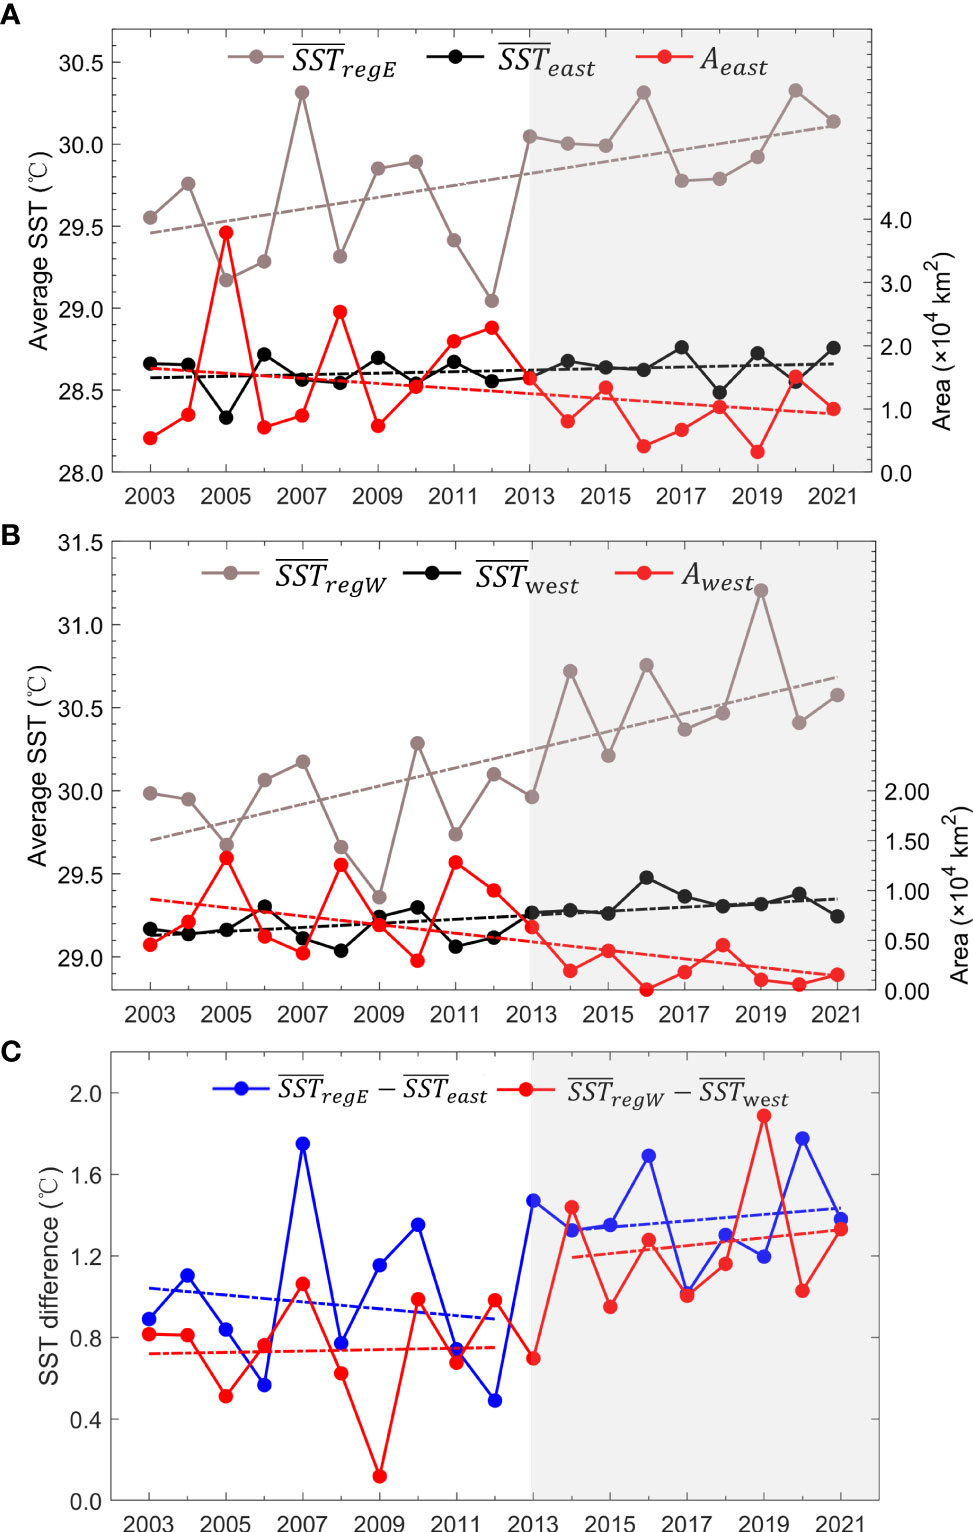
Figure 2 The interannual variations and long-term trends of the mean sea surface temperature ( ) and area (Aeast) in the east upwelling sea region of Hainan Island surrounded by 29.0 °C isotherm and mean sea surface temperature () in the east non-upwelling region (A);the same indices (, Awest) in the west upwelling sea region of Hainan Island surrounded by 29.5 °C isotherm and mean sea surface temperature () in the west non-upwelling region (B); the SST difference between upwelling regions and surrounding non-upwelling regions (C) from 2003 to 2021.
Correlation analysis was conducted to compare the SST in Qiongdong and Qiongxi upwelling regions. It was found that the Aeast and Awest were large and fluctuated significantly before 2013, whereas they were small and relatively stable after 2013 (Figure 2). The interannual changes in Aeast and Awest were significantly correlated (r = 0.80, p< 0.01). However, there was no correlation between the interannual changes in and (r = 0.22, p = 0.36).
For non-upwelling sea regions, we calculated the average SST in surrounding sea region E () and region W () which were remarked in Figure 1B. Results show that and have increasing trends of 0.036°C/year (p< 0.05) and 0.055°C/year (p< 0.01), respectively. It suggests that the SST warming trend in the upwelling regions is smaller than that in the surrounding sea region (Figures 2A, B).
As shown in Figure 1B, the Qiongdong upwelling has a large range and can be further divided into two parts (east and the northeast) by a boundary at a latitude of 19.64°N around Wenchang City. In this subsection, we used the lowest SST in the upwelling region to identify the upwelling core. The location and water temperature of the upwelling cores on the east (ES), northeast (NES), and west (WS) sides of Hainan Island were calculated (Figure 1B and Figure 3). The locations of the three cores were relatively stable. The ES upwelling core was at 19.01°N, 110.58°E; the NES upwelling core was at 20.12°N, 110.95°E; and the WS upwelling core was at 18.62°N, 108.54°E.
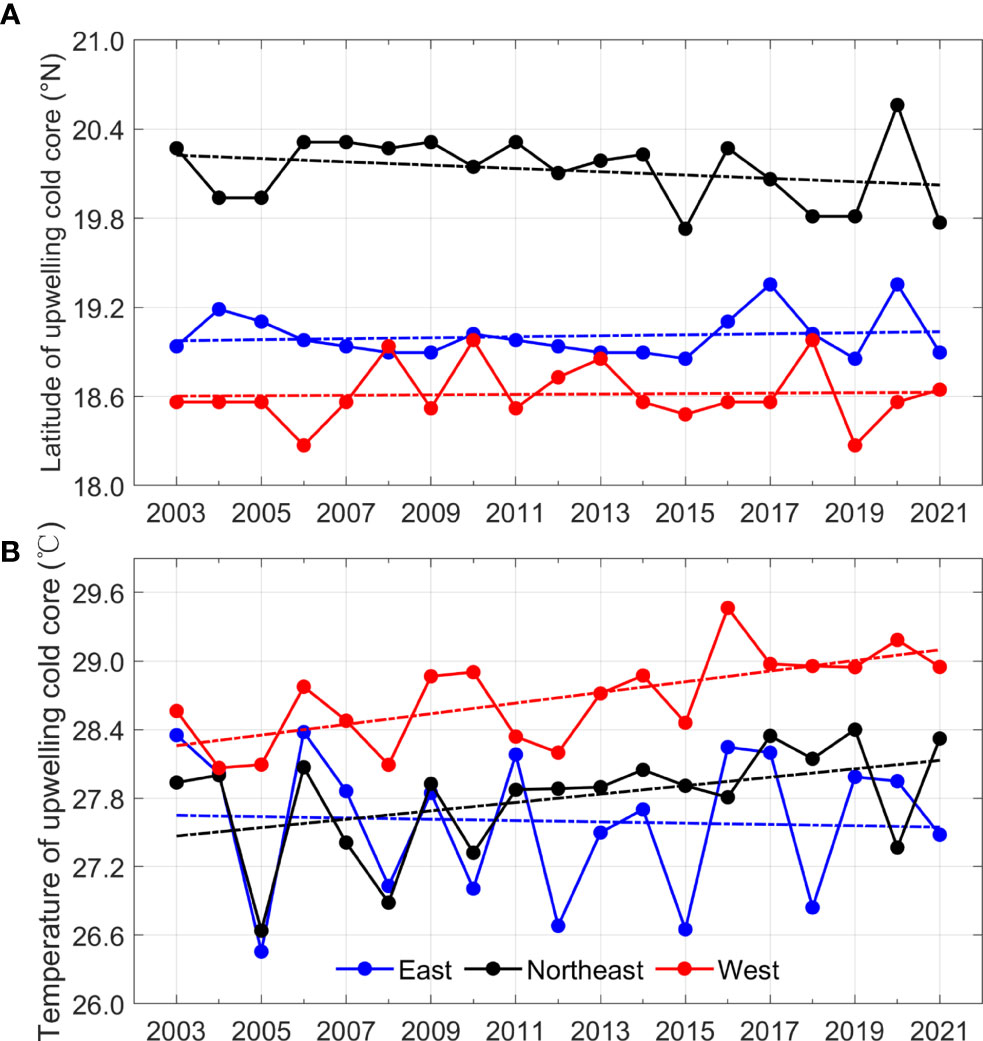
Figure 3 Interannual variations of the latitude (A) and water temperature (B) of the upwelling cold core on the east, northeast and west sides of Hainan Island. The dashed line represents the linear trend of each variable.
As for the long-term trend, the latitudes of the ES and WS upwelling cores fluctuated slightly. However, the core of the NES upwelling tended to move south (Figure 3A). Figure 3B shows the interannual variation in water temperature of the WS, ES, and NES upwelling cores. The mean temperature of the WS upwelling core was 28.68 °C with a warming trend of 0.047 °C/year (p< 0.01). However, for the Qiongdong upwelling, the mean temperature of the NES upwelling core was 27.80°C with a warming trend of 0.035 °C/year (p = 0.06), and the mean water temperature of the ES upwelling core was 27.60°C with no significant long-term trend.
We also selected three main upwelling regions (red boxes in Figure 1B) to study the statistics of interannual SST variation. As shown in Figure 4A, the SSTs in the NES and WS upwellings show significant warming trends of 0.036°C/year (p< 0.05) and 0.045°C/year (p< 0.01), respectively. The mean SST in the ES upwelling showed a warming trend of 0.010°C/year, although this was not significant (p = 0.61). Notably, the SST warming trends of the main upwelling regions were similar to those of the upwelling cores (Figure 3B).
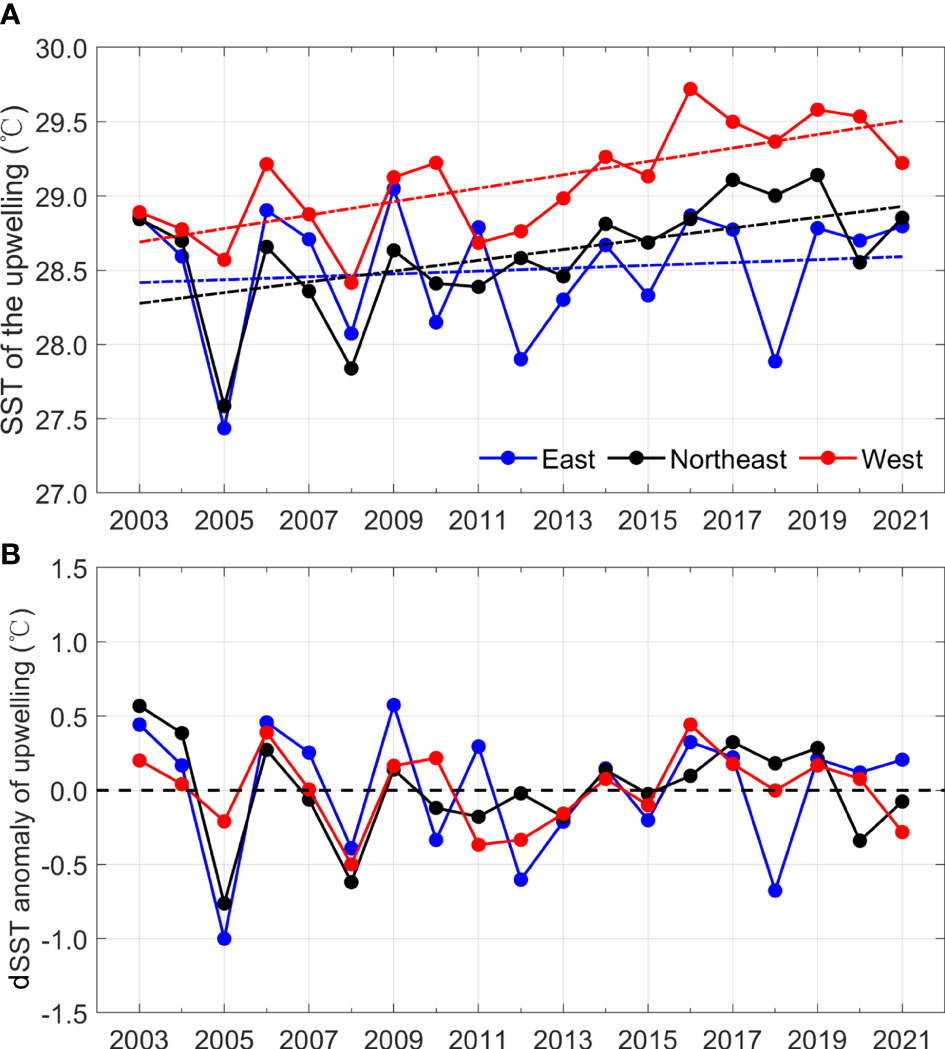
Figure 4 Interannual variations of the mean sea surface temperature (A) and detrended sea surface temperature anomaly (B) in east, northeast, and west upwelling regions.
In addition to the long-term trends, SST has an interannual variation. we calculated the detrended SST anomaly (SST minus its corresponding trend, dSST anomaly) to represent the interannual variation over the ES, NES, and WS upwellings. As shown in Figure 4B, the dSST anomaly in three upwelling regions show evident interannual variation, which has an amplitude of 1.57°C, 1.33°C, and 0.94°C in the ES, NES, and WS upwelling regions, respectively. After removing the warming trend (Figure 4A), the interannual variation in the dSST anomaly around Hainan Island remained consistent. Specifically, the correlation coefficient between the ES and NES upwelling regions is 0.60 (p< 0.01), between the ES and WS upwelling regions is 0.52 (p< 0.05), and between the NES and WS upwelling regions is 0.63 (p< 0.01). Although the dSST anomalies in the three upwelling regions were correlated with each other, the dSST anomalies in the ES and NES upwelling regions still had some differences. The ES upwelling had lower dSST anomalies in 2012 and 2018; however, the same cold anomalies did not appear in the NES upwelling (Figure 4B). The relationship between the ES and NES upwelling regions is further explored in the following section.
To further analyze the temporal and spatial characteristics of the Qiongdong and Qiongxi upwellings, we carried out an EOF analysis to obtain SST’s spatial mode and the associated time series (PC) of SST. Figure 5 shows the spatial distribution and PC values of the first three modes. The variance contribution rates of the first three EOF modes are 52.57% (EOF1), 10.47% (EOF2), and 5.87% (EOF3). Correlation analysis was performed for PC1, PC2, and PC3 with SST and dSST anomalies in the ES, NES, and WS upwelling regions. The results are presented in Table 1.
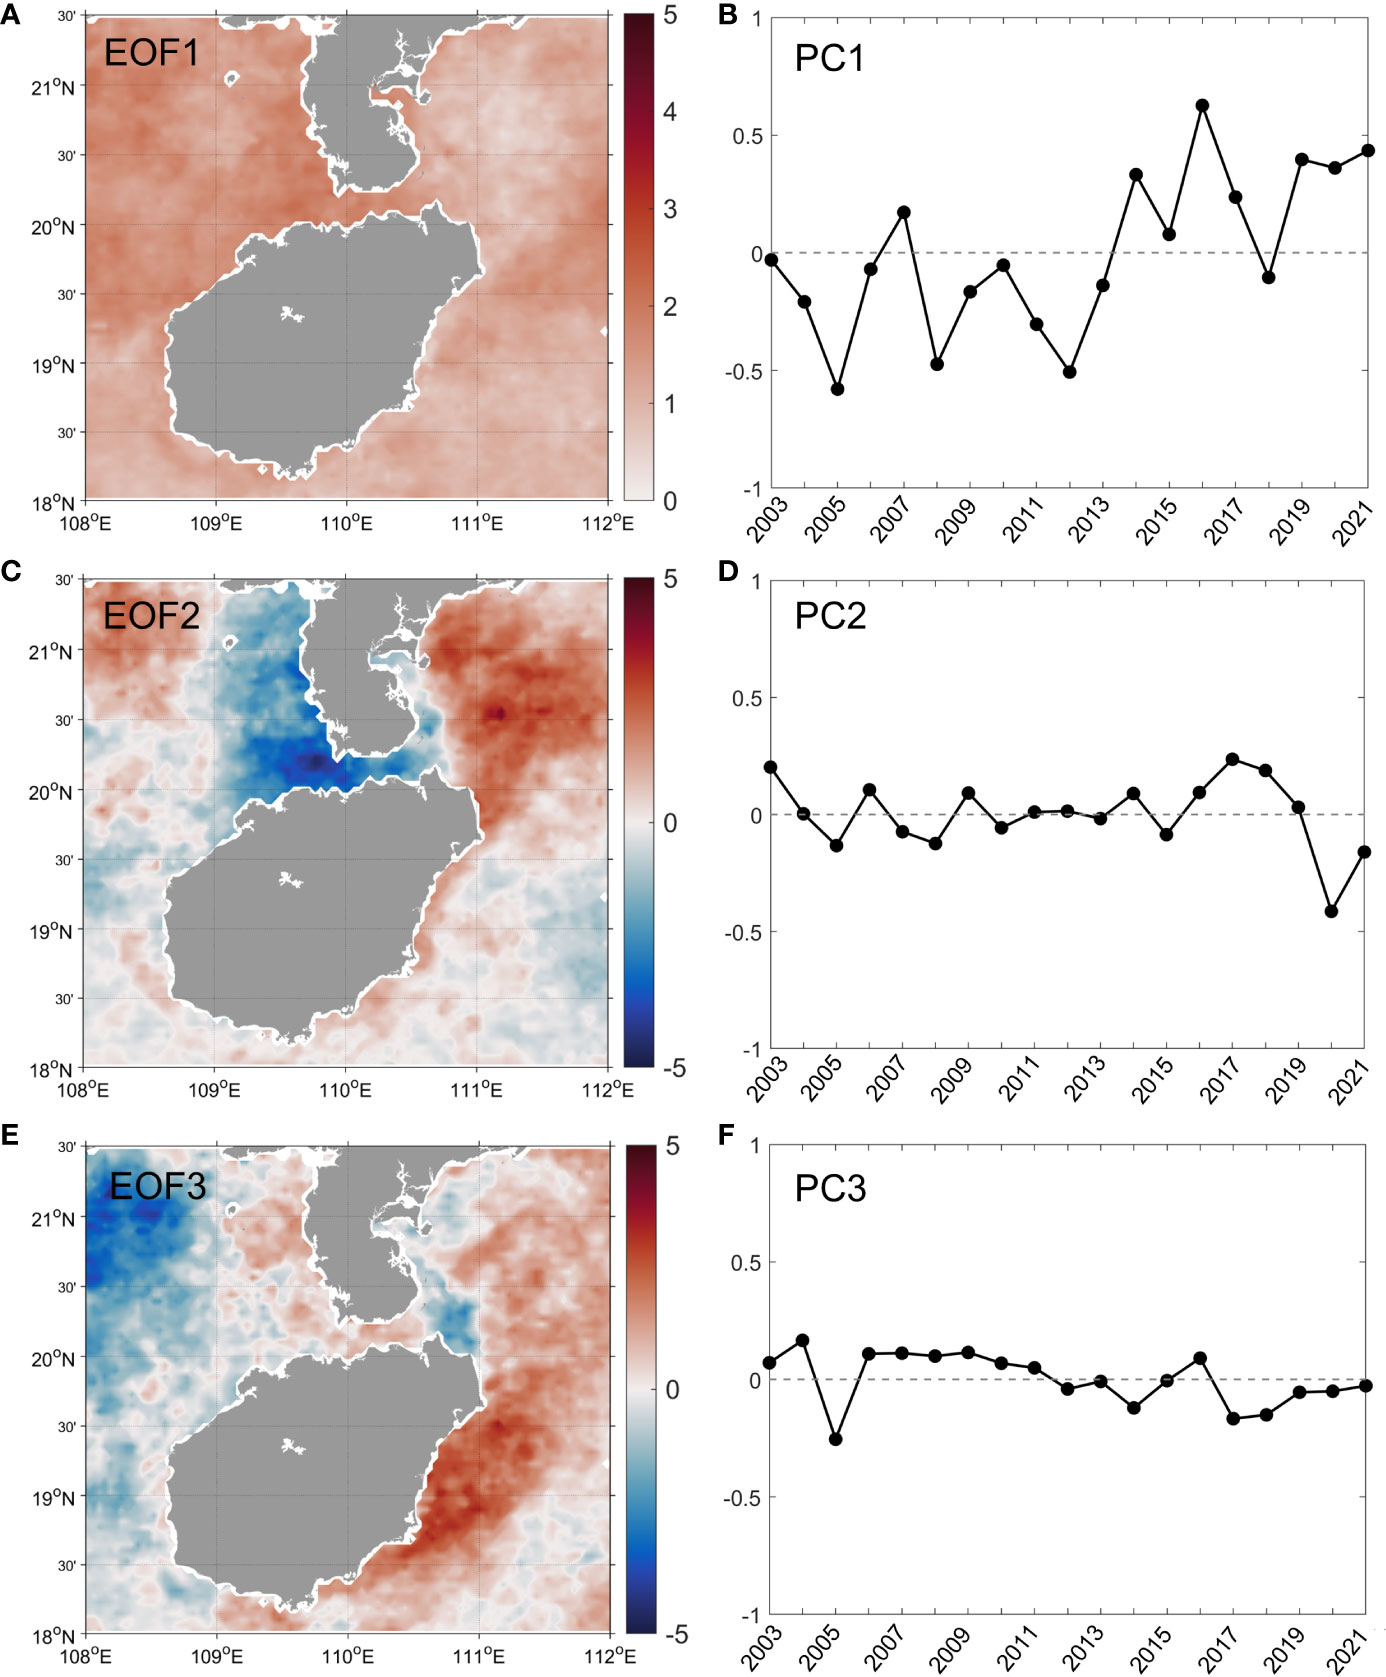
Figure 5 Spatial distribution (A, C, E) and principal component time series (B, D, F) of the first three modes of empirical orthogonal function analysis.

Table 1 Correlation coefficients between SST indicators and the PC values in the first three modes of empirical orthogonal function analysis.
The first EOF mode had a positive SST pattern and exhibited a consistent warming trend (Figures 5A, B). To illustrate the connection with global warming, the global average temperature and SST anomalies (GLBTSSST) index (https://psl.noaa.gov/gcos_wgsp/Timeseries/) provided by NOAA was used. The PC1 and GLBTSSST indices had a correlation coefficient of 0.77 (p< 0.01), indicating that PC1 represents global warming. Meanwhile, PC1 had a significant positive correlation with the interannual SST variation in the ES, NES, and ES upwelling regions (Table 1), which reflects the warming trend of the three upwelling regions (Figures 2, 3B and Figure 4A). The increase in PC1 is consistent with the area reduction of the upwelling regions after 2013 (Figures 2A, B), suggesting that global warming promoted the shrinkage of low-temperature region affected by upwelling around Hainan Island. According to the correlation coefficient between PC1 and the SSTs in the three upwelling regions (Table 1), SST in WS upwelling region has a stronger response (r = 0.85) to global warming than ES upwelling (r = 0.63) and NES upwelling (r = 0.67). These results are consistent with the conclusions of the previous section (Figures 3B and 4A).
The second and third modes show the spatial heterogeneity of the SST. It was positive over the NES upwelling region for the second mode (Figure 5C), while it was positive over the ES upwelling region and part of the NES upwelling region for the third mode (Figure 5E). Correlation analysis showed that PC2 (Figure 5D) was significantly correlated with the interannual variations in SST (r = 0.51, p< 0.05) and dSST anomaly (r = 0.71, p< 0.01) over the NES upwelling region. In contrast, PC3 (Figure 5F) is significantly correlated with the interannual variations of SST and dSST anomaly over the ES upwelling regions with correlation coefficients of 0.50 (p< 0.05) and 0.55 (p< 0.05), respectively. Lin et al. (2016b) suggested three types of upwelling patterns: intensified ES upwelling, intensified NES upwelling, and both the ES and NES upwelling. We found that the intensified NES upwelling pattern was similar to the spatial distribution of EOF2 (Figure 5C); meanwhile, the intensified ES upwelling pattern was similar to that of EOF3 (Figure 5E). For example, the Qiongdong upwelling in 2015, 2020, and 2021 showed a similar spatial distribution to EOF2 with a weaker ES upwelling but a stronger NES upwelling. However, in 2012 and 2018, the Qiongdong upwelling had stronger ES upwelling but weaker NES upwelling, showing a similar spatial distribution to that of EOF3 (not shown). Therefore, we can conclude that the second EOF mode mainly reflected the interannual SST variation in the NES upwelling region, while the third EOF mode mainly reflected that in the ES upwelling region. The independence between EOF2 and EOF3 reveals that different factors influence the interannual SST variations in the ES and NES upwelling regions.
Low SST is always used to identify the occurrence of upwelling. However, it cannot directly reflect the strength of upwelling as it is also influenced by atmospheric condition. From satellite-derived SST, both the SST in the Qiongdong upwelling and Qiongxi upwelling regions show a warming trend during 2003-2021. Under the background of global warming, a warming SST does not mean a weakened upwelling. SSTs in Chinese marginal seas have been widely proved warming (Li et al., 2017; Li et al., 2019; Liu et al., 2020), so is the SST in the northwest area of the South China Sea (Figure 5A). To explore the change trend of upwelling, we compared the SST between upwelling region and surrounding non-upwelling region. As SST warming is evident in both upwelling regions and non-upwelling regions (Figures 2A, B), the temperature difference between and can be used to indicate the change of upwelling strength to some extent. A big temperature difference indicates a strong upwelling. As shown in Figure 2C, the increasing SST difference suggests that both the Qiongdong and Qiongxi upwelling are likely to be strong from 2003 to 2021, especially the period after 2013 when the average SST difference is larger than 1.2 °C for the two upwelling regions.
In addition, the PC values of EOF3 mode have a slight declining trend and the values are almost negative after 2013 (Figure 5C), which means that the ES upwelling enhances and brings more cold water. Xie et al. (2016) found a weakening Qiongdong upwelling using the index of SST temperature between non-upwelling region and upwelling region during 1982-2012. Our results also show a decreasing SST difference and weakening Qiongdong upwelling before 2013 (Figure 2C), which is consistent with their results. However, we found an enhanced trend of the upwelling after 2013 (Figure 2C). Although the upwelling becomes strong, the SST in the upwelling regions become warm and the areas of low-temperature water decrease (Figure 2). It meant that the enhanced upwelling does not seem to compete with the overall SST warming in the northwest area of the South China Sea (Figure 5A). The overall SST warming in the northwest area of the South China Sea is responsible to the warming trend of SST in upwelling regions around Hainan Island. However, enhanced upwelling slows the warming trend of SST in the upwelling regions compared with other sea regions (Figures 2A, B), which is beneficial to the marine ecosystem and fisheries activities.
In addition to the warming trend, SST in upwelling regions also showed evident interannual variations (Figure 4B and Figures 5B, C). Wind is an important factor in inducing coastal upwelling. Previous studies have shown that Ekman transport caused by the southwest monsoon wind and Ekman suction caused by the local wind stress curl are two dynamic mechanisms for the generation of Qiongdong upwelling (Jing et al., 2009). For the Qiongxi upwelling, the convergence caused by the southwesterly wind hinders the formation of upwelling (Wang et al., 2015b). To explore the impact of wind on the interannual variation of upwelling, we calculated the wind stress and wind stress curl in the ES (110–112°E, 18–19.64°N), NES (110–112°E, 19.64–21.50°N), and WS (108–109°E, 18–19.64°N) upwelling regions, as well as the along-coast wind stress in the ES upwelling region (Section 2.1). Correlation analysis showed that the interannual variations in wind stress and along-coast wind stress do not correlate with the dSST anomaly, which indicates that the wind stress itself may not be the main factor affecting the interannual variation in upwelling, which is consistent with the conclusion of Xie et al. (2016).
The time series of wind stress curl in the three upwelling regions is shown in Figure 6. The wind stress curl is positive in the ES and NES upwelling regions in summer, whereas it is negative in the WS upwelling region (except in 2012 and 2018). In terms of Ekman suction, the positive wind stress curl over the ES and NES upwelling regions is beneficial to the generation of upwelling, whereas the negative wind stress curl over the WS upwelling region can inhibit upwelling. Correlation analysis showed that the wind stress curl in the ES upwelling region and PC3 had a significant negative correlation of -0.63 (p< 0.01), which indicates that the wind stress curl can be an important factor for interannual changes in SST over the ES upwelling region and part of the NES upwelling region. Meanwhile, the wind stress curl had a significant negative correlation with the interannual variation in dSST anomalies (r = -0.54, p< 0.05) in the ES upwelling region, indicating that the interannual variation in ES upwelling is closely affected by the wind stress curl. However, the wind stress curls in the NES and WS upwelling regions did not correlate with the interannual SST variation in the corresponding upwelling regions.
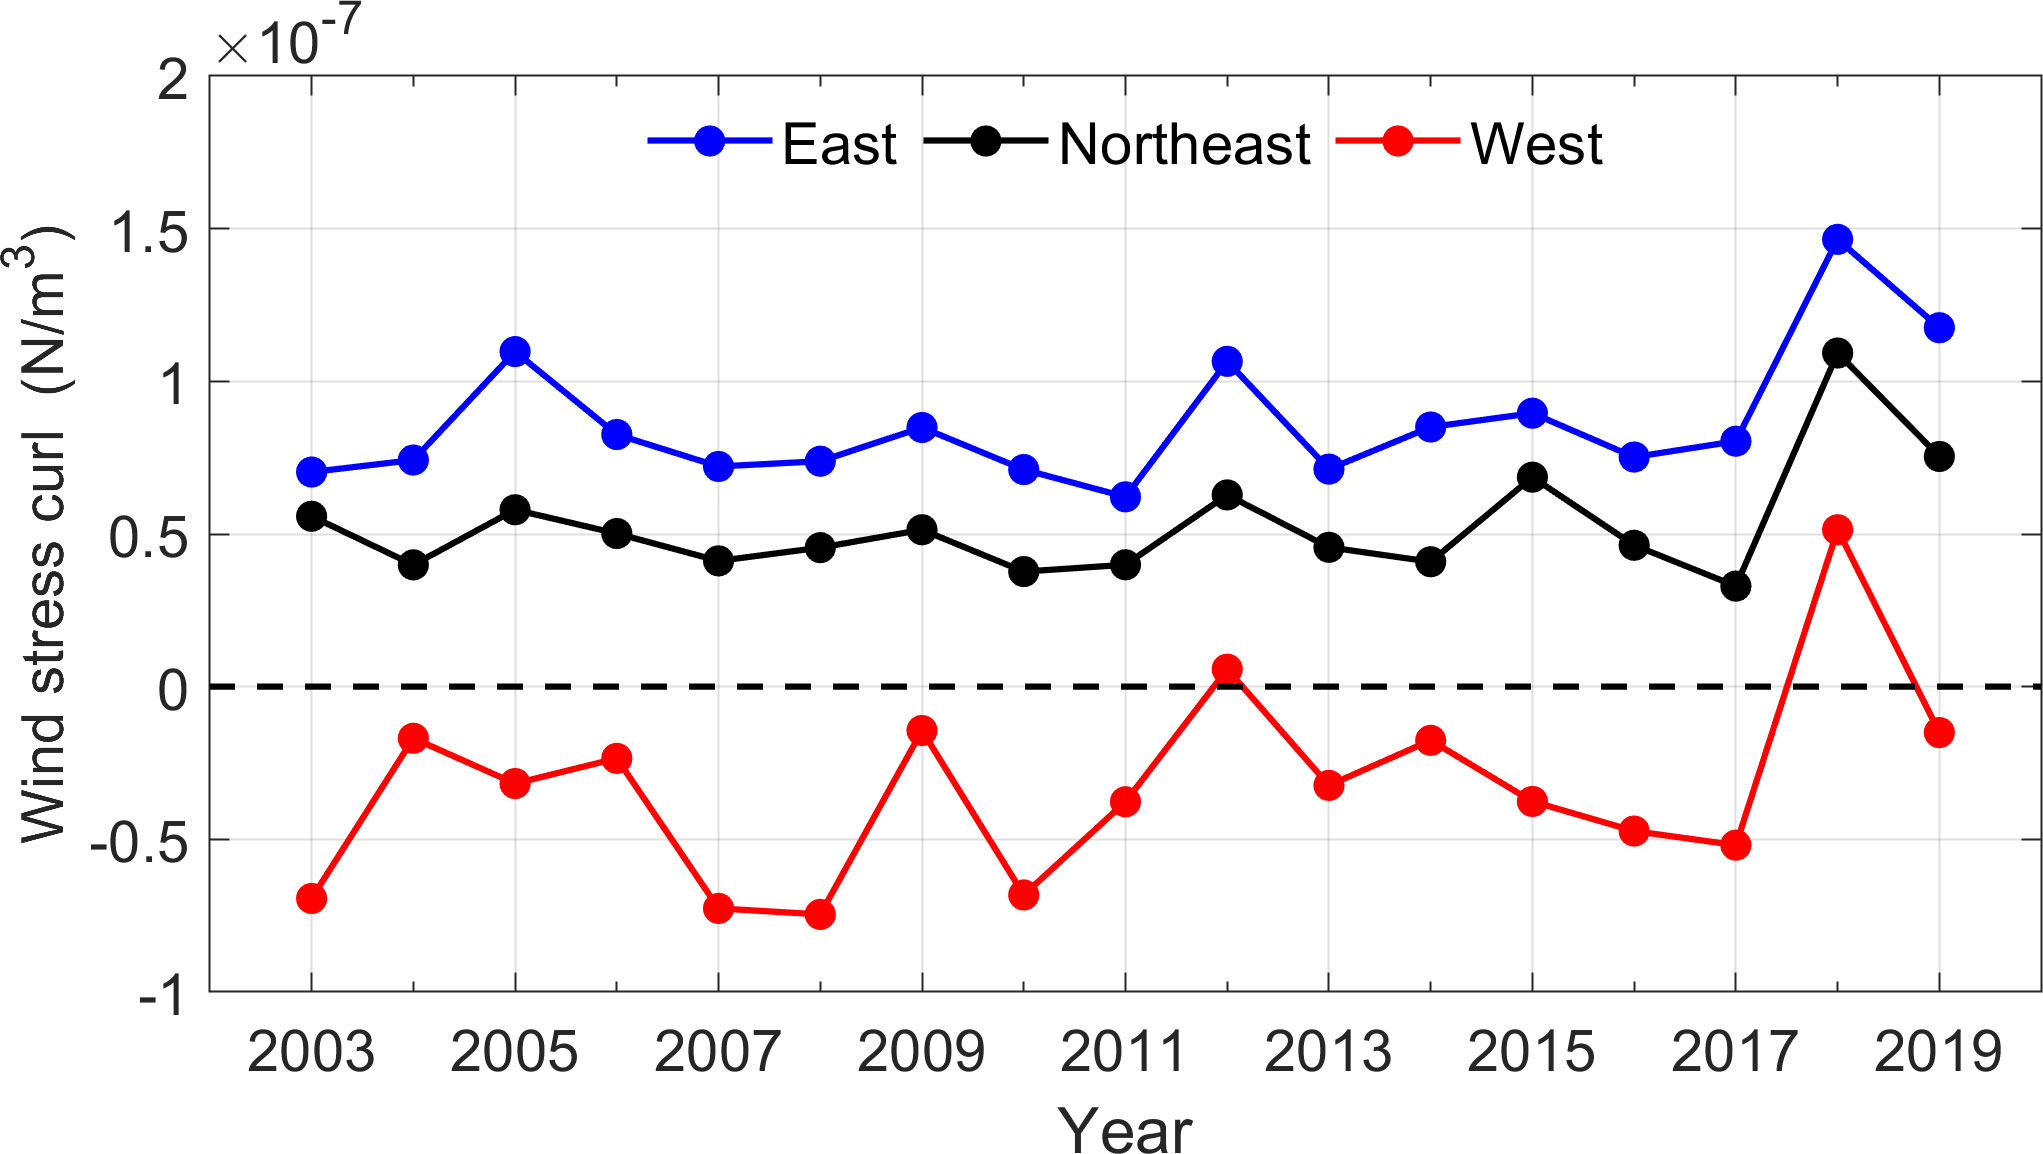
Figure 6 Interannual variation of sea surface wind stress curl in three upwelling regions.
The NES upwelling is caused by both alongshore wind stresses and large-scale circulation in the South China Sea. The large-scale circulation flowing northeastward along the east coast transports cold water from the south and turns offshore off the northeast coast, uplifting the water mass from the bottom layer near the shore (Li et al., 2012; Lin et al., 2016a; Lin et al., 2016b). Lin et al. (2016b) suggested that the uplift of cold bottom water can be limited by strong stratification, which is associated with the prevailing southeasterly wind and fresh water, hindering the occurrence of NES upwelling on the sea surface. Figure 7A shows the relationship between the SST in the ES and NES upwelling regions. In most years, the interannual SST variations in the two upwelling regions were consistent (near the 1:1 line). However, the SST of the NES upwelling region (29.00°C) was considerably higher than that of the ES upwelling region (27.89°C) in 2018, suggesting the NES upwelling intensity was markedly weak. We further analyzed the interannual variation in total precipitation and wind speed over the NES upwelling region (Figure 7B). In 2018, the precipitation in summer is the highest (0.57 mm hr-1) and weak southeasterly wind (1.82 m s-1) prevails. Both are conducive to the southward expansion of fresh water to the NES upwelling region, thus forming a strong density stratification that hinders the uplift of bottom cold water, causing a weak NES upwelling and a high SST in the region.

Figure 7 Relationship between sea surface temperature in the east upwelling and northeast upwelling (A) and interannual variations of precipitation and wind speed in the northeast upwelling region (B).
The formation of WS upwelling may be related to the summertime bottom cold water mass in the Gulf of Tonkin (Gao et al., 2014). In summer, there is a strong horizontal pressure gradient force between the stratification zone in the center Gulf of Tonkin and the vertical mixing zone near the coast of Hainan Island, which can generate upwelling across the tidal front from the stratification region to the mixing zone. Upwelling occurs at the edge of the bottom cold water mass and brings the bottom cold water below the thermocline to the sea surface, which is similar to edge upwelling around the Yellow Sea bottom cold mass in summer (Zhu et al., 2018). Previous studies have suggested that the bottom cold water mass in the central Gulf of Tonkin during summer is closely related to the retention of local cold water during winter (Gao et al., 2017). The sea region of 18–20.5°N and 106.5–108.5°E is selected to represent the central Gulf of Tonkin. Since the water volume is well-mixed in winter, we calculated the correlation coefficient between the interannual variation of summer SST in WS upwelling region and the winter SST in the central Gulf of Tonkin, and found that they were significantly positively correlated (r = 0.53, p< 0.05) (Figure 8). This indicates that the interannual variation in the WS upwelling is associated with the water temperature in the central Gulf of Tonkin. As for the Qiongdong upwelling, it should be noted that the relevant indicators in the ES and NES upwelling regions do not correlate with the interannual variation in water temperature in winter.
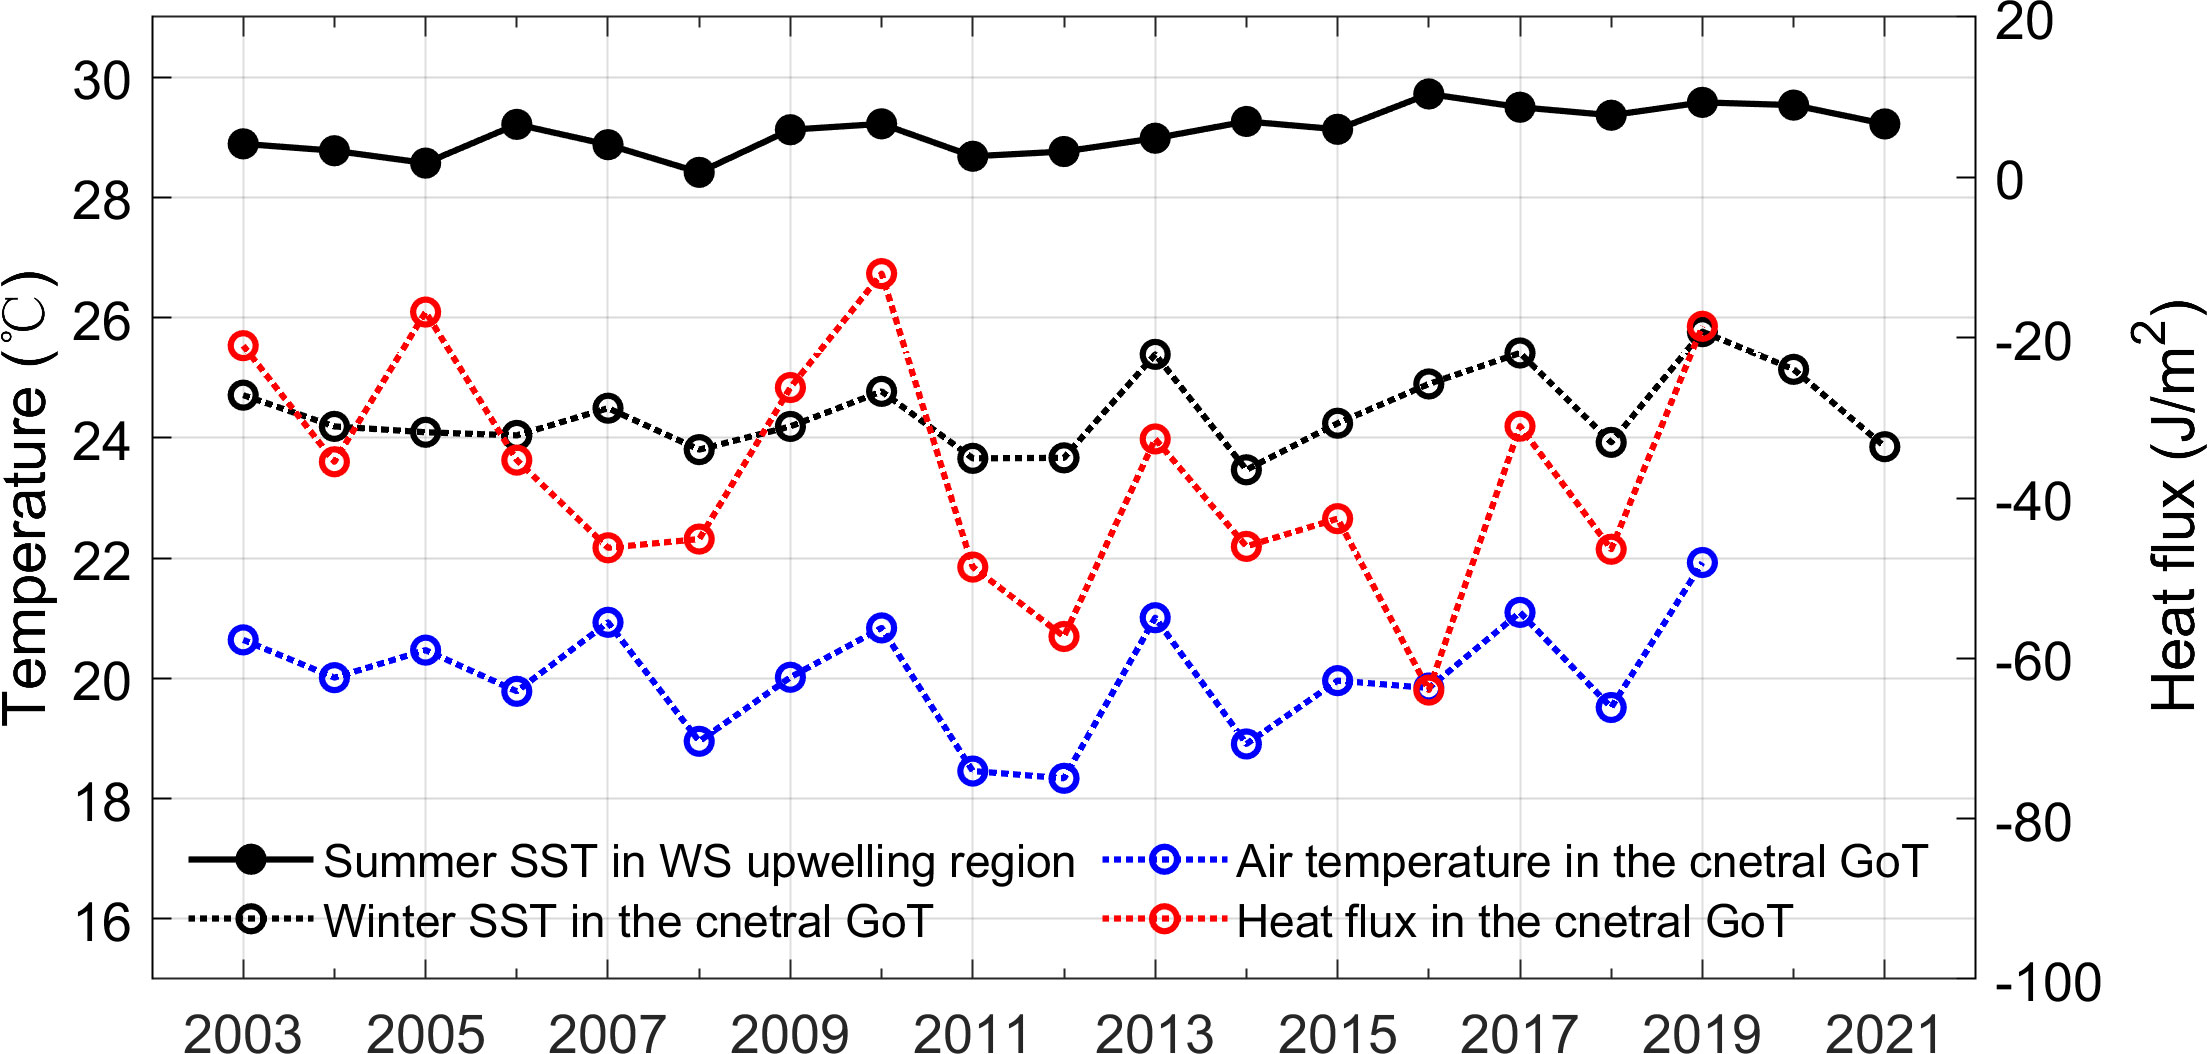
Figure 8 Interannual variation of summer sea surface temperature in the west upwelling region, winter sea surface temperature, air temperature, and air-sea heat flux in the central Gulf of Tonkin (GoT).
The previous discussion suggested that SST in winter is an important factor affecting the interannual variation in summer WS upwelling. We further examined the impact of wintertime atmospheric conditions. The winter SST in the central Gulf of Tonkin was associated with the local air temperature (r = 0.87, p< 0.01). The correlation analysis showed that the air-sea heat flux in the central Gulf of Tonkin is correlated with interannual variations in local air temperature (r = 0.68, p< 0.01) and local SST (r = 0.46, p = 0.06) in winter (Figure 8). This indicates that the winter air temperature associated with air-sea heat flux is likely to affect the SST in the central Gulf of Tonkin in winter, and then affect the interannual variation of WS upwelling in summer.
In this study, the interannual variations in the Qiongdong and Qiongxi upwellings and their influencing factors were explored by analyzing 19-year satellite-observed SST data around the coastal waters of Hainan Island (from 2003 to 2021). The results show that three upwelling regions located on the WS, ES, and NES sides of Hainan Island can be identified using satellite SST. The Qiongdong upwelling has a lower water temperature and larger area than the Qiongxi upwelling.
Both SST in the Qiongdong and Qiongxi upwelling regions show significant warming trends under global warming. The SST warming trend in the WS upwelling was the largest (0.045 °C/year), followed by the NES upwelling (0.036 °C/year), and the smallest in the ES upwelling (0.010 °C/year). The area of surface low-temperature water in upwelling regions gradually decreased. The cold core of the NES upwelling tended to move southward, gradually approaching the ES upwelling. The overall SST warming in the northwest area of the South China Sea is responsible to the warming trend of SST in upwelling regions around Hainan Island since the two upwelling is likely to become stronger after 2013. In addition, SST in the upwelling region exhibited a significant interannual variation. The interannual variation of SST in the ES upwelling region is affected by the local wind stress curl in summer, whereas that in the WS upwelling is closely associated with the retention of seawater in the previous winter, which is affected by the winter sea surface conditions in the central Gulf of Tonkin. In addition, the weak NES upwelling (i.e., high SST) in 2018 was impacted by the strong stratification associated with high precipitation and weak southeasterly winds.
To the best of our knowledge, this study is the first to compare the interannual variations in the Qiongdong and Qiongxi upwellings, which may enhance our understanding of the interannual variation in coastal upwelling around Hainan Island. We note that this study is based on satellite data and regression analysis, and further modeling studies are needed in the future to explore the dynamic mechanism controlling the interannual variation in upwelling.
The original contributions presented in the study are included in the article/supplementary material. Further inquiries can be directed to the corresponding authors.
JZ, JS, and YY conceived the study. JZ, QuZ, QiZ, XinxG, and ZY conducted data analysis and data visualization. JS, XinyG, YY, and RF contributed to data elaboration and interpretation. JZ, QuZ, JS, and YY drafted the first version of the manuscript. All authors contributed to the article and approved the submitted version.
This study was supported by the Key Research and Development Project of Hainan Province (ZDYF2020203), the Opening Project of Guangxi Laboratory on the Study of Coral Reefs in the South China Sea (GXLSCRSCS2020004), the Initial Fund from Hainan University for Research and Development (KYQD(ZR)21002), and the Hainan Provincial Natural Science Foundation of China (421RC1105).
We thank the reviewers for their helpful comments. We thank National Aeronautics and Space Administration (NASA), European Centre for Medium-Range Weather Forecasts (ECMWF) for providing the sea surface temperature and sea surface forcing data. We would like to thank Editage (www.editage.cn) for English language editing.
The authors declare that the research was conducted in the absence of any commercial or financial relationships that could be construed as a potential conflict of interest.
The reviewer MW declared a shared parent affiliation with the author YY to the handling editor at the time of review.
All claims expressed in this article are solely those of the authors and do not necessarily represent those of their affiliated organizations, or those of the publisher, the editors and the reviewers. Any product that may be evaluated in this article, or claim that may be made by its manufacturer, is not guaranteed or endorsed by the publisher.
Bai P., Ling Z., Zhang S., Xie L., Yang J. (2020). Fast-changing upwelling off the west coast of hainan island. Ocean Modell. 148, 101589. doi: 10.1016/j.ocemod.2020.101589
Bai P., Yang J., Zhang S., Xie L., Wu J. (2019). Upwelling off the west coast of hainan island: sensitivity to wave-mixing. Acta Oceanol. Sin. 38, 11–19. doi: 10.1007/s13131-019-1494-3
Bakun A. (1990). Global climate change and intensification of coastal ocean upwelling. Science 247 (4939), 198–201. doi: 10.1126/science.247.4939.198
Chen Z., Kwon Y. O., Chen K., Fratantoni P., Gawarkiewicz G., Joyce T. M. (2020). Long-term SST variability on the Northwest Atlantic continental shelf and slope. Geophys. Res. Lett. 47 (1), e2019GL085455. doi: 10.1029/2019GL085455
Chen Z., Qiao F., Xia C., Wang G. (2015). The numerical investigation of seasonal variation of the cold water mass in the beibu gulf and its mechanisms. Acta Oceanol. Sin. 34 (1), 44–54. doi: 10.1007/s13131-015-0595-x
Deng S., Zhong H. L., Wang M. W., Yun F. J. (1995). On relation between upwelling off qionghai and fishery. J. Oceanogr. Taiwan Strait 14 (1), 51–56.
Di Lorenzo E. (2015). The future of coastal ocean upwelling. Nature 518 (7539), 310–311. doi: 10.1038/518310a
Dong X., Li R., Wang Y., Fu Y., Zhao C. (2018). Potential impacts of Sahara dust aerosol on rainfall vertical structure over the Atlantic ocean as identified from EOF analysis. J. Geophys. Res-Atmos. 123 (16), 8850–8868. doi: 10.1029/2018JD028500
Gao J., Shi M., Chen B., Guo P., Zhao D. (2014). Responses of the circulation and water mass in the beibu gulf to the seasonal forcing regimes. Acta Oceanol. Sin. 33 (7), 1–11. doi: 10.1007/s13131-014-0506-6
Gao J., Wu G., Ya H. (2017). Review of the circulation in the beibu gulf, south China Sea. Cont. Shelf Res. 138, 106–119. doi: 10.1016/j.csr.2017.02.009
Guan B., Chen S. (1964). General oceanographic survey of bo hai, Huang hai, dong hai and nan hai. Qingdao: Institute Oceanology Chin. Acad. Sci., 14–19.
Huffman G. J., Stocker E. F., Bolvin D. T., Nelkin E. J., Tan J. (2019) GPM IMERG final precipitation L3 1 month 0.1 degree x 0.1 degree V06, greenbelt, MD, Goddard earth sciences data and information services center (GES DISC) (Accessed 2022.09.16).
Hu J., Wang X. H. (2016). Progress on upwelling studies in the China seas. Rev. Geophys. 54 (3), 653–673. doi: 10.1002/2015RG000505
Huynh H. N. T., Alvera-Azcárate A., Barth A., Beckers J. M. (2016). Reconstruction and analysis of long-term satellite-derived sea surface temperature for the south China Sea. J. Oceanogr 72 (5), 707–726. doi: 10.1007/s10872-016-0365-1
Jing Z., Qi Y., Du Y. (2011). Upwelling in the continental shelf of northern south China Sea associated with 1997–1998 El niño. J. Geophys. Res-Oceans 116 (C2), C02033. doi: 10.1029/2010JC006598
Jing Z., Qi Y., Du Y., Zhang S., Xie L. (2015). Summer upwelling and thermal fronts in the northwestern south China Sea: Observational analysis of two mesoscale mapping surveys. J. Geophys. Res-Oceans 120 (3), 1993–2006. doi: 10.1002/2014JC010601
Jing Z. Y., Qi Y. Q., Hua Z. L., Zhang H. (2009). Numerical study on the summer upwelling system in the northern continental shelf of the south China Sea. Cont. Shelf Res. 29 (2), 467–478. doi: 10.1016/j.csr.2008.11.008
Largier J. L. (2020). Upwelling bays: how coastal upwelling controls circulation, habitat, and productivity in bays. Annu. Rev. Mar. Sci. 12, 415–447. doi: 10.1146/annurev-marine-010419-011020
Li Y., Mu L., Liu Y., Wang G., Zhang D., Li H., et al. (2017). Analysis of variability and long-term trends of sea surface temperature over the China seas derived from a newly merged regional data set. Clim Res. 73 (3), 217–231. doi: 10.3354/cr01471
Lin P., Cheng P., Gan J., Hu J. (2016a). Dynamics of wind-driven upwelling off the northeastern coast of hainan island. J. Geophys. Res-Oceans 121 (2), 1160–1173. doi: 10.1002/2015JC011000
Lin P., Hu J., Zheng Q., Sun Z., Zhu J. (2016b). Observation of summertime upwelling off the eastern and northeastern coasts of hainan island, China. Ocean Dynam. 66 (3), 387–399. doi: 10.1007/s10236-016-0934-2
Li Y., Peng S., Wang J., Yan J., Huang H. (2018). On the mechanism of the generation and interannual variations of the summer upwellings west and southwest off the hainan island. J. Geophys. Res-Oceans 123 (11), 8247–8263. doi: 10.1029/2018JC014226
Li Y., Peng S., Yang W., Wang D. (2012). Numerical simulation of the structure and variation of upwelling off the east coast of hainan island using QuikSCAT winds. Chin. J. Oceanol. Limn. 30 (6), 1068–1081. doi: 10.1007/s00343-012-1275-8
Liu C., Li X., Wang S., Tang D., Zhu D. (2020). Interannual variability and trends in sea surface temperature, sea surface wind, and sea level anomaly in the south China Sea. Int. J. Remote Sens 41 (11), 4160–4173. doi: 10.1080/01431161.2020.1714777
Li Y., Von Storch H., Wang Q., Zhou Q., Tang S. (2019). Testing the validity of regional detail in global analyses of sea surface temperature–the case of Chinese coastal waters. Ocean Sci. 15 (6), 1455–1467. doi: 10.5194/os-15-1455-2019
Lu X., Huang C., Chen F., Zhang S., Lao Q., Chen C., et al. (2021). Carbon and nitrogen isotopic compositions of particulate organic matter in the upwelling zone off the east coast of hainan island, China. Mar. pollut. Bull. 167, 112349. doi: 10.1016/j.marpolbul.2021.112349
Lü X., Qiao F., Wang G., Xia C., Yuan Y. (2008). Upwelling off the west coast of hainan island in summer: Its detection and mechanisms. Geophys. Res. Lett. 35 (2), L02604. doi: 10.1029/2007GL032440
Park K. A., Lee E. Y., Chang E., Hong S. (2015). Spatial and temporal variability of sea surface temperature and warming trends in the yellow Sea. J. Mar. Syst. 143, 24–38. doi: 10.1016/j.jmarsys.2014.10.013
Shu Y., Wang D., Feng M., Geng B., Chen J., Yao J., et al. (2018). The contribution of local wind and ocean circulation to the interannual variability in coastal upwelling intensity in the northern south China Sea. J. Geophys. Res-Oceans 123 (9), 6766–6778. doi: 10.1029/2018JC014223
Sousa M. C., Ribeiro A., Des M., Gomez-Gesteira M., deCastro M., Dias J. M. (2020). NW Iberian Peninsula coastal upwelling future weakening: Competition between wind intensification and surface heating. Sci. Total Environ. 703, 134808. doi: 10.1016/j.scitotenv.2019.134808
Stukel M. R., Barbeau K. A. (2020). Investigating the nutrient landscape in a coastal upwelling region and its relationship to the biological carbon pump. Geophys. Res. Lett. 47 (6), e2020GL087351. doi: 10.1029/2020GL087351
Su J., Pohlmann T. (2009). Wind and topography influence on an upwelling system at the eastern hainan coast. J. Geophys. Res-Oceans 114 (C6), C06017. doi: 10.1029/2008JC005018
Su J., Xu M., Pohlmann T., Xu D., Wang D. (2013). A western boundary upwelling system response to recent climate variation, (1960–2006). Cont. Shelf Res. 57, 3–9. doi: 10.1016/j.csr.2012.05.010
Syamsuddin M. (2020). Spatial and temporal patterns of ocean variability using empirical orthogonal functions (EOF) in the southern Java waters. World Sci. News 142, 76–87.
Wang D., Gouhier T. C., Menge B. A., Ganguly A. R. (2015a). Intensification and spatial homogenization of coastal upwelling under climate change. Nature 518 (7539), 390–394. doi: 10.1038/nature14235
Wang Y., Jing Z., Qi Y. (2016). Coastal upwelling off eastern hainan island observed in the summer of 2013. Chin. J. Trop. Oceanogr. 35 (2), 40–49. (in Chinese)
Wang D., Yang Y., Wang J., Bai X. (2015b). A modeling study of the effects of river runoff, tides, and surface wind-wave mixing on the Eastern and Western hainan upwelling systems of the south China Sea, China. Ocean Dynam. 65 (8), 1143–1164. doi: 10.1007/s10236-015-0857-3
Wang Y., Yu Y., Zhang Y., Zhang H. R., Chai F. (2020). Distribution and variability of sea surface temperature fronts in the south China sea. Estuar. Coast. Shelf S. 240, 106793. doi: 10.1016/j.ecss.2020.106793
Xie S. P., Xie Q., Wang D., Liu W. T. (2003). Summer upwelling in the south China Sea and its role in regional climate variations. J. Geophys. Res-Oceans 108 (C8), 3261. doi: 10.1029/2003JC001867
Xie L., Zhang S., Zhao H. (2012). Overview of studies on qiongdong upwelling. J. Trop. Oceanogr. 31 (4), 35–41. (in Chinese)
Xie L., Zong X., Yi X., Li M. (2016). The interannual variation and long-term trend of qiongdong upwelling. Oceanol. Limnol. Sin. 47, 43–51. (in Chinese)
Xiu P., Chai F., Curchitser E. N., Castruccio F. S. (2018). Future changes in coastal upwelling ecosystems with global warming: The case of the California current system. Sci. Rep. 8 (1), 1–9. doi: 10.1038/s41598-018-21247-7
Xu J. D., Cai S. Z., Xuan L. L., Qiu Y., Zhu D. Y. (2013). Study on coastal upwelling in eastern hainan island and western guangdong in summer 2006. Acta Oceanol. Sin. 35 (4), 11–18. (in Chinese)
Yang S., Mao X., Jiang W. (2020). Interannual variation of coastal upwelling in summer in zhejiang, China. Periodical Ocean Univ. China 50 (2), 1–8. (in Chinese)
Yelland M. J., Moat B. I., Taylor P. K., Pascal R. W., Hutchings J., Cornell V. C. (1998). Wind stress measurements from the open ocean corrected for airflow distortion by the ship. J. Phys. Oceanogr. 28 (7), 1511–1526. doi: 10.1175/1520-0485(1998)028<1511:WSMFTO>2.0.CO;2
Yelland M., Taylor P. K. (1996). Wind stress measurements from the open ocean. J. Phys. Oceanogr. 26 (4), 541–558. doi: 10.1175/1520-0485(1996)026<0541:WSMFTO>2.0.CO;2
Keywords: upwelling, interannual variation, sea surface temperature, wind stress curl, Hainan Island
Citation: Zhu J, Zhou Q, Zhou Q, Geng X, Shi J, Guo X, Yu Y, Yang Z and Fan R (2023) Interannual variation of coastal upwelling around Hainan Island. Front. Mar. Sci. 10:1054669. doi: 10.3389/fmars.2023.1054669
Received: 27 September 2022; Accepted: 05 January 2023;
Published: 24 January 2023.
Edited by:
Chunyan Li, Louisiana State University, United StatesReviewed by:
Vyacheslav Lobanov, V.I. Il’ichev Pacific Oceanological Institute (RAS), RussiaCopyright © 2023 Zhu, Zhou, Zhou, Geng, Shi, Guo, Yu, Yang and Fan. This is an open-access article distributed under the terms of the Creative Commons Attribution License (CC BY). The use, distribution or reproduction in other forums is permitted, provided the original author(s) and the copyright owner(s) are credited and that the original publication in this journal is cited, in accordance with accepted academic practice. No use, distribution or reproduction is permitted which does not comply with these terms.
*Correspondence: Jie Shi, c2hpamllQG91Yy5lZHUuY24=; Yang Yu, Y2xhcmt5dWNoaW5hQGxpdmUuY29t
Disclaimer: All claims expressed in this article are solely those of the authors and do not necessarily represent those of their affiliated organizations, or those of the publisher, the editors and the reviewers. Any product that may be evaluated in this article or claim that may be made by its manufacturer is not guaranteed or endorsed by the publisher.
Research integrity at Frontiers
Learn more about the work of our research integrity team to safeguard the quality of each article we publish.