 Rosa María Martínez-Vázquez
 Juan Milán-García
 Jose Ramos Pires Manso2
 Jaime De Pablo Valenciano
- 1Department of Business and Economics, University of Almeria, Almería, Spain
- 2Department of Business and Economics, University of Beira Interior (NECE), Covilhã, Portugal
Introduction: Blue economics research is a research field that is achieving more and more interest among international scientists. This study adds more knowledge as it aims to investigate the causal relationships between blue economic factors – living and non-living resources, ocean energy, port activities, shipbuilding and repair, maritime transport, coastal tourism, human development indicator, per capita income, fish capture, internal renewable water resources per capita, marine protected areas, greenhouse gas emissions and population density, all factors related to maritime activities – and the blue economy (BE) itself.
Methods: In order to reach these objectives, some special analytical and econometric methods are used. Among them the multivariate Granger causality theory, the correlation analysis and panel data techniques are employed. This set of methods helps us to study the complex set of relationships among the various factors related to the BE and their influence on per capita income (PCI) and economic growth. The data used to conduct this research were collected from the Eurostat, the E.U. statistical database. Several European countries and the span period 2010-2018 are used too.
Results: The analysis showed evidence that per capita income is associated to other factors of the blue economy, that PCI (Granger) causes coastal tourism and population density, and that there are five other factors that positively influence PCI growth, namely, greenhouse gas emissions (GHG), maritime transport, nonliving resources and ports’ activities. This paper adds some new understandings to theory and calls the attention to society, in general, and the blue economics, in particular. For instance, if policymakers want to increase income per capita of these regions, they should take action on some variables such as human development indicator (HDI), greenhouse gas (GHG) emissions, living resources, maritime transport and ocean energy. The results reveal that blue economy is a good alternative to promote both economic growth and PCI.
Discussion: The concerns that make up the blue economy, such as ocean energy, port activities, ship building and repair, maritime transport, coastal tourism, HDI, maritime fish capture, marine protected areas, and GHG reductionare good factors to stimulate economic growth. Among these, the most influencing are maritime transport, living resources and the production of ocean energy. This study adds knowledge to theory, innovates in the methods and techniques used, in the results discovered, in its discussion, and in the mixture of blue economic factors, too. As far as we know, it is one of the first papers that fills this gap in the literature regarding the more and more important blue economy.
1 Introduction, background and literature review
The Blue Economy (BE) has become a key element to promote the economic development of countries. A significant part of maritime states try to improve the use of marine resources efficiency, including marine space (Plink et al., 2021). A decade ago, the EU implemented a BE growth strategy the Intra Maritime Policy (IMP) within the objectives of the 2020 Strategy in order to achieve sustainable and inclusive growth. To achieve it five main sectors were selected: biotechnology, renewable energy, coastal and maritime tourism, aquaculture and mineral resources, as well as other emerging sub-sectors. The principles of the 2020 Strategy are based on the ocean management, with the commitment to a sustainable and environmentally friendly development of ocean and economic activities (Sulanke & Rybicki, 2021).
At the institutional level, the UN declared seas, oceans and marine resources as one of the 17 priority Sustainable Development Goals (SDGs) (UNCTAD, 2014). Marine ecosystems provide resources that directly and indirectly benefit economies and provide ecosystem services for human well-being (Roberts et al., 2021). In addition, the World Bank (2013) notes that ocean-related economic activities are taking place against a backdrop of global population growth, rising consumption and increasing new energy, mineral and food resources needs. By 2030 two thirds of the fish for food will be sea-grown. Offshore wind capacity is also expected to increase, becoming the main source of energy (IRENA, 2016), and commercial shipping is expected to quadruple by 2050 (ITF, 2015). These actions are expected to increase investments in coastal infrastructure, industry and tourism (World Bank, 2017). Community-based ecotourism is emerging within the dynamics of the BE. Depending on the context in which it is applied, it will be more or less difficult to find a balance between tourism exploitation (as a source of economic resources) and environmental conservation. Phelan et al. (2020) presented a model that reveals important interactions between community, local economy, coastal ecosystems and the fundamental role played by community-based ecotourism in creating effective mechanisms to preserve cultural and natural heritage. The EU continues to analyse the size and scope of the BE, either on the member states individually or as a whole. Through its economic data, the report takes stock of the BE using the latest available data (European Commission, 2021). The information provided can be useful for stakeholders and as a frame of reference for future policy designs. The established sectors - living and non-living marine resources, marine renewable energies, shipbuilding and repair, port activities, maritime transport and coastal tourism - remain important contributors to the EU’s BE.
In recent years, some studies using panel data techniques as central methods for their researches have been published, independently of the knowledge branch in which the research is framed: health sciences, tourism economics, international trade (e.g. Eugenio-Martín et al., 2004; Kadir and Sibel, 2014), energy economics, macroeconomics and many others. Some of them use panel data to analyze issues related to international trade in agricultural products (Van den Broeck et al., 2016; Veeman, 2017), industrial organization (Flores Tenorio, 2017; Kingwell and Xayavong, 2017), financial systems (Motengwe and Alagidede, 2016; Gevorkyan, 2017), tourism economics, macroeconomics (Mthanti & Ojah, 2017), public sector and economic development (Ewing and Hamidi, 2015; O'Laughlin, 2016; Mosbah and Ryerson, 2016), agricultural economics (Agarwal, 1986; Barrios, 2008; Liao et al., 2015) and also energy economy (Burnett et al., 2013; Çoban and Topcu, 2013; Zheng and Wang, 2021). In the field of economics impact analysis, panel data methodologies are one of the most widely used (Kilic and Arica, 2014; Hussain and Haque, 2016). Articles that study the impact of the primary sector on the regional economic activity, such as the analysis on the impact of agriculture in rural Africa (Barrett et al., 2001) or the impact of agriculture on growth in China (Lin, 1992) stand out. Most of the cited articles cover the tourism sector. For, instance, Paramati et al. (2017), link tourism to economic growth and carbon dioxide emissions and point out the differences between developed and developing countries. Kuo et al. (2008), assess the impact of diseases (avian flu or SARS) on the tourism sector, and Tang and Tan (2015) emphasizes the need to articulate tourism action plans in accordance with environmental constraints. However, there are only two papers that use panel data methods to analyze the economic impact of the Blue Economy (Bhattacharya and Dash, 2021; Fratila et al., 2021). This shows the huge gap in the scientific literature that this paper aims to address and fill.
In addition to this Introduction, background and literature review, this paper includes section two for describing variables, data and research methods, section three for presenting the results, section four for the discussion of the results and, finally, section five to present the concluding remarks.
2 Variables, data and research methods
In our analysis the following variables were used: Living resources - marine living resources sector encompasses or includes fish, crustaceans and molluscs;. non-living resources - although the offshore oil and gas sectors have been declining for some time, in the last decade the production of non-living marine resources has experienced a considerable growth (Liu et al., 2021); these non-living resources include oil primary sector, i.e., the collection of renewable biological resources, such as capture fisheries (small-scale, large-scale and industrial coastal fleets) and aquaculture (marine, freshwater and shellfish); the processing and transformation sector (food, feed, bio-based products and bioenergy) and the distribution along the supply chain: retail sale of fish, crustaceans and molluscs and wholesale trade of other food stuffs extraction, natural gas, clays, salt, and the exploitation of gravel and sand quarries; marine renewable energies - an important source of green energy with a great potential to generate economic growth as well as level of employment in a sustainable way through technological innovation (Gielen et al., 2019); it currently includes offshore wind power and other emerging sectors such as floating wind power and wave and tidal energies; shipbuilding and repair - the EU shipbuilding industry is a competitive sector composed of shipyards specializing in shipbuilding and ship repair; there are shipbuilding segments with a high technological level and a high added value, such as cruise ships, mega yachts, offshore support vessels, ferries and dredgers (EC, 2021): - maritime transport, - is one of the core activities of the BE, being the main means of transport for the supply of energy, raw materials, consumer goods and essential foodstuffs; Fratila et al. (2021), showed that maritime transport, air pollutants from maritime transport and investment in maritime port infrastructure are positively correlated with economic growth; coastal and oceanic tourism takes many forms and activities such as diving, surfing, maritime archaeology, cruises, ecotourism or recreational fishing; it is linked to economic, social and environmental well-being of many countries by offering significant foreign exchange either for both Small Island Developing States (SIDS) and Least Developed Countries (LDC) (World Bank, 2017).
Only the direct contribution of the economic and maritime sectors is considered in our research. However, all sectors have indirect and induced effects, so each sector has very important multiplier effects on income and employment levels in other sectors of the economy (EC, 2021). Sustainability is an overriding principle, so any sector related to the sea and the oceans must be developed in a way that minimizes the impacts on the environment and preserves the species’ health that inhabit it (Roberts et al., 2021).
Our empirical analysis uses a set of selected variables mostly related to the blue economy, namely living resources (103 employees), the number of employees working in living resources activities of the blue economy (livr). Non-living resources (103 empl.), the number of employees working in non-living resources activities of the blue economy (n_livr). Ocean energy (103 empl), the number of employees working in the ocean energy activities of the blue economy (oc_enrg). Ports’ activities (103 empl), the number of employees working in port activities of the blue economy (port-actvs). Shipbuilding and repair (103 empl), the number of employees working in shipbuilding and repair activities of the blue economy (shipbuild). Maritime transport (103 of employees), the number of employees working in maritime transport activities of the blue economy (martrnsp). Coastal tourism (103 empl), the number of employees working in coastal tourism activities of the blue economy (costltourm). Human Development Indicator, a composite index measuring average achievement in three basic dimensions of human development - a long and healthy life, knowledge and a decent standard of living (HDI). Per capita gross domestic product (GDP) at purchasing power parity (PPP) ($ current prices). Purchasing power parity (PPP) GDP is the gross domestic product converted to international dollars using purchasing power parity rates. An international dollar has the same purchasing power over GDP as the U.S. dollar has in that country. It is calculated without deductions for depreciation of manufactured goods or depletion and degradation of natural resources. Data are expressed in current international dollars. Per capita income (PCI), and is the dependent variable of the research. Fish capture (metric tons), capture fisheries production measures the volume of fish catches landed by a country for all commercial, industrial, recreational and subsistence purposes (fishcap). Renewable internal freshwater resources per capita (cubic meters), internal renewable freshwater resource flows refer to the country’s internal renewable resources (internal river flows and groundwater originating from rainfall). Marine protected areas (% of territorial waters), the marine protected areas are areas of intertidal or subtidal terrain, together with their overlying waters and their flora, fauna and related historical and cultural features, which have been set aside by law or by any other effective means to protect part or all of the environment they enclose. Greenhouse gas emissions by source sector (thousands of tons), the emission of Greenhouse Gases emissions (CO2, N2O in CO2 equivalent, CH4, HFC, PFC, SF6, and NF3, all in CO2 equivalent (GHG). Population density (persons per square kilometer), is calculated as the ratio between the annual average population and the land area. The data were collected from the Eurostat database and cover the span period 2010-2018.
In terms of methods, the article uses Granger multivariate causality analysis, correlation analysis and panel data models, either with fixed or random effects and also pooled models, estimated with the Panel Least Squares Method (fixed effects) and the EGLS Panel (Cross-section random effects). To select the best model that best explains PCI, the Hausman test and the Redundant Fixed Effects Tests or cross-sectional fixed effects test that use the Cross-section F and Cross-section Chi-square statistics were used.
The research questions addressed are: 1) Are there causal relationships among PCI and other blue economic economy factors? 2) Are there significant relationships among each one of the BE factors? And 3) Are BE factors important to explain PCI. As usual, all the variables were converted to their natural logarithms.
3 Results
The following table presents the descriptive statistics of all the variables.
As can be seen from Table 1, the Jarque-Bera (JB) test shows that the variables are mostly normal. There are only two exceptions: marine protected areas and ocean energy that reject the null hypothesis of normality.
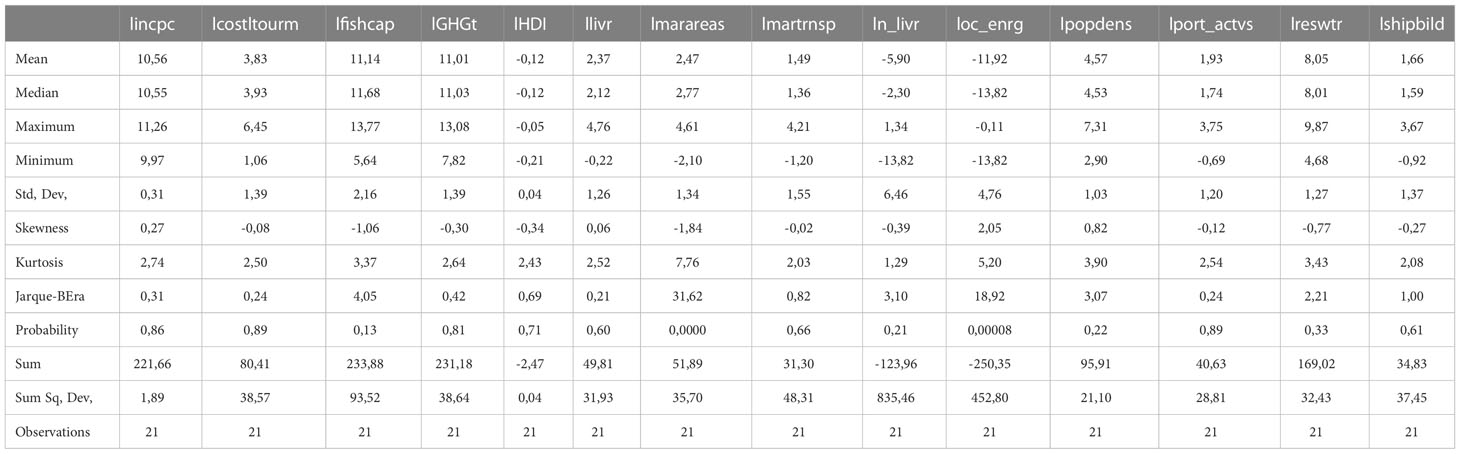
Table 1 Descriptive statistics.
The following table (Table 2) presents the correlations between each pair of variables or factors. As can be seen most of them are not important correlations (less than 0.75) but there are some others that are greater than it; this may be associated with collinearity problems between variables.
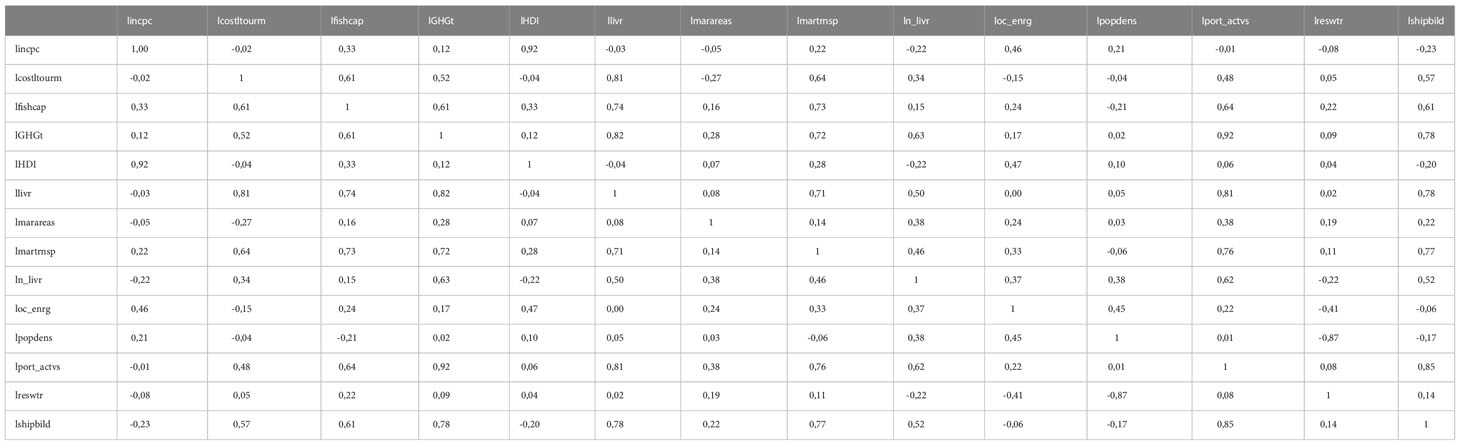
Table 2 Correlation Matrix.
The correlation matrix shows that there are several factors correlated with one or more variables or factors, or with correlations greater than 0.75 (in absolute value). Almost all of them are positive. These correlations indicate possible multicollinearities between variables, insignificance of some coefficients of regression models, and, possibly, reversed directions between them.
Granger causality analysis shows that there are some causal relationships (Figure 1) (granger causalities) between variables, most of which are causalities from one variable to another, i. e., unidirectional causalities. There are two that are bilateral: from shipbuilding to HDI and HDI to shipbuilding. Also port activities that granger cause maritime transport and maritime transport granger causes port activities. The rest have independent relationships, i.e., there is no causality between them. There are several variables or factors that influence or granger cause PCI: greenhouse gas, living resources, maritime transport, non-living resources, and ports’ activities, all these factors granger cause PCI. PCI level also determines or influences - in the grangerian sense - coastal tourism and population density.
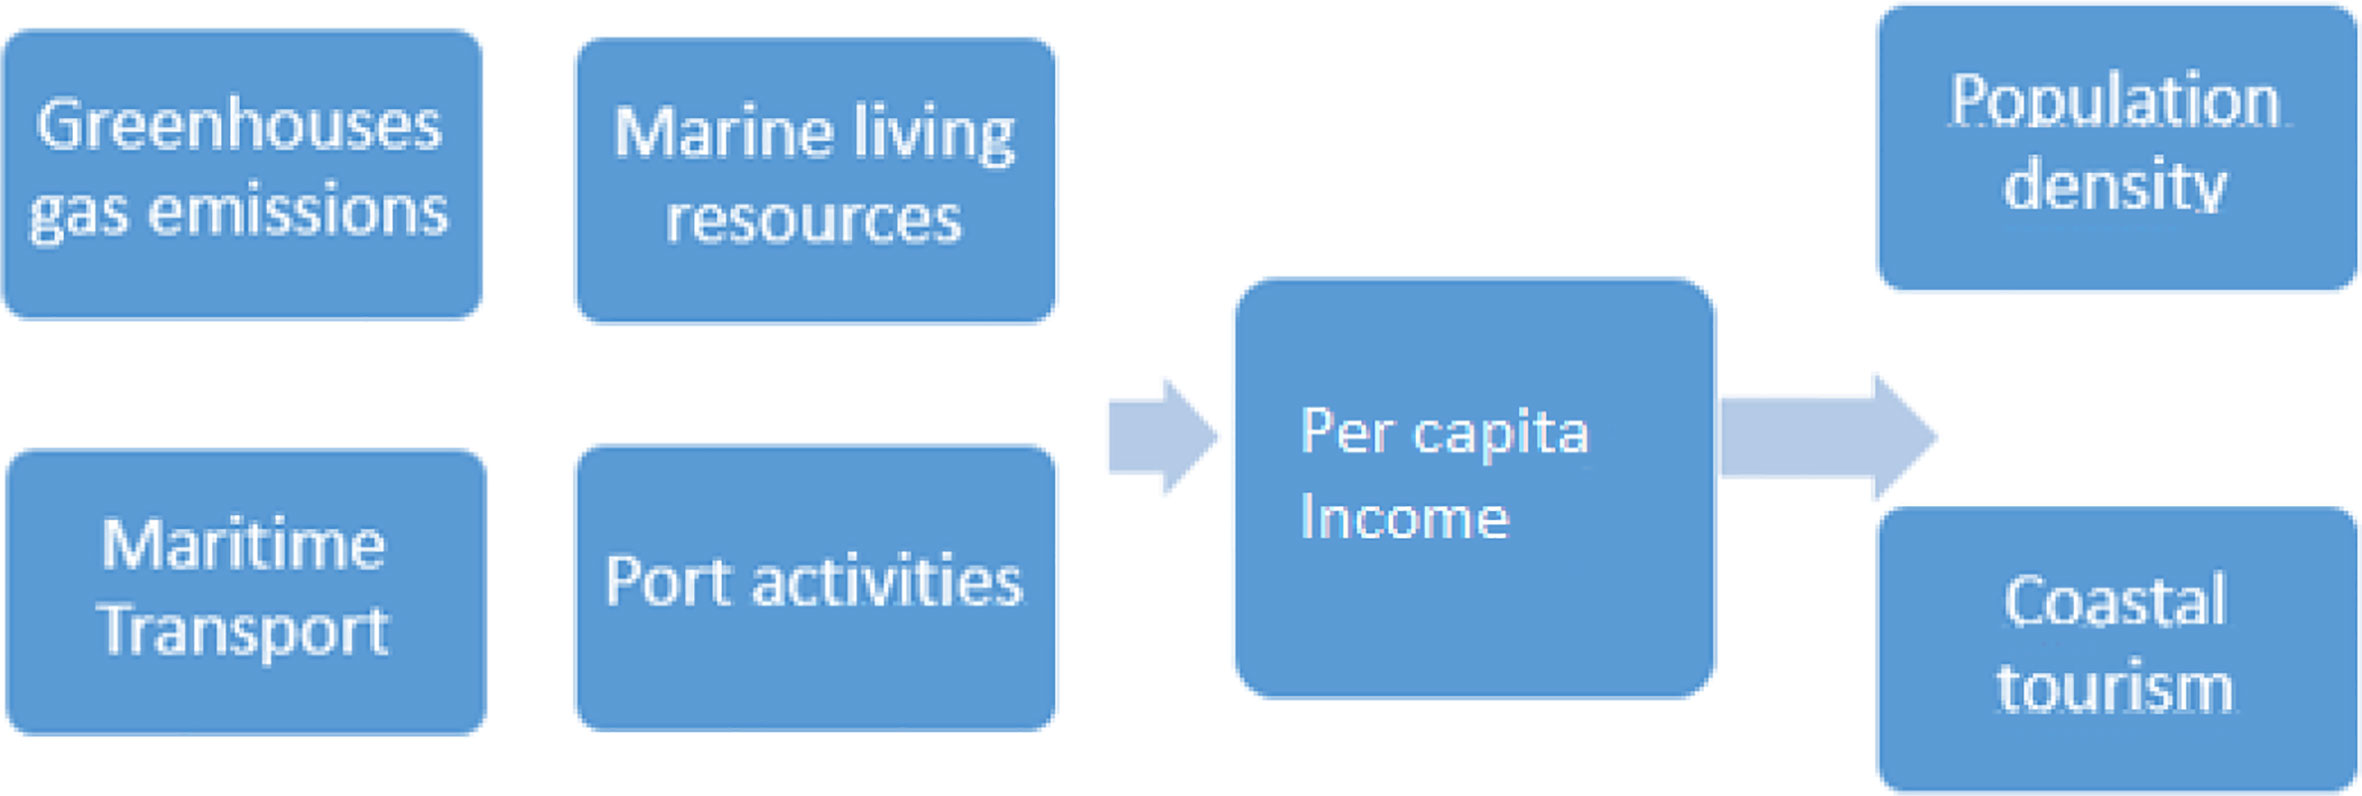
Figure 1 Causal relationship between variables with PCI.
The other combinations of factors do not influence or granger cause income per capita or vice versa. But there are many others that cause or influence other factors. For these results we have considered a lag length of 1. Granger causality analysis shows that there are several granger causal relationships between the variables, most of which are unidirectional or variable-to-variable causalities. There is one that is bilateral, it is renewable internal freshwater resources per capita that granger cause maritime protected areas and vice-versa, the rest have independent relationships (the ones we have not referred above).
If a lag length of 2 is considered, there are only two of the selected variables that granger cause or determine per capita income: greenhouse gas emissions and living resources. In turn, income per capita determines or influences coastal tourism, human development indicator and population density. The remaining (granger) causal relationships are as follows, in which the top factor in each table is the cause, and those below each one of them are the effects (Figure 2).
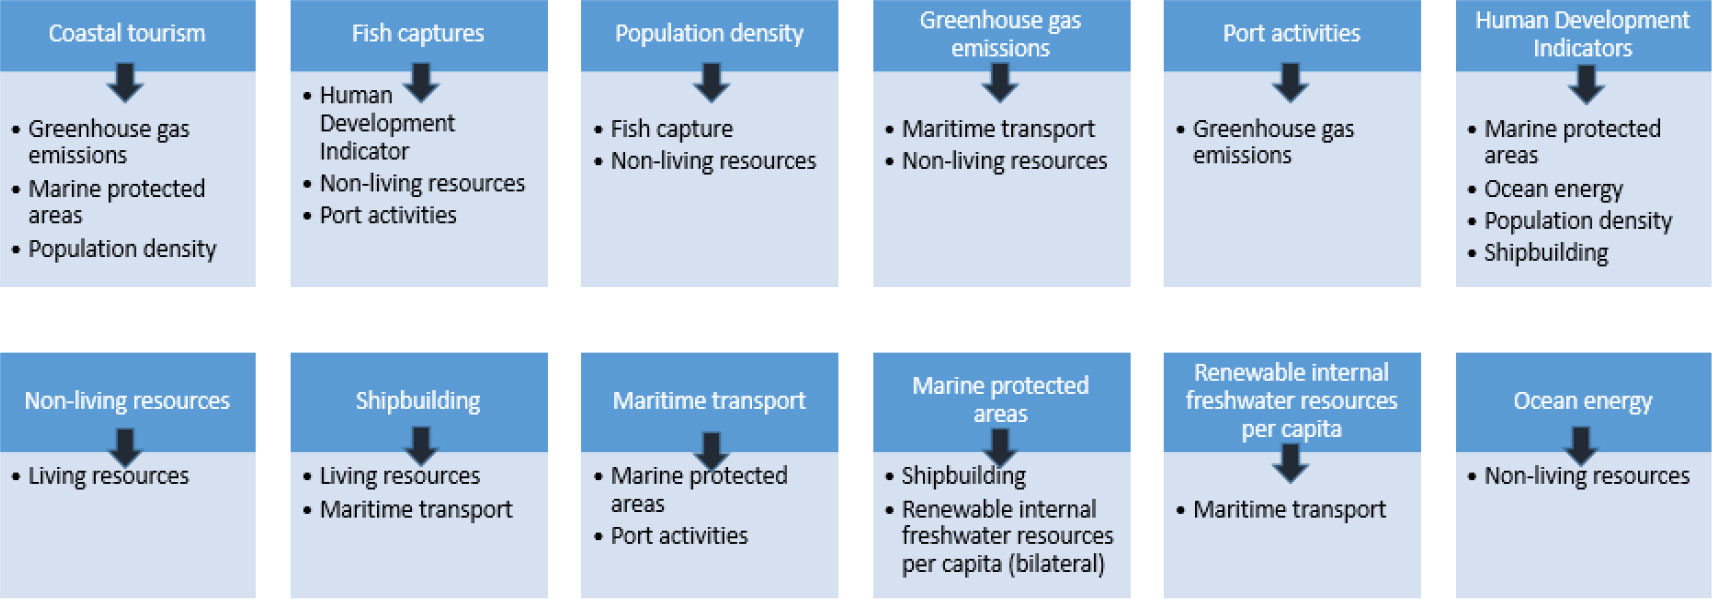
Figure 2 Causal relationship among variables (lag length of 2).
When using panel data models, the results of the application of the Hausman test (Table 2) indicate that the best model to explain PCI growth is the fixed-effect (FE) model. The Pooled Effect (PE) model was estimated only for benchmark ends. Table 3 shows that PCI is highly responsive to the human development indicator (with the 3 models PM, RE, FE), living resources (RE - Random Effects), maritime transport (FE, the coefficient of the random effects model, RA, is negative), and ocean energy production (FE). Thus, the most influencing sectors of the blue economics are living resources, maritime transport and ocean energy production. All the coefficients or elasticities have the correct (positive) sign, except maritime transport, but with the random effects model, which is neither the best nor the most appropriate model; this may be explained by some collinearity or multicollinearity problems between the explanatory variables, as was referred above. All three models are highly statistically significant as evidenced by the F-tests performed.
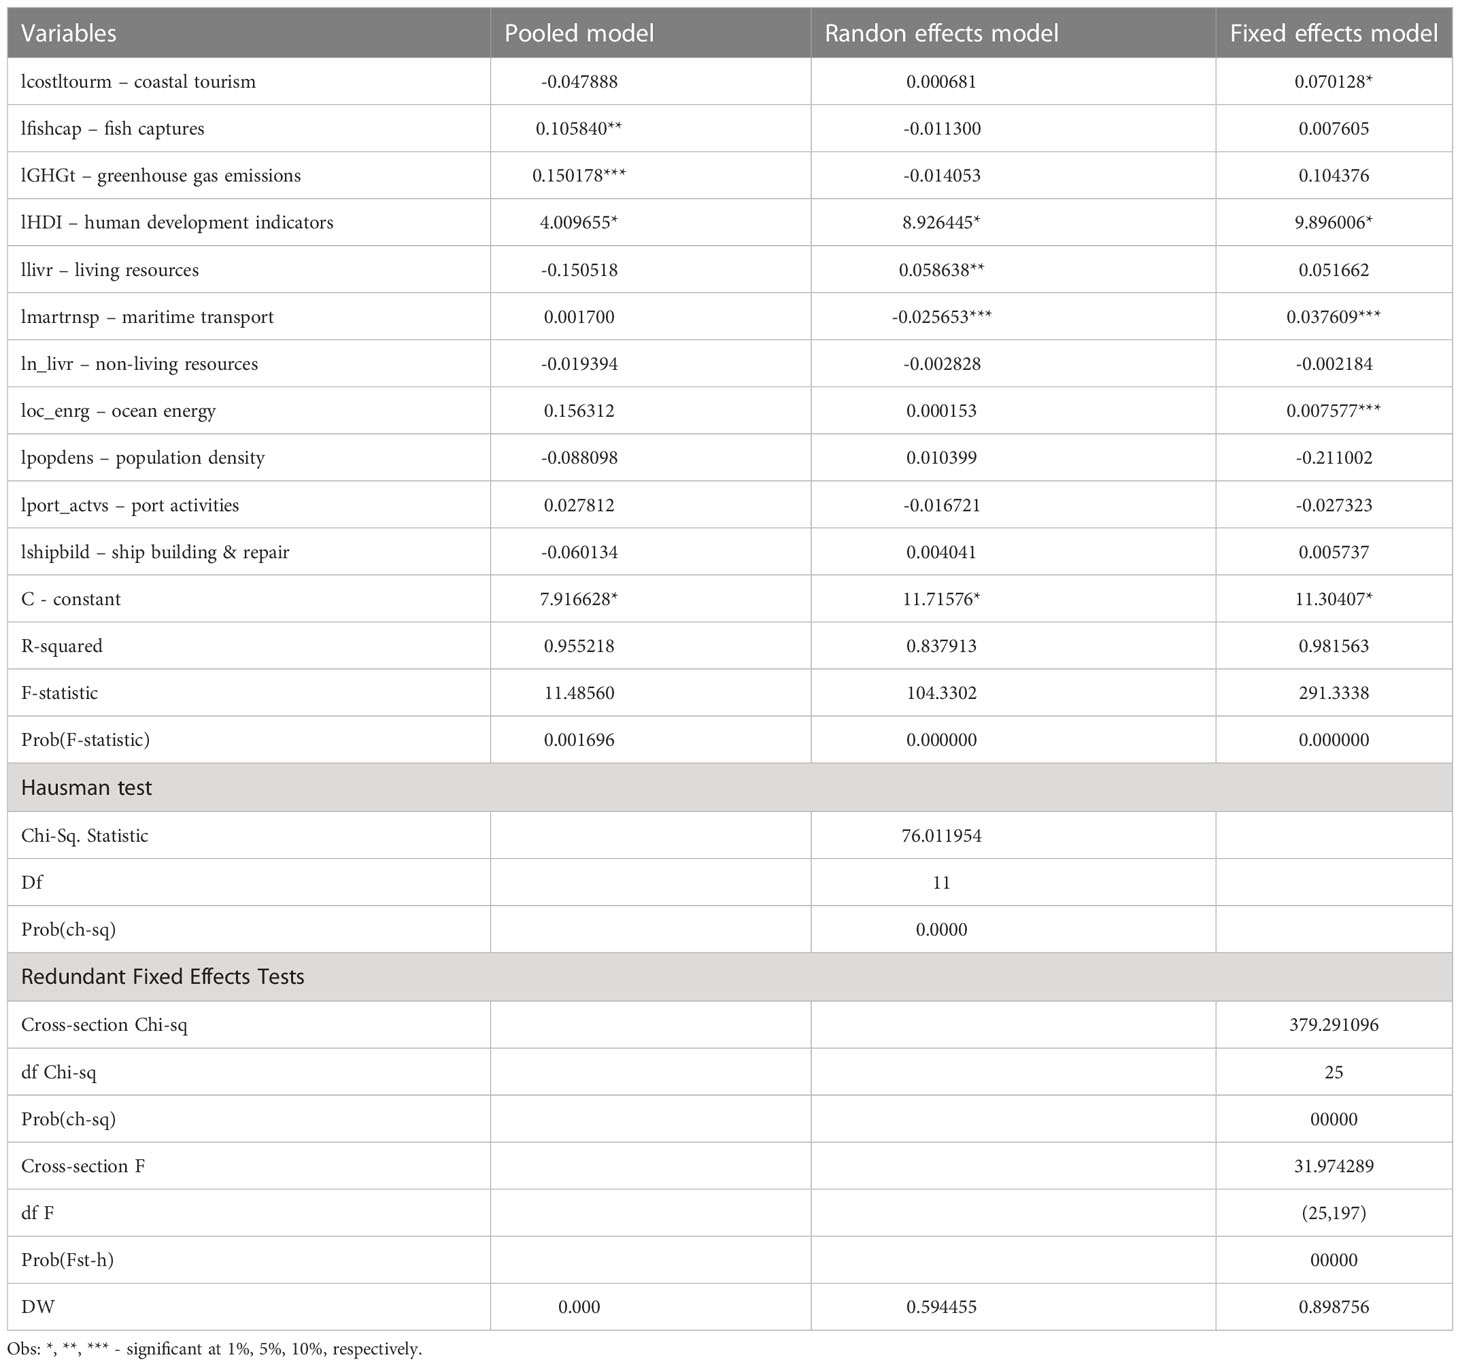
Table 3 Estimated panel data models.
4 Discussion
The impact of blue economic (BE) sectors on the economic performance of countries and regions is a relatively recent research line. The first paper (on the topic) found in a scientific journal was published in 2011 (Kaczynski, 2011). Since then, a reasonable number of articles have been published on the subject, which means that this research frame has been attracting more and more the interest of researchers. The most prolific are Ahmed and Thompson (2019), who focus on aquaculture as a way to expand the sustainability degree of the blue economy, Levin et al. (2019), who emphasize the role of the deep ocean, highlighting the scientific need for integrated global observation of the deep ocean, its state, and the key scientific issues and societal mandates that drive observational requirements over the coming years, and also Clapp et al. (2018) concerning the impact of climate change on the characteristics of the BE sectors. More specifically, the causal relationships presented in this economic research shows the influence of greenhouse gas emissions (De la Vara et al, 2020 and Bâdîrcea et al., 2021), maritime transport (Nogué-Algueró, 2020; Luhtala et al., 2021), marine living resources (Shamsuzzaman and Islam, 2018; Petrea et al., 2021) and port activities (Budoc, 2017) on PCI growth. However, no particular attention has been paid to the economic sectors’ impact using a panel data methodology. The Web of Science (WoS) database presents only two articles: the Bhattacharya and Dash (2021) one that studies the determinants of BE activities in 19 Asia-Pacific Island developing countries, especially those related to tourism and fishery; the authors highlight the importance of implementing sustainable ocean management policies to foster economic growth of the blue economy, and the one of Fratila et al. (2021), that analyzes the impact of the maritime transport sector on economic growth of EU countries during the 2007 to 2018 span. Following the theme of sustainability laid out in the previous investigation, this research also emphasizes the role of lobbyists and legislators in reducing the pollution degree of the economic sector through green investments in port infrastructures and environmentally friendly ships. The analysis also shows that the most influencing sectors of the blue economics are living resources, maritime transport and ocean energy production and the importance of implementing sustainable ocean management policies to foster economic growth of the blue economy.
This section adds some guidance to policymakers, namely: that the maritime, circular and blue economy (ocean energy, coastal tourism), sustainability and related areas are very interesting and important investment areas or sectors to promote economic and PCI growth since they create jobs and wealth that every country urgently needs; climate change, temperature reduction, emission mitigations or the reduction of GHG emissions must be addressed to achieve sustainability and meet international challenges (established in Paris and other international agreements).
5 Conclusions
This paper analyzes the impact of the different economic sectors that make up the BE on the economic and social growth of the countries of the E. U. using the span period 2010-2018. The methods used go from the Granger causality analysis, to pairwise correlation and panel data ones (FE, RE, PL models). Our empirical work reveals that the most influencing sectors of the blue economics are living resources, maritime transport and ocean energy production. The main limitations of this research lye in the availability of data. Only the period of economic crisis that began in 2008 with the bursting of the real estate bubble could be studied. The EU database got in Eurostat, the E. U. statistical system, has only data from the member countries during the period studied in this paper, lacking data for some key sectors of the blue economy, such as the generation of energy from ocean resources and others. Despite the fact that the BE is a relatively new topic, its role in the sustainability of the socio-economic development of countries is essential. More clear and comprehensive data in order to draw more revealing conclusions are needed urgently. An important consequence of these data limitation problems using the panel data methods is the probably presence, in the results (elasticities), of problems such as eventual multicollinearity among factors,heteroscedasticity and/or autocorrelation between the errors of the estimated models. All these problems need to be solved in future works since they affect the quality of the parameters, particularly in their signals, and thus, their economical interpretations, economic meaning, and economic implications.
Nonetheless, this article opens up future research lines that are quite enriching for the scientific landscape. On the one hand, it would be interesting to study the viability of the BE as an alternative to the energy crisis that the world has been experiencing in recent years and are facing again nowadays. On the other hand, the different global phenomena that are occurring (especially the COVID-19 pandemic and the 2022nd armed conflict between Russia and Ukraine) troubles the economic development of worldwide countries, which opens up the possibility of analyzing the impact of these phenomena on the different sectors of the blue economy. Despite the limitations encountered, this research is innovative and fills a gap in the literature.
The results of this research allow us to give some advice to policy makers, namely that they should consider the BE and related areas as crucial to invest private and public funds since they create employments, increase per capita income levels, and reduce GHG emissions. Consequently they reduce temperature, as well as, they promote economic growth and sustainable development. If policymakers want to increase economic and PCI levels in these regions, they should act on some variables or factors such as human development indicators, greenhouse gas emissions, living resources, maritime transports and ocean energies. More specifically, investments should be focused on activities such as the processing and distribution of seafood, passenger, freight and service maritime transport, or the production of renewable energy from offshore wind, tidal and wave power or energies. The results reveal that the BE is a good alternative to promote economic and social progress as well as per capita income growth. The factors that integrate the blue economy, as is the case of ocean energy, ports’ activities, shipbuilding and repair, maritime transport, coastal tourism, human development indicator, maritime fish capture, marine protected areas, and the reduction of greenhouse gas emissions are good factors to stimulate economic growth, richness and employment. As well, this research also shows that the factors of the blue economy that have more influence in per capita income are living resources, maritime transport and ocean energy production. Thus, it is essential to implement sustainable ocean management policies in order to foster economic growth and employment of the blue economy.
Data availability statement
The raw data supporting the conclusions of this article will be made available by the authors, without undue reservation.
Author contributions
Every author has contributed equally to the following: - Idea of the research - Database preparation - Methodology application - Writing of the research. All authors contributed to the article and approved the submitted version.
Funding
This research has been partially funded by CEIMAR.
Conflict of interest
The authors declare that the research was conducted in the absence of any commercial or financial relationships that could be construed as a potential conflict of interest.
Publisher’s note
All claims expressed in this article are solely those of the authors and do not necessarily represent those of their affiliated organizations, or those of the publisher, the editors and the reviewers. Any product that may be evaluated in this article, or claim that may be made by its manufacturer, is not guaranteed or endorsed by the publisher.
References
Agarwal B. (1986). Women, poverty and agricultural growth in India. J. Peasant Stud. 13:4, 165–220. doi: 10.1080/03066158608438309
Ahmed N., Thompson S. (2019). The blue dimensions of aquaculture: A global synthesis. Sci. Total Environ. 652, 851–861. doi: 10.1016/j.scitotenv.2018.10.163
Bâdîrcea R. M., Dragan C., Tanasie A., Axinte G., Radoi M. I., Enescu M. (2021). Cohesion performance and sustainable development progress in EU states. Rev. economía mundial 57:25–44. doi: 10.33776/rem.v0i57.3837
Barrett C. B., Reardon T., Webb P. (2001). Nonfarm income diversification and household livelihood strategies in rural Africa: concepts, dynamics, and policy implications. Food Policy 26 (4), 315–331. doi: 10.1016/S0306-9192(01)00014-8
Barrios E. (2008). Infrastructure and rural development: Household perceptions on rural development. Prog. Plann. - Prog. PLANN. 70, 1–44. doi: 10.1016/j.progress.2008.04.001
Bhattacharya P., Dash A. K. (2021). Determinants of BE in Asia-pacific island countries: A study of tourism and fisheries sectors. Ocean Coast. Manage. 211, 105774. doi: 10.1016/j.ocecoaman.2021.105774
Budoc R. L. (2017). Le développement des ports ultramarins: quels enjeux environnementaux? Développement durable territoires. Économie géographie polit. droit sociol. 8 (1). doi: 10.4000/developpementdurable.11564
Burnett J. W., BErgstrom J. C., Dorfman J. H. (2013). A spatial panel data approach to estimating US state-level energy emissions. Energy Econ. 40, 396–404. doi: 10.1016/j.eneco.2013.07.021
Clapp J., Newell P., Brent Z. W. (2018). The global political economy of climate change, agriculture and food systems. J. Peasant Stud. 45 (1), 80–88. doi: 10.1080/03066150.2017.1381602
Çoban S., Topcu M. (2013). The nexus between financial development and energy consumption in the EU: A dynamic panel data analysis. Energy Econ. 39, 81–88. doi: 10.1016/j.eneco.2013.04.001
De la Vara A., Gutiérrez C., González-Alemán J. J., Gaertner M. Á. (2020). Intercomparison study of the impact of climate change on renewable energy indicators on the Mediterranean islands. Atmosphere 11 (10), 1036. doi: 10.3390/atmos11101036
Eugenio-Martín J. L., Morales N. M., Scarpa R. (2004) Tourism and economic growth in Latin America countries: a panel data approach. Available at: http://www.feem.it/Feem/Pub/Publications/WPapers/default.htm.
European Commission (2021). The EU BE report. 2021 (Luxembourg: Publications Office of the European Union).
Ewing R., Hamidi S. (2015). Compactness versus sprawl: A review of recent evidence from the united states. J. Plann. Lit. 30 (4), 413–432. doi: 10.1177/0885412215595439
Fratila A., Gavril I. A., Nita S. C., Hrebenciuc A. (2021). The importance of maritime transport for economic growth in the European union: A panel data analysis. Sustainability 13 (14), 7961. doi: 10.3390/su13147961
Flores Tenorio P. (2017). Food price dynamics and price adjustment in the EU Vol. 61. Ed. McCorriston S. (Oxford, UK: Oxford University Press), 194, ISBN: ISBN: 9780198732396.
Fratila A., Gavril I. A., Nita S. C., HreBEnciuc A. (2021). The importance of maritime transport for economic growth in the European union: A panel data analysis. Sustainability 13 (14), 1–23. doi: 10.3390/su13147961
Gevorkyan A. (2017). Renewable versus nonrenewable resources: An analysis of volatility in futures prices. Aust. J. Agric. Res. Econ. 61 (1), 19–35. doi: 10.1111/1467-8489.12194
Gielen D., Boshell F., Saygin D., Bazilian M. D., Wagner N., Gorini R. (2019). The role of renewable energy in the global energy transformation. Energy Strat. Rev. 24, 38–50. doi: 10.1016/j.esr.2019.01.006
Hussain M. E., Haque M. (2016). Impact of economic freedom on the growth rate: A panel data analysis. Economies 4 (2), 5. doi: 10.3390/economies4020005
Kaczynski W. (2011). The future of blue economy: Lessons for European union. Found. Manage. 3 (1), 21. doi: 10.2478/v10238-012-0033-8
Kadir K., Sibel S. (2014). Determinants of tourist inflows to Romania: evidence from augmented panel gravity model. THE Ann. OF THE Univ. OF ORADEA 345:49–57.
Kilic C., Arica F. (2014). Economic freedom, inflation rate. Romanian J. Econ. Forecast. 17 (1), 160–176.
Kingwell R. S., Xayavong V. (2017). How drought affects the financial characteristics of Australian farm businesses. Aust. J. Agric. Res. Econ. 61 (3), 344–366. doi: 10.1111/1467-8489.12195
Kuo H. I., Chen C. C., Tseng W. C., Ju L. F., Huang B. W. (2008). Assessing impacts of SARS and avian flu on international tourism demand to Asia. Tourism Manage. 29 (5), 917–928. doi: 10.1016/j.tourman.2007.10.006
Levin L. A., Bett B. J., Gates A. R., Heimbach P., Howe B. M., Janssen F., et al. (2019). Global observing needs in the deep ocean. Front. Mar. Sci. 6, 241. doi: 10.3389/fmars.2019.00241
Liao C., Barrett C., Kassam K. (2015). Does diversification improve livelihoods? pastoral households in xinjiang, China. Dev. Change. 46, 1302–1330. doi: 10.1111/dech.12201
Liu F., Xiao X., Shang L., Huang X. (2021). Study on spatial-temporal dynamic change of vegetation coverage and its influencing factors in blue economic zone of Shandong peninsula: taking qingdao as a case. In IOP Conf. Series: Earth Environ. Sci. 632 (2), 022045. doi: 10.1088/1755-1315/632/2/022045
Luhtala H., Erkkilä-Välimäki A., Eliasen S. Q., Tolvanen H. (2021). Business sector involvement in maritime spatial planning–experiences from the Baltic Sea region. Mar. Policy 123, 104301. doi: 10.1016/j.marpol.2020.104301
Mosbah S., Ryerson M. S. (2016). Can US metropolitan areas use Large commercial airports as tools to bolster regional economic growth? J. Plann. Lit. 31 (3), 317–333. doi: 10.1177/0885412216653100
Motengwe C., Alagidede P. (2016). Maturity effects in futures contracts on the SAFEX market. Agrekon 55 (4), 331–355. doi: 10.1080/03031853.2016.1243064
Mthanti T., Ojah K. (2017). Entrepreneurial orientation (EO): Measurement and policy implications of entrepreneurship at the macroeconomic level. Res. Policy 46 (4), 724–739. doi: 10.1016/j.respol.2017.01.012
Nogué-Algueró B. (2020). Growth in the docks: Ports, metabolic flows and socio-environmental impacts. Sustain. Sci. 15 (1), 11–30. doi: 10.1007/s11625-019-00764-y
O'Laughlin B. (2016). Pragmatism, structural reform and the politics of inequality in global public health. Dev. Change 47 (4), 686–711. doi: 10.1111/dech.12251
Paramati S. R., Alam M. S., Chen C. F. (2017). The effects of tourism on economic growth and CO2 emissions: A comparison between developed and developing economies. J. Travel Res. 56 (6), 712–724. doi: 10.1177/0047287516667848
Petrea S. M., Zamfir C., Simionov I. A., Mogodan A., Nuţă F. M., Rahoveanu A. T., et al. (2021). A forecasting and prediction methodology for improving the BE resilience to climate change in the Romanian lower Danube euroregion. Sustainability 13 (21), 11563. doi: 10.3390/su132111563
Phelan A., Ruhanen L., Mair J. (2020). Ecosystem services approach for community-based ecotourism: Towards an equitable and sustainable blue economy. J. Sustain. Tourism 28 (10), 1–21. doi: 10.1080/09669582.2020.1747475
Plink N., Semeoshenkova V., Eremina T., Ershova A., Mushket I. (2021). Improvement of maritime management as a key aspect of sustainable development and blue growth in the Russian federation. J. Mar. Sci. Eng. 9 (11), 1212. doi: 10.3390/jmse9111212
Roberts B. R., White M. P., Davison S. M. C., McMeel O., Eatock C., Kellett P., et al. (2021). Public preferences for policy intervention to protect public health from maritime activities: A 14 European country study. Global Environ. Change 71, 102397. doi: 10.1016/j.gloenvcha.2021.102397
Shamsuzzaman M. M., Islam M. M. (2018). Analysing the legal framework of marine living resources management in Bangladesh: Towards achieving sustainable development goal 14. Mar. Policy 87, 255–262. doi: 10.1016/j.marpol.2017.10.026
Sulanke E., Rybicki S. (2021). Community development quotas and support of small-scale fisheries as two key concepts for blue growth in fisheries. Front. Mar. Sci. 8. doi: 10.3389/fmars.2021.752764
Tang C. F., Tan E. C. (2015). Does tourism effectively stimulate malaysia's economic growth? Tourism Manage. 46, 158–163. doi: 10.1016/j.tourman.2014.06.020
UNCTAD (2014). The state of commodity dependence 2014 (Geneva: United Nations Conference on Trade and Development).
Van den Broeck G., Swinnen J., Maertens M. (2016). Global value chains, Large-scale farming, and poverty: Long-term effects in Senegal. SSRN Electronic J. doi: 10.2139/ssrn.2828093
World Bank (2013). Fish to 2030–prospects for fisheries and aquaculture (Washington, DC: World Bank Report Number 83177-GLB).
World Bank (2017). The potential of the blue economy: Increasing long-term benefits of the sustainable use of marine resources for small island developing states and coastal least developed countries (Washington, DC: World Bank Group).
Keywords: blue economy factors, correlation, causality, panel data model, sustainability
Citation: Martínez-Vázquez RM, Milán-García J, Pires Manso JR and De Pablo Valenciano J (2023) Impact of blue economy sectors using causality, correlation and panel data models. Front. Mar. Sci. 10:1034054. doi: 10.3389/fmars.2023.1034054
Received: 01 September 2022; Accepted: 17 January 2023;
Published: 27 January 2023.
Edited by:
Sebastiano Stramaglia, University of Bari Aldo Moro, ItalyReviewed by:
Raja Oloan Gurning, Sepuluh Nopember Institute of Technology, IndonesiaJoão Paulo Jorge, Centre for Tourism Research, Development and Innovation (CITUR), Portugal
Donato Fernández Navarrete, Autonomous University of Madrid, Spain
Copyright © 2023 Martínez-Vázquez, Milán-García, Pires Manso and De Pablo Valenciano. This is an open-access article distributed under the terms of the Creative Commons Attribution License (CC BY). The use, distribution or reproduction in other forums is permitted, provided the original author(s) and the copyright owner(s) are credited and that the original publication in this journal is cited, in accordance with accepted academic practice. No use, distribution or reproduction is permitted which does not comply with these terms.
*Correspondence: Juan Milán-García, am1nNDgzQHVhbC5lcw==