 Shuwen Jia
 Yuanchao Li†
 Jie Shen
- Institute of Marine Ecology, Hainan Academy of Ocean and Fisheries Sciences, Haikou, China
Montipora digitata is a species belonging to the Acroporidae. In the Indo-Pacific region, M. digitata is widely distributed and is the dominant species of scleractinian coral in the South China Sea, however, there are currently no molecular markers suitable for assessing the species genetic diversity. Here, restriction-site associated DNA sequencing (RAD-seq) was used to isolate and characterize polymorphic microsatellite loci. A total of 317,361 RAD-tags were obtained using RAD-seq, including 6,778 microsatellite loci. Primer pairs for 106 loci were ordered and twenty-one polymorphic loci, that amplified reliably were identified. The number of alleles per locus were 2-7, observed heterozygosity was 0.111-0.556 with an average value of 0.285, and expected heterozygosity was 0.105- 0.802, with an average value of 0.536. Before Bonferroni correction 13 loci deviated significantly from the expectations of Hardy-Weinberg equilibrium (P < 0.05), after correction, two microsatellite loci deviated significantly (P < 0.0002). The polymorphic information content (PIC) ranged from 0.100-0.778, with 12 loci highly polymorphic (PIC > 0.5), six moderately polymorphic (0.25 < PIC < 0.5), and three loci with low polymorphism (PIC < 0.25). The microsatellite loci developed here will be effective tools for conservation genetic research on M. digitata.
Introduction
Owing to the impact of global climate change and human activities, for example, sea surface temperature increases, China’s coral reef ecosystem has declined rapidly, and coastal coral reefs cover has been reduced by at least 80% in the past 30 years (Hughes et al., 2012; Hughes et al., 2017). Scleractinian corals are an important component of coral reef ecosystems and studying the genetic structure and connectivity of scleractinian corals is important for the protection and restoration of coral reef ecosystems. However, there are only a few studies on genetic diversity of scleractinian corals in the South China Sea (Wu et al., 2021) and microsatellite markers have been developed for some scleractinian corals such as Porites lutea (Hou, 2018; Li et al., 2020), Pocillopora damicornis (Luo et al., 2020), Platygyra acuta (Yang, 2013), Galaxea fascicularis (Su, 2017), distributed in the South China Sea. Previous studies have increased our understanding of scleractinian corals in the South China Sea, for example in P. lutea, it was found that there was genetic differentiation between Hainan Island and Xisha (Hou, 2018), and that seasonal differences in surface temperature at different latitudes might be driving genetic differentiation (Luo et al., 2022). However, there are many species of scleractinian coral in the South China Sea, and the understanding of the genetic diversity and genetic structure across scleractinian coral in the South China Sea is limited.
Montipora digitata (Dana, 1846) belongs to the family Acroporidae and is widely distributed in the South China Sea (Gu et al., 2017; Zhou et al., 2017). In recent years, field investigations in the South China Sea have found that M. digitata has replaced P. lutea as the dominant species in some areas, such as Dazhou Island of Wanning (Zhou et al., 2017). However, there are no molecular markers available for M. digitata, which makes up a growing proportion of South China Sea scleractinian corals.
Genetic work with scleractinian corals is difficult because they have symbiotic relationships with zooxanthellae. Because a large number of zooxanthellae live within the gastrodermal cells of the coral (Gleason and Wellington, 1993; Douglas, 2003). DNA extracted directly from coral tissue, will contain a large amount of zooxanthellae DNA. At present, the most commonly used method to separate the zooxanthellae from the coral hosts is to treat live coral at high temperatures, inducing the endosymbionts to leave the host, a process also known as bleaching (Li et al., 2020; Luo et al., 2020). Batch separation requires multiple sites and equipment that is not easy to operate and would not be an efficient step in preparing DNA for population genetic analysis. However, heat-induced bleaching can be performed using a small number of individual corals, and combined with bioinformatics methods, residual zooxanthellae DNA can be removed to obtain microsatellite markers of coral hosts. (Li et al., 2020; Luo et al., 2020). Restriction site-associated DNA sequencing (RAD-seq) greatly reduces the cost of genome sequencing and is not limited to the reference genome (Li et al., 2021; He et al., 2022).
In this study, M. digitata was bleached at high temperatures and RAD-seq was conducted to screen the coral for host-specific microsatellite. The new polymorphic microsatellite markers provide effective tools for obtaining genetic data useful for conservation.
Materials and methods
Coral samples for RAD-seq were collected from Luhuitou of Hainan Island (18.2167136, 109.4840218). The depths of the collection points were 2-10 m. A piece of live coral, approximately 5 cm long, was transported in seawater to the laboratory. After recovery in the indoor ocean simulation system, the coral was placed in a 43 cm3 tank for heat bleaching treatment. After bleaching, it was frozen in liquid nitrogen and stored at -80 °C until DNA extraction. Tissues from nine corals were sampled from a population in Yinyu (16.58074097, 111.7079768) in the Xisha Islands and tissues from two individuals were sampled from Shiyu (16.54108719, 111.7526088) and Langhuajiao (16.46873192, 111.5773425) in the Xisha Islands, respectively. One tissue sample was collected from each reef, the interval between each reef was at least 2 m. Each tissue sample was approximately 2 cm in length and stored in absolute ethanol. After being transported back to the laboratory, tissues were it was stored in a refrigerator at -80 °C. Six individuals, including all individuals from Shiyu and Langhuajiao, and two randomly selected individuals from Yinyu were used for microsatellite discovery via RAD-seq and initial polymorphism screening.
Reduced-representation genome sequencing (RRGS) and microsatellite primer design
Artificial bleached coral tissue from Luhuitou was used for RAD-seq. RAD-seq-library generation and sequencing were completed in Genedenovo (Guangzhou, China). The CTAB method (Doyle and Doyle, 1987) was used to extract genomic DNA from each tissue sample and DNA quantity and quality were assessed using a NanoDrop 2000 (Thermo Fisher Scientific, Waltham, MA) and a Qubit (Thermo Fisher Scientific, Waltham, MA), as well as gel electrophoresis. Genomic DNA was digested using a restriction endonuclease (EcoRI) and P1 adapters with a unique 4-8 bp barcode sequence, were then ligated to DNA fragments using T4 ligase (NEB, Ipswich, MA, USA). Then DNA fragments were sheared randomly using a Branson Sonicator (model SX 30, Branson Ultrasonics, Danbury, CT, USA). The sheared DNA was purified, eluted and separated, and 300-700 bp corresponding DNA fragments were taken for purification by gel electrophoresis. Then, selected DNA fragments end were repaired, and dATP overhangs were added. Illumina sequencing adapters were added using NEBNext® ULtra™DNA Library Prep Kit (NEB, USA), and PCR amplification and enrichment were performed. Finally, AMPure XP (Beckman Coulter, Brea, CA, USA) was used to purify the PCR products. Agilent 2100 biological analyzer (Agilent, Santa Clara, CA) was used to detect the sequencing library, and real-time PCR was used to quantify the library. Sequencing was carried out on NovaSeq 6000 sequencer using PE 150 sequencing strategy. Raw reads were processed to get high quality reads using fastp v. 0.18.0 (Chen et al., 2018) according to three stringent filtering standards: 1) remove reads where the proportion of N greater than 10%; 2) remove reads where the quality value of Q ater accounts for more than 50% of the whole read; and 3) remove reads aligned to the barcode adapter. Read1 were clustered using stack v. 1.46 (Catchen et al., 2011). Read2 were clustered according to the clustering result of read1, and then spliced. After splicing, the stack sequence with read1 and the conting sequence with read2 were aligned to the Symbiodiniaceae genome (Symbiodinium microadriaticum, Gonziodinium microadriaticuBreviolum minutum, Shoguchi et al., 2013; Beedessee et al., 2015; Shoguchi et al., 2015; Symbiodinium kawagutii, Lin et al., 2015) and the Symbiodiniaceae sequences removed. After filtering, the stack and conting sequences were spliced to construct RAD-tags to be used as reference sequences.
All reference sequences were searched using MISA software (http://pgrc.ipk-gatersleben.de/misa/) for microsatellite loci. The minimum repeat number of each motif was set as15, six, and five times for mono-, di-, and trinucleotide motifs, respectively; and four times for tetra-, penta-, and hexanucleotide motifs. When designing primers, adjacent microsatellite sequences that were separated by less than 100 bp were regarded as single microsatellite loci. Based on the flanking sequences at both ends of the microsatellites, primers for microsatellites were designed using Primer 3 v2.3.6 (http://primer3.sourceforge.net) under default settings, with the size of PCR products ranging from 100 to 300 bp. The universal FAM tail (GAAGGTGACCAAGTTCATGCT; Chao et al., 2022; Fan et al., 2023) was added to the 5’ end of forward primers (Wuhan Tianyi Huayu Gene Technology Co., Ltd.). PCR amplification was performed in a total reaction volume of 25 μL that included 12.5μL 2 ×PCR Master Mix, 0.2μL forward primer (10μmol/L), 0.6 μL reverse primer (10μmol/L), 0.4μL FAM labeled primer (10μmol/L), 100ng template DNA, and finally supplemented with ddH2O. Amplification was performed according to the following procedure: one cycle at 95 °C for 2min for initial denaturation, 30 cycles of: denaturation at 95 °C for 20sec, annealing at 50-55 °C for 20sec, and extension at 72 °C for 20sec, eight cycles of: denaturation at 95 °C for 20sec, annealing at 53 °C for 20sec, and extension at 72 °C for 30sec, and lastly a final extension at 72 °C for 5min.
PCR products with fluorescence labels were separated on an ABI 3730XL, and GeneMarker 3.0 used to identify genotypes. MicroChecker v.2.2.3 (Van Oosterhout et al., 2004) was used to check for genotyping errors and null alleles. The observed number of alleles (NA), effective number of alleles (NE), observed heterozygosity (HO), expected heterozygosity (HI), Shannon information index (I), inbreeding coefficient within populations (FIS), and Hardy-Weinberg equilibrium (HWE) were calculated using GenAlEx 6.5 (Peakall and Smouse, 2006). Linkage disequilibrium (LD) between each pair of loci was calculated using ARLEQUIN v3.5 (Excoffier and Lischer, 2010). Polymorphism information content (PIC) was calculated using PIC_CALC V. 0.6 (Germplasm Resources and Engineering Breeding Office, Yellow Sea Fisheries Research Institute, Chinese Academy of Fishery Sciences).
Results
After filtering, a total of 1,396,195,302 bp of high-quality data were generated by the Illumina NovaSeq6000 NGS platform (Table 1). After excluding the data of Symbiodiniaceae, a total of 317,361 reference contigs for analysis were obtained using RAD-seq on the genome of M. digitata. The longest contigs was 2209 bp, shortest contigs was 157 bp, and average sequence length was 311 bp.

Table 1 Summary of genomic sequences generated by RAD-seq.
A total of 6,778 microsatellite loci were identified from the M. digitata data. Among them, 2,255 were trinucleotides, accounting for 33.27% of the total number of microsatellite loci, 1,705 were tetranucleotides, accounting for 25.15% of the total number. Dinucleotides, mononucleotides, pentanucleotides, and hexanucleotides had 1094, 719, 714, and 291 microsatellite loci, respectively, accounting for 16.14, 10.61, 10.53, and 4.29% of the total number, respectively (Table 2, Figure 1). The distribution of microsatellite repeat motifs in M. digitata is shown in Figure 2. Among the mononucleotides, the dominant motif was A/T, with 695, this accounted for 10.25% of the total number of microsatellite loci. In dinucleotides, the dominant motif was AT/AT, with 446, accounting for 6.58% of the total. Among the trinucleotides, the dominant repeat unit was AAT/ATT, with 712, accounting for 10.50% of the total. Among the tetranucleotides, AAAT/ATTT was the dominant motif, with 375, accounting for 5.53% of the total. Among the pentanucleotides, AAAGG/CCTTT was the dominant motif, with 93, and 1.37% of the total number of microsatellite loci. Among the hexanucleotides, AACCCT/AGGGTT was the dominant motif, with 38, accounting for 0.56% of the total number of microsatellite loci. One hundred and six microsatellite primers with PCR products of approximately 200 bp were randomly selected, and polymorphism was assessed for each locus using six individuals. Thirty-seven pairs of primers could be amplified clearly and were polymorphic. Finally, 21 highly polymorphic loci were selected for genetic analysis using nine tissue from Yinu (Table 3, Figure 3). The presence of null alleles at a nine loci (Table 4). The number of alleles per locus ranged from 2–7, Ho was 0.111-0.556, and HE was 0.111-0.802. Twelve loci were highly polymorphic (PIC > 0.5), six were moderately polymorphic (0.25 < PIC < 0.5), and three were less polymorphic (PIC < 0.25). Before Bonferroni correction 13 loci deviated significantly from the expectations of Hardy-Weinberg equilibrium (P < 0.05), after correction, two microsatellite loci deviated significantly (P < 0.0002). The linkage disequilibrium analysis of 21 SSR marker loci showed there were 18 pairs of paired points with significant linkage disequilibrium out of 210 total comparisons (8.57%, Table 5). See Table 6 for full summary of genetic diversity.
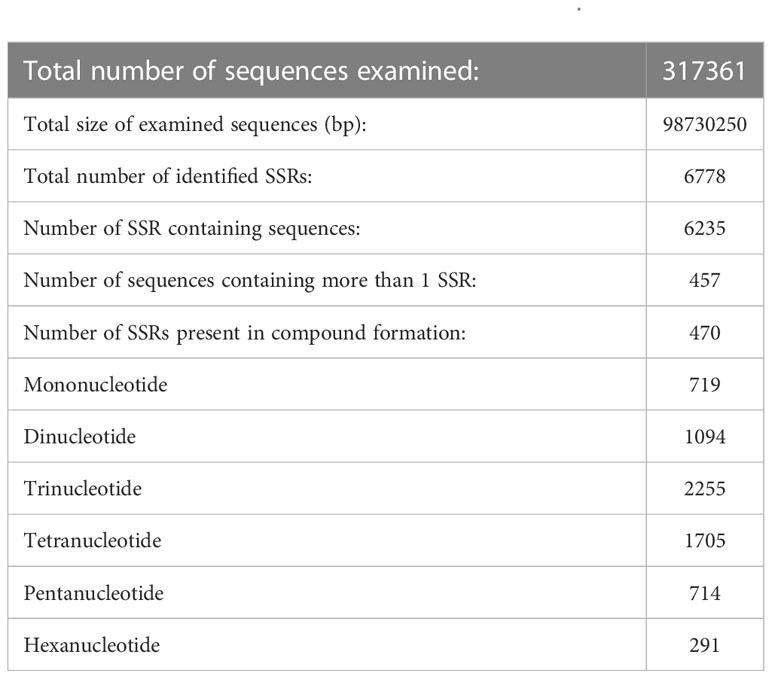
Table 2 SSR motif information statistics of M. digitata.
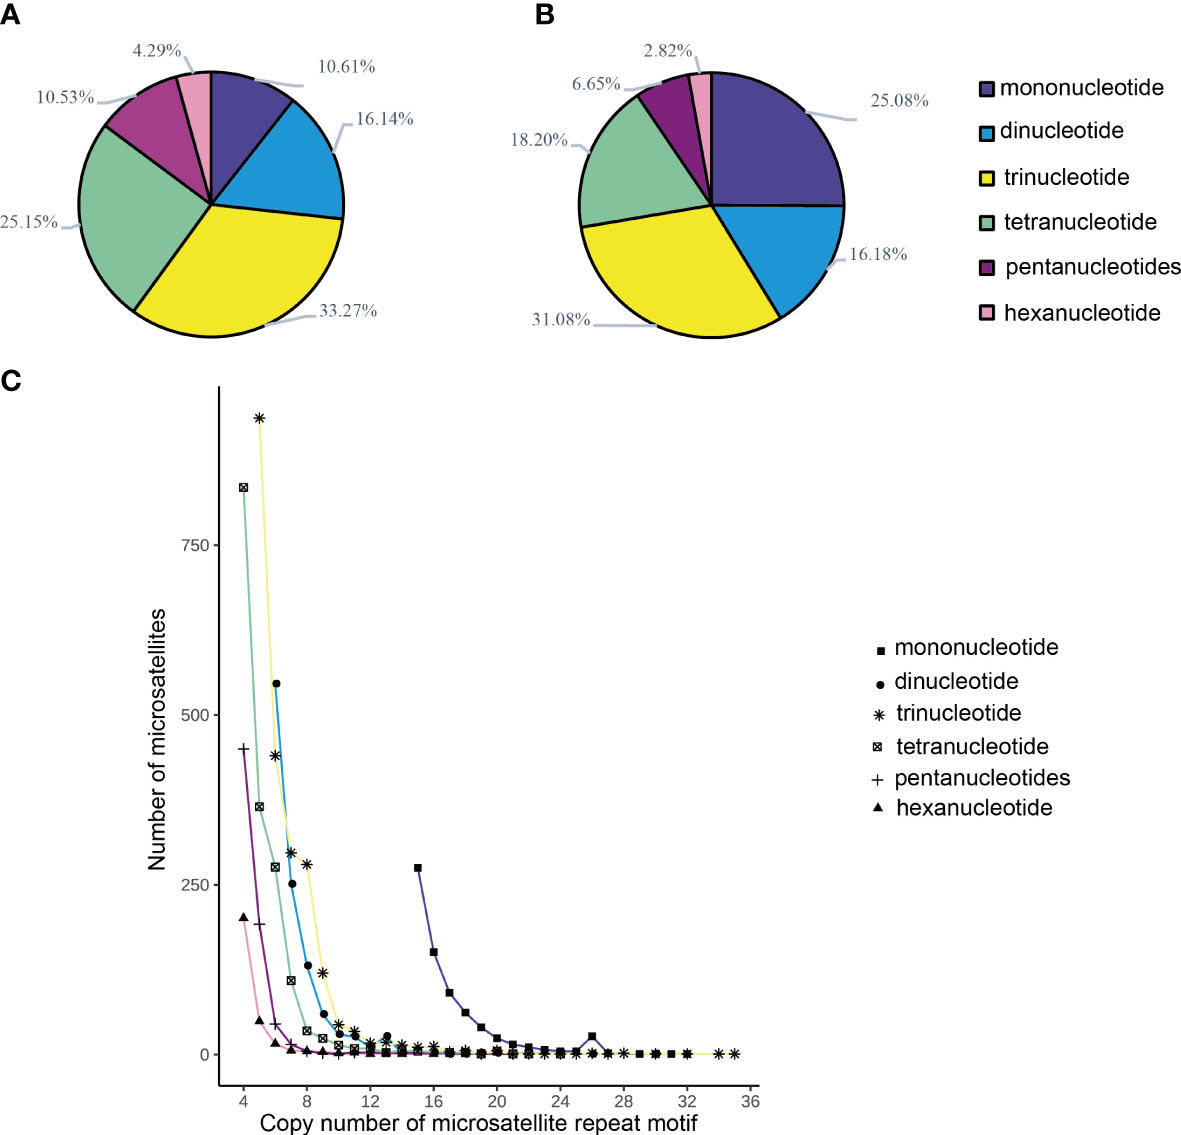
Figure 1 (A) The proportion of different motifs of microsatellites in M. digitata. (B) The production of difference motifs of total length of microsatellites in M. digitata. (C) Distribution of number of base repetitions of microsatellites repeat motifs in M. digitata.
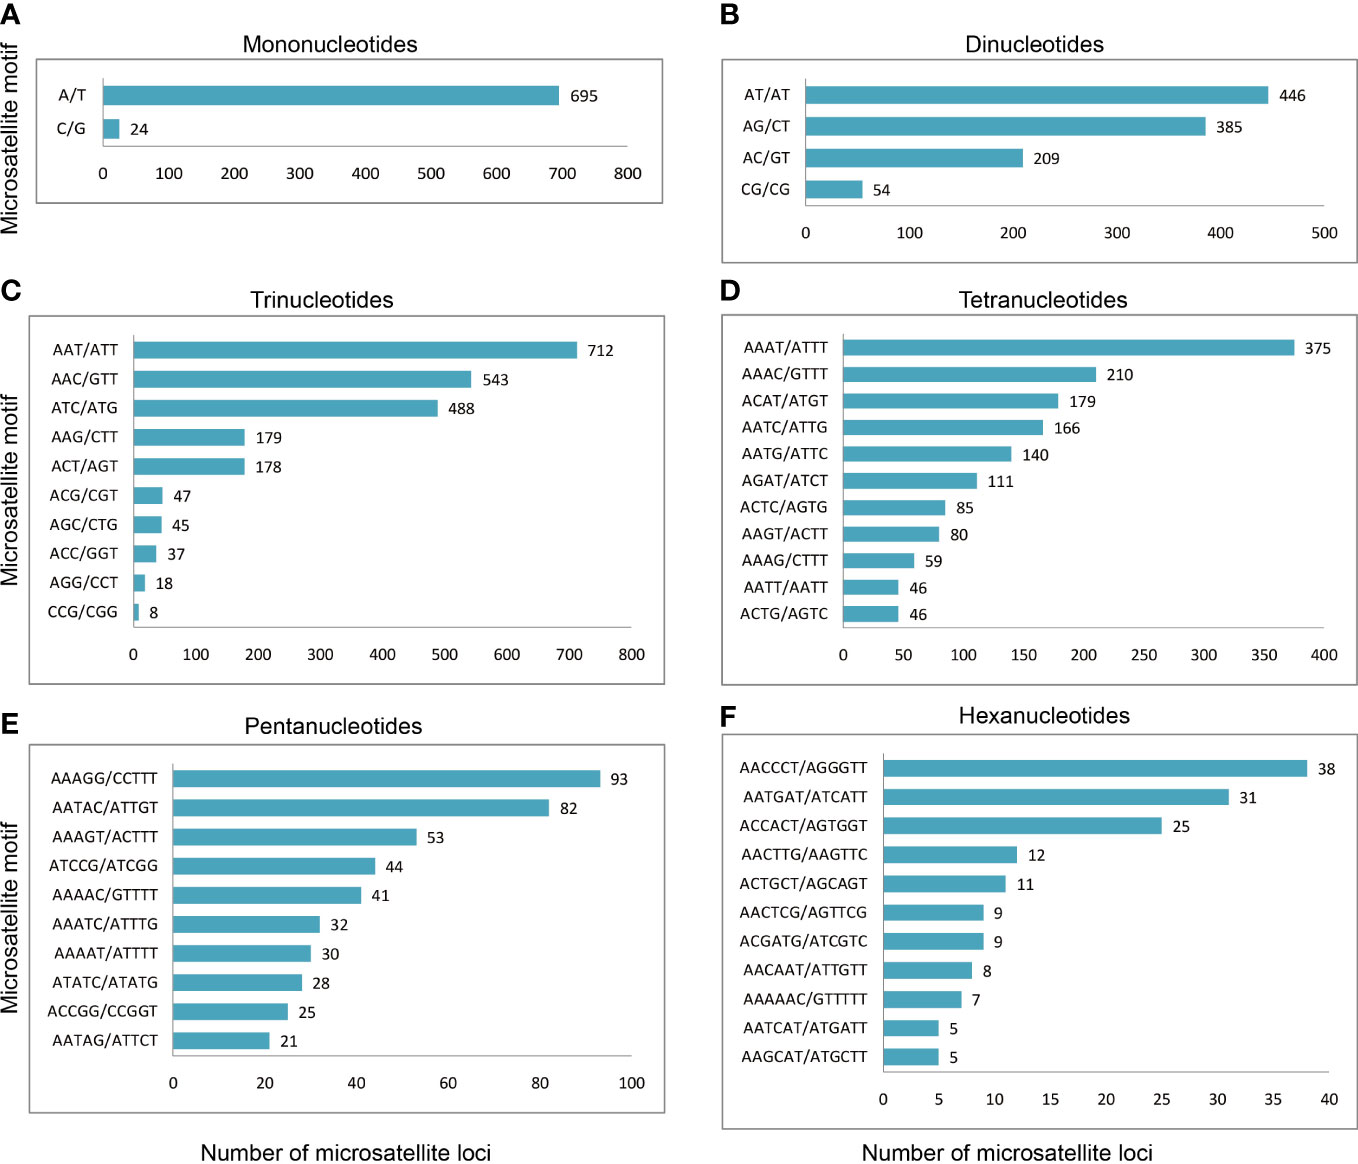
Figure 2 The distribution of microsatellite motifs in M. digitata. (A–F) The distribution of microsatellite motifs in the mono-, di-, tri-, tetra-, penta-, and hexanucleotide motif, respectively. Only the top ten repeat motifs are shown in (D–F). The number after the column represents the number of repeat motifs.
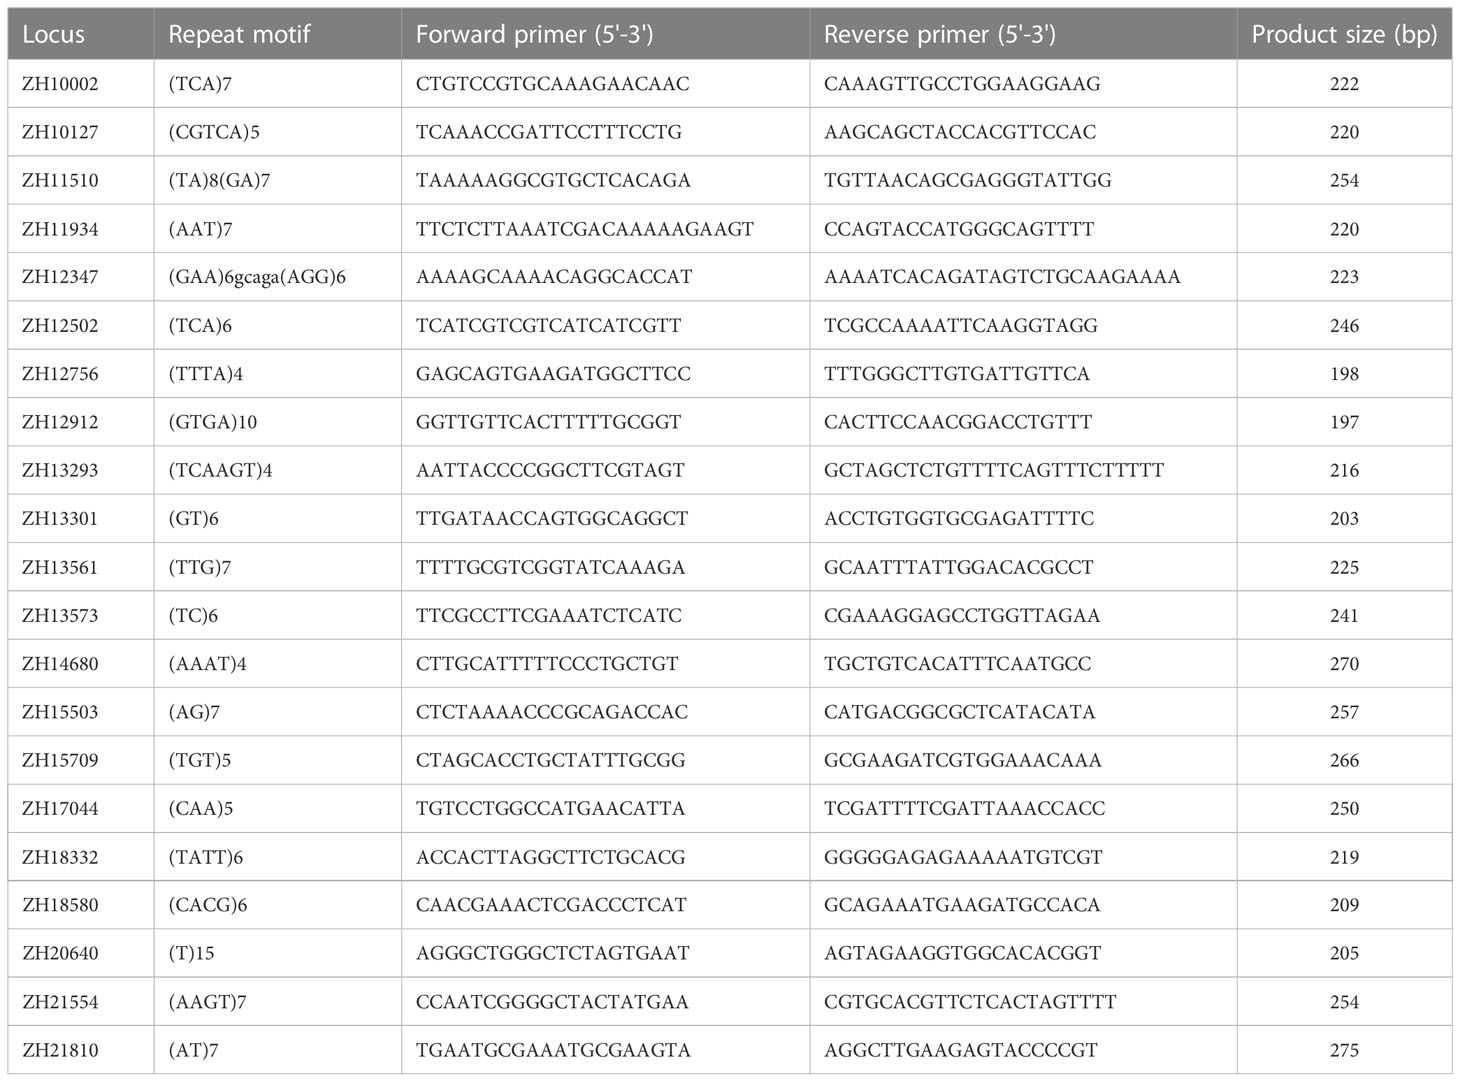
Table 3 Twenty one pairs of microsatellites primer information.
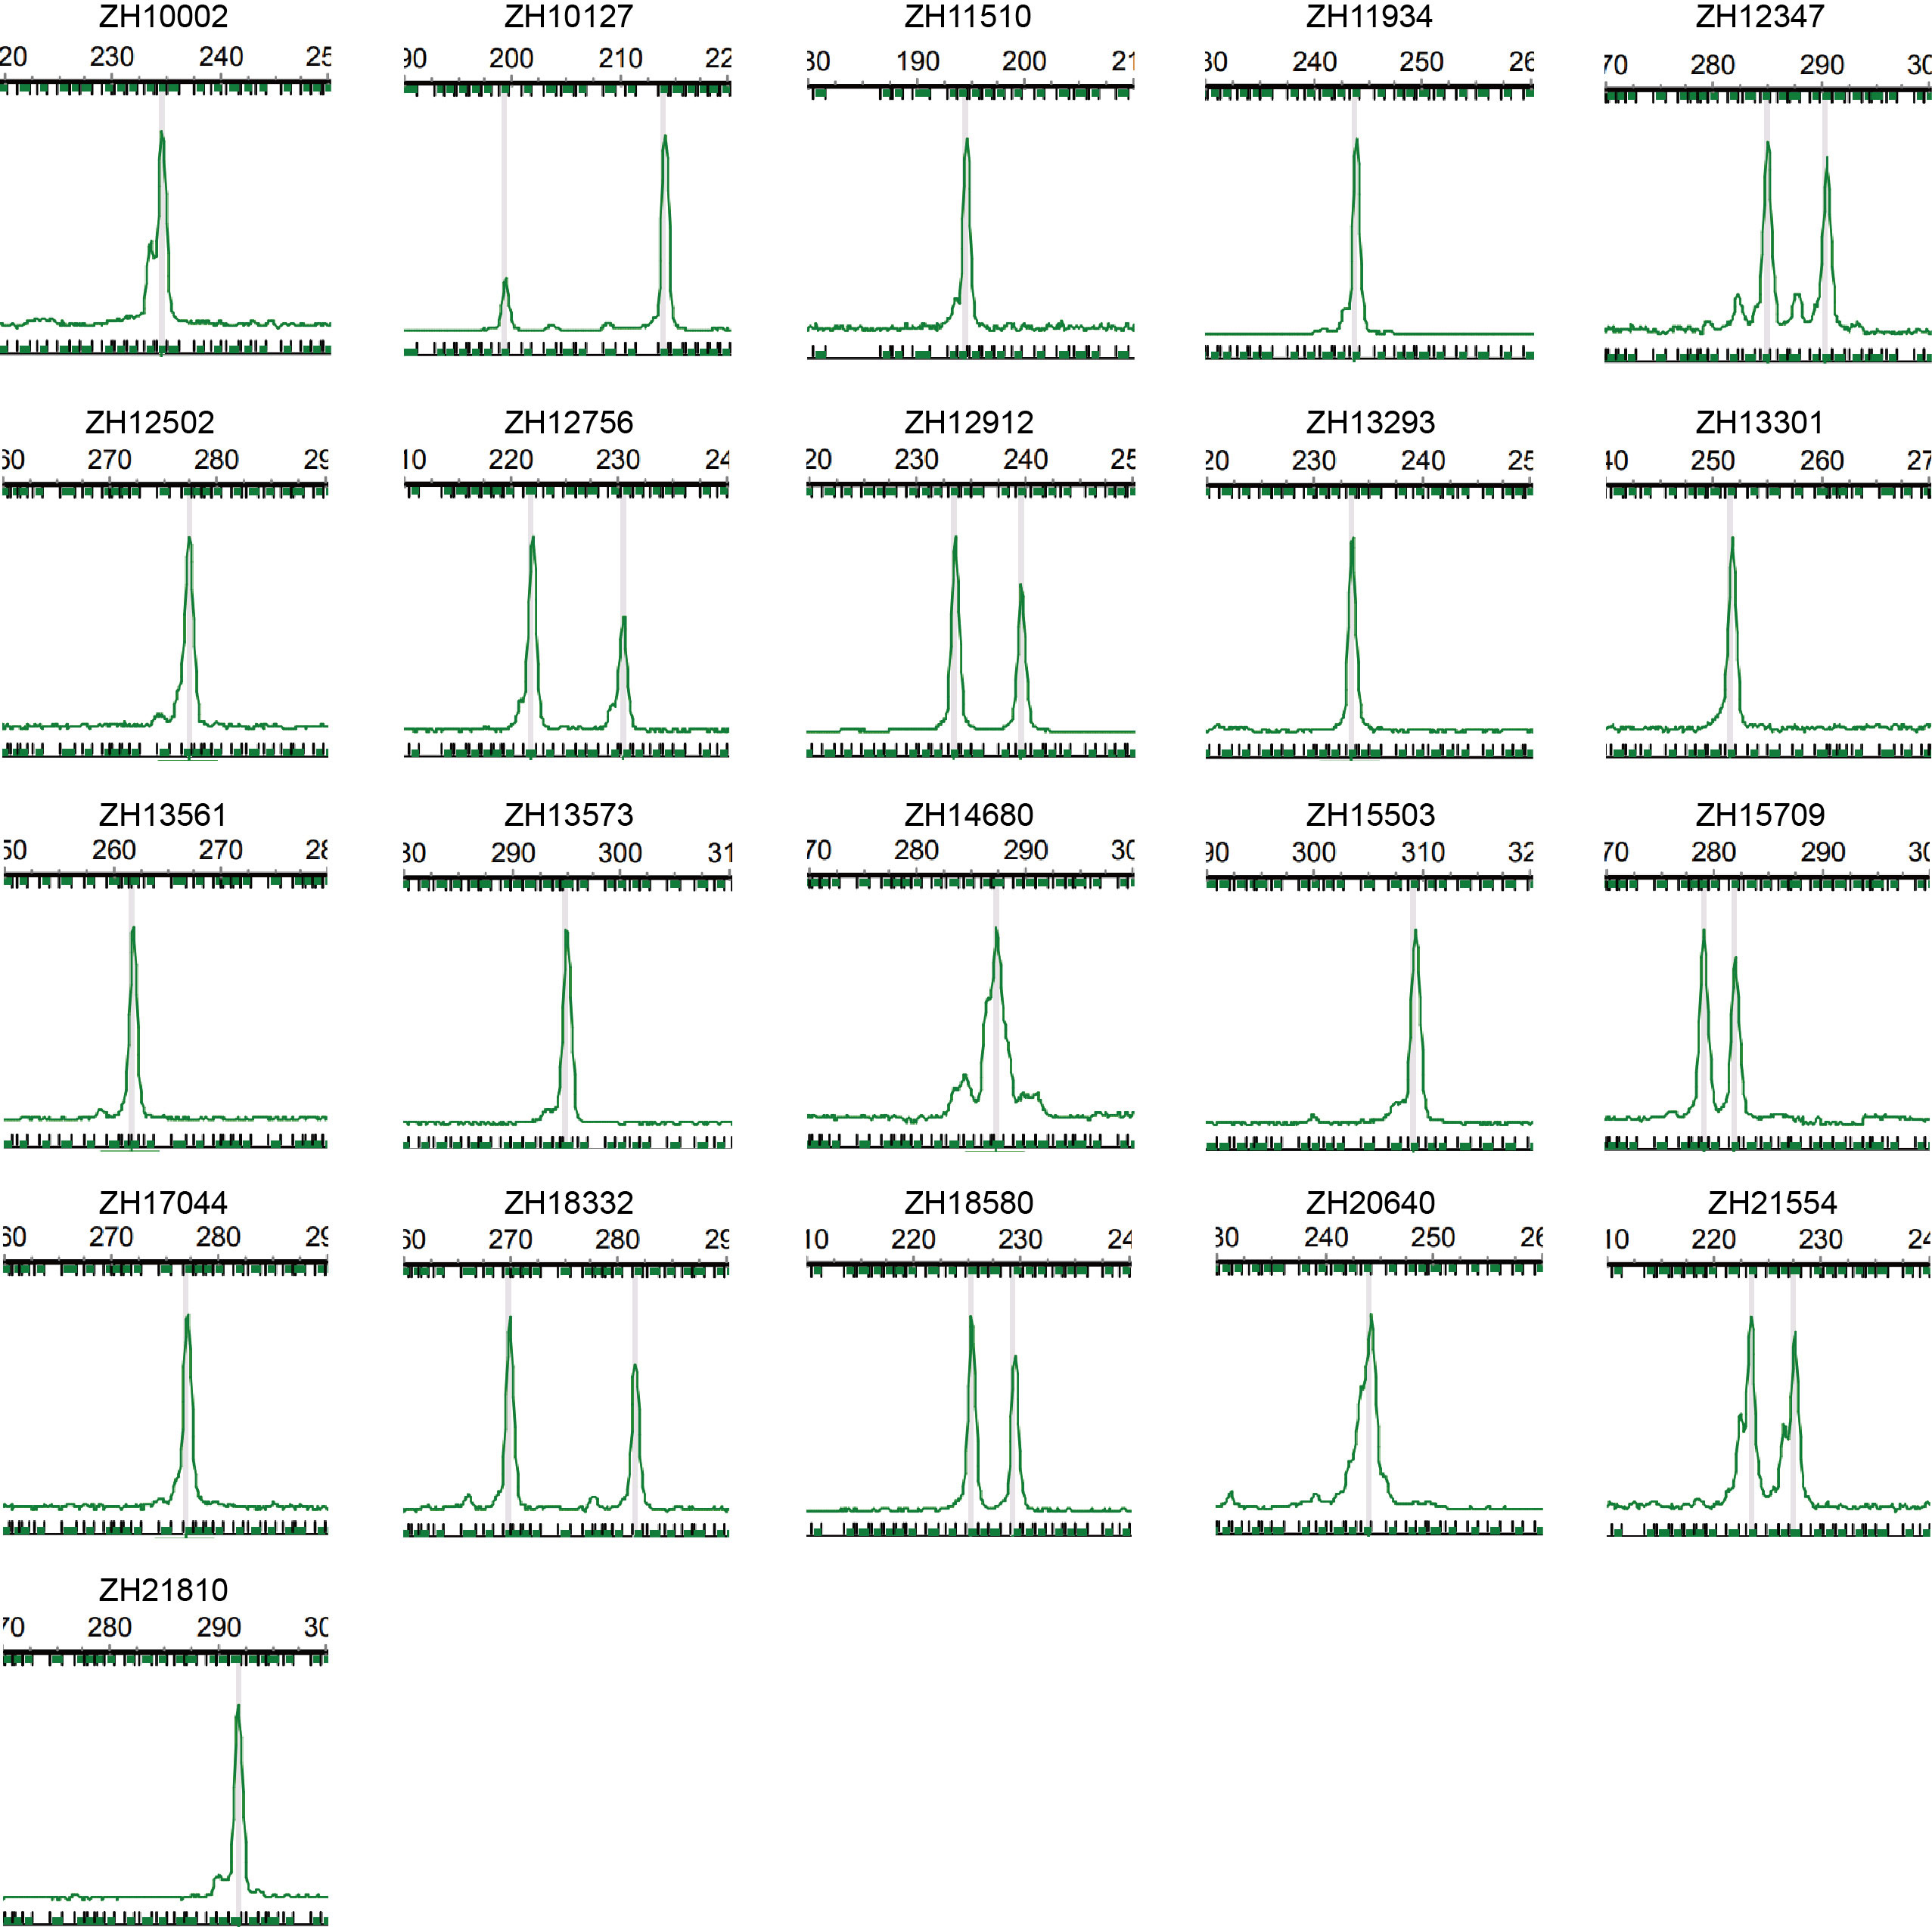
Figure 3 Peak diagram of capillary electrophoresis detection of 21 pairs of primers of M. digitata.
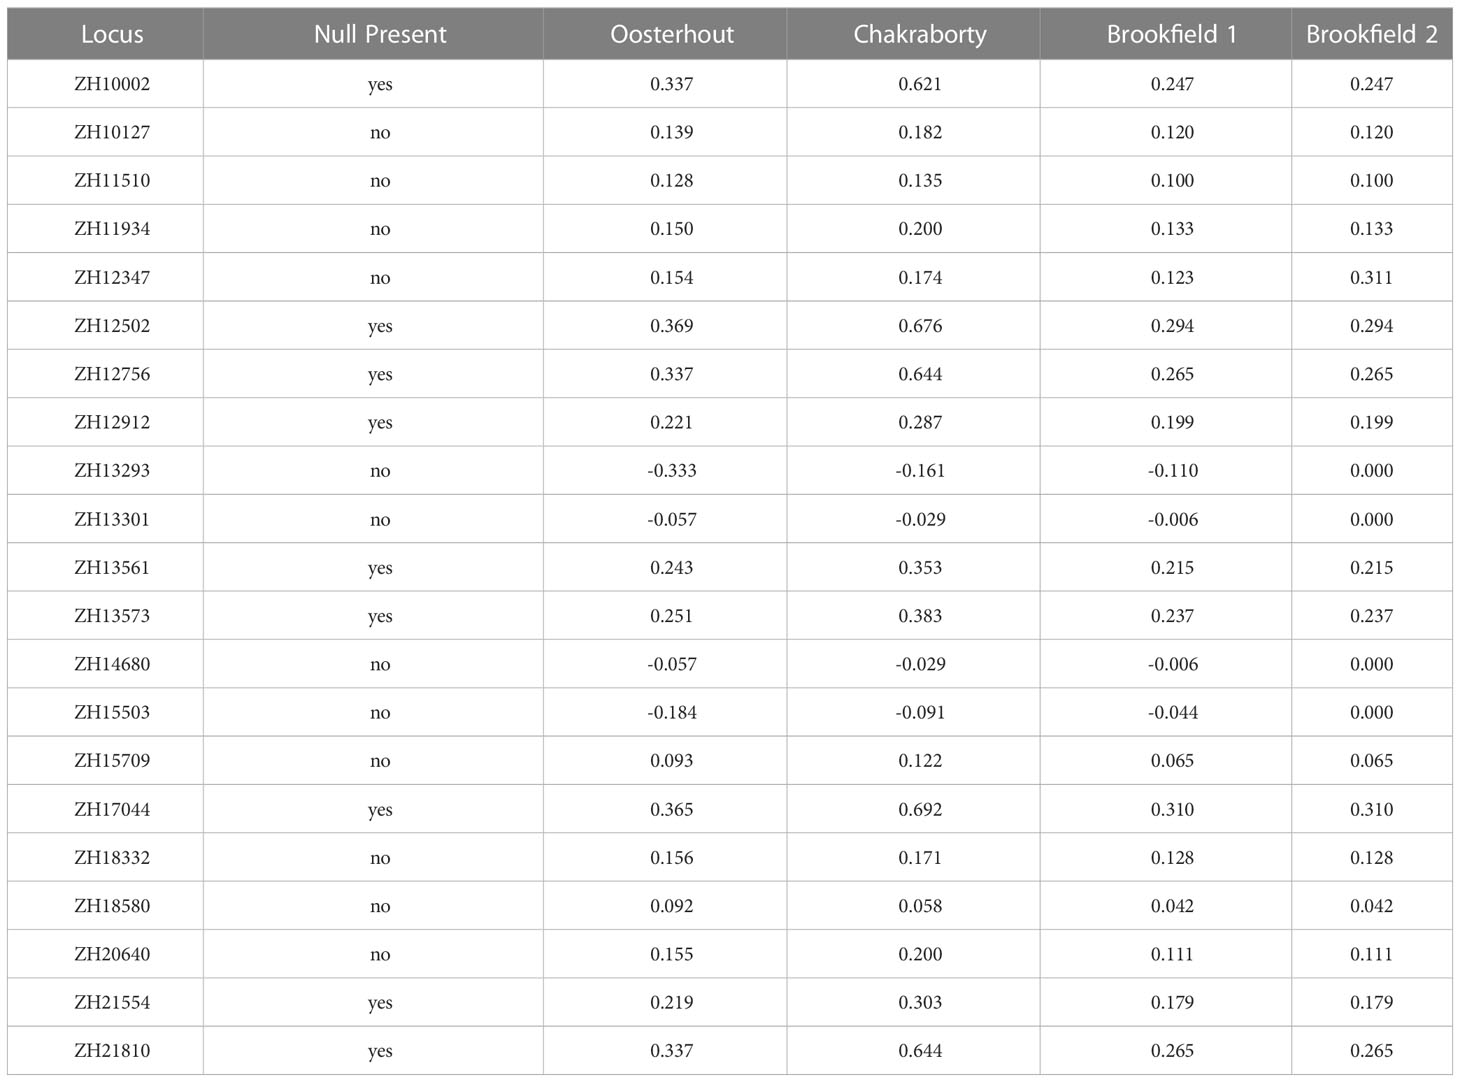
Table 4 Results of null alleles at 21 microsatellite loci.
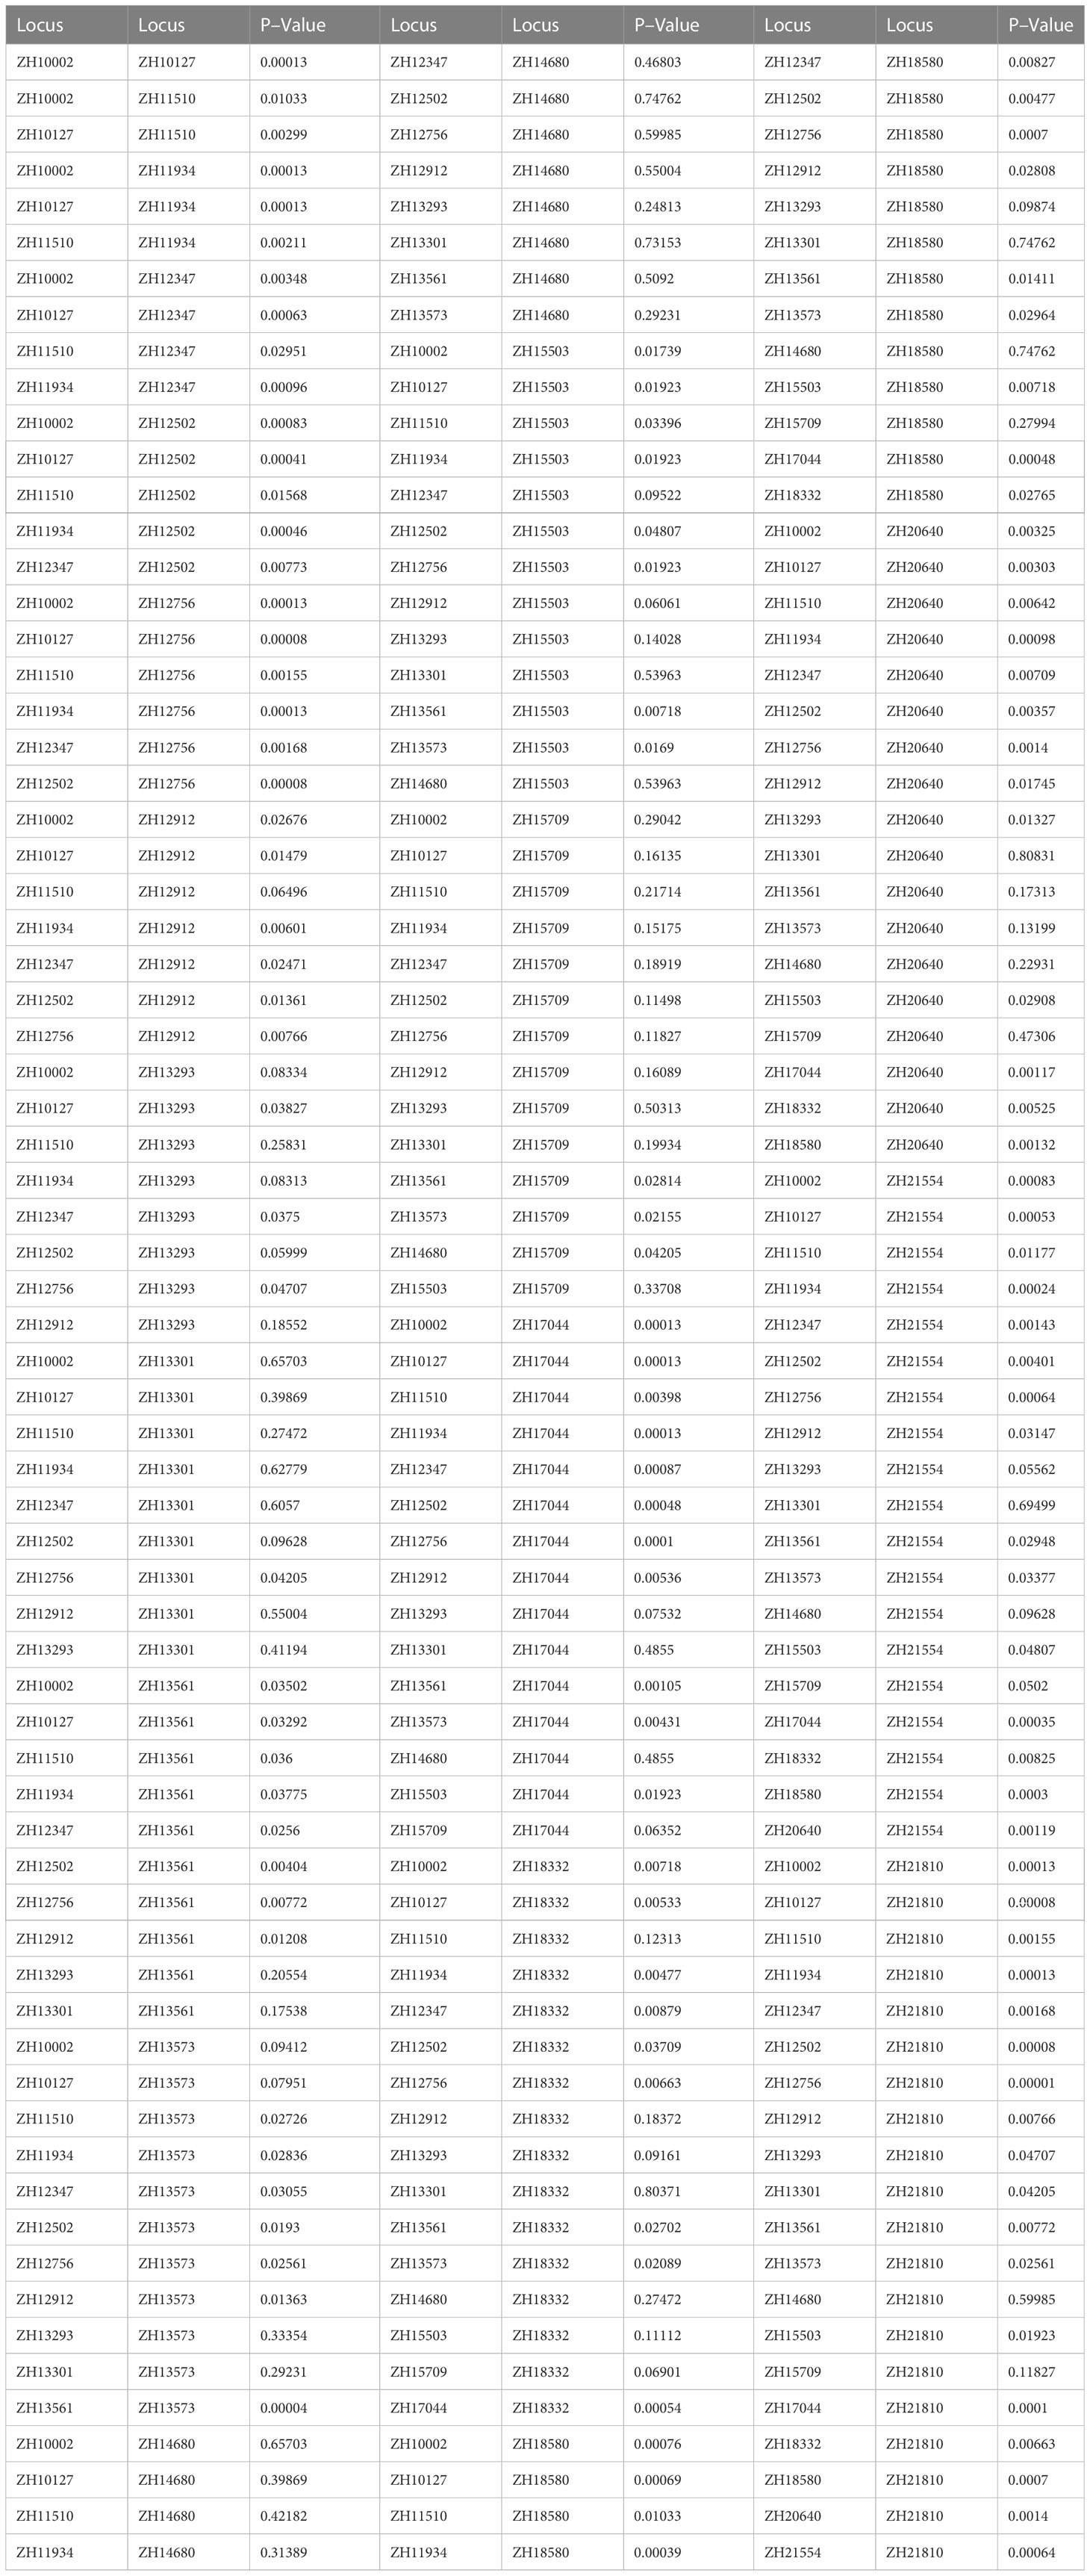
Table 5 Significance test of 21 microsatellite linkage disequilibrium.
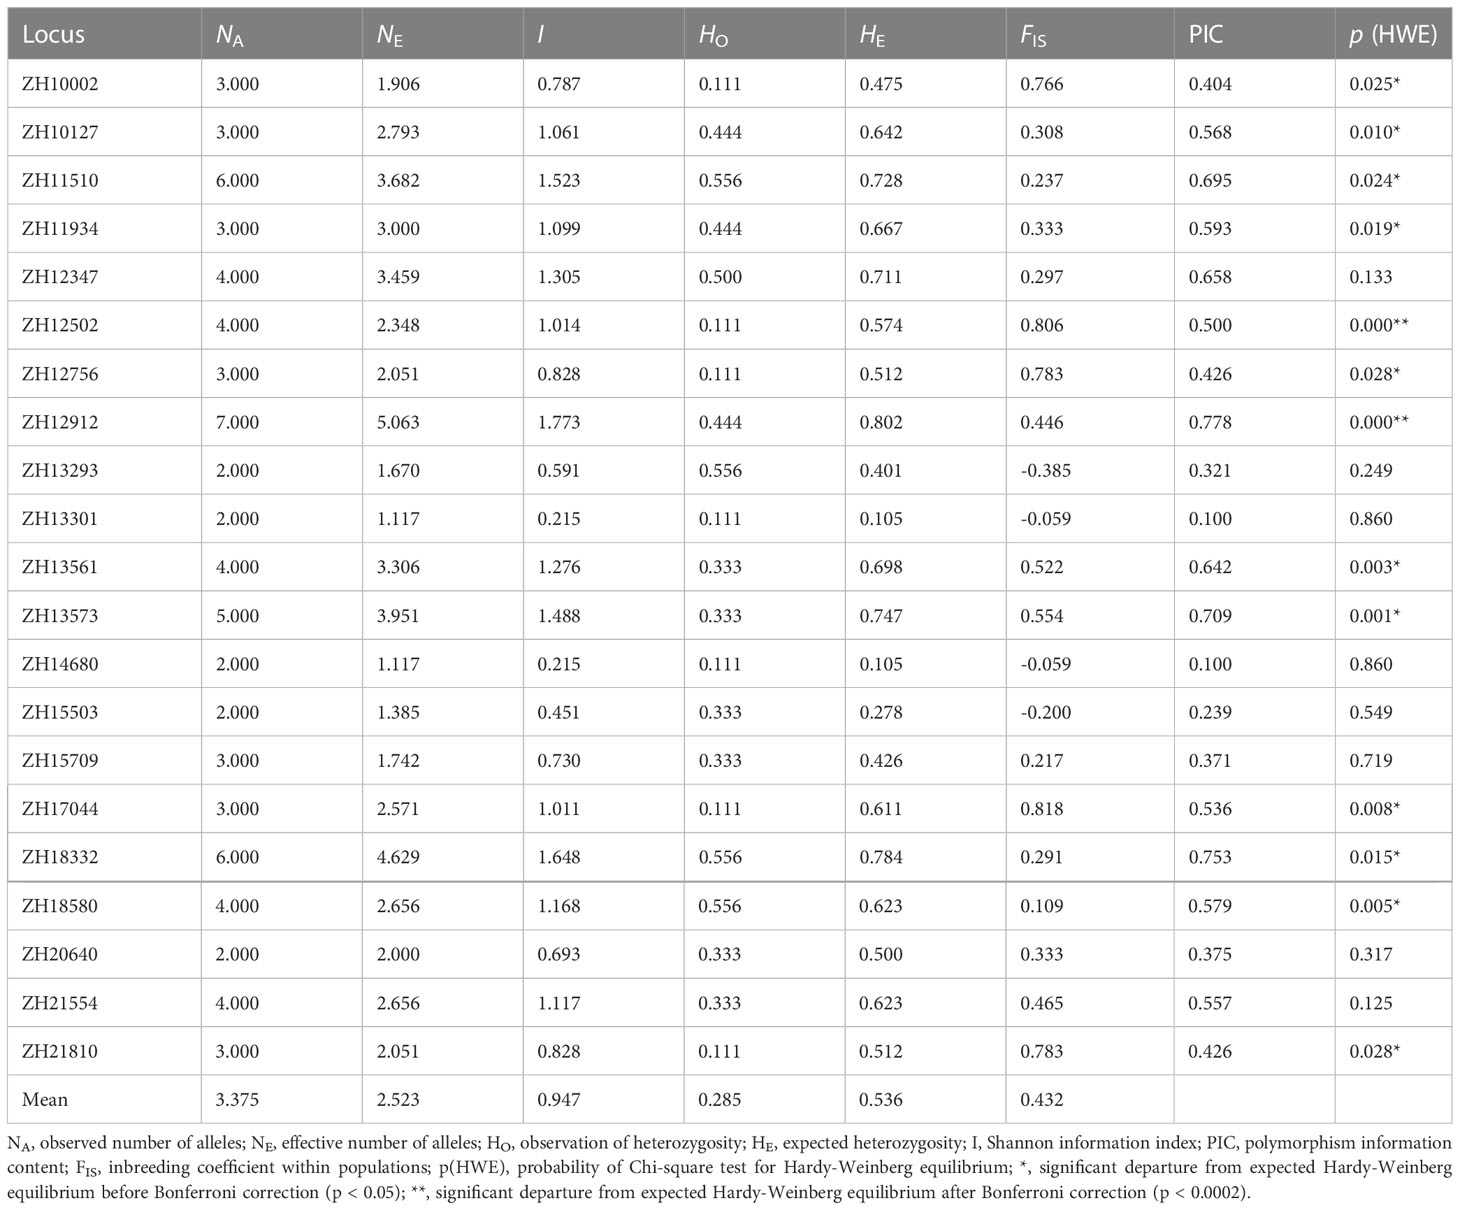
Table 6 Characteristics of 21 newly developed polymorphic microsatellite markers in M. digitata.
Discussion
In this study, 6,778 microsatellite loci were detected from RAD-seq data of M. digitata, with a distribution frequency of 2.14%. This distribution frequency was similar to that of Parus palustris (2.2%; Wan et al., 2016), Patinopecten yessoensis (1.4%; Ni et al., 2018), and Clematis (2.11%; Song et al., 2022) but was much lower than those of Datnioides pulcher (16.1%; Qu et al., 2019) and Pelteobagrus vachellii (20.52%; Wang et al., 2021). This indicates a significant difference in the abundance of microsatellites among different species. This result is consistent with the findings of Liu et al. (2021).
The microsatellite loci of M. digitata are dominated by trinucleotides, followed by tetranucleotides, which is consistent with results reported for other cnidarians. Ruiz-Ramos and Baums (2014) studied 11 species of cnidarians and found that the highest abundance of microsatellites in Anthozoa and Hydrozoa were trinucleotides and tetranucleotides. This is similar to the distribution of microsatellite loci in other invertebrates. Among the 33 animal species counted in this study (Table 7), the dominant microsatellite motif of most invertebrates is mainly mononucleotides (Tenebrio molitor, Zhu et al., 2013; Phenacoccus Solenopsis, Luo et al., 2014;Galeruca daurica; Zhang et al., 2016), dinucleotides (Exopalaemon carinicauda, Duan et al., 2016) or trinucleotides (Eucryptorrhynchus chinensis, Wu et al., 2016; Tetranychus dichromata, Wang et al., 2013). However, it is significantly different from that of vertebrates, which are dominated by mononucleotides and dinucleotides (Qi et al., 2015; Tang et al., 2022).
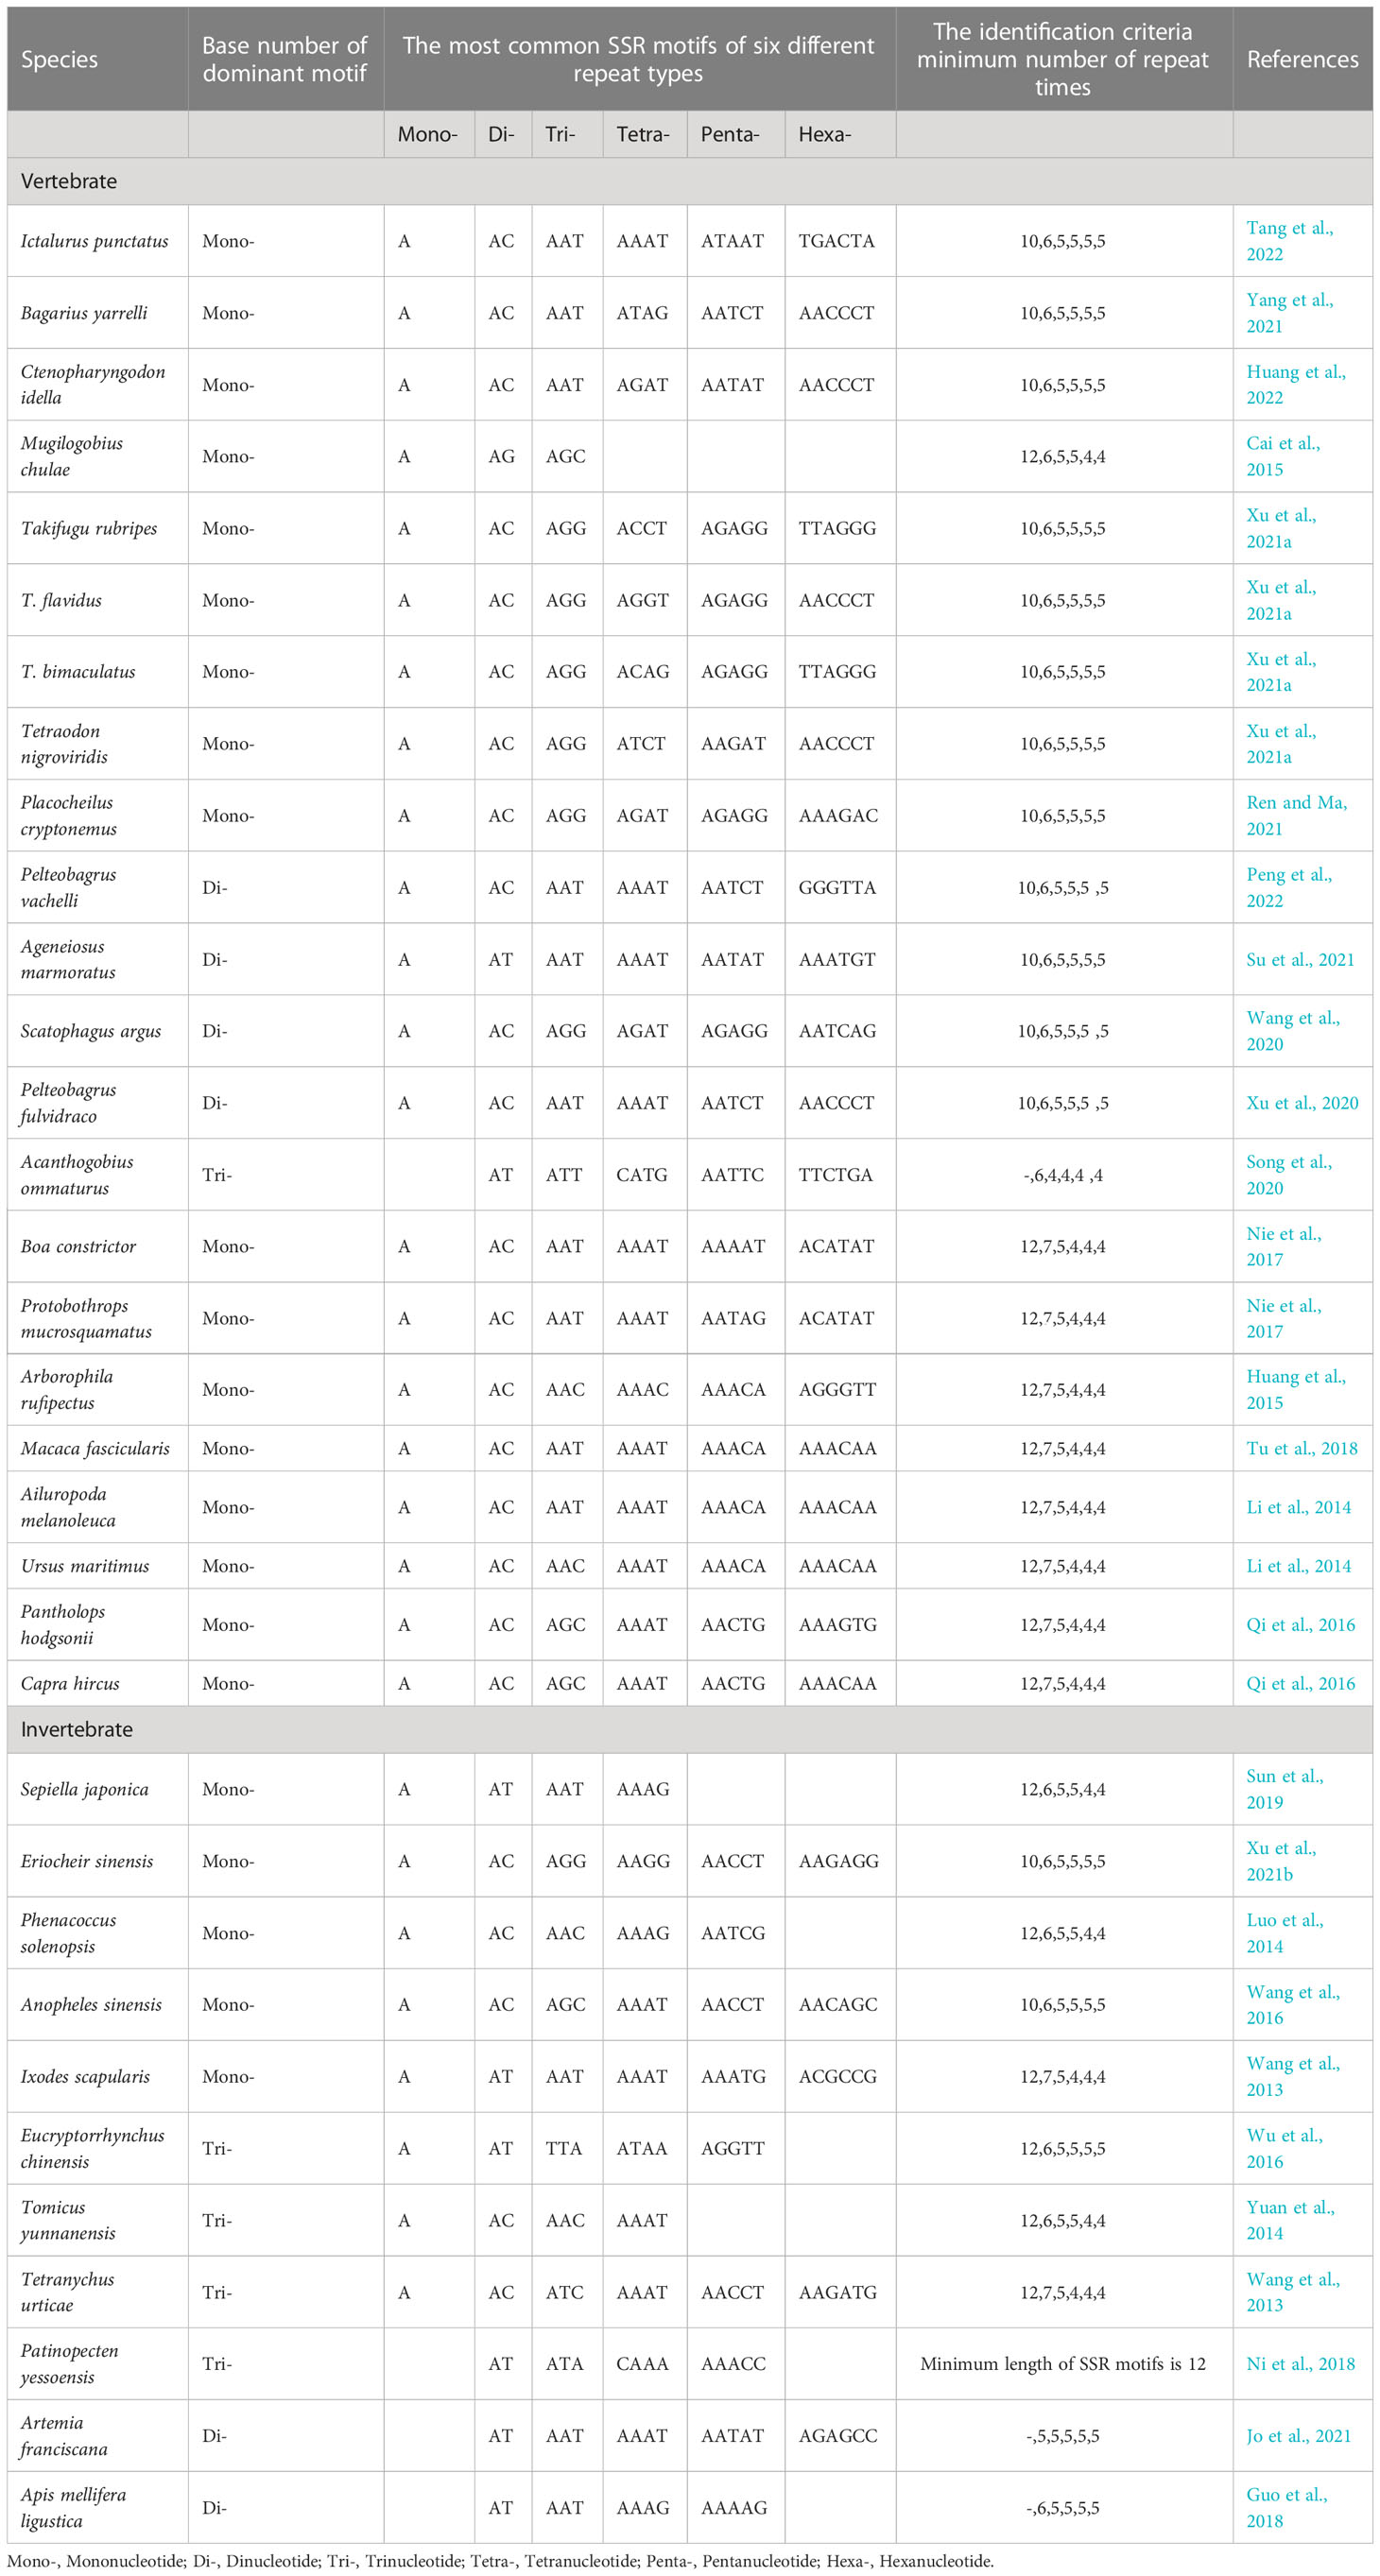
Table 7 Statistics of microsatellite characteristics of 33 published studies.
The dominant motifs of mononucleotides, dinucleotides, trinucleotides, and tetranucleotides in M. digitata are A\T, AT\AT, AAT\ATT, and AAAT\ATTT, respectively, similar to previous microsatellite distribution research results (Wang et al., 2013; Jo et al., 2021; Su et al., 2021). In mononucleotides, A\T is the dominant motif of most species (Wang et al., 2013; Luo et al., 2014; Qi et al., 2015; Wu et al., 2016; Liu et al., 2021; Su et al., 2021). Among dinucleotides, AC is the most common motif, however, AT is also common in invertebrates such as Ixodes scapularis (Wang et al., 2013), E.chinensis (Wu et al., 2016), P.yessoensis (Ni et al., 2018), and Artemia franciscana (Jo et al., 2021). AAT\ATT and AAAT\ATTT are also common trinucleotide and tetranucleotide motifs, respectively, such as those in A.franciscana (Jo et al., 2021), I.scapularis (Wang et al., 2013), Boa constrictor, and Protobothrops mucrosquamatus (Nie et al., 2017). This shows that dominant motifs of M. digitata are similar to what is seen in most species. Previous studies that used transcriptome data to develop microsatellite loci also found fewer GC motifs, presumably due to the methylation of cytosine in CpG sequences important for the regulation of transcription (Gonzalez-Ibeas et al., 2007; Xing et al., 2017; Liu et al., 2021).
Microsatellites are among the most commonly used molecular markers for genetic diversity analysis. However, traditional methods to develop microsatellite markers are tedious and have a low success rate. For example, to develop SSR markers using standard enrichment protocols requires the construction of microsatellite enrichment libraries, hybridization, and sequencing, which requires a large amount of experimental work expertise and high cost (Jia et al., 2013; Jia and Zhang, 2019). With the development of high-throughput sequencing, microsatellite marker development based on transcriptome and RRGS data have emerged. RRGS has been widely used as follows: specific-locus amplified fragment sequencing (SLAF-seq) and RAD-seq, of which RAD-seq is the more widely used. Compared with SLAF-seq, RAD-seq can obtain more markers, and the splicing of read2 may result in longer fragments, which is often used in the development of high-density and microsatellite markers (Wang et al., 2012; Sun et al., 2013; Wang et al., 2014; Andrews et al., 2016). In addition, transcriptome sequencing data are widely used to develop EST-SSR (He et al., 2020; Liu et al., 2021). EST-SSRs are derived from transcribed regions of genes, and compared with genome SSR markers, more conserved, but they may be used to identify alleles associated with significant traits (Chen et al., 2017; Karcι et al., 2020). But most EST-SSR markers are byproducts of stress experiments. However, during the development of microsatellite markers of reef-building corals, coral bleaching is induced by heating, which causes the symbiotic zooxanthellae in the coral to expel from the coral. After coral bleaching, RNA may be partially degraded, which is not conducive to transcriptome sequencing. Therefore, RAD-seq is an advantageous method for coral to develop microsatellite primers.
Conclusion
In this study, the large-scale development of SSR molecular markers of M. digitata was carried out through RAD-seq sequencing data, and the sequence characteristics and distribution rules of different motifs of coral SSR loci were analyzed and summarized. Twenty-one pairs of stable polymorphic primers were screened from nine randomly selected coral samples. The acquisition of these microsatellites has laid a foundation for the development of highly polymorphic microsatellite primers to study the genetic diversity, and population genetic structure of populations of M. digitata in the future. M. digitata is a non-model organism. This study further demonstrates that screening SSRs from high-throughput data is a fast and effective method for discovering SSRs in non-model organisms.
Data availability statement
The datasets presented in this study can be found in online repositories. The names of the repository/repositories and accession number(s) can be found below: BioProject, PRJNA895921.
Author contributions
Investigation, JS, YL, SC, ZC, YW, JS, ZW and DW. Performed the experiments, JS, YL and YW. Writing-original draft preparation, JS and YL. Writing-review and editing, JS, YL, SC, ZC, YW, JS, ZW and DW. All authors have read and agreed to the published version of the manuscript.
Funding
This study was supported by the Hainan provincial Natural Science Foundation of China (421RC1106), Department budget projects of Hainan provincial in 2022 (KYL-2022-12), the Ministry of Industry and Information Technology with the research project under Grant number [2019]357, and the Major Science and Technology Program of Hainan Province (Grant ZDKJ2019011).
Conflict of interest
The authors declare that the research was conducted in the absence of any commercial or financial relationships that could be construed as a potential conflict of interest.
Publisher’s note
All claims expressed in this article are solely those of the authors and do not necessarily represent those of their affiliated organizations, or those of the publisher, the editors and the reviewers. Any product that may be evaluated in this article, or claim that may be made by its manufacturer, is not guaranteed or endorsed by the publisher.
References
Andrews K. R., Good J. M., Miller M. R., Luikart C., Hohenlohe P. A. (2016). Harnessing the power of RADseq for ecological and evolutionary genomics. Nat. Rev. Genet. 17 (2), 81. doi: 10.1038/nrg.2015.28
Beedessee G., Hisata K., Roy M. C., Satoh N., Shoguchi E. (2015). Multifunctional polyketide synthase genes identified by genomic survey of the symbiotic dinoflagellate, Symbiodinium minutum. . BMC Genomics 16 (1), 1–11. doi: 10.1186/s12864-015-2195-8
Cai L., Yu L. J., Chen X. Q., Ye H. X., Chen L., Li J. J. (2015). A preliminary screening and characteristic analysis of microsatellite markers from transcriptome sequences in mugilogobius chulae. Biotechnol. Bull. 31, 146–151. doi: 10.13560/j.cnki.biotech.bull.1985.2015.09.020
Catchen J. M., Amores A., Hohenlohe P., Cresko W., Postlethwait J. H. (2011). Stacks: building and genotyping loci de novo from short-read sequences. G3: Genes| genomes| Genet. 1 (3), 171–182. doi: 10.1534/g3.111.000240
Chao K. X., Wu C. J., Li J., Wang W. L., Wang B. T., Li Q. (2022). Genetic analysis of adult plant, quantitative resistance to stripe rust in wheat landrace wudubaijian in multi-environment trials. J. Integr. Agric. 21 (8), 2305–2318. doi: 10.1016/S2095-3119(21)63876-5
Chen J., Li R., Xia Y., Bai G., Guo P., Wang Z., et al. (2017). Development of EST-SSR markers in flowering Chinese cabbage (Brassica campestris l. ssp. chinensis var. utilis tsen et Lee) based on de novo transcriptomic assemblies. PloS One 12, e0184736. doi: 10.0.5.91/journal.pone.0184736
Chen S., Zhou Y., Chen Y., Gu J. (2018). Fastp: an ultra-fast all-in-one FASTQ preprocessor. Bioinformatics 34 (17), i884–i890. doi: 10.1093/bioinformatics/bty560
Douglas A. E. (2003). Coral bleaching–how and why? Mar. pollut. Bull. 46 (4), 385–392. doi: 10.1016/S0025-326X(03)00037-7
Doyle J. J., Doyle J. L. (1987). A rapid DNA isolation procedure from small quantities of fresh leaf tissues. Phytochemical Bulletin Botanical Soc. America 19, 11–15.
Duan Y. F., Zhang Z., Li J. T., Li J., Liu P. (2016). Bioinformatics and microsatellite sequences analysis of EST sequence in ridge tail shrimp exopalaemon carinicauda. Fisheries Sci. 35 (5), 562–567.
Excoffier L., Lischer H. E. (2010). Arlequin suitever 3.5: a new series of programs to perform population genetics analyses under Linux and windows. Mol. Ecol. Resour. 10, 564–567. doi: 10.1111/j.1755-0998.2010.02847.x
Fan M., Zhang X., Nagarajan R., Zhai W., Rauf Y., Jia H., et al. (2023). Natural variants and editing events provide insights into routes for spike architecture modification in common wheat. Crop J. 11 (1), 148–156. doi: 10.1016/j.cj.2022.04.009
Gonzalez-Ibeas D., Blanca J., Roig C., González-To M., Picó B., Truniger V., et al. (2007). MELOGEN: an EST database for melon functional genomics. BMC Genomics 8, 306. doi: 10.1186/1471-2164-8-306
Gu Q. Y., Li H. G., Qian J. G., Liu J. G., Shi Y. F., He K., et al. (2017). Species composition and distribution of scleractinia coral in the port of hainan dazhou island. Natural Sci. J. Hainan Univ. 35, 366–371. doi: 10.0.5.91/journal.pone.0184736
Guo R., Chen H. Z., Zhuang T. Y., Xiong C. L., Zheng Y. Z., Fu Z. M., et al. (2018). Exploitation of SSR markers for Apis mellifera ligustica based on transcriptome data. J. Anhui Agric. Univ. 45, 404–408. doi: 10.13610/j.cnki.1672-352x.20180620.015
He F. L., Dong W. Q., Qiu Z. Y., Jiang H. P., Liu L. L., Chen Q., et al. (2022). Development of polymorphic SSR markers in Chinese water chestnut based on RAD-seq. Mol. Plant Breed. 20, 210–217. doi: 10.13271/j.mpb.020.000210
He D., Zhang J., Zhang X., He S., Xie D., Liu Y., et al. (2020). Development of SSR markers in paeonia based on De novo transcriptomic assemblies. PloS One 15 (1), e0227794. doi: 10.1371/journal.pone.0227794
Hou J. (2018). Genetic structure and connectivity of scleractinian coral porites lutea around hainan island. Master thesis. (Haikou: Hainan University).
Huang W. J., Guo X. Z., Zhang Z. H., Dong Q., Xiong X. M., Gao Z. X. (2022). Analysis of microsatellite in the entire grass carp (Ctenopharyngodon idella) genome and the application in parentage identification. J. Fisheries China 46, 161–172.
Huang J., Zhou Y., Liu Y. Z., Zhu D., Song X. H., Chen B. Q., et al. (2015). Characteristics of microsatellites in Arborophila rufipectus genome sequences using 454 GS FLX. Sichuan J. Zoology 34, 8–14.
Hughes T. P., Barnes M. L., Bellwood D. R., Cinner J. E., Cumming G. S., Jackson J. B. C., et al. (2017). Coral reefs in the anthropocene. Nature 546 (7656), 82–90. doi: 10.1038/nature22901
Hughes T. P., Huang H., Young M. A. (2012). The wicked problem of china’s disappearing coral reefs. Conserv. Biol. 27 (2), 261–269. doi: 10.1111/j.1523-1739.2012.01957.x
Jia S. W., Liu P., Li J., Li J. T., Pan L. Q. (2013). Isolation and characterization of polymorphic microsatellite loci in the ridgetail white prawn exopalaemon carinicauda. Genet. Mol. Res. 12 (3), 2816–2820. doi: 10.4238/2013.August.8.1
Jia S. W., Zhang M. L. (2019). Pleistocene climate change and phylogeographic structure of the gymnocarpos przewalskii (Caryophyllaceae) in the northwest China: evidence from plastid DNA, ITS sequences, and microsatellite. Ecol. Evol. 9, 5219–5235. doi: 10.1002/ece3.5113
Jo E., Lee S. J., Choi E., Kim J., Lee S. G., Lee J. H., et al. (2021). Whole genome survey and microsatellite motif identification of artemia franciscana. Bioscience Rep. 41 (3), 1–6. doi: 10.1042/BSR20203868
Karcι H., Paizila A., Topçu H., Ilikçioğlu E., Kafkas S. (2020). Transcriptome sequencing and development of novel genic SSR markers from pistacia vera l. Front. Genet. 11, 1021. doi: 10.3389/fgene.2020.01021
Li F., Chen D., Li Y., Li S., Hou J., Wang D., et al. (2020). Development of microsatellite markers for the hermatypic coral Porites lutea. Genomics Appl. Biol. 40, 2513–2521. doi: 10.5376/ijms.2020.10.0003
Li W. J., Li Y. Z., Du L. M., Huang J., Shen Y. M., Zhang X. Y., et al. (2014). Comparative analysis of microsatellite sequences distribution in the genome of giant panda and polar bear. Sichuan J. Zoology 33, 874–878.
Li H., Liu D. C., Xu R. R., Hou L., Wang T. Q., Liu Z. H., et al. (2021). Development and identification of SSR markers based on RAD-seq of lonicera japonica. J. Beijing Forestry Univ. 43 (6), 108–117.
Lin S., Cheng S., Song B., Zhong X., Lin X., Li W., et al. (2015). The Symbiodinium kawagutii genome illuminates dinoflagellate gene expression and coral symbiosis. Science 350 (6261), 691–694.
Liu H. J., Zhang Y. L., Wang Z., Su Y. J., Wang T. (2021). Development and application of EST-SSR markers in Cephalotaxus oliveri from transcriptome sequences. Front. Genet. 12, 759557. doi: 10.3389/fgene.2021.759557
Luo Y., Huang W., Yu K., Li M., Chen B., Huang X. Y., et al. (2022). Genetic diversity and structure of tropical Porites lutea populations highlight their high adaptive potential to environmental changes in the south china sea. Front. Mar. Sci. 9, 791149. doi: 10.3389/fmars.2022.791149
Luo Y. Q., Huang W., Yu K. F., Li M., Wu Q., Wang Y. H., et al. (2020). Development of microsatellite in Pocillopora damicornis using high-throughput sequencing. J. Guangxi Univ. 45, 958–965. doi: 10.13624/j.cnki.issn.1001-7445.2020.0958
Luo M., Zhang H., Bin S., Lin J. (2014). High-throughput discovery of SSR genetic markers in the mealybug, phenacoccus solenopsis (Hemiptera: pseudococcidae), from its transcriptome database. Acta Entomologica Sin. 57 (4), 395–400. doi: 10.16380/j.kcxb.2014.04.005
Ni S. S., Yang Y., Liu S. F., Zhuang Z. M. (2018). Microsatellite analysis of patinopecten yessoensis using next-generation sequencing method. Prog. Fishery Sci. 39 (1), 107–113.
Nie H., Cao S. S., Zhao M. L., Du L. F. (2017). Comparative analysis of microsatellite distributions in genomes of boa constrictor and protobothrops mucrosquamatus. Sichuan J. Zoology 36 (6), 639–648.
Peakall R., Smouse P. E. (2006). GENALEX 6: genetic analysis in excel. population genetic software for teaching and research. Mol. Ecol. Resour. 6, 288–295. doi: 10.1111/j.1471-8286.2005.01155.x
Peng Y., Li J., Wang T., Zhang K., Ning X. H., Ji J., et al. (2022). Preliminary study on distribution characteristics and positioning of microsatellites in whole genome of Pelteobagrus vachelli. South China Fisheries Sci. 18, 91–98.
Qi W. H., Jiang X. M., Du L. M., Xiao G. S., Hu T. Z., Yue B. S., et al. (2015). Genome-wide survey and analysis of microsatellite sequences in bovid species. PloS One 10 (7), e0133667. doi: 10.1371/journal.pone.0133667
Qi W. H., Yan C. C., Xiao G. S., Zhang W. Q., Yue B. S. (2016). Distribution regularities and bioinformatics analysis of microsatellite in the whole genomes of goat and tibetan antelope. J. Sichuan Univ. (Natural Sci. Edition) 53, 937–944.
Qu Z. W., Song H. M., Wang X. J., Liu Y., Mu X. D., Liu C., et al. (2019). Preliminary screening and characterization of microsatellite markers in RAD-seq data of datnioides pulcher. Freshw. Fisheries 49 (4), 9–15. doi: 10.13721/j.cnki.dsyy.2019.04.002
Ren F., Ma X. H. (2021). Characteristics analysis of SSR markers based on transcriptomic sequenceing of Placocheilus cryptonemus. Jiyinzuxue yu Yingyong Shengwuxue (Genomics Appl. Biology) 40, 1055–1060. doi: 10.13417/j.gab.040.001055
Ruiz-Ramos D. V., Baums I. B. (2014). Microsatellite abundance across the anthozoa and hydrozoa in the phylum cnidaria. BMC Genomics 15 (1), 1–17. doi: 10.1186/1471-2164-15-939
Shoguchi E., Shinzato C., Hisata K., Satoh N., Mungpakdee S. (2015). The large mitochondrial genome of symbiodinium minutum reveals conserved noncoding sequences between dinoflagellates and apicomplexans. Genome Biol. Evol. 7 (8), 2237–2244. doi: 10.1093/gbe/evv137
Shoguchi E., Shinzato C., Kawashima T., Gyoja F., Mungpakdee S., Koyanagi R., et al. (2013). Draft assembly of the Symbiodinium minutum nuclear genome reveals dinoflagellate gene structure. Curr. Biol. 23 (15), 1399–1408. doi: 10.1016/j.cub.2013.05.062
Song C. Y., Feng Z. Y., Li C. H., Sun Z. C., Gao T. X., Song N., et al. (2020). Profile and development of microsatellite primers for acanthogobius ommaturus based on high-throughput sequencing technology. J. Oceanol. Limnol. 1–11. doi: 10.1007/s00343-019-9154-1
Song L. L., Wang D. D., Zhou X. J. (2022). Microsatellites characterization analysis of clematis heracleifolia using high throughput sequencing method. Mol. Plant Breed. 20, 1087–1094. doi: 10.13271/j.mpb.020.001087
Su D. J. (2017). Genetic structure and connectivity of scleractinian coral galaxea fascicularis around hainan island (Hainan University).
Su M. Y., Yang W. S., Tang R. Y., Xu J. J., Wang T., Yin S. W. (2021). Microsatellite distribution in the whole genome of ageneiosus marmoratus. J. Nanjing Normal Univ. (Engineering Technol. Edition) 21, 65–71.
Sun Y., Guo B. Y., QI Z. P., Chen Y., Tang Z. R., Liu S. B. (2019). Analysis on ssr and snp information in transcriptome sequences of Sepiella japonica. J. Zhejiang Ocean Univ. (Natural Science) 38, 100–106.
Sun X., Liu D., Zhang X., Li W., Liu H., Hong W., et al. (2013). SLAF-seq: an efficient method of large-scale de novo SNP discovery and genotyping using high-throughput sequencing. PloS One 8 (3), e58700. doi: 10.1371/journal.pone.0058700
Tang R. Y., Su M. Y., Yang W. S., Xu J. J., Wang T., Yin S. W. (2022). Analysis of microsatellite distribution characteristics in the channel catfish (Ictalurus punctatus) genome. Prog. Fishery Sci. 43 (2), 89–97. doi: 10.19663/j.issn2095-9869.20210126002
Tu F. Y., Liu J., Han W. J., Huang T., Huang X. F. (2018). Analysis of microsatellite distribution characteristics in the entire genome of Macaca fascicularis. Chin. J. Wildlife 39, 400–4404. doi: 10.19711/j.cnki.issn2310-1490.2018.02.032
Van Oosterhout C., Hutchinson W. F., Wills D. P. M., Shipley P. (2004). MICROCHECKER: software for identifying and correcting genotyping error in microsatellite data. Mol. Ecol. Notes 4, 535–538. doi: 10.1111/j.1471-8286.2004.00684.x
Wan D. M., Han M., Li C. A., He Y. X. (2016). Development of microsatellite in marsh tit Parus palustris using illumina MiSeq. J. Liaoning Univ. 43, 252–257. doi: 10.16197/j.cnki.lnunse.2016.03.012
Wang Q. Y., Guo W. J., Cheng W. W., Deng G. Q., Xu H. L., Xia R. L. (2021). Isolation of microsatellite markers for pelteobagrus vachellii based on RAD sequencing. Fisheries Sci. & Technol. Inf. 48, 250–254. doi: 10.16446/j.fsti.20200700123
Wang Y. K., Hu Y., Zhang T. Z. (2014). Current status and perspective of RAD-seq in genomic research. Hereditas (Beijing) 36 (1), 41–49.
Wang Z. L., Huang J., Du L. M., Li W. J., Yue B. S., Zhang X. Y. (2013). Comparison of microsatellites between the genomes of tetranychus urticae and ixodes scapularis. Sichuan J. Zoology 32, 481–486.
Wang S., Meyer E., McKay J. K., Matz M. V. (2012). 2b-RAD: a simple and flexible method for genome-wide genotyping. Nat. Methods 9 (8), 808. doi: 10.1038/nmeth.2023
Wang Y. R., Yang W., Ren X. L., Jiang D. N., Deng S. P., Chen H. P., et al. (2020). Distribution patterns of microsatellites and development of polymorphic markers from Scatophagus argus genome. J. Guangdong Ocean Univ. 40, 7–14.
Wang X. T., Zhang Y. J., Xiu H. E., Mei T., Chen B. (2016). Identification, characteristics and distribution of microsatellites in the whole genome of anopheles sinensis (diptera: culicidae). Acta Entomologica Sin. 59, 1058–1068. doi: 10.16380/j.kcxb.2016.10.004
Wu Z. M., Gao P., Wen J. B. (2016). Characteristic analysis of microsatellite in eucryptorrhynchus chinensis transcriptome. J. Environ. Entomology 38 (5), 979–983.
Wu Q., Huang W., Chen B., Yang E., Meng L., Chen Y., et al. (2021). Genetic structure of Turbinaria peltata in the northern south China Sea suggest insufficient genetic adaptability of relatively high-latitude scleractinian corals to environment stress. Sci. total Environ. 775, 145775. doi: 10.1016/j.scitotenv.2021.145775
Xing W., Liao J., Cai M., Xia Q., Liu Y., Zeng W., et al. (2017). De novo assembly of transcriptome from rhododendron latoucheae franch. using illumina sequencing and development of new EST-SSR markers for genetic diversity analysis in rhododendron. Tree Genet. Genomes 13 (53), 1–15. doi: 10.1007/s11295-017-1135-y
Xu J. J., Bi Y. H., Cheng J. H., Xing X. M., Ji J., Wang T., et al. (2021b). Study on distribution characteristics of whole genome microsatellite of Eriocheir sinensis. Jiyinzuxue yu Yingyong Shengwuxue (Genomics Appl. Biology) 40, 2422–2429. doi: 10.13417/j.gab.040.002422
Xu J. J., Zheng X., Li J., Yin S. W., Wang T. (2020). Distribution characteristics of whole genome microsatellite of Pelteobagrus fulvidraco. jiyinzuxue yu yingyong shengwuxue. (Genomics Appl. Biology) 39, 5488–5498. doi: 10.13417/j.gab.039.005488
Xu J. J., Zheng X., Zhang X. Y., Wang T., Yin S. W. (2021a). Analysis of distribution characteristics of microsatellites in four genomes of puffer fish. Jiyinzuxue yu Yingyong Shengwuxue (Genomics Appl. Biology) 40, 1441–1451. doi: 10.13417/j.gab.040.001441
Yang X. L. (2013). Development of microsatellite markers in platygyra acuta and analysis of genetic diversity of populations from some scleractinian. Master Thesis. (Zhanjiang: Guangdong Ocean University).
Yang W. S., Tang R. Y., Su M. Y., Xu J. J., Wang T., Yin S. W. (2021). Analysis of microsatellite distribution characteristics in the whole genome of Bagarius yarrelli. J. Nanjing Normal Univ. (engineering Technol. edition) 21, 62–68.
Yuan Y., Zhang L. F., Wu G. X., Zhu J. Y. (2014). High-throughput discovery microsatellites in Tomicus yunnanensis (Coleoptera: scolytinae). J. Environ. Entomology 36, 166–170.
Zhang P., Zhou X., Pang B., Tan Y., Chang J., Gao L. (2016). High-throughput discovery of microsatellite markers in galeruca daurica (Coleoptera: chrysomelidae) from a transcriptome database. Chin. J. Appl. Entomology 53 (5), 1058–1064.
Zhou H. Y., Yao X. M., Li L., Geng T. N., Zhang Y. (2017). Scleractinian coral community structure and distribution in the coastal waters surrounding hainan island. Biodiversity Sci. 25 (10), 1123–1130. doi: 10.17520/biods.2017079
Keywords: South China Sea, scleractinian coral, polymorphic loci, genetic diversity, polymorphic information content
Citation: Jia S, Li Y, Chen S, Cai Z, Shen J, Wang Y, Wu Z and Wang D (2023) Microsatellite markers for Monitipora digitata designed using restriction-site associated DNA sequencing. Front. Mar. Sci. 10:1019419. doi: 10.3389/fmars.2023.1019419
Received: 15 August 2022; Accepted: 30 May 2023;
Published: 16 June 2023.
Edited by:
David Seth Portnoy, Texas A&M University Corpus Christi, United StatesReviewed by:
Guanpin Yang, Ocean University of China, ChinaXianyun Ren, Yellow Sea Fisheries Research Institute (CAFS), China
Xuehe Lu, Suzhou University of Science and Technology, China
Copyright © 2023 Jia, Li, Chen, Cai, Shen, Wang, Wu and Wang. This is an open-access article distributed under the terms of the Creative Commons Attribution License (CC BY). The use, distribution or reproduction in other forums is permitted, provided the original author(s) and the copyright owner(s) are credited and that the original publication in this journal is cited, in accordance with accepted academic practice. No use, distribution or reproduction is permitted which does not comply with these terms.
*Correspondence: Shuwen Jia, amlhc2h1d2VuMTAwQDE2My5jb20=; Zhongjie Wu, d3V6aG9uZ2ppZV9obmhreUAxNjMuY29t; Daoru Wang, d2FuZ2Rhb3J1X2huaGt5QDE2My5jb20=
†These authors have contributed equally to this work