 James J. Leichter1*
 Lydia B. Ladah2
 P. Ed Parnell1
 M. Dale Stokes1
 Matthew T. Costa3
 James Fumo4Paul K. Dayton1
- 1Scripps Institution of Oceanography, University of California San Diego, La Jolla, CA, United States
- 2Department of Biological Oceanography, Centro de Investigación Científica y de Educación Superior de Ensenada (CICESE), Carretera Ensenada-Tijuana, Ensenada, Baja California, Mexico
- 3Marine Science Center, Northeastern University, Boston, MA, United States
- 4Marine Biology Graduate Program, University of Hawaii, Honolulu, HI, United States
Kelp beds provide significant ecosystem services and socioeconomic benefits globally, and prominently in coastal zones of the California Current. Their distributions and abundance, however, vary greatly over space and time. Here, we describe long-term patterns of Giant Kelp (Macrocystis pyrifera) sea surface canopy area off the coast of San Diego County from 1983 through 2019 along with recent patterns of water column nitrate (NO3-) exposure inferred from in situ temperature data in 2014 and 2015 at sites spanning 30 km of the coastline near San Diego California, USA. Site-specific patterns of kelp persistence and resilience were associated with ocean and climate dynamics, with total sea surface kelp canopy area varying approximately 33-fold over the almost 4 decades (min 0.34 km2 in 1984; max 11.25 km2 in 2008, median 4.79 km2). Site-normalized canopy areas showed that recent kelp persistence since 2014 was greater at Point Loma and La Jolla, the largest kelp beds off California, than at the much smaller kelp bed off Cardiff. NO3- exposure was estimated from an 11-month time series of in situ water column temperature collected in 2014 and 2015 at 4 kelp beds, using a relationship between temperature and NO3- concentration previously established for the region. The vertical position of the 14.5°C isotherm, an indicator of the main thermocline and nutricline, varied across the entire water column at semidiurnal to seasonal frequencies. We use a novel means of quantifying estimated water column NO3- exposure integrated through time (mol-days m-2) adapted from degree days approaches commonly used to characterize thermal exposures. Water column integrated NO3- exposure binned by quarters of the time series showed strong seasonal differences with highest exposure in Mar - May 2015, lowest exposure in Sep - Dec 2014, with consistently highest exposure off Point Loma. The water column integrated NO3- signal was filtered to provide estimates of the contribution to total nitrate exposure from high frequency variability (ƒ >= 1 cycle 30 hr-1) associated predominantly with internal waves, and low frequency variability driven predominantly by seasonal upwelling. While seasonal upwelling accounted for > 90% of NO3- exposure across the full year, during warm periods when seasonal upwelling was reduced or absent and NO3- exposure was low overall, the proportion due to internal waves increased markedly to 84 to 100% of the site-specific total exposure. The high frequency variability associated with internal waves may supply critical nutrient availability during anomalously warm periods. Overall, these analyses support a hypothesis that differences in NO3- exposure among sites due to seasonal upwelling and higher frequency internal wave forcing contribute to spatial patterns in Giant Kelp persistence in southern California. The study period includes anomalously warm surface conditions and the marine heatwave associated with the “Pacific Warm Blob” superimposed on the seasonal thermal signal and corresponding to the onset of a multi-year decline in kelp canopy area and marked differences in kelp persistence among sites. Our analysis suggests that, particularly during periods of warm surface conditions, variation in NO3- exposure associated with processes occurring at higher frequencies, including internal waves can be a significant source of NO3- exposure to kelp beds in this region. The patterns described here also offer a view of the potential roles of seasonal and higher frequency nutrient dynamics for Giant Kelp persistence in southern California under continuing ocean surface warming and increasing frequency and intensity of marine heatwaves.
1 Introduction
The size and abundance of Giant Kelp (Macrocystis pyrifera) beds are highly dynamic (e.g. Dayton, 1985; Steneck et al., 2002). Kelps are foundation species (sensu Dayton, 1972) providing high biodiversity habitats in the coastal zone. Kelp forest ecosystems offer valuable contributions to coastal communities including the harvesting of kelp biomass, invertebrates, and fish, as well as non-consumptive activities including recreation and tourism (Wheeler and North, 1980; Dayton, 1985). Because of the ecological and socioeconomic importance of kelp beds, understanding the factors driving the spatiotemporal variation in their distribution and abundance can directly benefit coastal management.
Kelp beds are distributed heterogeneously in space, and exhibit highly variable abundance through time, influenced by both physical and biological factors promoting growth interacting with disturbances that remove biomass and rapidly reset succession (Dayton, 1985). The ability of kelps, especially the Giant Kelp (Macrocystis pyrifera) which has a broad distribution in the northern and southern hemispheres, and the Bull Kelp (Nereocystis luetkeana) which ranges from the Aleutian Islands to central California, to dominate subtidal habitats and support complex associated species assemblages is dependent on the availability of rocky substrata at suitable depths (generally depths < 25 to 30 m), the quantity and spectral quality of light penetrating the water column (Gerard, 1984; Reed and Foster, 1984), complex species interactions between kelp grazers, particularly urchins, and their predators and pathogens (Steneck et al., 2002; Estes et al., 2004; Feehan and Scheibling, 2014); and the supply of critical nutrients (Jackson, 1977; Gerard 1982a; Jackson, 1983; Zimmerman and Kremer, 1984; Foster and Schiel, 1985; Kinlan et al., 2003). However, despite the complex factors and feedbacks driving the variability in kelp bed distributions and abundance, some locations consistently show long-term ecosystem persistence through multiple disturbances, and thus likely represent hot spots of successful kelp recruitment and growth linked to habitat quality (Parnell et al., 2006; Parnell et al., 2010; Young et al., 2016; Cavanaugh et al., 2019; Bell et al., 2020). For example, some kelp beds contain core areas where rapid post-disturbance recovery consistently occurs due to a combination of seascape structure (Parnell, 2015), depth distributions, competition between surface canopy and understory guilds, and post disturbance nutrient climates (e.g., see Figure 1 in Parnell et al., 2006). Recognizing and protecting core areas of long-term persistence and understanding environmental and habitat drivers of kelp resilience through time can contribute to improved management, conservation, and restoration, as these ecosystems confront increasingly complex challenges of a rapidly changing ocean climate including a deepening thermocline depth in southern California and the increasing frequency of anomalous warm temperatures and marine heatwaves (e.g. Arafeh-Dalmau et al., 2019; Cavanaugh et al., 2019; McPherson et al., 2021).
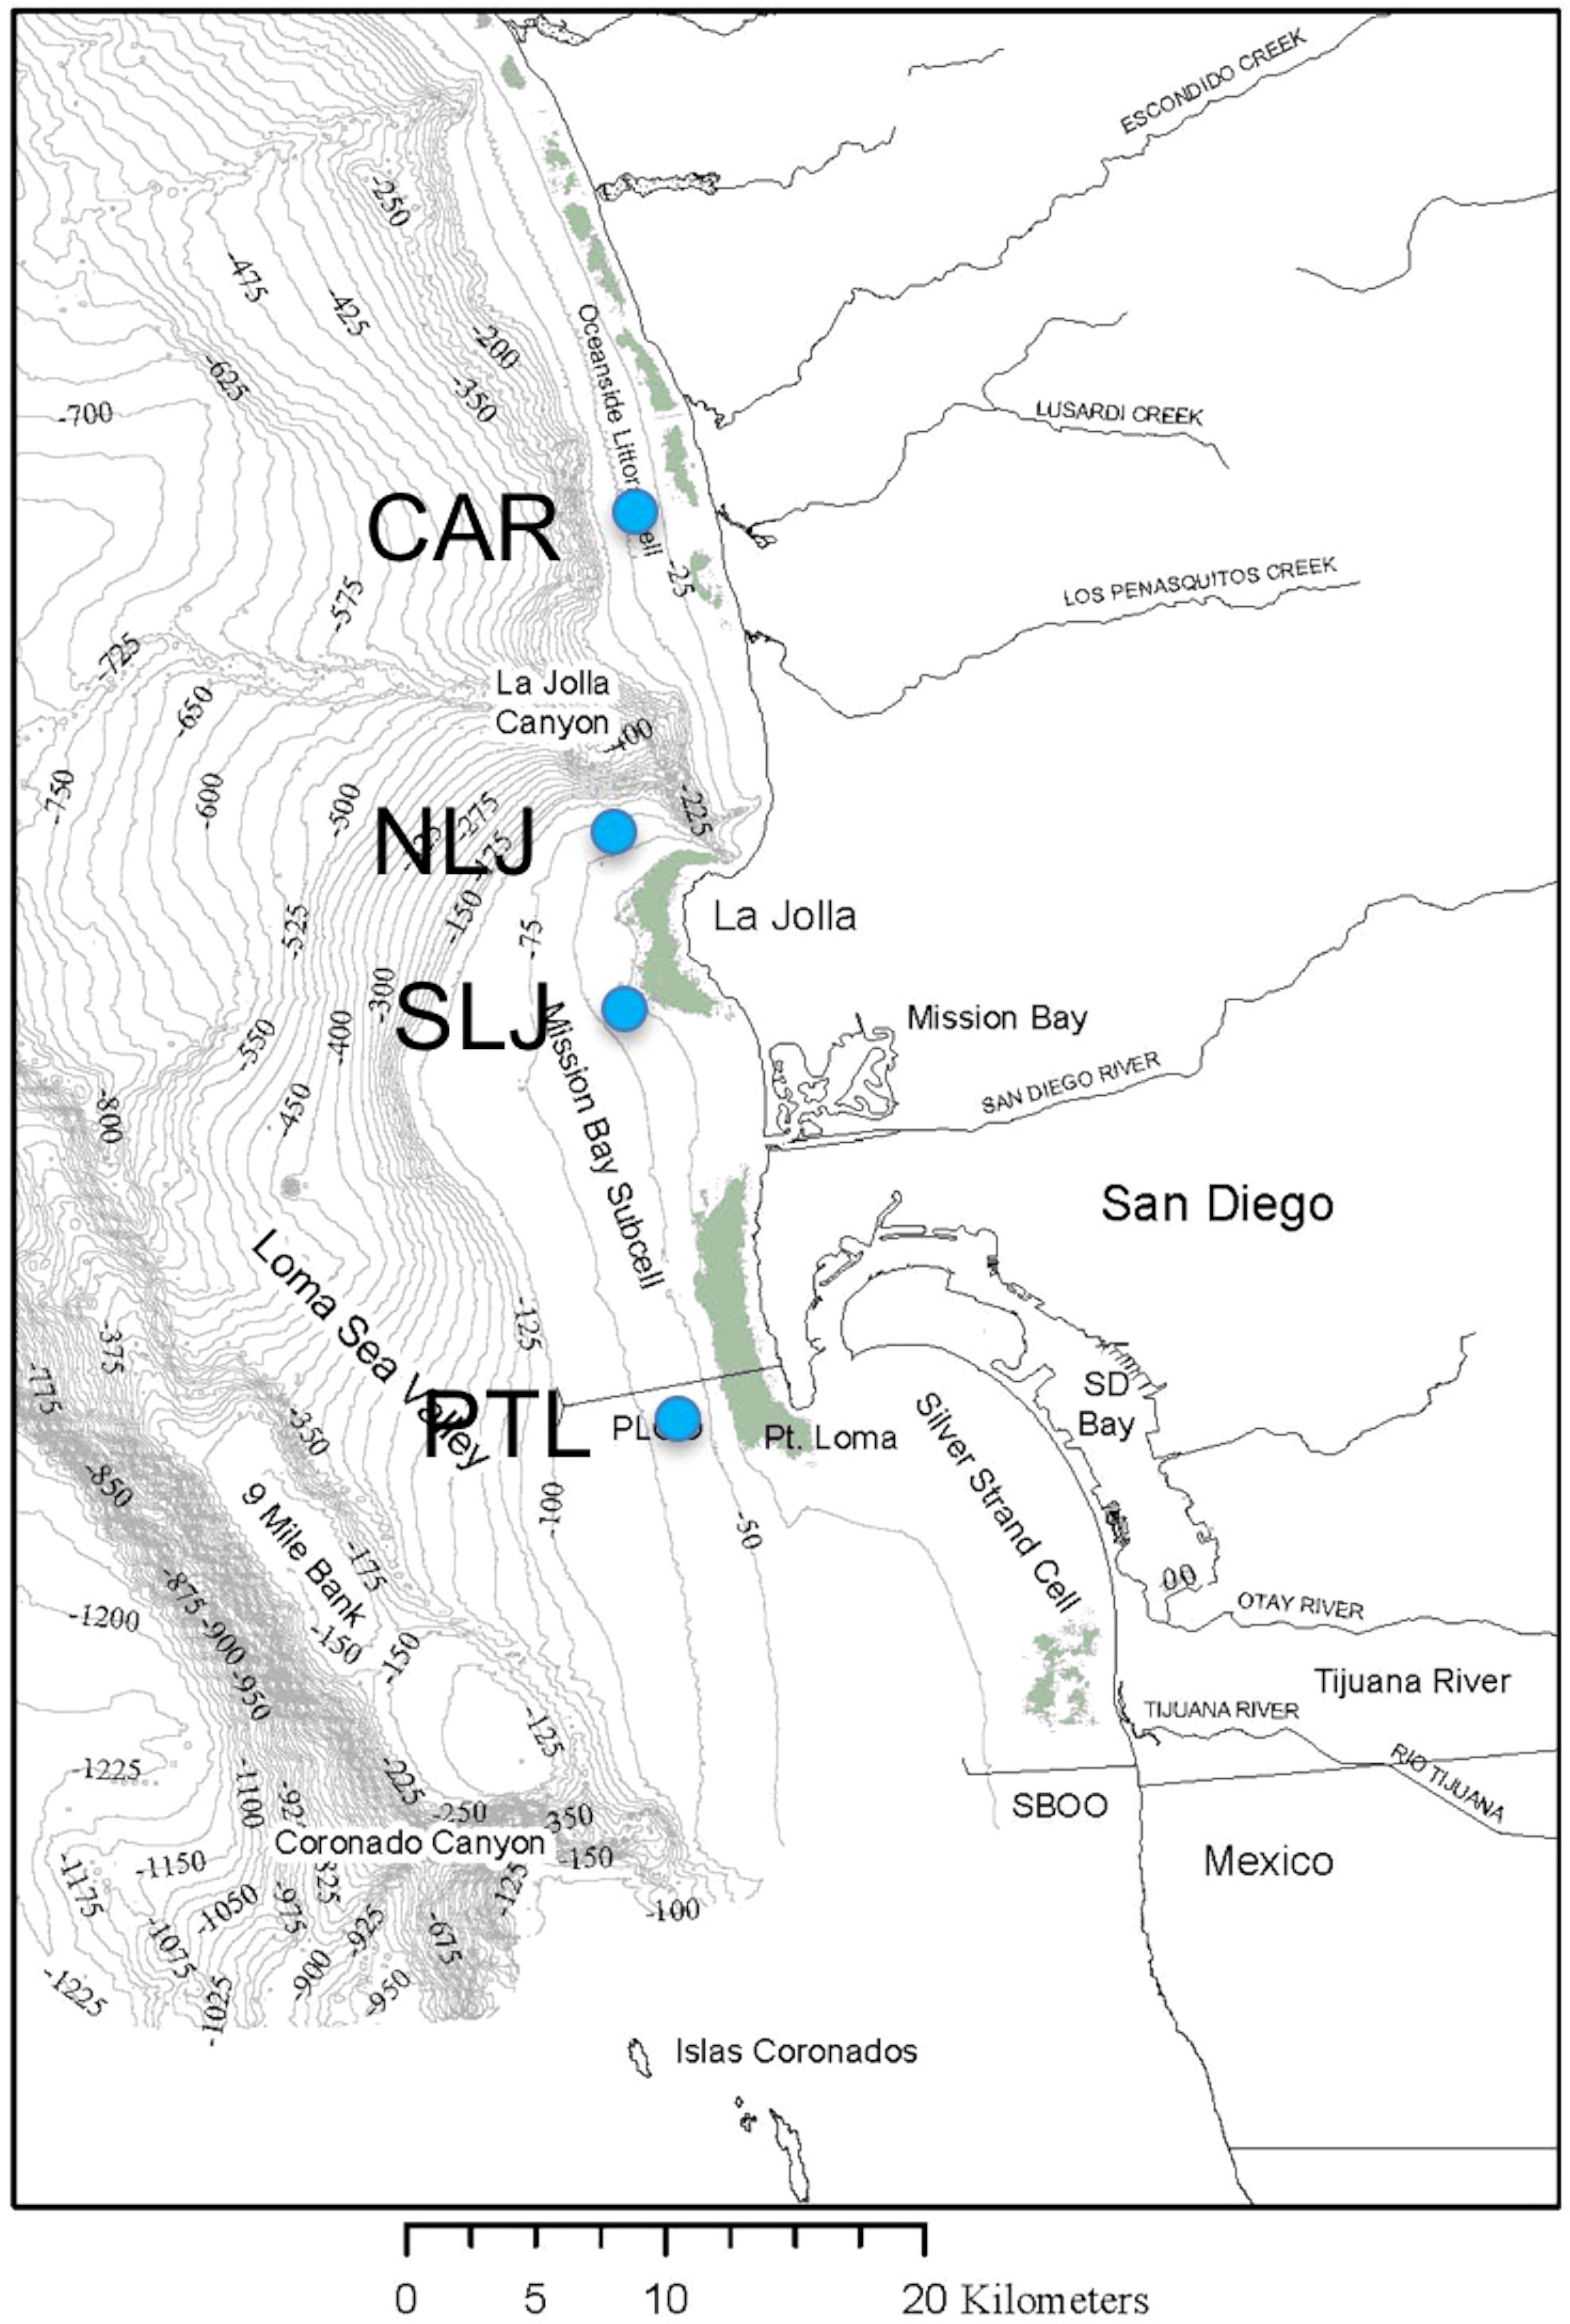
Figure 1 Study region along the coast of San Diego, CA, showing locations (blue circles) of recording temperature moorings deployed seaward of kelp beds off Cardiff (CAR), North La Jolla (NLJ), South La Jolla (SLJ), and Point Loma (PTL). Green tinted areas inshore of the study site markers indicate the maximum cover of kelp canopies recorded in aerial surveys 1983 through 2019 (MBC Aquatic Sciences, 2020).
The exceptional productivity of kelps, especially M. pyrifera in California, depends in large part, on availability of dissolved inorganic nutrients which limit primary productivity in coastal environments (Dayton et al., 1992; Dayton et al., 1999). Nitrogen uptake in macroalgae, including kelps, is related to water column concentrations (Harrison and Hurd, 2001), photosynthetic energy, temperature-dependent kinetics, and water motion impacting boundary layer concentrations and dynamics (Hepburn et al., 2007; Gerard 1982b). Biological characteristics such as tissue morphology, type, ontogeny, and nutritional history also impact incorporation of nitrogenous nutrients (Rosenberg and Ramus, 1984; Duke et al., 1989; Lobban and Harrison, 1994; Pedersen, 1994; Pedersen and Borum, 1996; Neori et al., 2004). Importantly, kelps have the ability to translocate nitrogen sources, including amino acids, from blades in deeper water to the surface canopy, and therefore can take advantage of varying nutrient concentrations and availability throughout the water column (Schmitz and Srivastava, 1979; Manley, 1983; Konotchick et al., 2012).
For coastal waters of the California Current, there is a well-established relationship between temperature and forms of biologically available nitrogen, with NO3- concentrations inversely related to temperature below approximately 14°C to 15.5°C (Zentara and Kamykowski, 1977; Zimmerman and Kremer, 1986; Dayton et al., 1999), principally because remineralized organic nitrogen mainly in the form of NO3- occurs at elevated concentrations in deeper colder waters, typically below the thermocline (Strickland, 1970; Jackson, 1977; Zentara and Kamykowski, 1977; Eppley et al., 1979; Zimmerman and Kremer, 1986; Ladah, 2003; Parnell et al., 2010). Above the threshold temperatures, NO3- becomes low to undetectable (i.e. concentrations < 0.1 µmol L-1). Ammonium and urea associated primarily with runoff and biological nitrogen recycling in surface waters (Bray et al., 1986; Smith et al., 2018), and potentially with recycling by epibiont communities (Hurd et al., 1994), may also be relevant and intermittent sources of nitrogen in coastal waters.
A range of oceanographic mechanisms can deliver nitrogenous nutrients to kelp beds (McPhee-Shaw et al., 2007) with strong spatial and temporal variation, including zonal variability in upwelling-favorable winds (Checkley and Barth, 2009), jets associated with coastal headlands (Mooers and Robinson, 1984), proximity to deep-water canyons (Ryan et al., 2005; Walter and Phelan, 2016), and variable exposure in both frequency and intensity to internal wave forcing (Filonov et al., 2014). In southern California kelp beds, ambient nutrient concentrations can vary dramatically on time scales of hours to days, associated with variation in upwelling strength which determines the depth of the thermocline and nutricline, as well as with periods of elevated internal wave activity that deliver pulses of cool, sub-thermocline water to inshore habitats (Jackson, 1977; Jackson and Winant, 1983; Zimmerman and Kremer, 1984; Konotchick et al., 2012). However, the causes and consequences of nutrient variability among kelp forest sites, especially within the same upwelling region, remain largely unexplored, and we have limited understanding of the ways in which local nutrient climates contribute to kelp forest persistence and resilience.
The primary sources of inorganic nitrogen along the coast of California include sub-thermocline NO3- transported by wind-driven upwelling as well as higher-frequency pulses associated with internal waves (Jackson, 1977; Zimmerman and Kremer, 1984; McPhee-Shaw et al., 2007; Fram et al., 2008). Upwelling in the Southern California Bight occurs on large scales extending to ~ 200 km off the coast, and on more local scales that are quasi-synchronous, for example in San Diego occurring approximately twice per month in summer lasting approximately 6 to 24 days (Dorman and Palmer, 1981). Additionally, there is long-recognized, extensive internal wave activity in the Southern California Bight (e.g., Ewing, 1950; Jackson, 1977; Jackson and Winant, 1983; Zimmerman and Kremer, 1984; Pineda, 1991; Lucas et al., 2011) with spatial variability in internal wave forcing at relatively smaller scales (Filonov et al., 2014). Internal waves are vertical oscillations generated along density gradients forced by wind or tidal currents as they flow across abrupt landscape features with critical slope contours, such as at the continental shelf break, offshore banks, or sea mounts (Holloway, 1987; Lamb, 1997). The complex bathymetry in the Southern California Bight, combined with persistent vertical water column density stratification during most of the year, and strong barotropic tidal forcing create significant potential for conversion of barotropic to baroclinic energy and resulting shoreward propagating internal waves. For the study region near San Diego, numerical modelling indicates that the large 9 Mile Bank is a zone of high barotropic to baroclinic energy conversion and source of internal wave formation (Ponte and Cornuelle, 2013).
Once formed, depending on slope angle, internal wave energy can propagate shoreward along the wave guide of the greatest density difference, which in arid temperate upwelling regions with little salinity change over depth occurs at the thermocline and associated nutricline. Nonlinear shoaling and breaking of internal waves result in turbulent energy dissipation in shallow waters leading to mixing and cross-shelf transport of sub-thermocline water (Sandstrom and Elliott, 1984; Helfrich and Melville, 2006; Sharples et al., 2007). This process has been estimated to account for up to 25% of annual nitrate contribution on the Mauritanian shelf (Schafstall et al., 2010) and up to 15% in the Santa Barbara channel (McPhee-Shaw et al., 2007). Because tidal forcing is likely to be both semidiurnal and diurnal in nature due to the M2 or O1 tide, and because wind forcing is usually diurnal due to daily warming and cooling affecting the sea breeze and wind forcing patterns, their frequencies and consequences can be distinguished in time series of both temperature and related NO3-. Internal waves are biologically relevant in a range of ecosystems, including the coastal shelf of the Southern California Bight. Evidence exists that seaweeds can incorporate nutrients from semidiurnal internal waves (Ladah et al., 2012) and that kelps can take up and store nutrients on time scales of days to months (Wheeler and North, 1980; Gerard, 1982a). Prior inshore oceanographic and ecological work has shown strong physical gradients in temperature and modeled NO3- exposure between two sites at North and South La Jolla (Konotchick et al., 2012) as well as large variation in kelp persistence throughout southern California’s kelp forest “Region 9” (Parnell et al., 2010).
Here we first examine patterns of kelp canopy abundance through time for the distinct kelp beds in San Diego using the annual maximum canopy area measured from aerial surveys conducted since 1983 (MBC Aquatic Sciences, 2020). There are large differences in the total size among these kelp beds, primarily determined by differences in availability of benthic rocky substrata at suitable depths (i.e. ~5 to 25 m). However, there also are differences in the trajectory of relative canopy cover normalized by maximum cover, suggesting that additional factors that vary alongshore contribute to kelp persistence through time. We hypothesize that differences in high frequency shoaling of the nutricline associated with the impact of internal waves contribute to the variation in persistence among sites and analyze a recent dataset of water column temperature observations at the seaward edge of 4 kelp beds in the San Diego region.
2 Methods
2.1 Long-term kelp canopy survey data
Data on the annual maximum kelp canopy cover from 1983 through 2019 were obtained from a published dataset for the southern California study region (MBC Aquatic Sciences, 2020). The data were collected via quarterly infrared aerial imaging surveys covering 24 distinct kelp beds conducted for the Region Nine Kelp Survey Consortium. The data are reported as the annual maximum cover across the quarterly surveys, with annual data available starting in 1983, along with categorization of yearly thermal data from the Multivariate ENSO Index (MBC Aquatic Sciences, 2020). We analyzed the data for 3 sites at Cardiff, La Jolla, and Point Loma (CAR, LJ, PTL) corresponding to locations of our instrument mooring deployments. Although our mooring deployments (see below) included sites at the north and south of the La Jolla kelp bed, the kelp canopy data are reported as one contiguous kelp bed at La Jolla. The dataset was used to construct and plot an annual time series of kelp bed area (km2) for each site. Because the kelp beds differ greatly in area, with PTL > LJ >> CAR, we also calculated the annual proportional kelp cover for each site normalized by the maximum area observed at each site across the 37-yr time series. The time series of site-normalized cover were used to estimate kelp bed persistence starting in 2014 corresponding to the mooring deployments and for the subsequent 5 years through 2019. Following Cavanaugh et al. (2019), kelp canopy persistence for each site was calculated as the proportional cover in each year relative to a baseline of the site-specific mean kelp cover over the preceding 5 years.
2.2 In situ temperature observations
Vertical moorings with affixed recording temperature sensors were deployed on the 36 m isobath approximately 100 to 200 m seaward of established kelp beds at each of 4 sites along the coast of San Diego, CA (Figure 1) . The moorings were deployed from the ship R/V New Horizon with ~250 kg anchors, and instruments were subsequently retrieved and re-deployed by scuba divers using standard air and non-decompression diving. The moorings were deployed off the kelp beds at Cardiff (CAR, 33.01503°N, 117.30386°E), North La Jolla (NLJ, 32.85772°N, 117.29111°E), South La Jolla (SLJ, 32.80270,°N, 117.30107°E), and Point Loma (PTL, 32.69866°N, 117.27696°E). To prevent boat strikes, subsurface floats at the tops of the moorings were located approximately 4 m below the sea surface relative to mean low tide. Each mooring was initially instrumented with 5 Seabird Electronics SBE 39 temperature sensors (0.01°C resolution, ~ 10 sec response time) placed at heights of 1, 6, 12, 18, 24 m above the sea floor with an additional Seabird Electronics SBE 39+ temperature/pressure sensor 29 m above the seafloor. The pressure records near the top of the mooring lines were used to assess potential knock-down of the moorings by currents. Depth deviations were less than 2 m at almost all times except in one case at North La Jolla when the mooring had been entangled with lobster trapping gear and the top of the mooring pulled down to a depth of ~8 m for multiple days. After the initial deployment, redeployed instruments included Seabird Electronics SBE 56 temperature sensors (0.01°C resolution, ~10 sec response time) and RBR 1050 temperature sensors (0.01°C resolution, ~30 sec response time). All instruments were factory-calibrated and sampled at 1 min intervals, with deployment durations typically 4 to 6 months. Moorings were deployed on 17 June 2014 with all instruments synchronized to begin sampling at midnight 18 June 2014 (GMT -8). Here we analyze ~11 mo (336 d) of the continuous temperature records from June 2014 through May 2015.
2.3 Temperature and NO3- analysis
The raw temperature data were quality controlled, with records from successive deployments at each location trimmed to remove times when instruments were out of the water, and data then spliced together to form continuous time series for each position above the seafloor on each mooring. The data from the individual sensors at 6 m vertical intervals were linearly interpolated to 1 m to create estimated vertical profiles of the water column temperatures for the bottom 24 m at each site. The data from the temperature/pressure sensors 29 m above the bottom (just below the mooring floats) were excluded from this analysis because those records started later at Cardiff and South La Jolla than at North La Jolla and Point Loma. The temperature data were then averaged to 10 min intervals and the height above bottom of the 14.5°C isotherm representing the main thermocline was calculated.
The temperature time series were used to produce records of estimated NO3- concentrations using a linear regression equation (NO3- = -5.8 x Temperature + 81.7, r2 = 0.90, per Konotchick et al., 2012). Use of a linear relationship between NO3- and temperature below ~14.5°C for southern California nearshore waters has a strong empirical basis (Kamykowski and Zentara, 1986; Zimmerman and Kremer, 1986; Dayton et al., 1999; Lucas et al., 2011; Konotchick et al., 2012), although some periods with greater than expected NO3- at warmer temperatures have been documented in the southern part of the range (Ladah, 2003). The linear relationship reported in Konotchick et al. (2012) and applied here was derived from n = 1904 hydrographic bottle samples collected in the California Cooperative Oceanic Fisheries Investigations from 1959 to 2010 for a station offshore of La Jolla, CA at (32°54’ N, 117°23’ W). Following Konotchick et al. (2012), we apply the linear relationship to all temperatures less than the y-intercept value 14.2°C, and a constant value of 0.1 µmol L-1 NO3- for all temperatures greater than 14.2°C. This assumes that the linear relationship between temperature and nitrate measured offshore is consistent inshore, which has been confirmed by Parnell et al. (2010) for a station at 5 m depth off the Scripps Pier, although there is potential for changes associated with diapycnal mixing that could cause transient deviations from this linear relationship. The estimated concentration of NO3- for each 1 m bin of the water column was converted from units of umol L-1 to mol m-3 and summed across the 24 1-m vertical bins, with units of mol m-2 representing the estimated total water column integrated NO3- in each time step for an idealized 1 m x 1 m x 24 m water column above a 1 m2 area of seafloor at each site. To characterize total NO3- exposures through time we adapted a common approach of quantifying temperature exposure using degree days (°C x days) above or below set thermal thresholds. To our knowledge this is a novel approach to quantifying accumulated nutrient exposure, with the water column integrated NO3- values in each time step accumulated through time with units of mol-days m-2 (mol x days m-2). Here the threshold value corresponds to zero water column NO3-, and positive values multiplied by the time step are then accumulated to daily values and summed across longer time intervals. It is important to note that this approach only estimates concentrations across the water column in each measurement time step without information on transport and fluxes of nutrients which would be present in a moving fluid environment. However, the approach provides a method of comparing environmental conditions through time and quantifying potential differences among sites. The following hypothetical example mat help to clarify the approach and provide a sense of the units and magnitude of accumulated NO3- exposure here: From the NO3- - Temperature relationship above, NO3- = 10 µmol L-1 at T ~= 12.36°C. Therefore, if the entire 24 m water column above a 1 m2 areas of the seafloor had a uniform temperature of 12.36°C in a given time interval, by unit conversion there would be 0.24 mol m-2 NO3- present. If the temperature were constant for an entire day, there would be 0.24 mol-days m-2 of accumulated NO3- exposure. By multiplication, a constant 12.36°C water column over 30 and 365 days would then correspond, respectively, to 7.2 and 87.6 mol-days m-2 of accumulated NO3- exposure.
Here the daily NO3- exposure estimated from the water column temperature time series at each site were binned and accumulated by quarters of the time series. We also estimated the nitrate exposure based on temperature time series filtered into two frequency bins to estimate the relative contributions of internal waves and seasonal upwelling relative to the overall total NO3- exposure at each site. For each site the water column temperature data were filtered with a low pass filter (pl64t) with a cutoff frequency of ƒ = 1 cycle 30 hr-1, corresponding approximately to the local inertial frequency. The difference between the raw and the low-pass signals provides an estimate of the high-frequency variability primarily associated with diurnal and semidiurnal forcing, while the low-pass signal provides an estimate of the variability associated with seasonal upwelling. The low and high frequency NO3- signals were summed by quarters for the time period 24 Jun 2014 through 25 May 2015 (n = 336 d total, n = 84 d per quarter). The quarterly totals associated with the low frequency (seasonal upwelling) and high frequency (internal waves) components were also expressed as percentages of the overall total daily water column integrated NO3- exposure.
Power spectra of the temperature and estimated NO3- time series for each site were also calculated using Welch’s averaged periodogram method for a series of 14-day data segments with application of a Hamming window and 50% overlap, yielding estimates of spectral power with 95% confidence intervals, as a function of frequency (Thomson and Emery, 2014; Trauth, 2015). The power spectra of the NO3- time series were calculated on the estimated NO3- time series from June 2014 through May 2015.
3 Results
Annual total canopy area of the three kelp beds at Cardiff, La Jolla, and Point Loma varied by ~33 fold across the 37-yr time series, from a minimum of 0.34 km2 in 1984 to a maximum of 11.25 km2 in 2008 with the larger kelp beds at La Jolla and Point Loma accounting for the significant majority of the canopy area (Figure 2). Kelp canopy area was generally large or increasing during nominally cold years, and small or decreasing during warm years. Kelp canopy area normalized by site-specific maximum cover across the time series showed large variations through time with the largest proportional changes in the small kelp bed at Cardiff, and more consistent patterns at La Jolla and especially at Point Loma. Notably, the Cardiff kelp bed exhibited very low area and low proportional cover during a multi-year period of warm conditions in the 1990s and again from 2016 through 2019 when canopy area was close to zero. Total canopy area and proportional cover at the Point Loma kelp bed remained closer to its long-term mean throughout the time series and exhibited its maximum cover in 2018. Since 2014, kelp persistence calculated as the annual cover as a proportion of the average cover for the preceding 5 years was lowest at Cardiff (mean 26.4%) and markedly higher at La Jolla (mean 68.7%) and Point Loma (mean 99.9%) (see yearly values in Table 1). The median values of the site-normalized canopy cover differed among sites and among nominally warm versus cold years with the lowest median at Cardiff (9.2% warm years, 37.5% cold years), and more consistent median values at La Jolla (23.5%, 39.6%) and Point Loma (38.3%, 48.0%) between warm years and cold years (Figure 3).
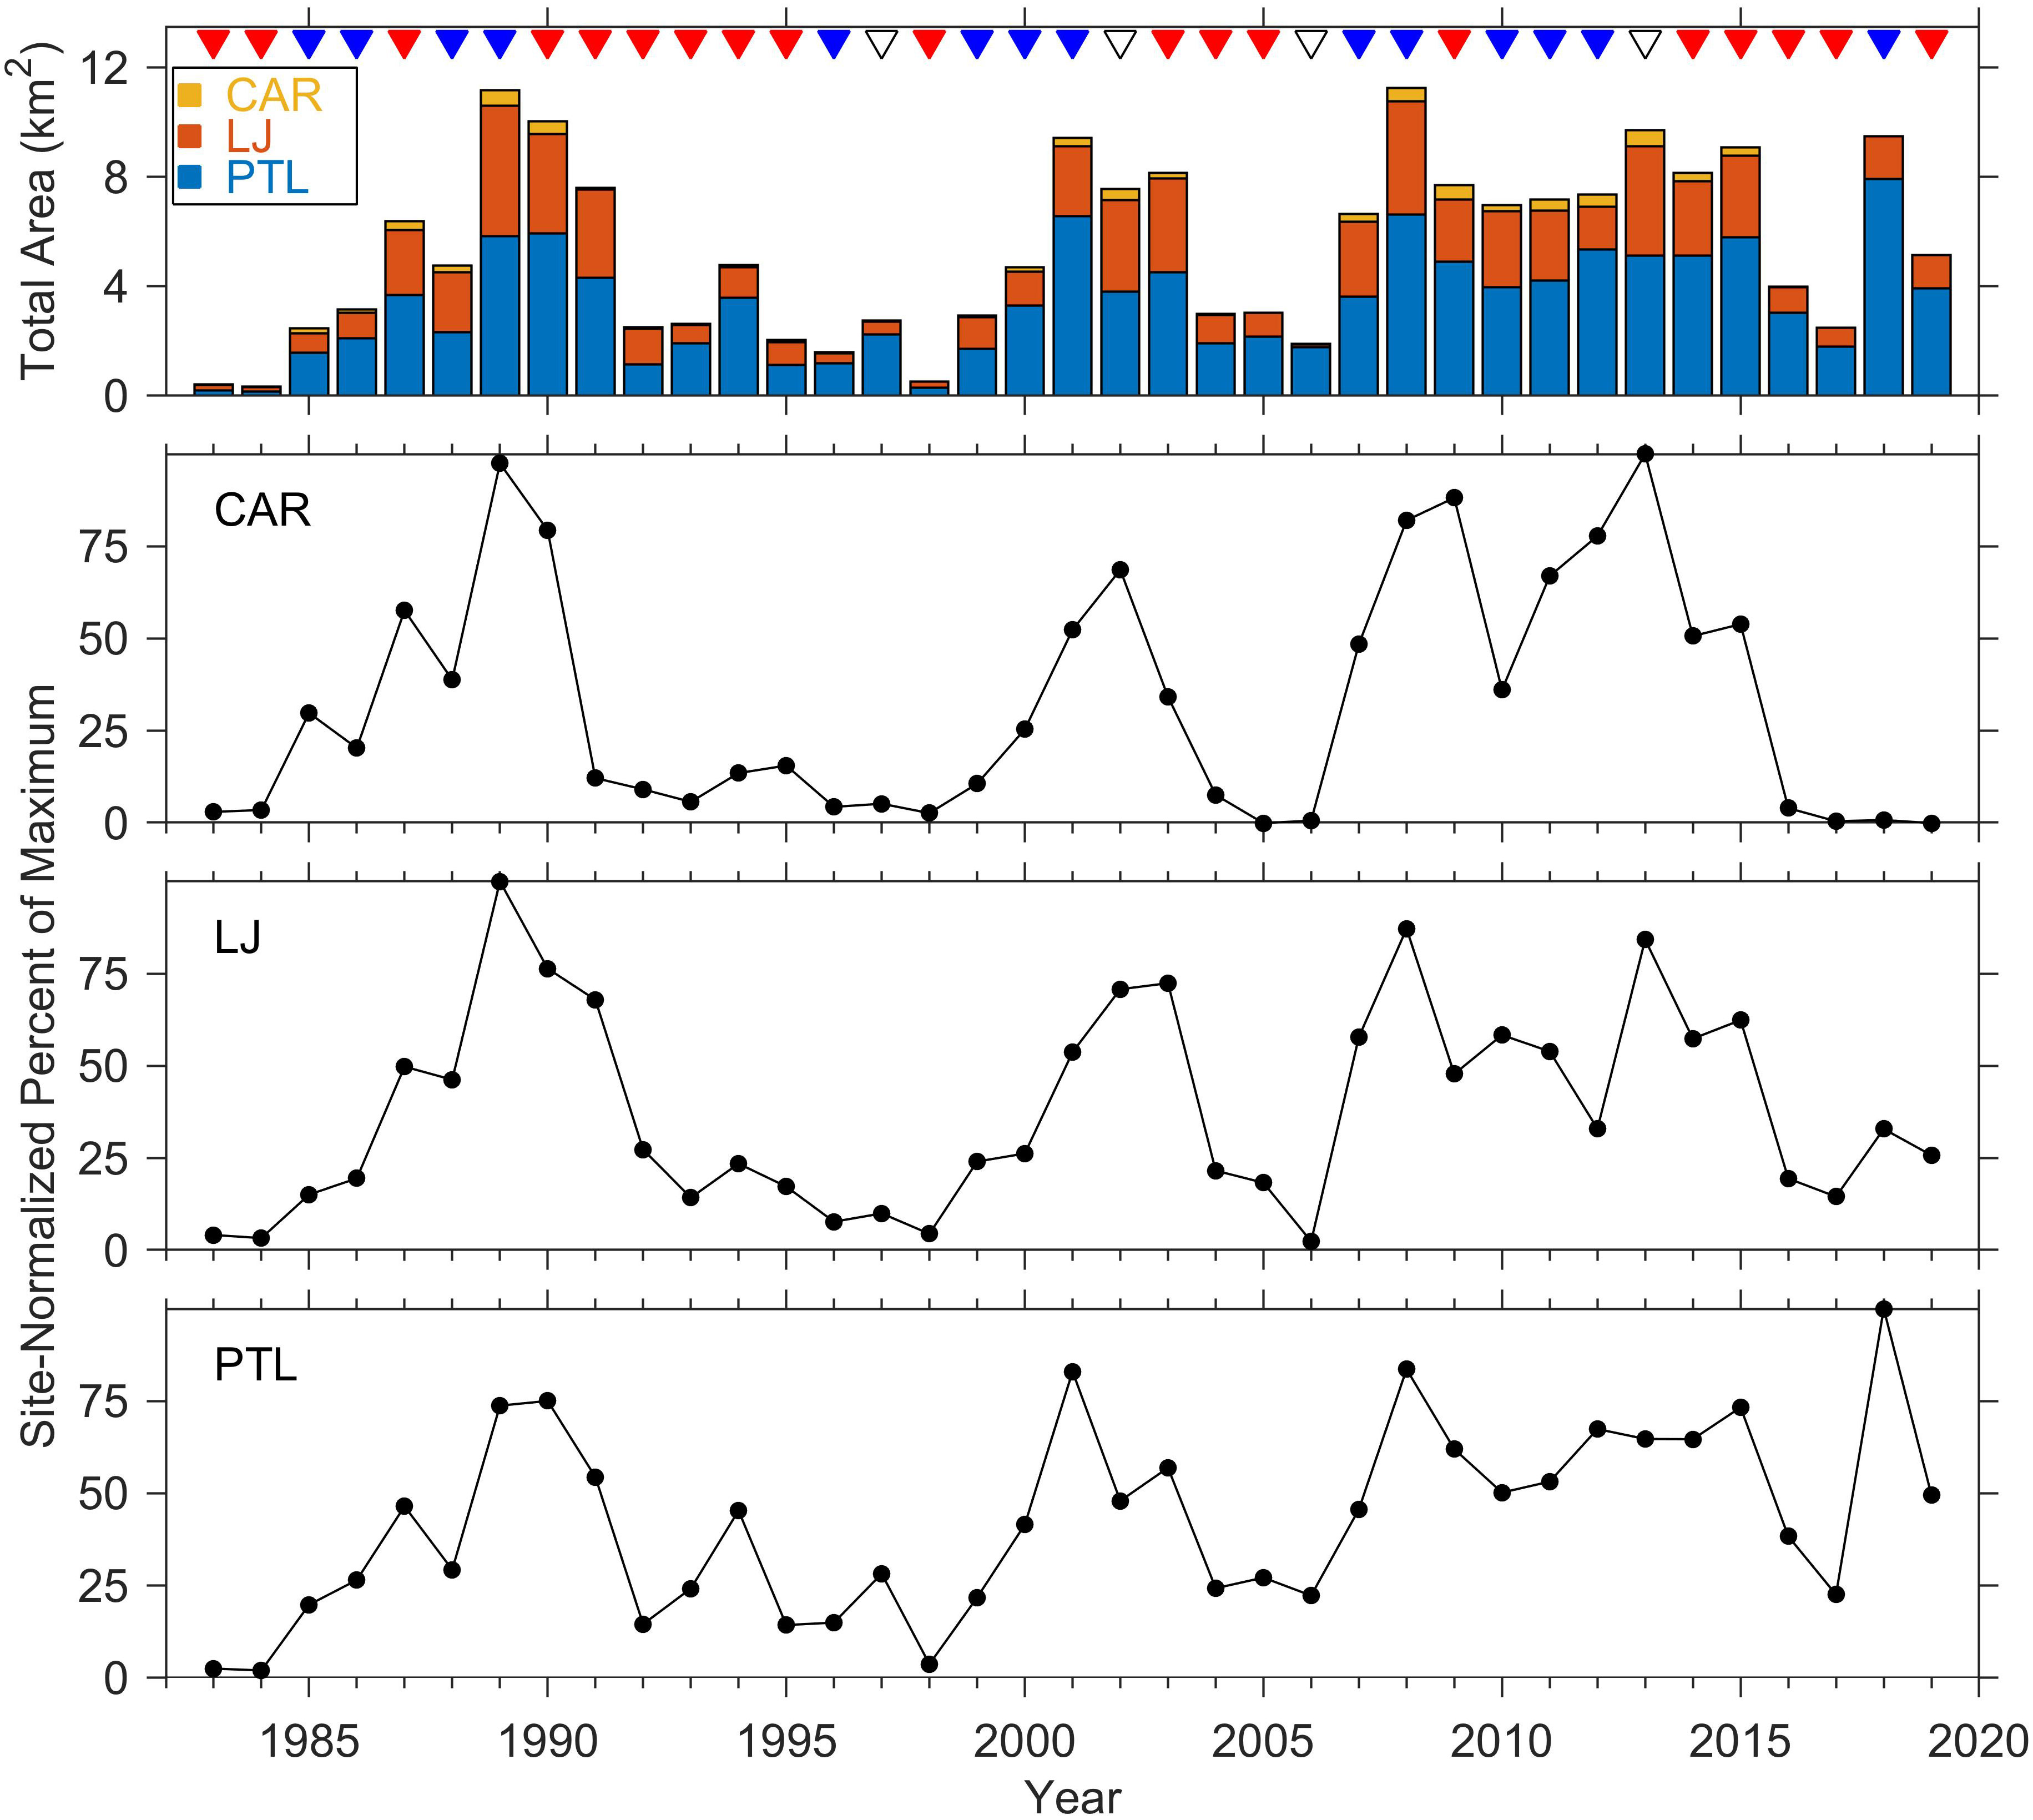
Figure 2 Sea surface kelp canopy cover at Cardiff (CAR), La Jolla (LJ), and Point Loma (PTL) kelp beds 1983 through 2019. Top panel shows total canopy area (km2) color coded by site. Lower three panels show the yearly observations normalized by the maximum value observed across the time series within each site. Triangles at the top indicate years categorized by thermal patterns as warm (red), cold (blue), neutral (black) from the Multivariate ENSO Index; kelp cover are the maximum values recorded annually from quarterly aerial surveys. Data from (MBC Aquatic Sciences, 2020).
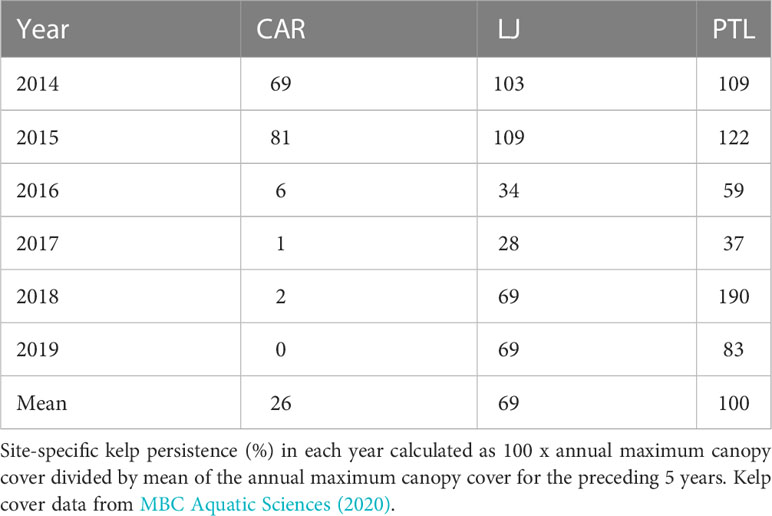
Table 1 Kelp persistence 2014 through 2019 for sites at Cardiff (CAR), La Jolla (LJ), and Point Loma (PTL).
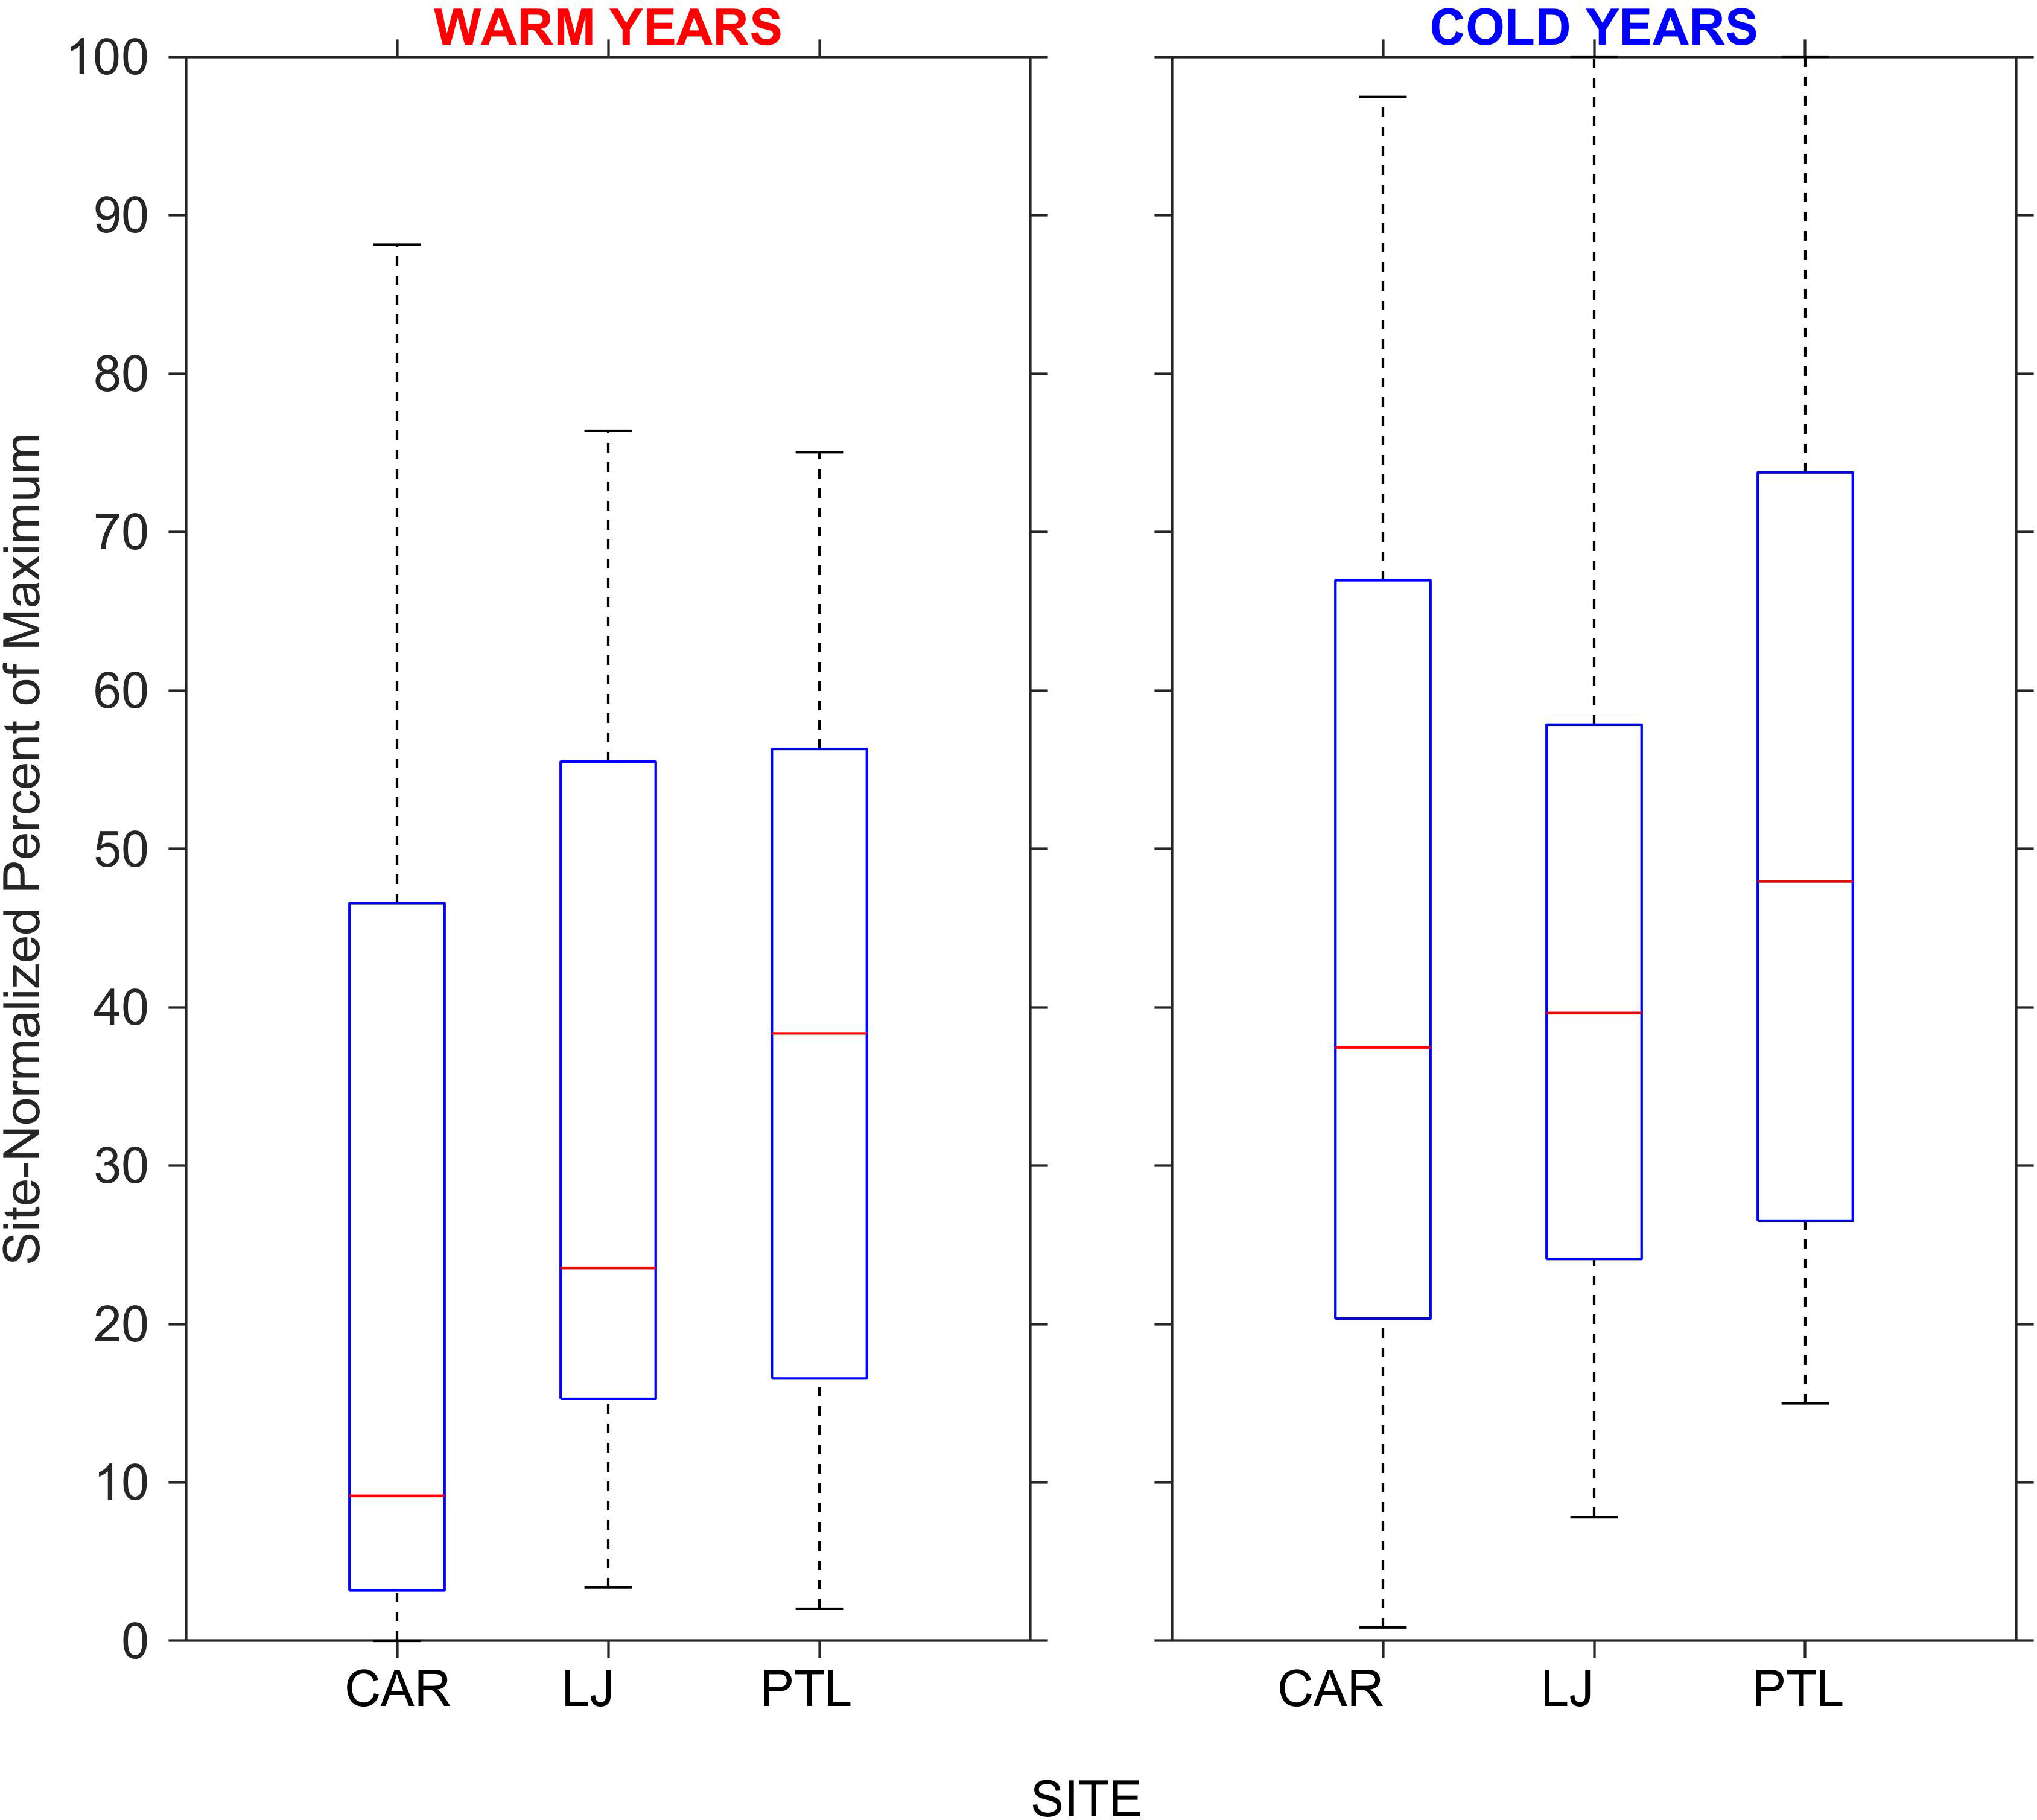
Figure 3 Box plot comparing the distributions of site-normalized historical kelp canopy cover at the Cardiff (CAR), La Jolla (LJ), and Point Loma (PTL) sites for the period 1983 through 2019 among nominally warm and cold years. Horizontal red bars indicate median values, blue boxes extend to the 25th and 75th percentiles and whiskers include the extreme values. Median values at CAR, LJ, and PTL were 9.2, 23.5, and 38.4 % in warm years and 37.5, 39.6, and 47.9 % in cold years respectively. Data from MBC Aquatic Sciences, 2020.
The 11-mo temperature time series exhibited clear seasonal variation with cooler temperatures across the water column dominating from Jun through Aug 2014, and Feb through May 2015, while significantly warmer temperatures persisted from Sep 2014 through Jan 2015 (Figure 4A). Temperature extremes ranged from low of 10.14°C to high of 23.94°C at 1 m and 24 m above the bottom respectively at North La Jolla and temperature extreme values were similar among sites. The minimum and maximum temperatures were comparable across sites (minima 10.14 to 10.27°C, maxima 22.28 to 23.94°C), with the mean temperatures 0.7 to 1.1°C warmer at North La Jolla than at the other sites. The depth of the 14.5°C isotherm varied significantly through time at both seasonal time scales and higher frequencies (Figure 4A white line). From Jun through Aug 2014 and Feb through May 2015 the height of the 14.5°C isotherm ranged from ~ 5 to > 24 m above the bottom across the study sites, with isotherm depths at North La Jolla occurring deeper than at other sites, especially during Mar through May 2015. Corresponding to the water column temperature distributions and isotherm depths, the estimated total water column NO3- exhibited clear seasonal differences with highest NO3- and extensive variability from Jun through Aug 2014 and from Feb through May 2015, and consistently low NO3- from Sep 2014 through Jan 2015 associated with anomalous warming and the onset of a marine heatwave during the “Pacific Blob” event (Figure 4B). The total daily water column integrated NO3- exposure (mol-days m-2) over the 11-mo time series differed across sites, with maximum values at Point Loma (28.45) followed by South La Jolla (25.06), Cardiff (23.61), and North La Jolla (18.61). For the full study period the high frequency components of NO3- exposure associated with internal waves accounted for 4.4 to 8.7% of the totals with greatest contribution at Point Loma, while lower frequency components of NO3- exposure associated with seasonal upwelling accounted for 91.3 to 94.9% of the totals, see Table 2.
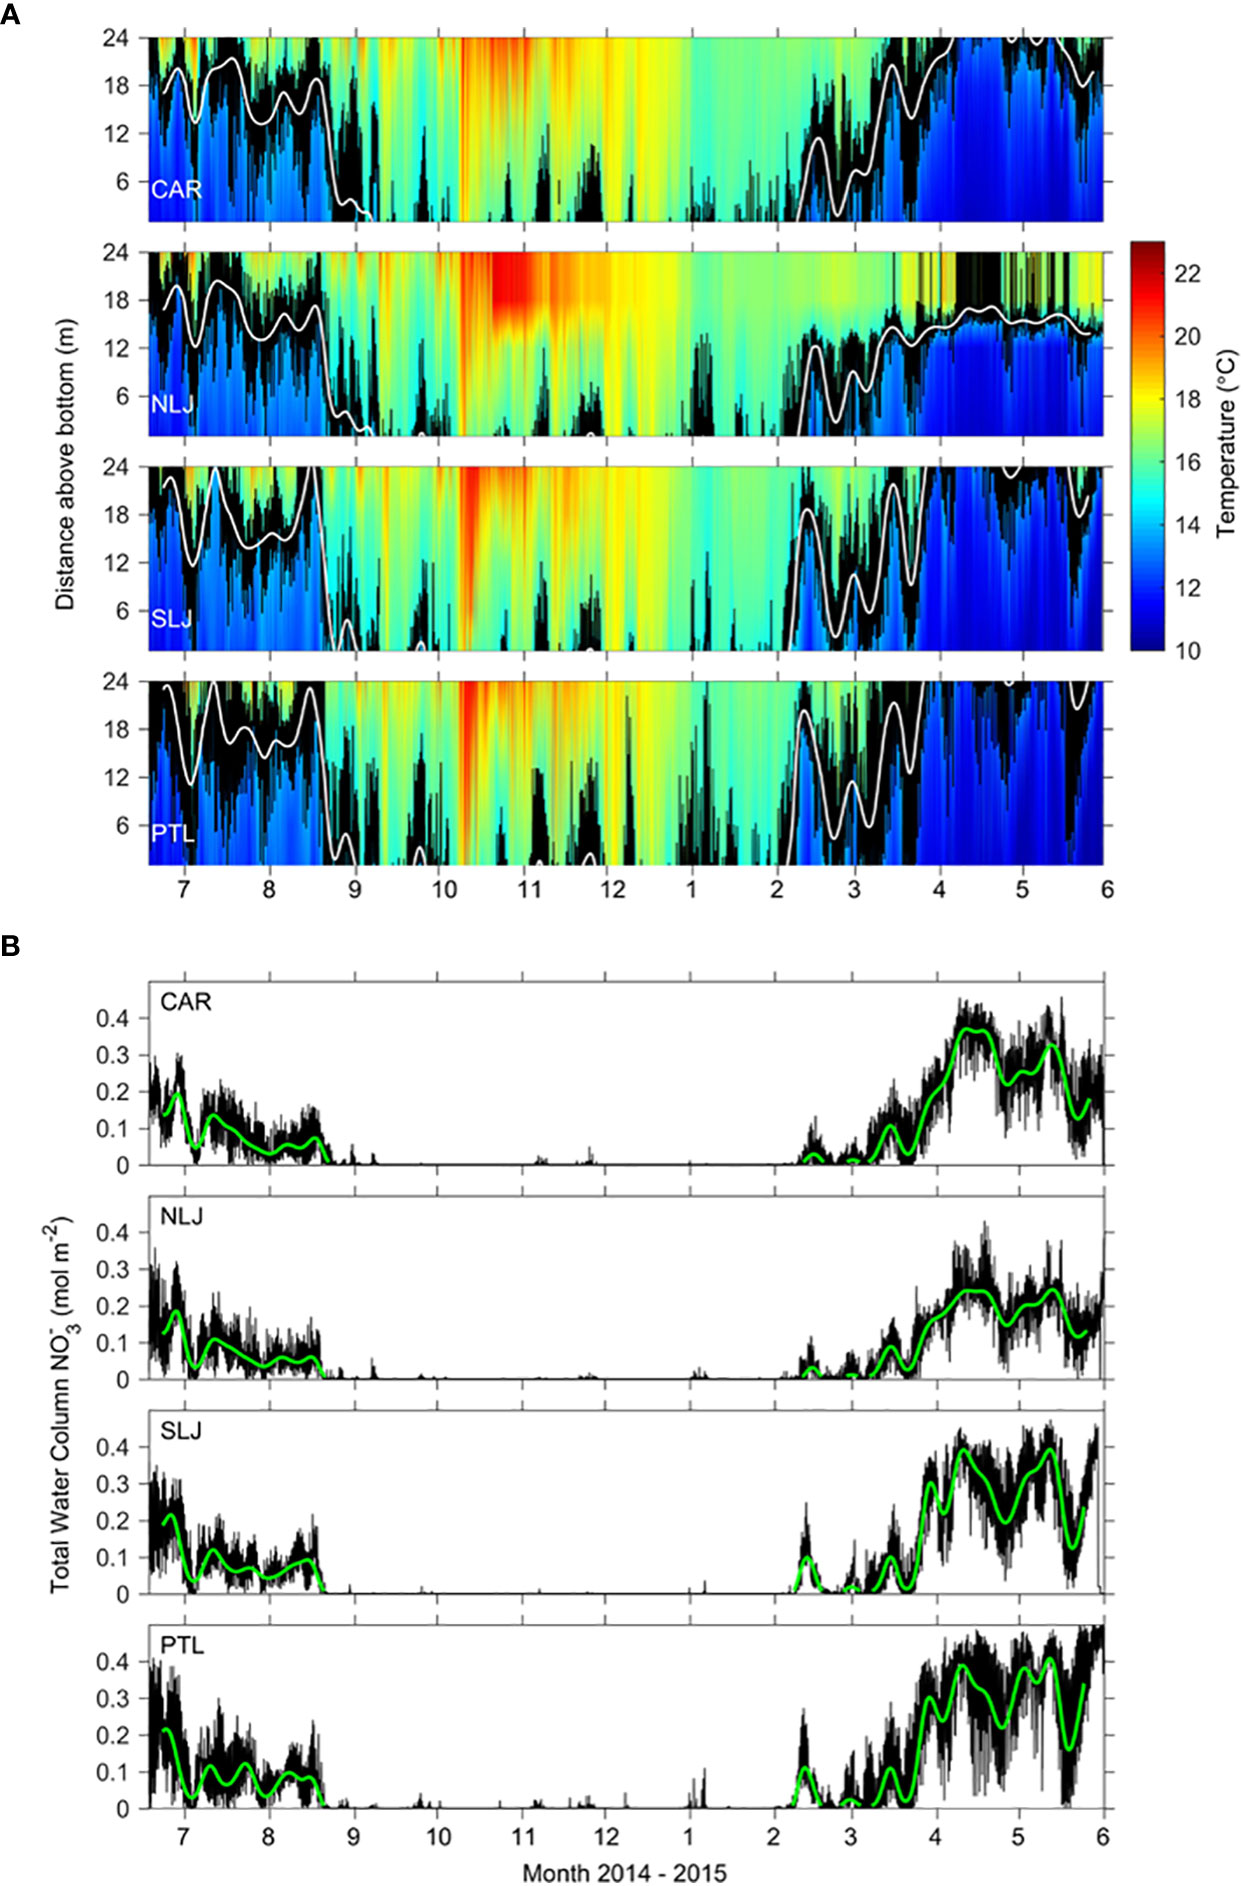
Figure 4 (A) Continuous record of water column temperatures June 2014 through May 2015 at 4 coastal study sites at 1 min intervals for the lower 24 m of the water column above the seafloor at 36 m bottom depth. Color shows interpolated temperature indicated by color bar at right. Black lines indicate vertical position of the 14.5 °C isotherm in raw data; white lines indicate vertical position of 14.5 °C isotherm for 10-d filtered data. (B) Water column integrated nitrate (NO3-) predicted from temperature; black lines show water column NO3- based on 1-min temperature data, green lines show water column NO3- based on 10-d filtered temperatures.
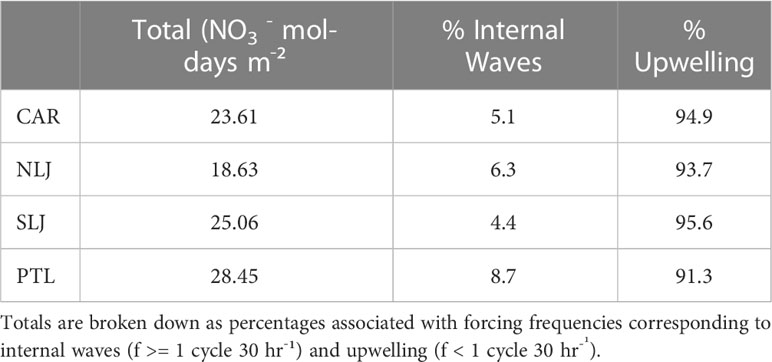
Table 2 Total nutrient exposure (NO3- mol-days m-2) across the study year (24 Jun 2014 through 25 May 2015, n = 336 d) for sites at Cardiff (CAR), North La Jolla (NLJ), South La Jolla (SLJ), and Point Loma (PTL).
Associated with the varying presence of water cooler than 14.5°C, the winter and spring seasons were characterized by relatively high NO3- concentrations and extensive variability of NO3- at high frequencies, while the period from Sep through Jan was characterized by consistently low predicted NO3- concentrations, and occasional high frequency pulses of nitrate exposure. The view of the full 11-mo time series in Figure 4 illustrates the major seasonal differences.
A more detailed, expanded view of the temperature and estimated NO3- time series for mid Sep through mid-Dec 2014 and Mar through May 2015 reveal additional details of the variability within and among sites (Figures 5A, B). From mid Sep through mid-Dec 2014 temperatures were at their annual warmest, with only intermittent periods when the 14.5°C isotherm was present, corresponding to short-term pulses of NO3- exposure which were most evident at Point Loma. By contrast, temperatures were cold and highly variable from Mar through May 2015 with the depth of the 14.5°C isotherm varying throughout the water column and frequently changing depth by as much as 5 to 20 m within tens of minutes to several hours. The variability among sites from Mar through May 2015 is evident in both the water column temperatures and water column integrated NO3- time series, with generally high concentrations of NO3- across sites, but with a persistent pool of warmer water evident shallower than 15 m above the bottom at North La Jolla. Corresponding to the differences in water column temperatures, North La Jolla exhibited the lowest total water column NO3- among sites during Mar through May 2015, followed by Cardiff, South La Jolla, and Point Loma. The variability in NO3- exhibited similar corresponding patterns of differences among sites, lowest at North La Jolla and greatest at Point Loma (Figure 5B).
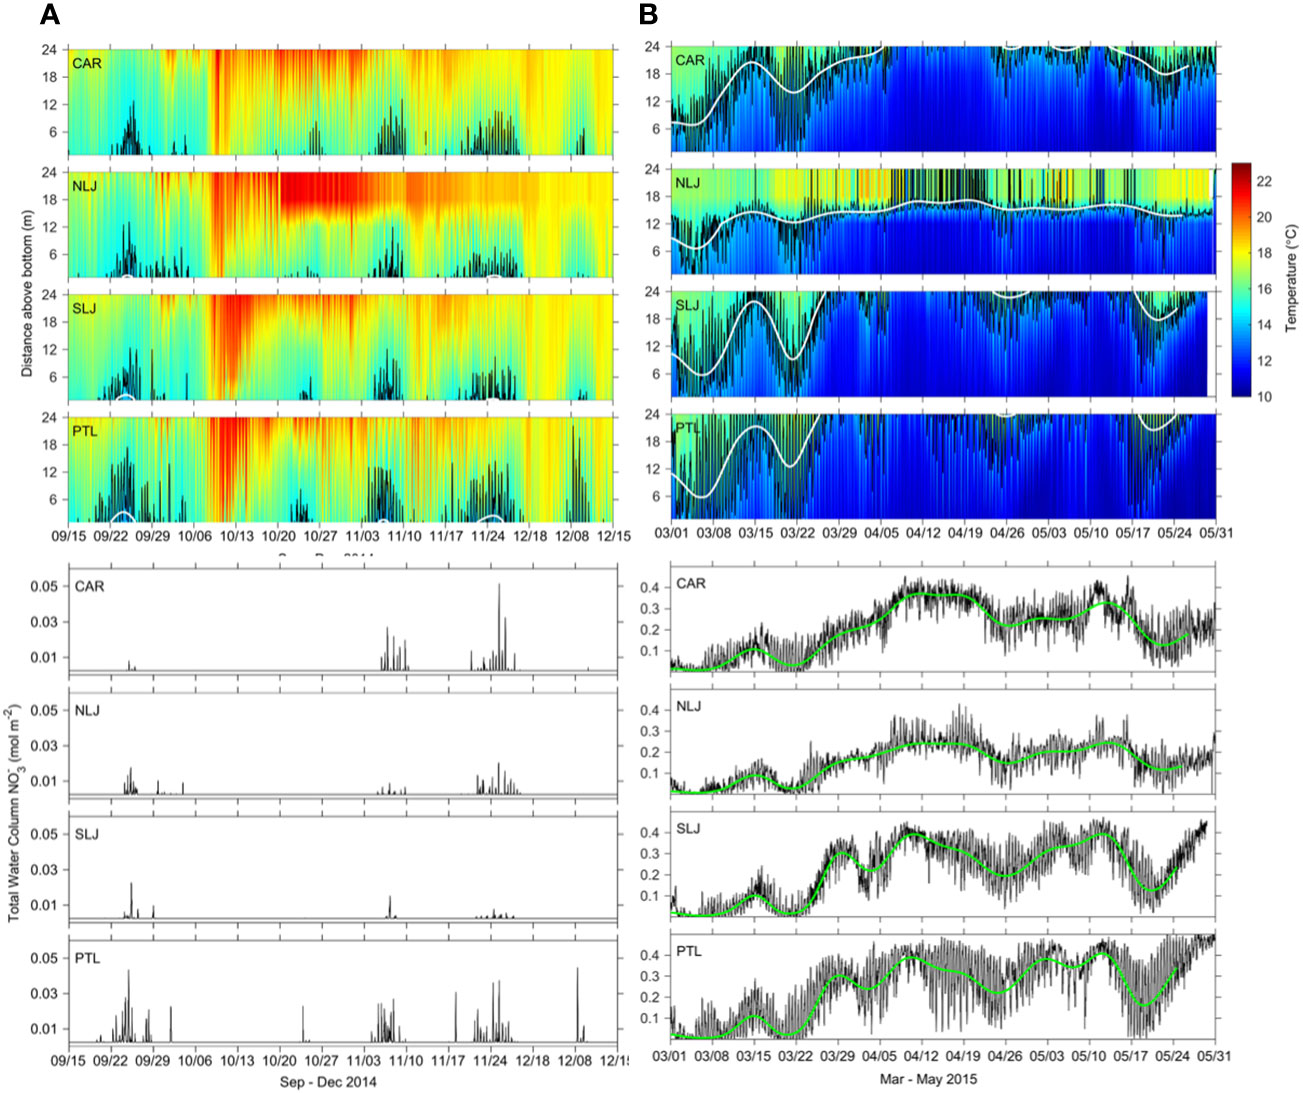
Figure 5 Expanded views of data seaward of 4 kelp forest study sites shown in Fig 4 for two time periods: (A) 15 Sep - 15 Dec 2014 and (B) 1 Mar – 31 May 2015. Upper panels in A and B show temperatures at 1 min intervals for the lower 24 m of the water column measured at 36 m bottom depth. Black lines indicate position of the 14.5 °C isotherm at 1 min intervals, white lines indicate position of the 14.5 °C isotherm for 10-d filtered data. Lower panels show total water column integrated NO3- for 1-min data (black lines) and 10-d filtered data (green lines).
Power spectra of the NO3- time series for each site indicate marked spectral peaks at the semidiurnal frequency, 1.94 cycles per day, and also peaks corresponding to the diurnal frequency (Figure 6). There are also differences among sites in the heights of the peaks at the semidiurnal frequency, indicating greatest semidiurnal variability at Point Loma, followed by South La Jolla, and smaller peaks at Cardiff and North La Jolla.
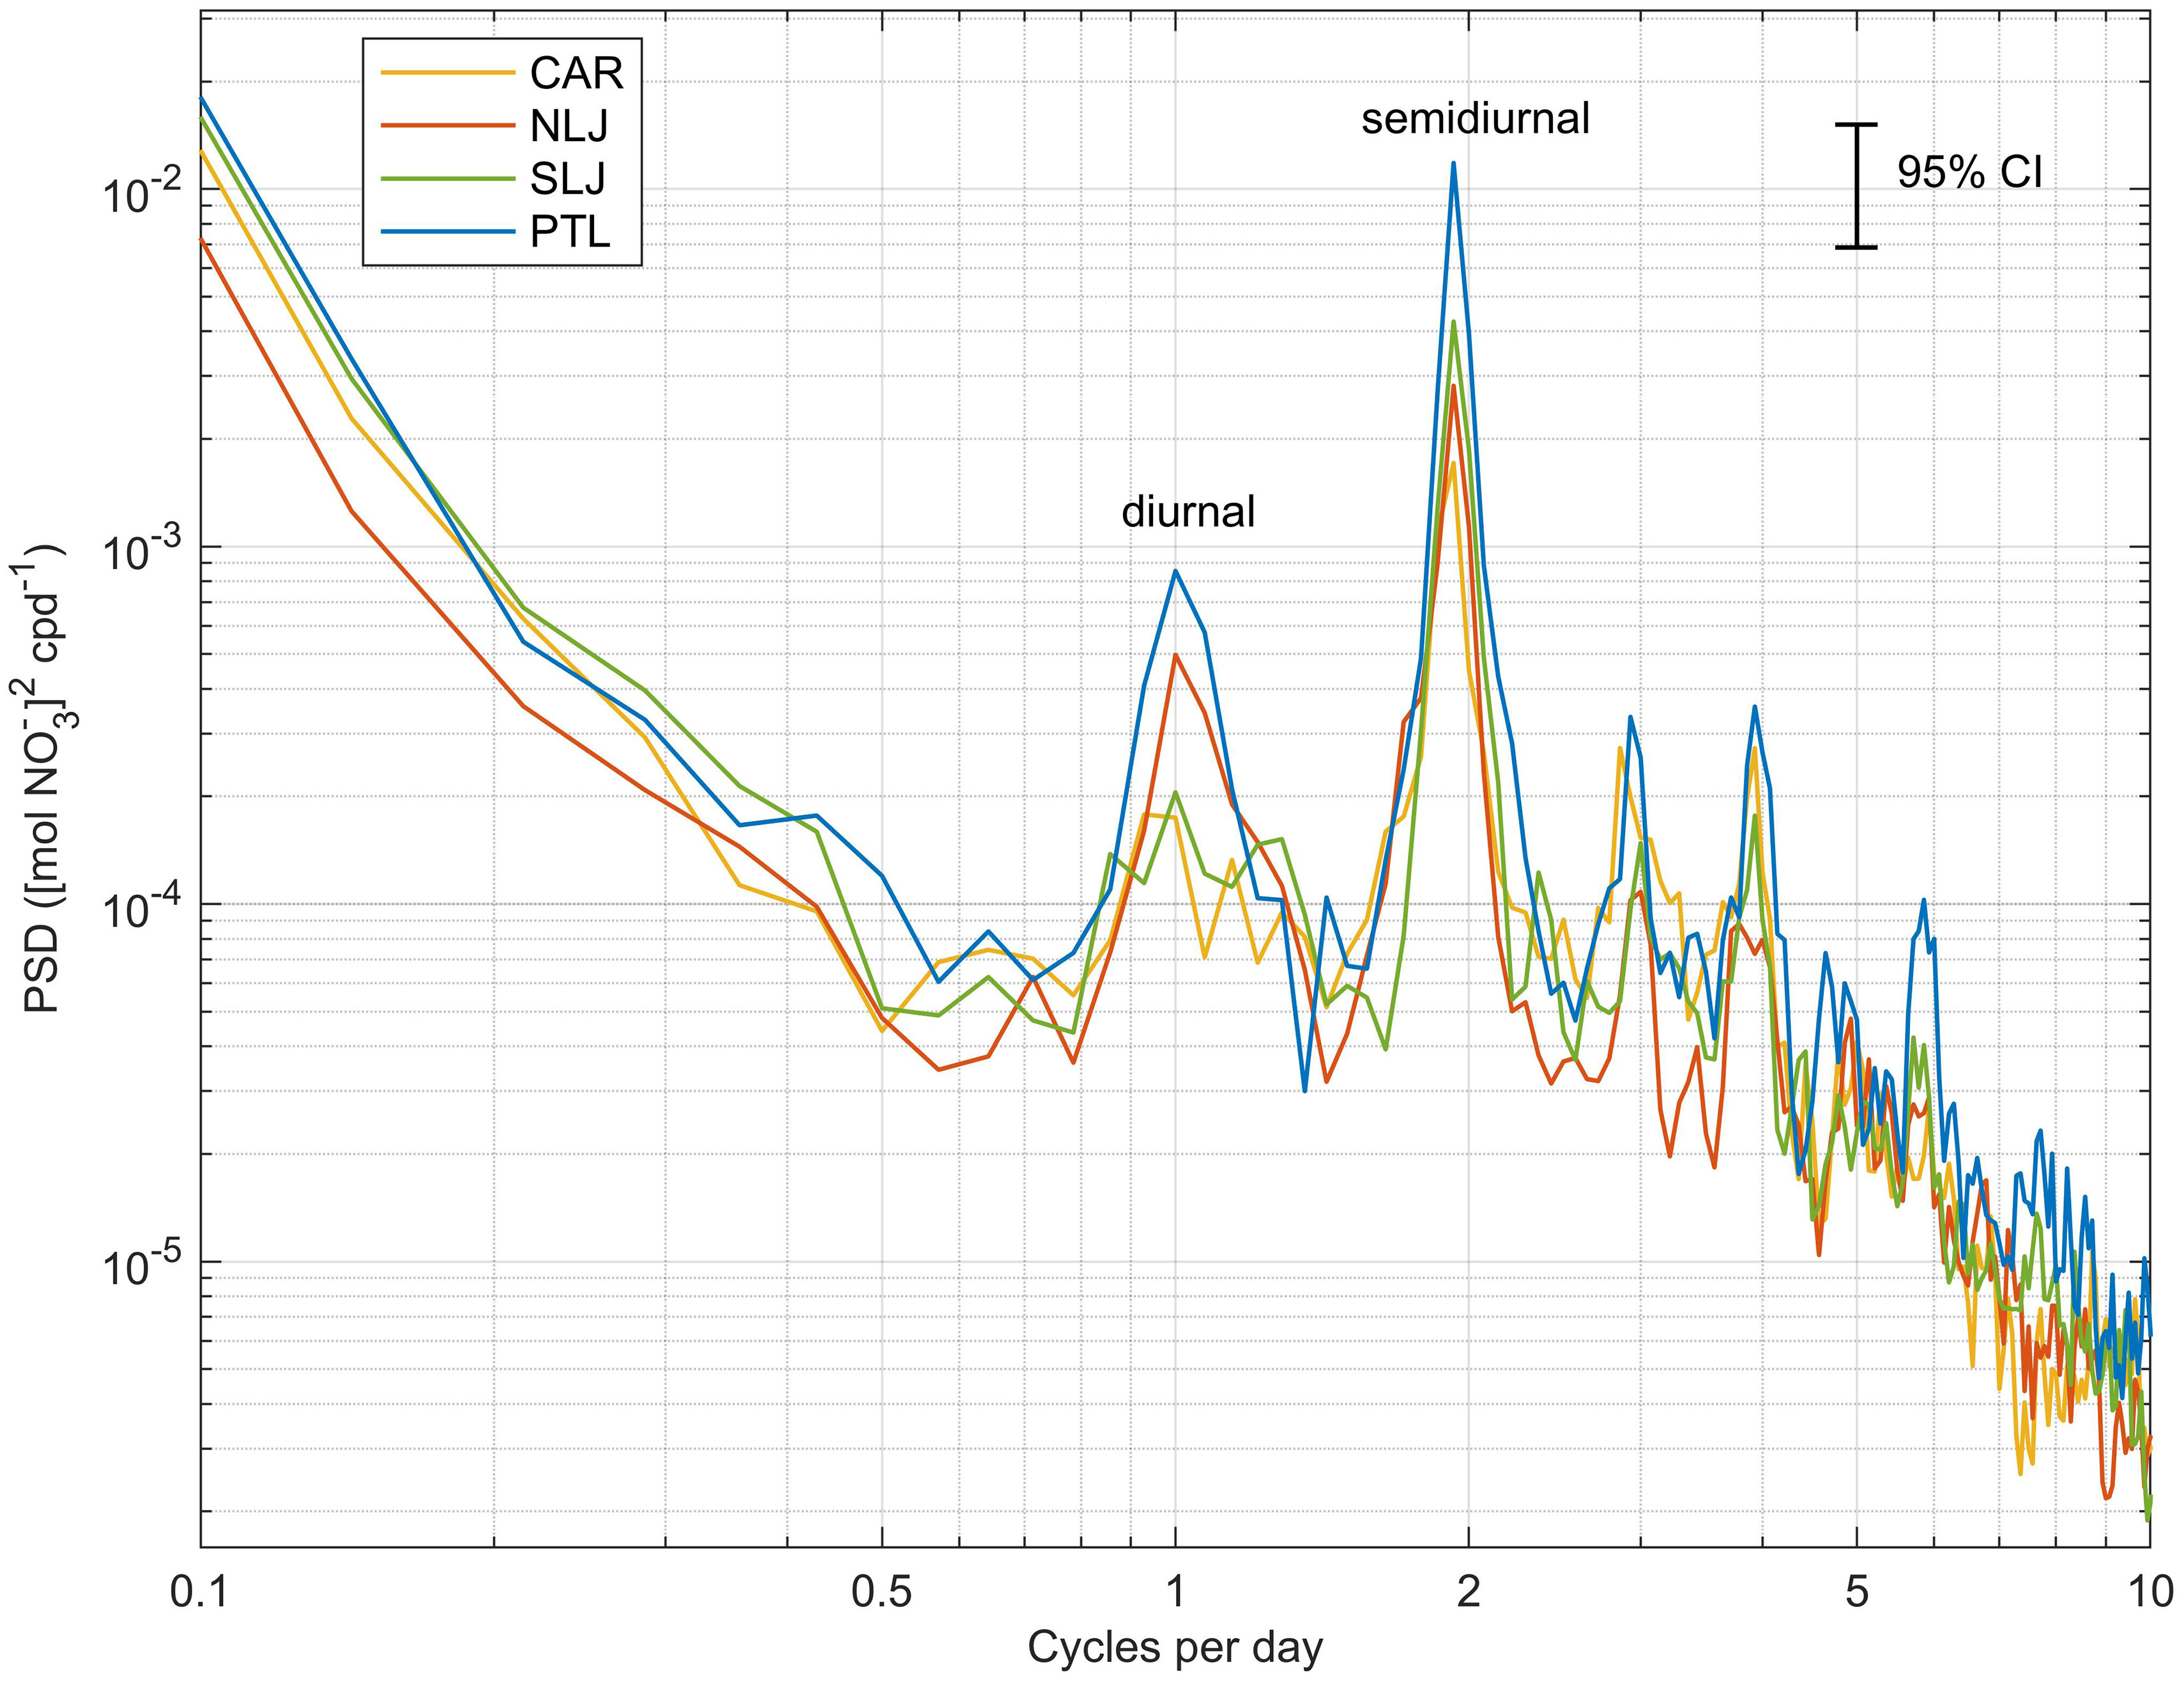
Figure 6 Power spectral density of water column integrated NO3- at each kelp forest study site for the study period Jun 2014 through May 2015. Error bar shows 95% confidence interval for the spectra calculated on a series of 14-d windows with 50% overlap. Sites indicated by color shown in legend in upper left.
The total estimated NO3-, binned quarterly, further demonstrates the patterns of major variation among seasons as well as differences among sites (Figure 7). There was high NO3- exposure in Jun-Sep 2014 and especially in Mar-May 2015, while total NO3- was consistently low in Sep-Dec 2014 and low to intermediate in Dec-Mar 2015. There were clear differences among sites in the total estimated NO3- with exposure consistently highest at Point Loma and consistently lowest at North La Jolla across quarters and for the full year totals (Figure 7 and Table 2). The relative contribution of high frequency (ƒ >= 1 cycle 30 hr-1) and low frequency variability in NO3- exposure as a percentage of the totals varied markedly among quarters of the study period. During the periods of high NO3- exposure in Jun-Sep 2014 and Mar-May 2015, seasonal upwelling accounted for 90 to 95% of the total NO3- signals across sites. By contrast, during periods of low overall NO3- exposure, when water column temperatures were generally warm, short pulses associated with high frequency internal waves accounted for 10% to as much as 100% of the total NO3- exposure.
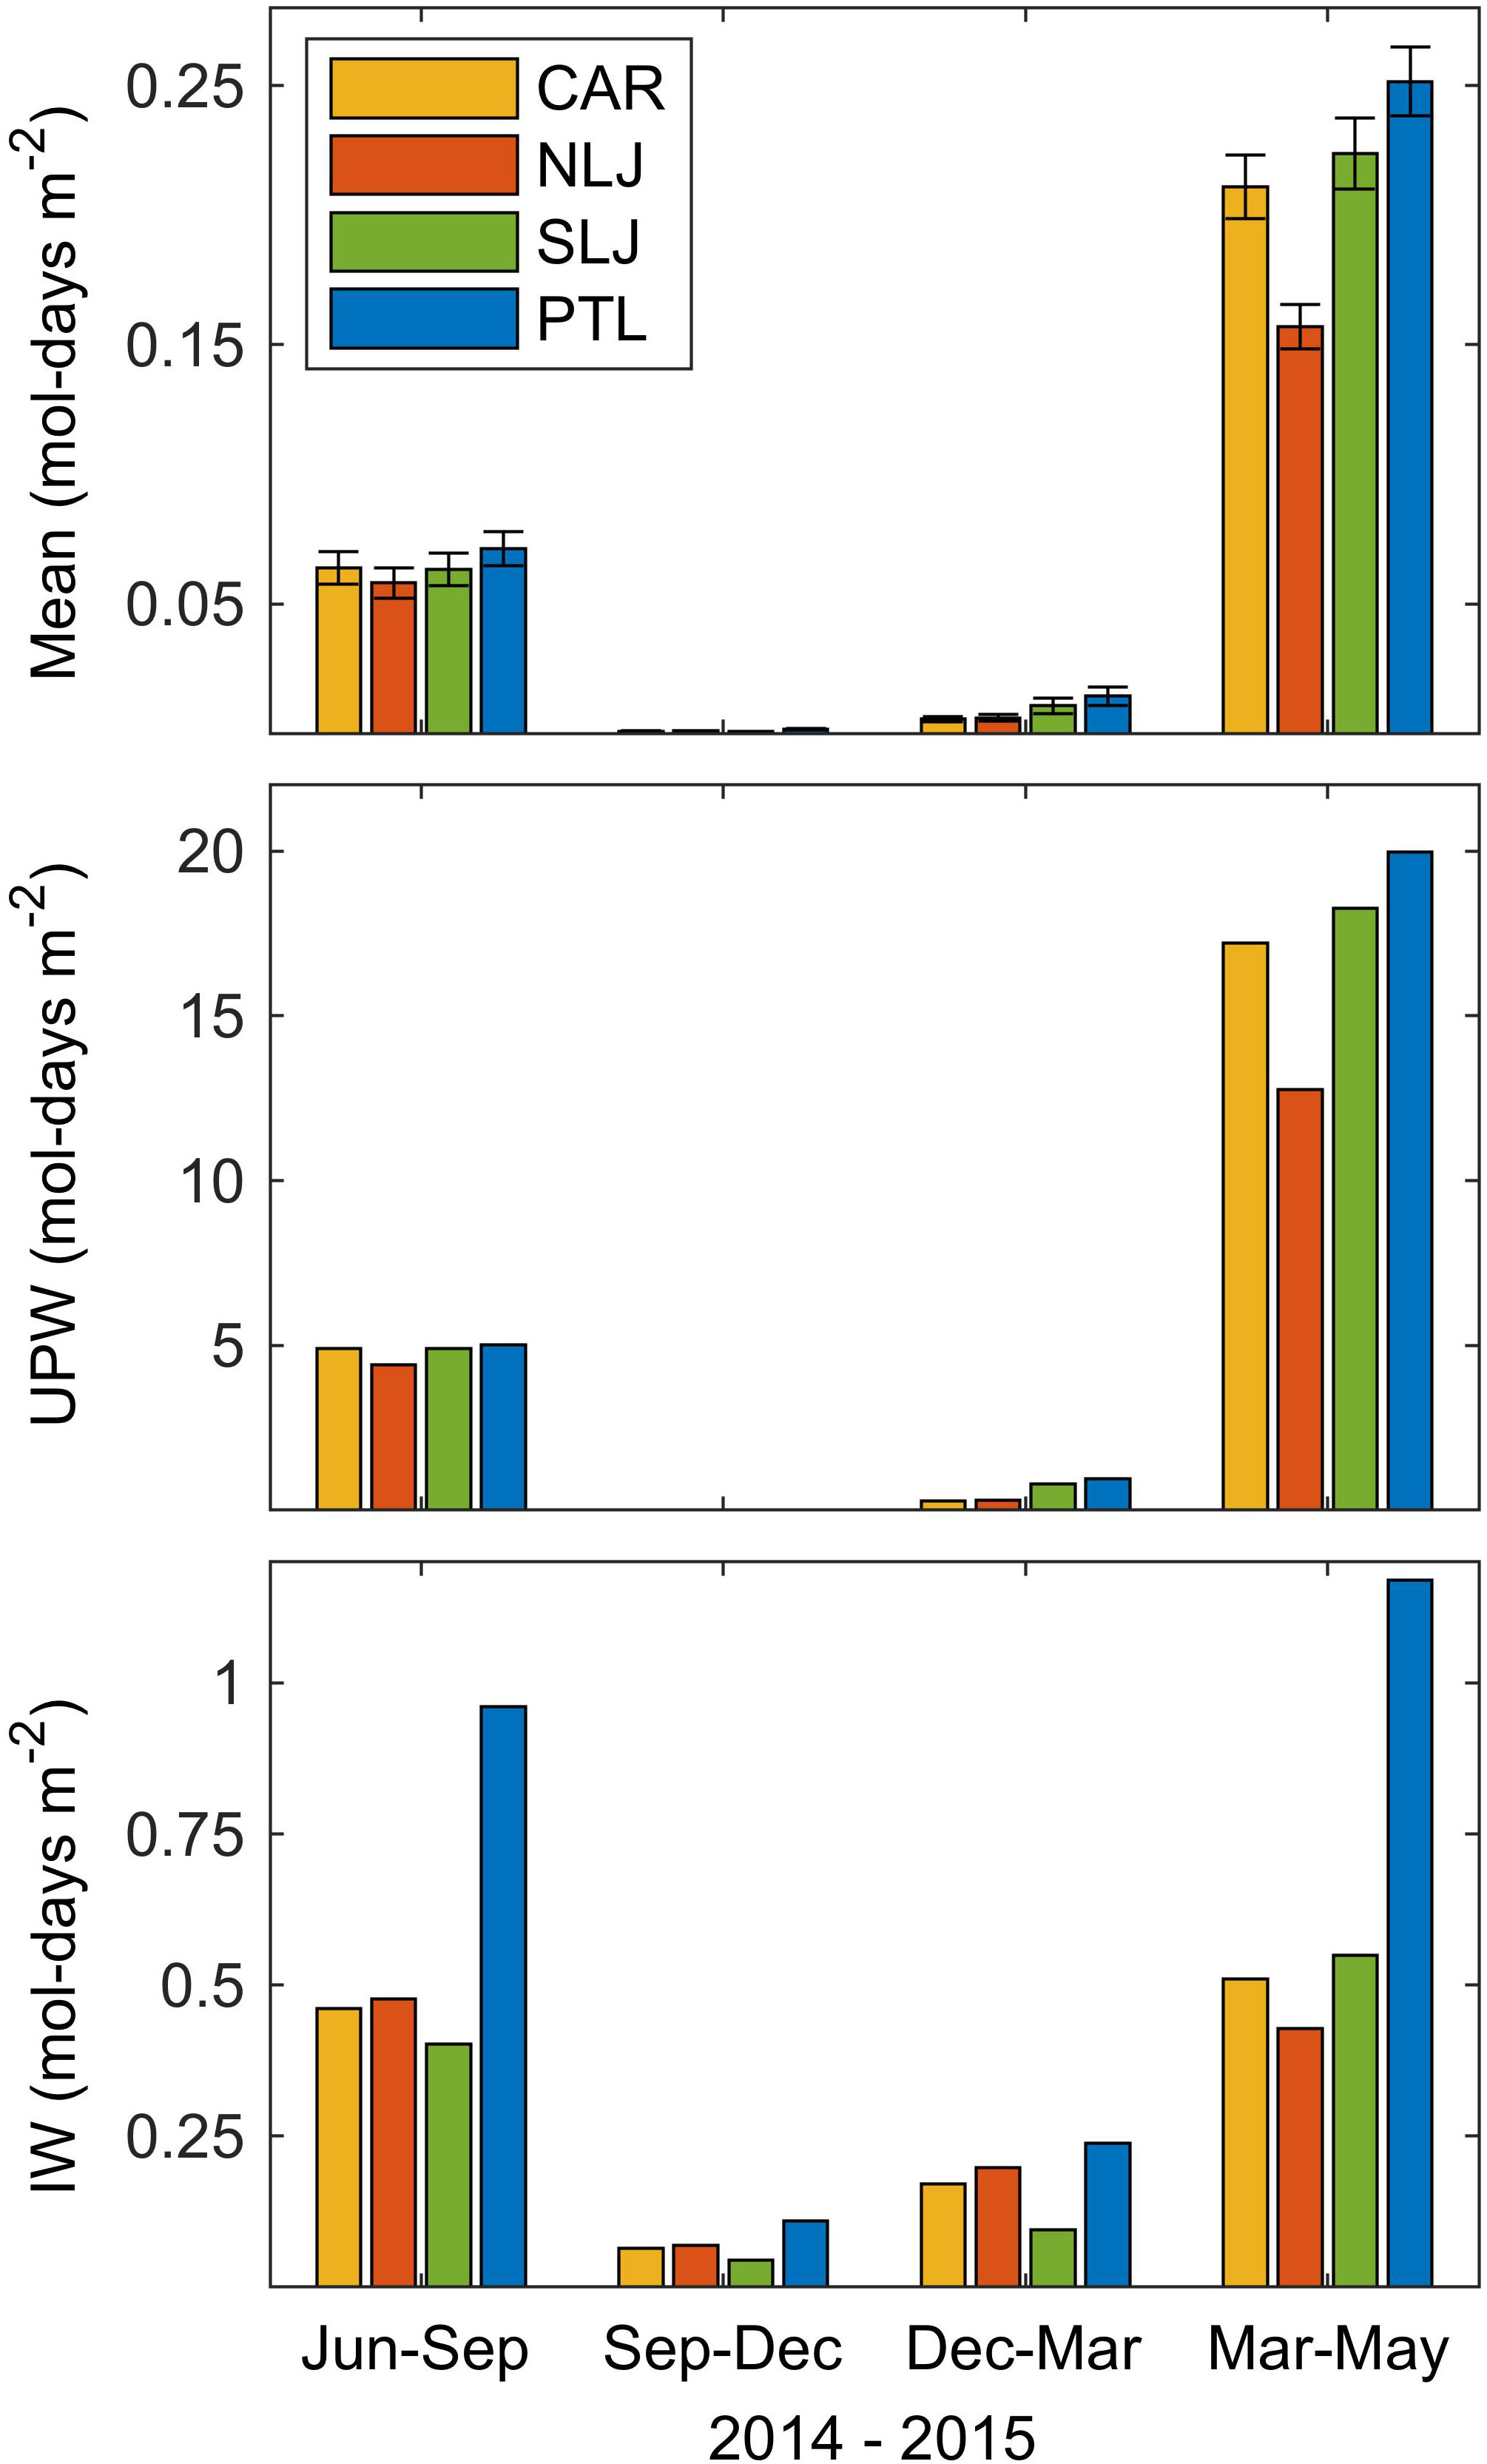
Figure 7 Quarterly estimated total nitrate exposure, (NO3- mol-days m-2) for each of the study sites for period 24 Jun 2014 through 25 May 2015. Top panel shows quarterly means and standard error of the total NO3- exposure. Middle panel show totals for the low-frequency component of exposure corresponding to seasonal upwelling, UPW, (ƒ < 1 cycle 30 hr-1). Lower panel shows totals for the high-frequency component of exposure dominated by diurnal and semidiurnal internal waves, IW, (ƒ >= 1 cycle 30 hr-1). Note differences in y-axis scaling among panels. Sites indicated by color legend in top panel.
4 Discussion
Variation in kelp bed canopy cover across the nearly 4-decade time series considered here highlights both the highly variable nature of kelp abundance and clear differences among kelp beds with respect to total size and site-normalized persistence through time. The total area of the Point Loma and La Jolla kelp beds far surpass that of the small bed at Cardiff, primarily reflecting marked differences among sites in the availability of rocky substrata at depths less than ~25 m. Changes in the site-normalized canopy cover, and patterns of persistence since 2014 show clear patterns of Point Loma > La Jolla >> Cardiff. Notable during the recent period is a sharp decline in the Cardiff kelp bed since 2016 while the kelp beds at La Jolla and particularly at Point Loma have persisted and even increased in area. While the aerial survey data analyzed here consider the La Jolla kelp bed as a continuous one, local observations have also shown recent, as well as long-term differences between the south portion which has remained relatively consistent and the north portion, where kelp cover has been very low especially since 2016. It is important to note that canopy cover at the sea surface is only a portion of the total kelp biomass through the water column, and near bottom biomass of kelps, as well as the components of total algal biomass associated with other benthic algae, can remain present even in years when kelp surface canopy is reduced or absent. However, during years of high surface canopy biomass, there is likely to be corresponding high kelp biomass both through the water column and at the seafloor. It is reasonable to expect that variation in kelp bed canopy cover, and site-normalized cover through time are useful indicators of overall kelp dynamics.
The distribution, abundance, persistence and resilience of kelp beds are controlled by a range of interacting environmental and biological processes with complex, stochastic, and non-linear responses. For the study sites here, Cardiff has the smallest area of suitable rocky substrata and the smallest kelp bed size (E. Parnell unpublished observations). At Cardiff the primary mode of the rocky substrate depth distribution (~8 m) is shallower than at La Jolla (~17 m) or Point Loma (~14 m) (E. Parnell unpublished data). The Cardiff kelp bed, along with shallow portions of the North La Jolla kelp bed, are therefore, likely exposed to less frequent intrusions of NO3- from deeper water, and longer durations of exposure to warmer surface waters. In addition to effects on mature sporophytes, spatial differences in nutrient exposure associated with the site-specific quantity and depth distribution of rocky substrata may influence spore production, gametophyte growth and reproduction, and subsequent recruitment of early stage sporophytes. It is important to note that individual factors such as nutrient exposure are unlikely to explain complex interactions in kelp ecosystems. However, there is also significant potential for mechanistic links between spatial variation in oceanographic forcing and the dynamics, spatial heterogeneity, and ecology of kelp communities. The observations of spatial differences in kelp persistence, with the greatest persistence at Point Loma, correspond to consistent patterns of variability among sites in the modelled integrated water column NO3- exposure among sites, both seasonally and when summed through time. Notably variability in the NO3- signal also showed the same spatial pattern and was concentrated at the semidiurnal and to a smaller extent the diurnal frequencies, indicative of internal waves which may play significant roles in alongshore heterogeneity of the kelp beds in San Diego. These observations support the general hypothesis that patterns of kelp persistence within the region map onto, and are influenced by, spatial and temporal patterns of NO3- availability, and suggest that differences in nutrient climate can at least partially explain spatial variation in community dynamics of these key foundation species.
Nitrate exposure is clearly not the only driver of kelp bed persistence; however, it is certainly one of the most recognized limiting factors in kelp survival, with the nutrient status of kelp blades being linked to adult survival during periods of suboptimal environmental conditions, such as thermal stress (Gerard, 1997; Ladah and Zertuche-González, 2022). Although the approach used here is based on a well-established relationship between temperature and nitrate (Zimmerman and Kremer, 1984; Konotchick et al., 2012), the integrated water-column NO3- model does not include fluxes of water and nutrients over the kelp beds, which could further impact complex feedbacks between boundary layer dynamics and nitrate uptake kinetics beyond our characterization of a static nutrient environment (Hepburn et al., 2007). Nevertheless, the patterns detected were notably different across sites and do coincide with spatial patterns of kelp forest persistence in this region. The approach of characterizing site-specific integrated water-column NO3- environments might provide an additional tool for quantifying the physicochemical forcing of sub-thermocline nitrate, which along with light, substrate availability, and disturbance regimes (e.g. storm waves, sand movement, urchins), greatly influence kelp persistence and resilience. The approach of estimating total nitrate exposure from temperature data that are relatively straightforward to collect could be applied in combination with other approaches for reserve planning, restoration efforts, resource management, and potential offshore aquaculture site selection (e.g. Snyder et al., 2020; Zertuche-Gonzales et al., 2022).
Across the full temperature time series from in 2014 and 2015, and during periods of cold water temperatures and high NO3- exposure, we observed as much as 1.2 to 1.5 fold differences among sites, with the North La Jolla and Cardiff sites consistently lower than South La Jolla and especially Point Loma which consistently showed the highest integrated water-column NO3-. During periods of warm temperatures and low overall NO3- exposure, NO3- exposure was 2 to 2.7 fold greater at Point Loma than at North La Jolla and Cardiff with South La Jolla intermediate and generally closer to exposures at Point Loma. During the period from Mar through May 2015, although all sites showed similar temperatures in the bottom of the water column, a persistent surface warm-water pool was present at North La Jolla and not at the other sites in. This persistent surface warm pool from Mar through May 2015, with temperatures consistently warmer than the 14.2°C intercept in the temperature-nitrate relationship, essentially removed the top half of the water column at North La Jolla from contributing to total integrated NO3- over a significant vertical section of the kelp forest. By contrast, the Point Loma, South La Jolla, and Cardiff sites showed a greater overall integrated NO3-, with little to no warm surface pooling, and cooler temperatures throughout the water column during this period.
Of note in the spectral analysis, the Point Loma site also showed the greatest NO3- variability at the semidiurnal frequency, and this pattern is also visible as variability in the raw temperature time series. This demonstrates that NO3- exposure at this site is strongly influenced by semidiurnal internal tidal forcing, even during typical upwelling periods. Semidiurnal internal waves have been shown to provide sub-thermocline nutrients to the shelf in many regions of the world (e.g. Sandstrom and Elliott, 1984; Leichter et al., 1996; Leichter et al., 2003; Lucas et al., 2011). Pulses of nutrients associated with internal waves can result in an increase in seaweed tissue nitrogen over relatively short periods of time (Pérez-Mayorga et al., 2011; Ladah et al., 2012), and have been suggested to lead to kelp forest persistence at depth during warm periods in the Southern California bight (Ladah and Zertuche- González, 2004). While seasonal upwelling is the dominant mode of nutrient exposure overall, during the warmest water period in this study, internal waves provided virtually all of the cool water and associated NO3-, which may be critical for sustaining kelp through nutrient deplete seasons in southern California.
The dynamics and spatial variability of incident internal waves interacting with the continental slope and inshore coastal bathymetry are highly complex. Among the factors influencing these dynamics are changes in the overall mean depth of the thermocline, as well as bottom depth, distance from shore, the strength of forcing, and bottom slope angle (Aghsaee et al., 2010). The mean depth of the thermocline and associated nutricline modulates nutrient provision by high frequency internal waves to the coastal environment due to greater nitrate availability at depth, and the high frequency shoaling transiently makes this pool available to inshore communities in shallow water. At longer seasonal time frames the mean depth of the thermocline is controlled by patterns of seasonal upwelling. The landscape and steepness of the kelp bed area can also influence the amplitude and impact of internal waves. For example, bottom depth, bottom slope, and distance to offshore bathymetric features where internal waves are generated all impact the strength and propagation of internal tidal forcing, all of which can vary over short distances (Ladah et al., 2012; Filonov et al., 2014). These processes might be particularly relevant at a site such as Point Loma where the kelp bed occurs in deeper water closer in horizontal distance to a nutrient source at depth as well as to potential internal wave generation sites. Furthermore, even if the upwards motion of this cooler deeper water does not actually reach the deepest sections of the kelp bed, such as may occur during warmer periods of deeper thermoclines and nutriclines, the non-linear diapycnal mixing of nutrients by internal waves up the slope into the bottom layers of deeper kelp forests might be sufficient to maintain productivity at core areas even during warm years and during marine heatwaves, such as occurs during El Niño events at some sites in the Southern California Bight adjacent to a deep water channel (Ladah and Zertuche- González, 2004). This process has been shown to be highly-spatially variable at scales of only a few kilometers (Filonov et al., 2014) and could certainly result in differences in kelp bed persistence over short distances.
During the period of low NO3- exposure during Sep 2014 through Jan 2015, associated with anomalous surface heating and depression of the thermocline at the onset of the “Pacific Warm Blob”, the pattern of greater integrated water column nitrate at Point Loma relative to the other kelp forest sites studied here was maintained, although with much lower values and much shorter and smaller nutrient pulses. Kelp survival through the important fall period of higher irradiance aided by episodic nitrate provision could allow for some growth and potentially prevent the dilution of nitrogen reserves in new tissue. The combination of high light and sufficient nutrients could allow kelps at sites with short-term nutrient pulses to maintain biomass and spatial dominance in their environment and reduce fall senescence. The provision of even small amounts of nitrate during this period could provide an advantage and increase survivorship, potentially leading to year-to-year persistence. It is unclear from this analysis, however, whether the small, short-term pulses of NO3- would be sufficient for enhanced kelp survivorship, and physiological experiments on nutrient uptake at low concentrations and during periods of nutrient replete conditions would be a valuable next step. Pulse fertilization experiments in culture do suggest that for a smaller kelp (Ecklonia aborea nee Eisenia), weekly 2-hr fertilizations could nearly double tissue nitrogen concentrations (Sánchez-Barredo et al., 2011) and allow for extended survivorship under thermal stress, whereas uptake kinetics of giant kelp suggest they can take advantage of even very rapid, small nutrient pulses (Gerard 1982a; Fram et al., 2008).
Prior studies of nutrient availability in kelp forest habitats have relied primarily on environmental sensing of winds, currents, and ocean temperature (e.g. Jackson, 1977; Zimmerman and Kremer, 1984) and in some recent cases deployment of in situ NO3- sensors (e.g. McPhee-Shaw et al., 2007; Fram et al., 2008). The former studies generally relied on relationships between temperature and nitrate to predict nutrient levels from temperature records, and the latter more recent studies used portions of the study periods when the in situ nitrate measurements were successful to generate estimates of the relationship between temperature and nitrate that could then be used to model NO3- exposure through time from in situ temperature records (e.g. Snyder et al., 2020). There are large variations in total NO3- exposure through time (up to 50-fold changes in monthly integrated totals) associated with wind-driven upwelling that can account for up to 70% of total NO3- exposure and are largely coherent among sites (McPhee-Shaw et al., 2007; Fram et al., 2008). There can also be significant NO3- delivery associated with diurnal, semidiurnal, and higher-frequency internal waves. For a site along the coast of Santa Barbara, NO3- delivery associated with high-frequency events has been estimated to supply from 9 to 12% of total annual exposure (McPhee-Shaw et al., 2007; Fram et al., 2008) and in Northern Baja California, about 11% of the days of the year were shown to have biologically relevant high-frequency sub-thermocline nutrient pulses due to internal wave forcing (Ladah et al., 2012).
In southern California, exposure to internal waves is likely to be more important for overall kelp growth than the annual percentages estimated for Santa Barbara suggest. In this region internal wave impacts can be strongest in summer months when reduced wind-driven upwelling and water column stratification typically lead to a significant reduction in surface NO3- concentrations and periods of prolonged physiological stress in kelps (Zimmerman and Kremer, 1984). Also, the alongshore variation in internal wave exposure may explain a significant proportion of the differences in nutrient availability among sites, particularly for nearby sites (e.g. < 10 – 30 km apart) where wind-driven upwelling may be largely coherent. In Northern Baja California at a spatial scale of less than 10 km, an order of magnitude difference in variance occurs for current speeds forced at the semidiurnal frequency, with large differences in the dominance of the diurnal versus the semidiurnal signal in temperature over this spatial scale (Filonov et al., 2014). Furthermore, inter-annual variation in stratification associated with the El Niño Southern Oscillation (ENSO) has been shown to affect inter- and intra-specific competition among kelp species, and in seasons and years of low surface nitrate availability, internal waves are again likely to be an important source of sustaining nutrients (Dayton et al., 1999). Similarly, with increasing distance south along the coast (e.g. from Santa Barbara to San Diego), warmer surface temperatures and greater depth of stratification may significantly increase the relative importance of short-term nutrient pulses to overall nutrient availability, particularly in seasons and years when upwelling is reduced.
In this study, in situ measurements of variation in temperature with depth and modeled NO3- exposure at multiple sites reveal the importance of both seasonal and higher-frequency diurnal and semidiurnal physical forcing that may contribute to the growth and persistence of local kelp beds. Identifying suitable habitat for productive and resilient kelp is necessary to manage and potentially to restore these valuable resources. Our results suggest that previously observed among-site variability in kelp growth and persistence may be explained, at least partially, by variation in high-frequency pulses of nutrients to overcome persistent warm, nutrient-deplete conditions near the surface. The differences in nutrient exposure estimated here for sites along ~30 km of the coastline in San Diego point to the importance of spatial heterogeneity of nutrient availability at a range of scales, particularly within regions. These observations also suggest high frequency variability and intermittent exposure to nutrient pulses may be increasingly important as southern California coastal ecosystems are exposed to continuing warming and deepening of stratification associated with climate change and increasingly frequent marine heatwaves.
Data availability statement
The raw data supporting the conclusions of this article will be made available by the authors, without undue reservation.
Author contributions
JL led the research and developed the analysis. JL and LL wrote the primary text, and all co-authors contributed to the field research, data analysis, manuscript production, and/or editing. All authors contributed to the article and approved the submitted version.
Funding
This work was support by National Science Foundation grants OCE-1535203 and OCE-2022959, as well as funding from the UC San Diego Academic Senate and UC Ship Fund.
Acknowledgments
We thank the NSF funding agency, UC Academic Senate and UC Ship Fund. We thank the Captain and crew of the R/V New Horizon for assistance with mooring deployments. We thank the Scripps Institution of Oceanography Diving Program for support.
Conflict of interest
The authors declare that the research was conducted in the absence of any commercial or financial relationships that could be construed as a potential conflict of interest.
Publisher’s note
All claims expressed in this article are solely those of the authors and do not necessarily represent those of their affiliated organizations, or those of the publisher, the editors and the reviewers. Any product that may be evaluated in this article, or claim that may be made by its manufacturer, is not guaranteed or endorsed by the publisher.
References
Aghsaee P., Boegman L., Lamb K. G. (2010). Breaking of shoaling internal solitary waves. J. Fluid Mechanics 659, 289–317. doi: 10.1017/S002211201000248X
Arafeh-Dalmau N., Montaño-Moctezuma G., Martínez J. A., Beas-Luna R., Schoeman D. S., Torres-Moye G. (2019). Extreme marine heatwaves alter kelp forest community near its equatorward distribution limit. Front. Mar. Sci. 6, 499. doi: 10.3389/fmars.2019.00499
Bell T. W., Allen J. G., Cavanaugh K. C., Siegel D. A. (2020). Three decades of variability in california's giant kelp forests from the landsat satellites. Remote Sens. Environ. 238, 110811. doi: 10.1016/j.rse.2018.06.039
Bray R. N., Purcell L. J., Miller A. C. (1986). Ammonium excretion in a temperate-reef community by a planktivorous fish, chromis punctipinnis (Pomacentridae), and potential uptake by young giant kelp, Macrocystis pyrifera (Laminariales). Mar. Biol. 90 (3), 327–334. doi: 10.1007/BF00428556
Cavanaugh K. C., Reed D. C., Bell T. W., Castorani M. C., Beas-Luna R. (2019). Spatial variability in the resistance and resilience of giant kelp in southern and Baja California to a multiyear heatwave. Front. Mar. Sci. 6, 413. doi: 10.3389/fmars.2019.00413
Checkley J. D. M., Barth J. A. (2009). Patterns and processes in the California current system. Prog. Oceanography 83 (1-4), 49–64. doi: 10.1016/j.pocean.2009.07.028
Chung I. K., Oak J. H., Lee J. A., Shin J. A., Kim J. G., Park K. S. (2013). Installing kelp forests/seaweed beds for mitigation and adaptation against global warming: Korean project overview. ICES J. Mar. Sci. 70 (5), pp.1038–1044.
Dayton P. K. (1972). Toward an understanding of community resilience and the potential effects of enrichments to the benthos at McMurdo sound, antarctica. in. Proc. Colloquium Conserv. Problems Antarctica, 81–96.
Dayton P. K., Tegner M. J., Edwards P. B., Riser K. L. (1999). Temporal and spatial scales of kelp demography: The role of oceanographic climate. Ecol. Monogr. 69 (2), 219–250. doi: 10.1890/0012-9615(1999)069[0219:TASSOK]2.0.CO;2
Dayton P. K., Tegner M. J., Parnell P. E., Edwards P. B. (1992). Temporal and spatial patterns of disturbance and recovery in a kelp forest community. Ecol. Monogr. 62 (3), 421–445. doi: 10.2307/2937118
Dorman C. E., Palmer D. P. (1981). Southern California summer coastal upwelling. Coast. Upwelling 1, 44–56. doi: 10.1029/CO001p0044
Duke C. S., Litaker W., Ramus J. (1989). Effect of temperature on nitrogen-limited growth rate and chemical composition of ulva curvata (Ulvales: Chlorophyta). Mar. Biol. 100, 143–150. doi: 10.1007/BF00391953
Eppley R. W., Renger E. H., Harrison W. G. (1979). Nitrate and phytoplankton production in southern California coastal waters 1. Limnology Oceanography 24 (3), 483–494. doi: 10.4319/lo.1979.24.3.0483
Estes J. A., Danner E. M., Doak D. F., Konar B., Springer A. M., Steinberg P. D., et al. (2004). Complex trophic interactions in kelp forest ecosystems. Bull. Mar. Sci. 74 (3), 621–638.
Ewing G. C. (1950). Relation between band slicks at the surface and internal waves in the sea. Science 111 (2874), 91–94. doi: 10.1126/science.111.2874.91
Feehan C. J., Scheibling R. E. (2014). Effects of sea urchin disease on coastal marine ecosystems. Mar. Biol. 161 (7), 1467–1485. doi: 10.1007/s00227-014-2452-4
Filonov A., Lavín M. F., Ladah L. B., Tereshchenko I. (2014). Spatial variability of internal waves in an open bay with a narrow steep shelf in the pacific off NW Mexico. Continental Shelf Res. 78, 1–15. doi: 10.1016/j.csr.2014.01.015
Foster M. S., Schiel D. R. (1985). The ecology of giant kelp forests in California: A community profile US Fish and Wildlife Service. Biol. Rep. 85 (2), 152.
Fram J. P., Stewart H. L., Brzezinski M. A., Gaylord B., Reed D. C., Williams S. L., et al. (2008). Physical pathways and utilization of nitrate supply to the giant kelp, Macrocystis pyrifera. Limnology Oceanography 53 (4), 1589–1603. doi: 10.4319/lo.2008.53.4.1589
Gerard V. A. (1982a). Growth and utilization of internal nitrogen reserves by the giant kelp Macrocystis pyrifera in a low-nitrogen environment. Mar. Biol. 66 (1), 27–35. doi: 10.1007/BF00397251
Gerard V. A. (1982b). In situ water motion and nutrient uptake by the giant kelp Macrocystis pyrifera. Mar. Biol. 69 (1), 51–54. doi: 10.1007/BF00396960
Gerard V. A. (1984). The light environment in a giant kelp forest: Influence of Macrocystis pyrifera on spatial and temporal variability. Mar. Biol. 84 (2), 189–195. doi: 10.1007/BF00393004
Gerard V. A. (1997). The role of nitrogen nutrition in high-temperuatre tolerance of the kelp laminaria saccharina (Chromophyta). J. Phycology 33 (5), 800–810. doi: 10.1111/j.0022-3646.1997.00800.x
Harrison P. J., Hurd C. L. (2001). Nutrient physiology of seaweeds: Application of concepts to aquaculture. Cahiers biologie Mar. 42 (1-2), 71–82.
Helfrich K. R., Melville W. K. (2006). Long nonlinear internal waves. Annu. Rev. Fluid Mech. 38, 395–425. doi: 10.1146/annurev.fluid.38.050304.092129
Hepburn C. D., Pritchard D. W., Cornwall C. E., McLeod R. J., Beardall J., Raven J. A., et al. (2011). Diversity of carbon use strategies in a kelp forest community: Implications for a high CO2 ocean. Global Change Biol. 17 (7), 2488–2497. doi: 10.1111/j.1365-2486.2011.02411.x
Holloway P. E. (1987). Internal hydraulic jumps and solitons at a shelf break region on the Australian north West shelf. J. Geophysical Research: Oceans 92 (C5), 5405–5416. doi: 10.1029/JC092iC05p05405
Hurd C. L., Durante K. M., Chia F. S., Harrison P. J. (1994). Effect of bryozoan colonization on inorganic nitrogen acquisition by the kelps agarum fimbriatum and macrocystis integrifolia. Mar. Biol. 121 (1), 167–173. doi: 10.1007/BF00349486
Jackson G. A. (1977). Nutrients and production of giant kelp, Macrocystis pyrifera, off southern California. Limnology Oceanography 22 (6), 979–995. doi: 10.4319/lo.1977.22.6.0979
Jackson G. A. (1983). The physical and chemical environment of a kelp community. the effects of waste disposal on kelp communities. South. California Coast. Water Res. Project Long Beach, 11–37.
Jackson G. A., Winant C. D. (1983). Effect of a kelp forest on coastal currents. Continental Shelf Res. 2 (1), 75–80. doi: 10.1016/0278-4343(83)90023-7
Kamykowski D., Zentara S. J. (1986). Predicting plant nutrient concentrations from temperature and sigma-t in the upper kilometer of the world ocean. Deep Sea Res. Part A. Oceanographic Res. Papers 33 (1), 89–105. doi: 10.1016/0198-0149(86)90109-3
Kinlan B. P., Graham M. H., Sala E., Dayton P. K. (2003). Arrested development of giant kelp (Macrocystis pyrifera, phaeophyceae) embryonic sporophytes: A mechanism for delayed recruitment in perennial kelps? J. Phycology 39 (1), 47–57. doi: 10.1046/j.1529-8817.2003.02087.x
Konotchick T., Parnell P. E., Dayton P. K., Leichter J. J. (2012). Vertical distribution of Macrocystis pyrifera nutrient exposure in southern California. Estuarine Coast. Shelf Sci. 106, 85–92. doi: 10.1016/j.ecss.2012.04.026
Ladah L. B. (2003). The shoaling of nutrient-enriched subsurface waters as a mechanism to sustain primary productivity off central Baja California during El niño winters. J. Mar. Syst. 42 (3-4), 145–152. doi: 10.1016/S0924-7963(03)00072-1
Ladah L. B., Filonov A., Lavín M. F., Leichter J. J., Zertuche-Gonzalez J. A., Perez-Mayorga D. M. (2012). Cross-shelf transport of sub-thermocline nitrate by the internal tide and rapid (3–6 h) incorporation by an inshore macroalga. Continental Shelf Res. 42, 10–19. doi: 10.1016/j.csr.2012.03.010
Ladah L., Zertuche- González J. (2004). Giant kelp (Macrocystis pyrifera) survival in deep water (25-40m) during El niño of 1997-1998 in Baja California, Mexico. Botanica Marina 47, 367–372. doi: 10.1515/BOT.2004.054
Ladah L. B., Zertuche-González J. A. (2022). Local adaptation of juvenile giant kelp, Macrocystis pyrifera, from their southern limit in the northern hemisphere explored using reciprocal transplantation. Eur. J. Phycology, 1–10. doi: 10.1080/09670262.2021.2007543
Lamb K. G. (1997). Particle transport by nonbreaking, solitary internal waves. J. Geophysical Research: Oceans 102 (C8), 18641–18660. doi: 10.1029/97JC00441
Leichter J. J., Stewart H. L., Miller S. L. (2003). Episodic nutrient transport to Florida coral reefs. Limnology Oceanography 48 (4), 1394–1407. doi: 10.4319/lo.2003.48.4.1394
Leichter J. J., Wing S. R., Miller S. L., Denny M. W. (1996). Pulsed delivery of subthermocline water to conch reef (Florida keys) by internal tidal bores. Limnology Oceanography 41 (7), 1490–1501. doi: 10.4319/lo.1996.41.7.1490
Lobban C. S., Harrison P. J. (1994). Seaweed ecology and physiology (Cambridge UK: Cambridge University Press).
Lucas A. J., Franks P. J., Dupont C. L. (2011). Horizontal internal-tide fluxes support elevated phytoplankton productivity over the inner continental shelf. Limnology Oceanography: Fluids Environments 1 (1), 56–74. doi: 10.1215/21573698-1258185
Manley S. L. (1983). Composition of sieve tube sap from Macrocystis pyrifera (Phaeophyta) with emphasis on the inorganic constituents 1. J. Phycology 19 (1), 118–121. doi: 10.1111/j.0022-3646.1983.00118.x
MBC Aquatic Sciences (2020). Status of the kelp beds in 2019: Orange and San Diego counties (Costa Mesa, CA, USA: MBC Aquatic Sciences).
McPhee-Shaw E. E., Siegel D. A., Washburn L., Brzezinski M. A., Jones J. L., Leydecker A., et al. (2007). Mechanisms for nutrient delivery to the inner shelf: Observations from the Santa Barbara channel. Limnology Oceanography 52 (5), 1748–1766. doi: 10.4319/lo.2007.52.5.1748
McPherson M. L., Finger D. J., Houskeeper H. F., Bell T. W., Carr M. H., Rogers-Bennett L., et al. (2021). Large-Scale shift in the structure of a kelp forest ecosystem co-occurs with an epizootic and marine heatwave. Commun. Biol. 4 (1), 298. doi: 10.1038/s42003-021-01827-6
Mooers C. N., Robinson A. R. (1984). Turbulent jets and eddies in the California current and inferred cross-shore transports. Science 223 (4631), 51–53. doi: 10.1126/science.223.4631.51
Neori A., Chopin T., Troell M., Buschmann A. H., Kraemer G. P., Halling C., et al. (2004). Integrated aquaculture: Rationale, evolution and state of the art emphasizing seaweed biofiltration in modern mariculture. Aquaculture 231 (1-4), 361–391. doi: 10.1016/j.aquaculture.2003.11.015
Parnell P. E. (2015). The effects of seascape pattern on algal patch structure, sea urchin barrens, and ecological processes. J. Exp. Mar. Biol. Ecol. 465, 64–76. doi: 10.1016/j.jembe.2015.01.010
Parnell P. E., Dayton P. K., Lennert-Cody C. E., Rasmussen L. L., Leichter J. J. (2006). Marine reserve design: Optimal size, habitats, species affinities, diversity, and ocean microclimate. Ecol. Appl. 16 (3), 945–962. doi: 10.1890/1051-0761(2006)016[0945:MRDOSH]2.0.CO;2
Parnell P. E., Miller E. F., Cody C. E. L., Dayton P. K., Carter M. L., Stebbinsd T. D. (2010). The response of giant kelp (Macrocystis pyrifera) in southern California to low-frequency climate forcing. Limnology Oceanography 55 (6), 2686–2702. doi: 10.4319/lo.2010.55.6.2686
Pedersen M. F. (1994). Transient ammonium uptake in the macroalga ulva lactuca (chlorophyta): Nature, regulation, and the consequences for choice of measuring technique 1. J. Phycology 30 (6), 980–986. doi: 10.1111/j.0022-3646.1994.00980.x
Pedersen M. F., Borum J. (1996). Nutrient control of algal growth in estuarine waters. nutrient limitation and the importance of nitrogen requirements and nitrogen storage among phytoplankton and species of macroalgae. Mar. Ecol. Prog. Ser. 142, 261–272. doi: 10.3354/meps142261
Pérez-Mayorga D. M., Ladah L. B., Zertuche-González J. A., Leichter J. J., Filonov A. E., Lavín M. F. (2011). Nitrogen uptake and growth by the opportunistic macroalga ulva lactuca (Linnaeus) during the internal tide. J. Exp. Mar. Biol. Ecol. 406 (1-2), 108–115. doi: 10.1016/j.jembe.2011.05.028
Pineda J. (1991). Predictable upwelling and the shoreward transport of planktonic larvae by internal tidal bores. Science 253 (5019), 548–549. doi: 10.1126/science.253.5019.548
Ponte A. L., Cornuelle B. D. (2013). Coastal numerical modelling of tides: Sensitivity to domain size and remotely generated internal tide. Ocean Model. 62, 17–26. doi: 10.1016/j.ocemod.2012.11.007
Reed D. C., Foster M. S. (1984). The effects of canopy shadings on algal recruitment and growth in a giant kelp forest. Ecology 65 (3), 937–948. doi: 10.2307/1938066
Rosenberg G., Ramus J. (1984). Uptake of inorganic nitrogen and seaweed surface area: Volume ratios. Aquat. Bot. 19 (1-2), 65–72. doi: 10.1016/0304-3770(84)90008-1
Ryan J. P., Chavez F. P., Bellingham J. G. (2005). Physical-biological coupling in Monterey bay, California: Topographic influences on phytoplankton ecology. Mar. Ecol. Prog. Ser. 287, 23–32. doi: 10.3354/meps287023
Sánchez-Barredo M., Ladah L. B., Zertuche-González J. A. (2011). Nitrate uptake and duration of internal nitrogen reserves in the kelp eisenia arborea. Bot. Marina 54 (5), 441–446. doi: 10.1515/BOT.2011.058
Sandstrom H., Elliott J. A. (1984). Internal tide and solitons on the scotian shelf: A nutrient pump at work. J. Geophysical Research: Oceans 89 (C4), 6415–6426. doi: 10.1029/JC089iC04p06415
Schafstall J., Dengler M., Brandt P., Bange H. (2010). Tidal-induced mixing and diapycnal nutrient fluxes in the Mauritanian upwelling region. J. Geophysical Research: Oceans 115 (C10).
Schmitz K., Srivastava L. M. (1979). Long distance transport in macrocystis integrifolia: I. translocation of 14C-labeled assimilates. Plant Physiol. 63 (6), 995–1002.
Sharples J., Tweddle J. F., Mattias Green J. A., Palmer M. R., Kim Y. N., Hickman A. E., et al. (2007). Spring-neap modulation of internal tide mixing and vertical nitrate fluxes at a shelf edge in summer. Limnology Oceanography 52 (5), 1735–1747. doi: 10.4319/lo.2007.52.5.1735
Smith J. M., Brzezinski M. A., Melack J. M., Miller R. J., Reed D. C. (2018). Urea as a source of nitrogen to giant kelp (Macrocystis pyrifera). Limnology Oceanography Lett. 3 (4), 365–373. doi: 10.1002/lol2.10088
Snyder J. N., Bell T. W., Siegel D. A., Nidzieko N. J., Cavanaugh K. C. (2020). Sea Surface temperature imagery elucidates spatiotemporal nutrient patterns for offshore kelp aquaculture siting in the southern California bight. Front. Mar. Sci. 7, 22. doi: 10.3389/fmars.2020.00022
Steneck R. S., Graham M. H., Bourque B. J., Corbett D., Erlandson J. M., Estes J. A., et al. (2002). Kelp forest ecosystems: Biodiversity, stability, resilience and future. Environ. Conserv. 29 (4), 436–459. doi: 10.1017/S0376892902000322
Strickland J. D. (1970). The ecology of the plankton off la Jolla, California, in the period April through September 1967. (Berkeley, CA, USA: University of California Press)
Thomson R. E., Emery W. J. (2014). Data analysis methods in physical oceanography (Waltham, MA USA: Newnes).
Trauth M. H. (2015). MATLAB® recipes for earth sciences (Berlin/Heidelberg, Germany: Springer), 427.
Walter R. K., Phelan P. J. (2016). Internal bore seasonality and tidal pumping of subthermocline waters at the head of the Monterey submarine canyon. Continental Shelf Res. 116, 42–53. doi: 10.1016/j.csr.2016.01.015
Wheeler P. A., North W. J. (1980). Effects of nitrogen supply on nitrogen content and growth rate of juveniles Macrocystis pyrifera (Phaeophyta) sporophytes. J. Phycology 16 (4), 577–582. doi: 10.1111/j.1529-8817.1980.tb03076.x
Young M., Cavanaugh K., Bell T., Raimondi P., Edwards C. A., Drake P. T., et al. (2016). Environmental controls on spatial patterns in the long-term persistence of giant kelp in central California. Ecol. Monogr. 86 (1), 45–60. doi: 10.1890/15-0267.1
Zentara S. J., Kamykowski D. (1977). Latitudinal relationships among temperature and selected plant nutrients along the west coast of north and south America. J. Mar. Res. 35 (2), pp.321–pp.337.
Zertuche-Gonzalez J. A., Gil J. S., Sanchez-Barredo M., Altamirano_Gómez Z., Guzmán-Calderón J. M., Rangel-Mendoza L. K., et al. (2022). Eisenia arborea (Areschoung) domestication and mariculture development on the Pacific coast of Baja California, México. Front. Mar. Sci. 9, 932534. doi: 10.3389/fmars.2022.932534
Zimmerman R. C., Kremer J. N. (1984). Episodic nutrient supply to a kelp forest ecosystem in southern California. J. Mar. Res. 42 (3), 591–604. doi: 10.1357/002224084788506031
Keywords: kelp forests, temperature, nutrient dynamics, internal waves, kelp forest ecosystem, Macrocystis pyrifera
Citation: Leichter JJ, Ladah LB, Parnell PE, Stokes MD, Costa MT, Fumo J and Dayton PK (2023) Persistence of southern California giant kelp beds and alongshore variation in nutrient exposure driven by seasonal upwelling and internal waves. Front. Mar. Sci. 10:1007789. doi: 10.3389/fmars.2023.1007789
Received: 30 July 2022; Accepted: 14 February 2023;
Published: 23 March 2023.
Edited by:
Mouncef Sedrati, Université Bretagne Sud, FranceReviewed by:
Meredith L. McPherson, University of Massachusetts Boston, United StatesZhixuan Feng, East China Normal University, China
Copyright © 2023 Leichter, Ladah, Parnell, Stokes, Costa, Fumo and Dayton. This is an open-access article distributed under the terms of the Creative Commons Attribution License (CC BY). The use, distribution or reproduction in other forums is permitted, provided the original author(s) and the copyright owner(s) are credited and that the original publication in this journal is cited, in accordance with accepted academic practice. No use, distribution or reproduction is permitted which does not comply with these terms.
*Correspondence: James J. Leichter, amxlaWNodGVyQHVjc2QuZWR1