 Clàudia Pérez-Barrancos1,2*
 María D. Gelado-Caballero3
 Nauzet Hernández-Hernández1
 Isabel Baños1
 Markel Gómez-Letona1
 María F. Montero1
 Jesús M. Arrieta2
 Javier Arístegui1*
- 1Instituto de Oceanografía y Cambio Global (IOCAG), Universidad de Las Palmas de Gran Canaria, Las Palmas, Spain
- 2Centro Oceanográfico de Canarias, Instituto Español de Oceanografía (IEO), Consejo Superior de Investigaciones Científicas (CSIC), Santa Cruz de Tenerife, Spain
- 3Departamento de Química, Universidad de Las Palmas de Gran Canaria, Las Palmas, Spain
The eastern North Atlantic region receives large Saharan dust deposition inputs, providing nutrients and trace metals to the surface waters. We assessed the effects of intense dust deposition on phytoplankton and bacteria cell abundances, metabolic activity, and community structure, along a surface productivity gradient in the Mauritanian-Senegalese upwelling system. Dust concentrations above 4 mg L-1 were added to triplicate microcosms in four bioassay experiments, each lasting three days, increasing nitrate, phosphate and, to a lesser extent, silicate seawater concentrations. Even though dust deposition enhanced both heterotrophic and photosynthetic activity, bacterial production responded faster and stronger than primary production, especially as oligotrophic conditions increased. Bacterial production rates in oligotrophic waters almost tripled one day after the enrichment. However, such favorable response could not be observed on the total organic carbon production until a lag phase of 2 days and whilst under moderate eutrophic conditions. Dust enrichment benefited the presence of certain planktonic groups over others according to their nutrient requirements. Indicator species analysis revealed that our dust-treated microcosms were consistently characterized by Raphid-pennate diatoms, as well as by Hyphomonas genus of Alphaproteobacteria and several species of Alteromonas Gammaproteobacteria. Yet, changes in microbial community structure and composition were primarily shaped by the starting conditions of each experiment. These findings indicate that increasing dust deposition events and the weakening of the Mauritanian-Senegalese upwelling system under climate change may result in a more heterotrophic system, particularly in oligotrophic waters, reducing its potential to function as an atmospheric carbon sink.
Introduction
Every year about 450 teragrams of atmospheric dust are deposited on the world’s oceans, of which 43% reaches the Atlantic Ocean (Jickells et al., 2005). Almost half of the global dust production arrives from North Africa, where the arid regions of the Sahara and the Sahel make up the largest sources of mineral dust (Prospero and Lamb, 2003). Although dust deposition provides the surface ocean with new inorganic nutrients, trace metals and organic carbon (Guieu et al., 2002; Pulido-Villena et al., 2008; Jickells et al., 2016), the bioavailability of these and the extent of their fertilizing effect on microbial communities remains uncertain (e.g., Chien et al., 2016).
Past studies on the role of dust inputs on ocean biogeochemistry have focused on the impact on autotrophic productivity, given their potential to enhance the efficiency of the biological pump and hence ocean carbon sequestration. Some bioassay studies have shown that phytoplankton biomass, primary production and N2 fixation may increase after dust additions (Bonnet et al., 2005; Herut et al., 2005; Duarte et al., 2006; Ridame et al., 2011; Herut et al., 2016; Rahav et al., 2018). However, further studies combining field and experimental approaches also denoted a significant increase in bacterial abundance and metabolic rates following dust additions (2014; Herut et al., 2005; Pulido-Villena et al., 2008; Lekunberri et al., 2010; Marañón et al., 2010; Guieu et al., 2014; Herut et al., 2016; Rahav et al., 2018; Gazeau et al., 2021). Indeed, under suitable conditions bacteria can outcompete phytoplankton for inorganic nutrients (Joint et al., 2002; Mills et al., 2008; Hale et al., 2017). Yet, the potential uptake of inorganic nutrients and organic carbon by heterotrophic bacteria during dust bioassays may be masked under the impact of grazing exerted by predators such as heterotrophic flagellates, ciliates and dinoflagellates (Pitta et al., 2017) and, to a lesser extent, by viral lysis (Tsiola et al., 2017).
Although the northeast Atlantic Ocean is among the highest receivers of Saharan dust fluxes in the world, few bioassay studies on dust fertilization have been conducted in the region (Blain et al., 2004; Duarte et al., 2006; Hill et al., 2010; Marañón et al., 2010; Langlois et al., 2012). Most of these studies focused on the response of microbial community abundance and metabolic activity without considering the shifts in community structure. Only Marañón et al. (2010) addressed the concurrent effects of dust inputs on phytoplankton and bacteria using conventional molecular techniques along a latitudinal transect in the central Atlantic Ocean.
In our study, we assessed the effects of intense dust deposition on surface-ocean microbial communities (phytoplankton and bacteria) in the Mauritanian-Senegalese area, characterized by recurrent dust intrusions (Jickells et al., 2005) and high particle export rates (Nowald et al., 2015). Four dust bioassays were conducted at four stations along a zonal trophic gradient stretching from the eutrophic coastal upwelling region to the oligotrophic open ocean. The differential effects of dust-derived nutrients on phytoplankton and bacteria were assessed in terms of cell abundances, autotrophic and heterotrophic production, and community structure.
Materials and methods
Aerosol collection
Total suspended particles were sampled at Pico de la Gorra (1930 m above sea level; 27° 56’N, 15° 33’W), as part of a long-term aerosol monitoring program in the Canary Islands (Torres-Padrón et al., 2002; Gelado-Caballero et al., 2012; López-García et al., 2013). High-volume aerosol collectors (60 m3 h-1, 24 h; MCV, model CAV-A/M) were used to collect dry material for (1) chemical composition analyses on acid-washed cellulose filters (Whatman 41) and (2) measuring gravimetrically total suspended particles concentrations on glass-fiber filters (Whatman GF/A). Several Whatman GF/A filters were also collected on board the FLUXES I cruise (CAV-A/mb model; MCV). Trace-metal clean techniques were strictly followed throughout the aerosol collection and manipulation (Supplementary Methods).
Microcosm setup
Four dust addition experiments were performed at four stations during the FLUXES I cruise on board the R/V Sarmiento de Gamboa (Table 1, Figure 1). The sampling locations were distributed along the coastal transition zone from the open-ocean Atlantic waters to the upwelling off Mauritania. Surface seawater samples (10-20 m depth) were collected using acid-cleaned Niskin bottles with external closure mounted on a SBE 38 rosette sampler equipped with a Sea-Bird 911+ CTD system. At each station, the surface seawater samples were homogenized, prefiltered through a 250 µm mesh size and transferred to 15L acid-cleaned microcosms (made of polyvinylchloride) before the start of the experiment (Table 1). Prior to dust addition, seawater was sampled for all measured parameters (0 h of sampling time) using an acid-washed silicone tube. Each experiment comprised three replicate control microcosms (C1, C2 and C3) and three replicate dust-treated microcosms (D1, D2, D3) placed in an on-deck incubator. The dust treatment consisted in a single addition of a dust stock solution (Supplementary Methods) that resulted in concentrations between 4.2 and 6.7 mg dust L-1 (Table 2). The amendment provided an average of 0.16, 0.02, and 0.01 µmol of nitrate, phosphate and silicate per mg of dust, as estimated from fluxes already reported through the Canary Region (López-García et al., 2021). These conditions simulate a cumulative event of intense dust deposition (~5500 µg TSP m-3, Gelado-Caballero et al., 2012) over 20 days in the upper 30 m mixed layer in the northeast Atlantic Ocean. Likewise, a control stock solution (without dust) was poured into the control microcosms.
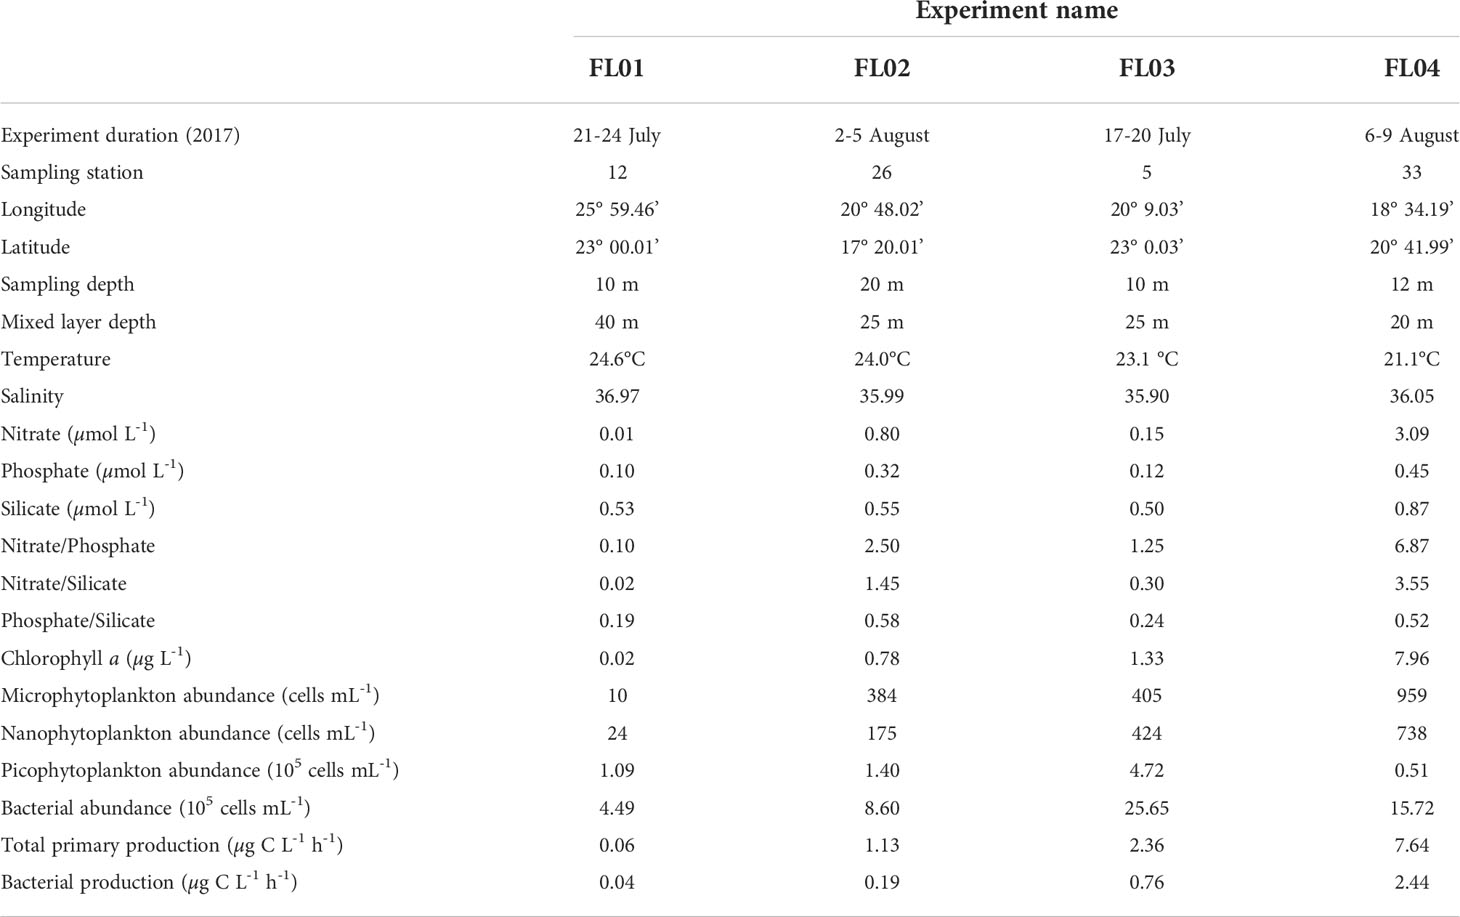
Table 1 Station properties and initial characteristics of the surface waters used to conduct each experiment.
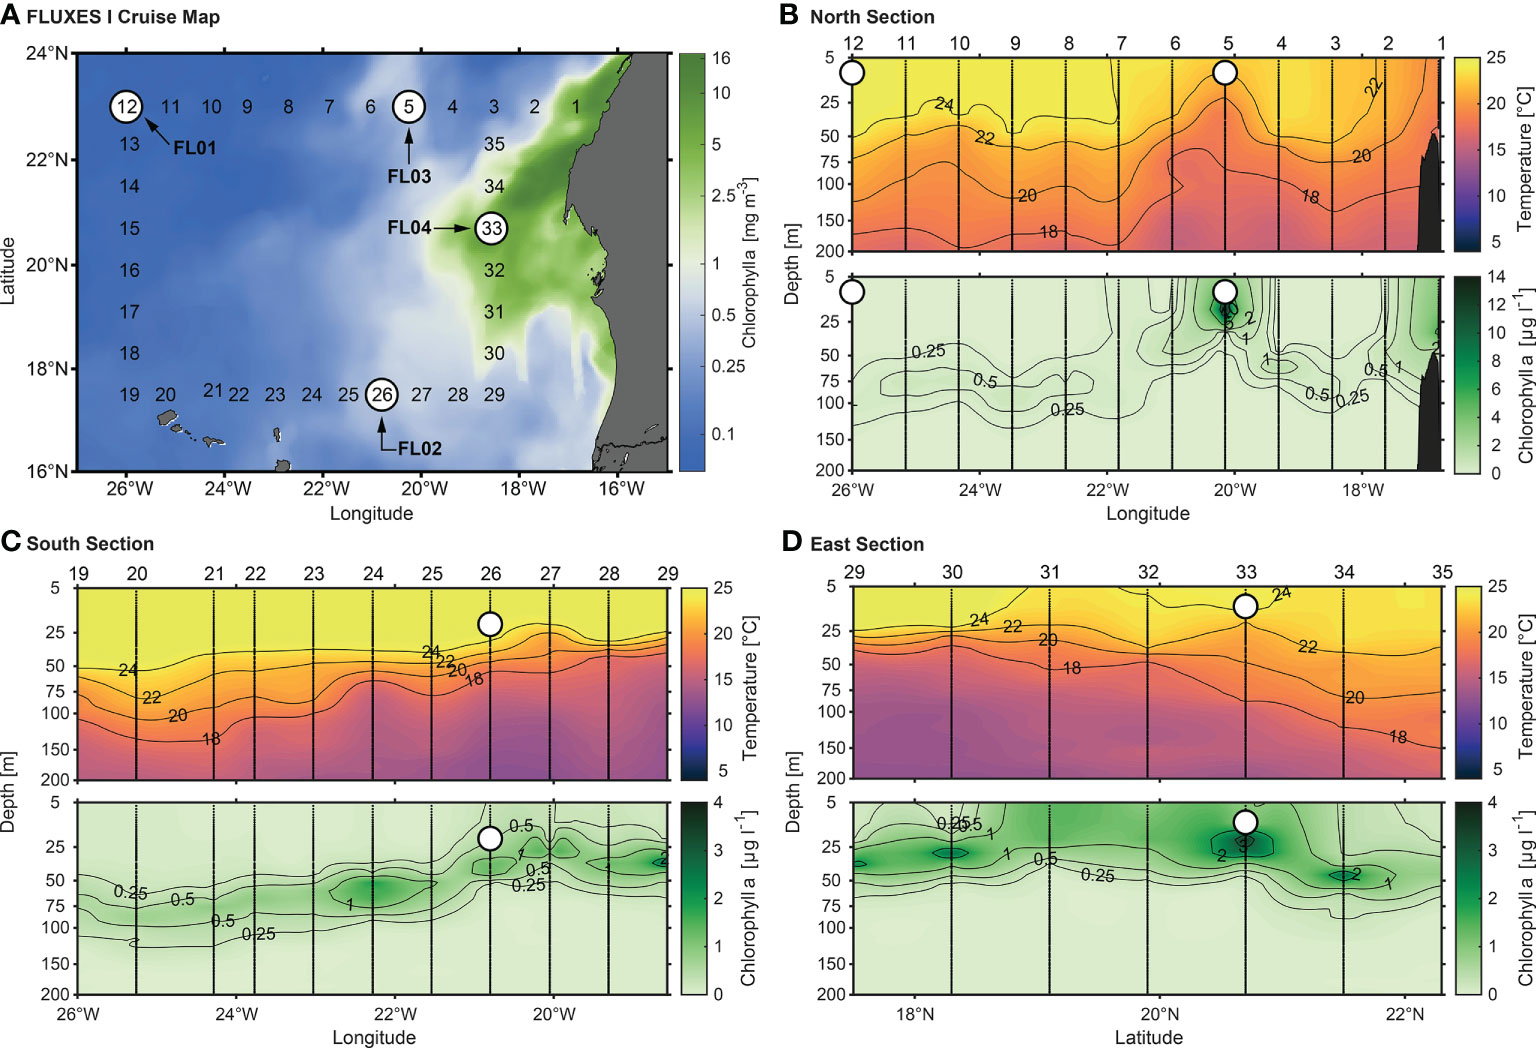
Figure 1 (A) Eight-day mean Chl a concentration (mg m-3) during FLUXES I cruise. Data provided by The Copernicus Marine Environment Monitoring Service (http://marine.copernicus.eu/). White points show the sampled stations to conduct each experiment. (B) Vertical sections (0-200 m) of temperature (°C) and Chl a (µg L-1) for the northern, (C) southern and (D) eastern cruise transects. Stations are indicated at the top of the upper panels. White points show the depths sampled to perform each numbered experiment (see Table 1).
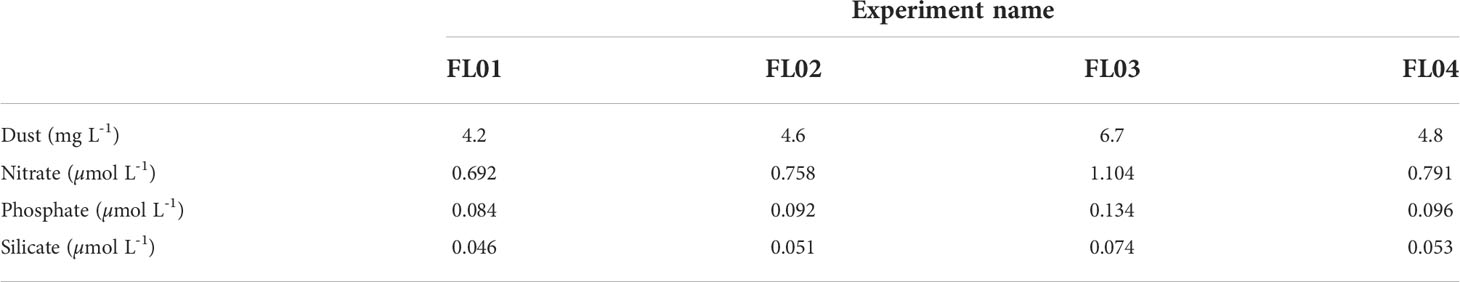
Table 2 Dust microcosm concentration (mg dust L-1) and released soluble inorganic nutrient concentrations (µmol L-1) in each experiment.
During the experiments, each lasting three days, the microcosms were attached to a weight, covered with a three-layer neutral-density mesh lid (~48.6%) and subjected to a continuous flow of surface seawater (25 ± 1.5 °C) to reproduce natural conditions. Most parameters were sampled 24 and 72 h after the addition of dust, although depending on the parameter an additional sampling after 48 h was performed.
Nutrient analysis
Samples (15 mL) were collected in polypropylene tubes and frozen upright at -20°C until analyzed. Concentrations were determined using a 4-channel Skalar San++ continuous flow autoanalyzer for nitrate and nitrite (NOx) (Cd reduction method), phosphate () and silicate (Si (OH)4) (molybdate blue method). The instrumental limit of quantification was 0.001 µM.
Chlorophyll a
Samples (500 mL) were filtered on board through 25 mm diameter, 0.7 µm pore size Whatman GF/F glass-fiber filters. Pigments were extracted overnight in cold acetone (90% v/v) at -20°C in the dark. Chlorophyll a (Chl a) concentration was estimated fluorometrically by means of a Turner Designs bench fluorometer (Holm-Hansen et al., 1965).
Microbial abundance
Samples (125 mL) were fixed and preserved in acidic Lugol solution to 1% final concentration and settled in sedimentation chambers for 24-48 hours. Large phytoplankton (>20 µm) was identified and enumerated by inverted microscopy (Utermöhl, 1958) at 20x magnification.
Heterotrophic bacteria, nano- and picoeukaryotes, and Prochlorococcus sp. and Synechococcus sp. type of cyanobacteria, were enumerated using a FACScalibur (Becton and Dickinson) flow cytometer. Samples for microbial abundance (2 mL) were fixed with paraformaldehyde to a final concentration of 2%, refrigerated 30 minutes at 4°C, frozen in liquid nitrogen (-190°C) and stored at -80°C until analysis. Subsamples (400 µL) were stained with 4 µL of SYBR Green I, Molecular Probes Inc. (final concentration 1000x dilution of the commercial product) for bacteria analysis. High nucleic-acid content (HNA) bacteria and low nucleic-acid content (LNA) bacteria were identified in bivariate scatter plots of side scatter versus green fluorescence. Cyanobacteria and eukaryotes were discriminated in plots of orange fluorescence versus red fluorescence.
Microbial community structure
Samples for amplicon sequencing were collected from each microcosm at time zero and at the end of the experiments. Approximately 2 L of seawater were filtered through a 0.22 µm pore-size Sterivex filter (Millipore), immediately frozen into liquid nitrogen and stored at -80°C.
DNA extracts were obtained using the standard phenol-chloroform method (Sambrook and Russell, 2001). The V4 region of the prokaryotic 16S rDNA genes (~390 bp) was amplified by PCR using the 515F (5’-GTGYCAGCMGCCGCGGTAA-3’) and 806R (5’- GGACTACNVGGGTWTCTAAT-3’) primer pair sequences (Apprill et al., 2015; Parada et al., 2016). The same DNA extracts were used to amplify the V9 region of the eukaryotic 18S rDNA genes (~260± 50 bp) using primers 1391F (5’-GTACACACCGCCCGTC-3’) and 1510R (5’-TGATCCTTCTGCAGGTTCACCTAC-3’) (Amaral-Zettler et al., 2009; Stoeck et al., 2010). Sample processing, library preparation, and sequencing were performed by the Earth Microbiome Project (Thompson et al., 2017; https://earthmicrobiome.org/) at Argonne National Laboratory (Lemont, IL, USA; https://www.anl.gov/).
In both V4 and V9 amplicon datasets, raw reads were filtered and trimmed to remove amplification primers with Cutadapt v1.18 (Martin, 2011) and processed using the software package DADA2 v1.24 (Callahan et al., 2016) with the parameters truncQ 2, truncLen 140,130 and maxEE 4,5. Sequences from all samples were pooled together for sample inference and bimera identification. For each dataset, an amplicon sequence variant (ASV) table was generated. After the taxonomic assignation of prokaryotes according to Silva SSU version 138.1, sequences classified as eukaryote, mitochondria and chloroplast were removed from the V4 dataset. Eukaryotic taxonomy was then assigned using the PR2 database (Guillou et al., 2013), from which bacterial and archaeal sequences were removed. In this occasion, those sequences belonging to the Opisthokonta supergroup of eukaryotes were also excluded from the V9 dataset since were considered non-relevant for the purpose of our study. To avoid library size differences, each amplicon dataset was rarefied using the function rarefy_even_depth (phyloseq package v1.40; McMurdie and Holmes, 2013). Species richness (Chao 1 index) and diversity (Shannon index) were estimated using phyloseq.
14C-Based primary production
Primary production (PP) was determined by the 14C method. Three culture flasks per microcosm (50 mL) were inoculated with 5 μCi of 14C-labeled NaH14CO3 solution. Labelled samples were incubated for 24 hours in the same deck incubator as the microcosms, remaining one of the three under complete darkness to measure the dark carbon uptake. At the end of the incubations, 5 mL of the water sample were filtered through 0.2 µm pore size polycarbonate filters under low vacuum pressure. To measure the particulate organic carbon production (PPPOC), filters were placed in 6 mL scintillation vials, after exposure to concentrated HCl fumes overnight to remove inorganic carbon. A volume of 5 mL of the filtrate was transferred to a 20 mL scintillation vial to determine the amount of fixed 14C released into the dissolved organic carbon fraction (PPDOC). Liquid samples were acidified with 100 µL of HCl 6 N and placed in an orbital oscillator for 24 hours. Finally, scintillation cocktail was added to every sample to quantify the remaining radioactivity using a Liquid Scintillation Counter. The total primary production (PPTOC) was determined from the sum of the two size fractions considering the isotopic dilution of the tracer.
Bacterial production
Bacterial production (BP) was estimated from rates of protein synthesis determined by the incorporation of tritiated leucine [3H] using the centrifugation method (Smith and Azam, 1992). For each microcosm, four replicated seawater samples (1 mL) were inoculated with 20 nM warm leucine of final concentration. Two trichloroacetic acid (TCA)-killed controls were established by adding 100 µL of 50% TCA. Samples, including controls, were incubated in the dark for 4-7 h at the same deck incubator as the microcosms and terminated by adding 100 µL of 50% TCA. Centrifugation was carried out at 12000 rpm for 20 minutes, followed by aspiration of the supernatant. Then, 1 mL of 5% TCA was added to each sample and centrifuged again. Once removed the supernatant, 1 mL of scintillation cocktail was placed in each sample. Leucine incorporation rates were then estimated from the mean disintegrations per minute (DPM) of the samples after subtracting the DPM of the TCA-killed controls from the corresponding samples. BP was calculated by leucine incorporation rates (Kirchman and Ducklow, 1993), assuming no isotopic dilution and using a carbon conversion factor of 1.5 kg C mol leucine-1 (Simon and Azam, 1989).
Statistical analyses
Analyses were conducted in R v4.2.1 (R Core Team, 2021) and mostly performed using tidyverse v1.3.2 (Wickham et al., 2019).
Shapiro-Wilk test of normality and Levene’s test for homogeneity of variance were checked across all variables by groups of treatment and/or experiments (rstatix package v.0.7; Kassambara, 2021). Single tailed, non-parametric Mann-Whitney-Wilcoxon tests were computed by applying alternative = “less” to test whether the treatment effect was greater on dust than control microcosms at each sampling time. Pairwise comparisons between all dust-treated microcosms were assessed with Kruskal-Wallis test and Conover-Iman post-hoc analyses (conover.test package v.1.1.5; Dinno, 2017). Two-way ANOVA tests were performed on microbial richness and diversity estimates to assess the interaction between treatment and experiment variables at the end of the incubations (rstatix package v.0.7; Kassambara, 2021). One-way ANOVA and Tukey post-hoc analyses were computed to determine the differences between experiments, being displayed with ggpubr v.0.4 (Kassambara, 2020).
A non-metric multidimensional scaling (NMDS) was performed from Bray-Curtis dissimilarities (phyloseq package v1.40; McMurdie and Holmes, 2013). PERMANOVA tests were then computed on treatment and experiment variables at the end of the incubations, as well as its interaction (vegan package v2.6.2; Oksanen et al., 2019). To assess the uncertainty in hierarchical cluster analyses, a multiscale bootstrap resampling was performed on the Bray-Curtis dissimilarity data matrix (pvclust package v.2.2; Suzuki et al., 2019) and displayed as a dendrogram with ggtree v.3.4.2 (Yu, 2020). Finally, an indicator species analysis was computed to determine which species characterized certain treatments (indicspecies package v.1.7.12; De Cáceres and Legendre, 2009).
Results
Initial characteristics of surface waters
Table 1 and Figure 1 illustrate the variable biogeochemical conditions of the surface waters collected to carry out the experiments. The surface water used to fill the FL01 microcosms was characterized by being typically oligotrophic (Chl a < 0.5 μg L-1, NOx < 0.2 µM), whereas the remaining experiments displayed a range of increasing eutrophic properties (FL02, FL03 and FL04, lowest to highest), as indicated by Chl a and productivity rates.
Temperature, salinity, oxygen and Chl a concentration at the sampling site from 0 to 200 m (Figure 1) showed that the northern section (23°N) was influenced by a coastal meandering westward Cape Blanc (station 5) separating the nutrient-rich upwelled water from the warmer, stratified offshore water. While the Cape Blanc coastal upwelling was the principal supplier of nitrate in the FL03 experiment (station 5), total inorganic nitrogen was almost depleted in FL01 (station 12). Thus, the offshore PP and BP might be limited by nitrate concentration among other variables (Table 1). Similar initial phosphate and silicate concentrations were found in both stations. Surface Chl a concentration (~10 m) presented an abrupt drop from values above 1-2 μg L-1 near the coast to 0.02 μg L-1 in the open-ocean following the decrease in phytoplankton abundances with increasing oligotrophy (from 4.72 × 10⁵ cells mL-1 to 1 × 10⁵ cells mL-1). Picophytoplankton (<2 μm) always showed the highest abundances, although micro (>20 μm) and nano (2-20 μm) phytoplankton size fractions were also abundant in the most productive waters. Among the photosynthetic picophytoplankton (Supplementary Figure 1), Synechococcus was always numerically dominant, except in the oligotrophic experiment in which Prochlorococcus were the most abundant cyanobacteria. Diatoms were the dominant microphytoplankton group in coastal waters, while dinoflagellates dominated the FL01 experiment (Supplementary Figure 2). Bacterial abundance was one order of magnitude lower at FL01 compared with the coastal stations.
The southern transect (17°N), where the FL02 experiment was performed (station 26), also presented some variability throughout the large offshore extension (Figure 1). Waters with high Chl a deepened at stations 26-27 until station 19, as colder waters persisted along the water column. Inorganic nutrients were higher than those observed in the northern section, with nitrate concentrations of about 0.80 µM (Table 1). The community structure remained similar to that in FL03, although with lower values of microbial abundance and production.
The last experiment FL04 (station 33) was conducted in the eastern section (18°W), where the greatest influence by upwelled waters occurred (Figure 1). The highest inorganic nutrient concentrations were found on this eutrophic area, along with the greatest Chl a concentration (above 7 µg L-1) and metabolic activity rates (PPTOC, 7.64 µg C L-1 h-1; BP, 2.44 µg C L-1 h-1) (Table 1). Nanophytoplankton and diatom abundance were highest compared with the rest of stations (Table 1; Supplementary Figure 2).
Nutrient dynamics
Dust addition increased an average of +0.8 µM of nitrate and +0.1 µM of phosphate seawater concentrations in all incubations (Table 2; Supplementary Figure 3). FL01 and FL02 took 48 to 71 hours after dust addition to drive nitrate concentrations back to control levels (NOx < 0.05 µM). FL03 and FL04 exhibited a sharp decline following dust addition albeit similar between control and dust-treated microcosms. The same pattern was observed in phosphate concentrations since the decrease was consistent between treatments and experiments.
By contrast, the addition of silicate through dust was minor (+0.06 µM). FL04 silicate concentrations decreased over the experimental time, reaching lower concentrations than those of the control 71 hours after the addition (~0.6 µM). In the remaining experiments, dust-treated microcosms had on average silicate concentrations significantly higher than control values (about +0.3 µM of Si(OH)4 above the control) for the most part of the experiments (Supplementary Table 1).
Phytoplankton abundance and production
The abundance of microphytoplankton in the dust-treated microcosms significantly increased over 5-fold in FL01 (from 10 to 50 cells mL-1) and about 1.5-fold in FL04 (from 900 to 1,500 cells mL-1) 24 hours after dust addition (Figure 2A). However, no significant differences were observed in the remaining experiments until 71 hours of incubation. The enhancement in FL01 was associated with the increase of dinoflagellates, while in FL02, FL03 and FL04 with diatoms (Supplementary Figure 2). Dust addition also induced an increase on nanophytoplankton abundance throughout the incubation period, which was significantly larger in dust-treated microcosms of FL01 (+116 cells mL-1) and FL03 (+160 cells mL-1) when compared to control (Figure 2B). In addition to the micro- and nanophytoplankton size fractions, picophytoplankton response also differed among experiments and groups of organisms (Figure 2C; Supplementary Figure 1). Synechococcus and picoeukaryotes abundance increased through the dust-treated microcosms of FL01 (2,309 to 6,705 and 1,117 to 1,898 cells mL-1, respectively), while Prochlorococcus decreased regardless of the treatment (105,944 to 40,913 cells mL-1 in dust-treated microcosms, and to 40,054 cells mL-1 in controls). Synechococcus abundance was also significantly greater in FL02 towards 48 hours after dust addition (+44,983 cells mL-1, 1.4-fold versus the control). Lastly, significant variances in picoeukaryotes abundance were noticed in FL03 and FL04 towards the end of the experiments (about +1,262 and +38,070 cells mL-1, respectively, in dust-treated microcosms).
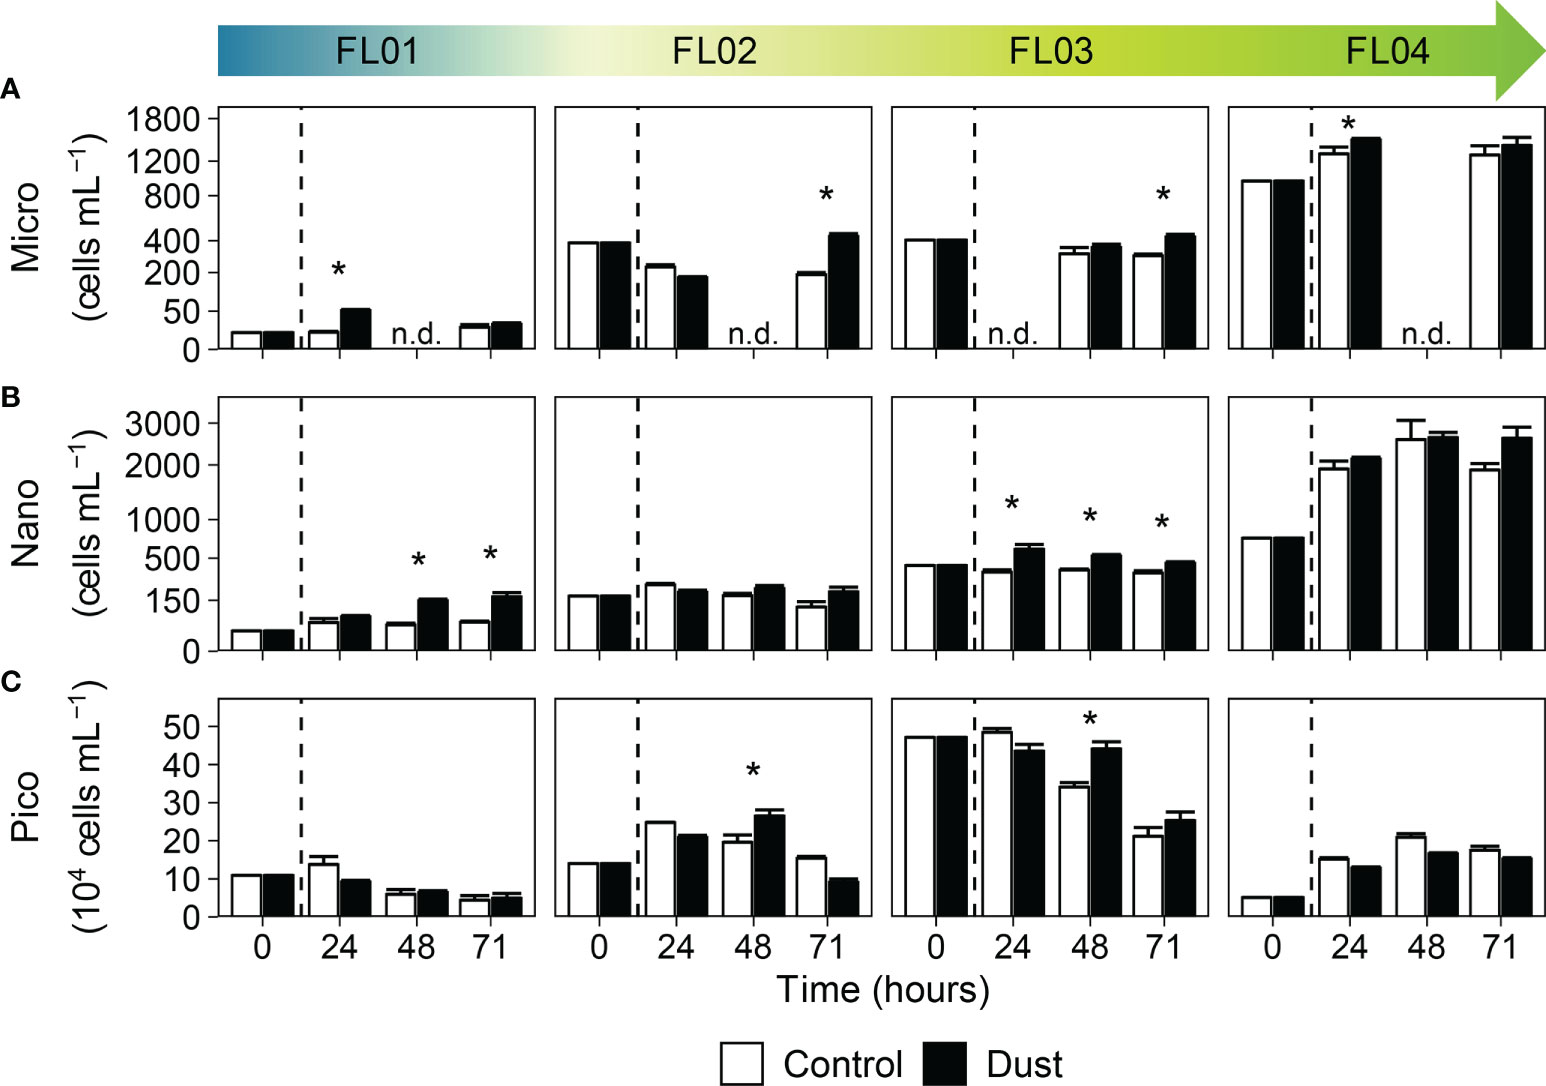
Figure 2 Phytoplankton abundance (cells mL-1) by size fraction: (A) microphytoplankton (> 20 µm), (B) nanophytoplankton (2–20 µm), and (C) picophytoplankton (< 2 µm), in the control (white bars) and dust-treated microcosms (black bars). The vertical line indicates the dust addition time. Each data point represents the average and standard deviation of three replicated microcosms. The asterisk denotes where the value of dust triplicates was significantly greater than control (p < 0.05, Wilcoxon test). The abbreviation n.d. (no-data) indicate the absence of data at that time of the experimental incubation. Note that different scales were used.
No early responses could be observed in Chl a concentration or PP during the first 24 hours in most incubations (Figure 3), yet both were significantly enhanced by dust 48 hours onwards. The FL03 experiment displayed the most significant responses precisely at that time, in which Chl a was 2.3-fold greater than control (1.49 versus 0.65 µg L-1) and PPTOC rates were 1.3-fold above (3.51 versus 2.73 µg C L-1 h-1). The overall hourly-integrated PPTOC rates over the entire duration of the incubations evidenced that phytoplankton tend to thrive in the presence of dust. Other than a modest change of 2% in FL02, dust induced an increase in the whole hourly-integrated total primary production rates of 23% to 28% with respect to the control. Lastly, pair-wise comparisons among all dust-treated microcosms confirmed the substantial variation in the response of phytoplankton to dust addition according to the initial hydrographic conditions (Supplementary Table 2). The differences in phytoplankton stocks, Chl a concentration and metabolic rates were statistically significant between the eutrophic experiments and when compared to the oligotrophic experiment.
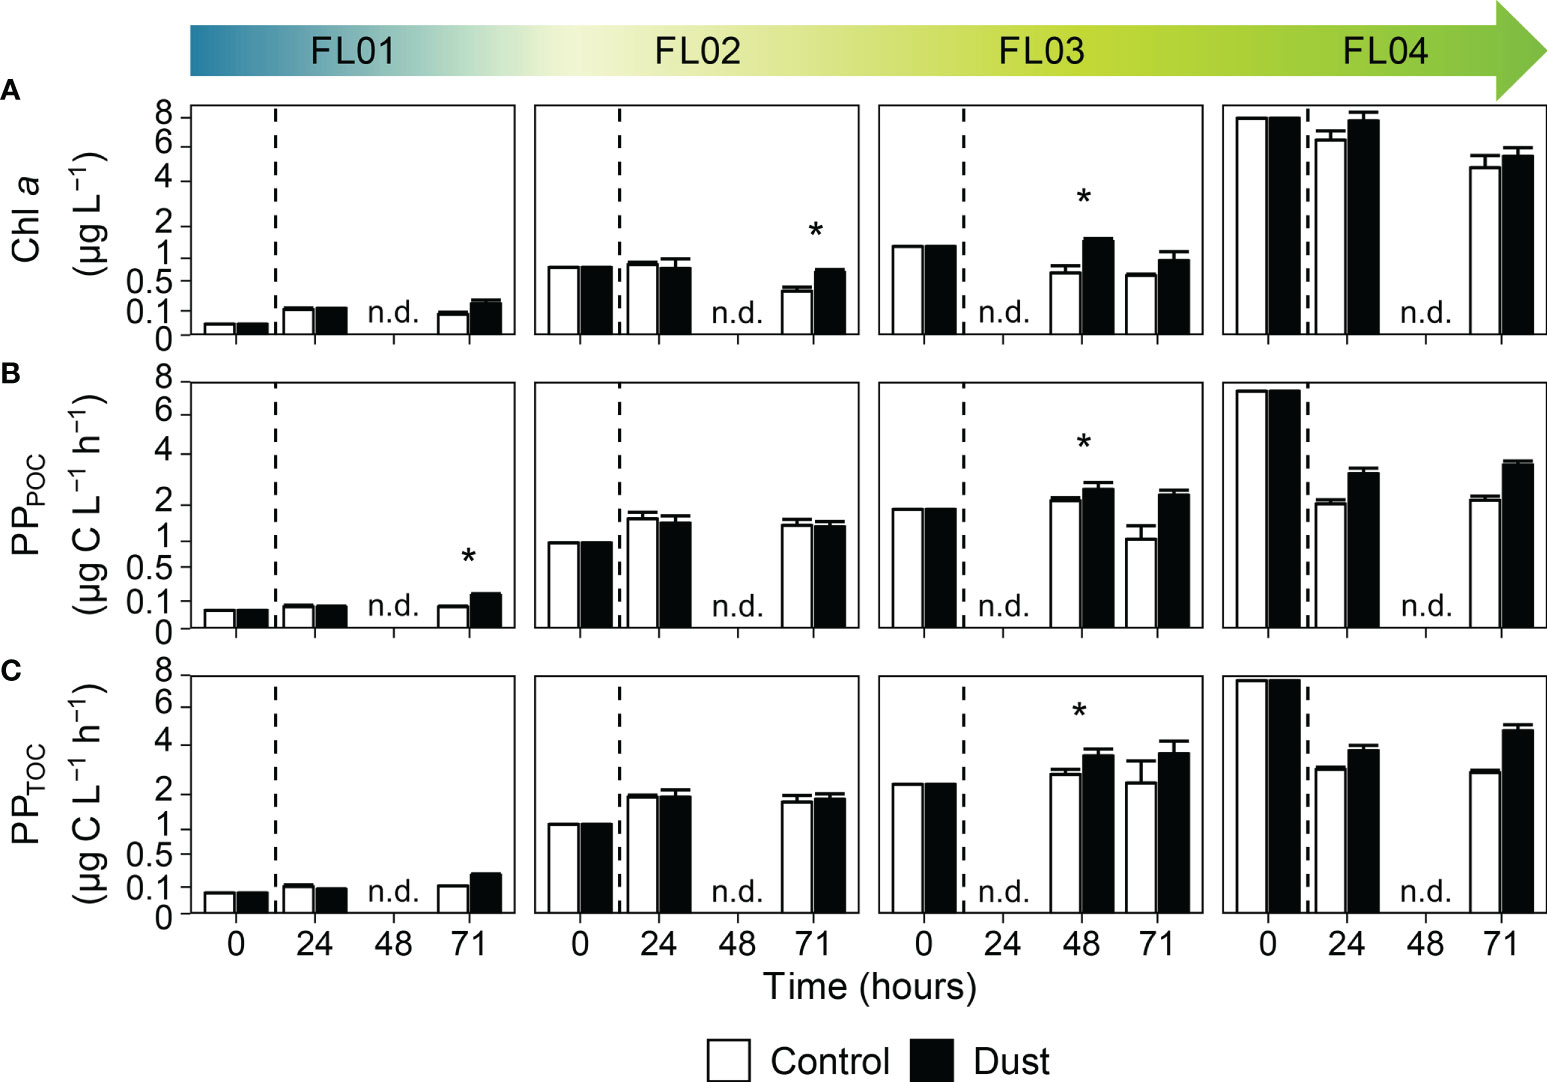
Figure 3 Time evolution of (A) Chl a concentration (µg L-1), (B) primary production (µg C L-1 h-1) in the total particulate fraction (PPPOC), and (C) total organic fraction (PPTOC), in the control (white bars) and dust-treated microcosms (black bars). The vertical line indicates the dust addition time. Each data point represents the average and standard deviation of three replicated microcosms. The asterisk denotes where the value of dust triplicates was significantly greater than control (p < 0.05, Wilcoxon test). The abbreviation n.d. (no-data) indicate the absence of data at that time of the experimental incubation. Note that different scales were used.
Bacterial abundance and production
The dynamics of total bacterial abundance (Figure 4A) and the proportion of HNA and LNA cells (Figure 4B) over the course of the experiments remained similar between control and dust-treated microcosms, supported by the general absence of statistical differences (Supplementary Table 1). Conversely, the metabolic rates of bacteria displayed major changes upon dust addition as the trophic gradient decreased (Figure 4C). BP in FL01 displayed a sharp increase 24 hours after the enrichment (from 0.045 to 2.39 µg C L-1 h-1), nearly tripling the rates observed in the control. At the same time, FL02 and FL04 were stimulated 14-fold (from 0.19 to 2.85 µg C L-1 h-1) and 1.4-fold (from 2.45 to 3.23 µg C L-1 h-1), respectively. However, no statistical differences were observed between treatments apart from the FL01 experiment. The overall metabolic rates at the end of the incubations were greater than the initial ones, suggesting a positive reaction not only in magnitude but also in duration. Indeed, hourly-integrated BP over the entire incubation period evidenced dust as one of the main factors fueling heterotrophic activity. Specifically, dust induced an enhancement of about 190% compared to control in FL01, yet between 14% and 31% in FL02 and FL03, respectively. Non-significant shifts were observed in integrated BP rates in FL04 (-3% relative to the control).
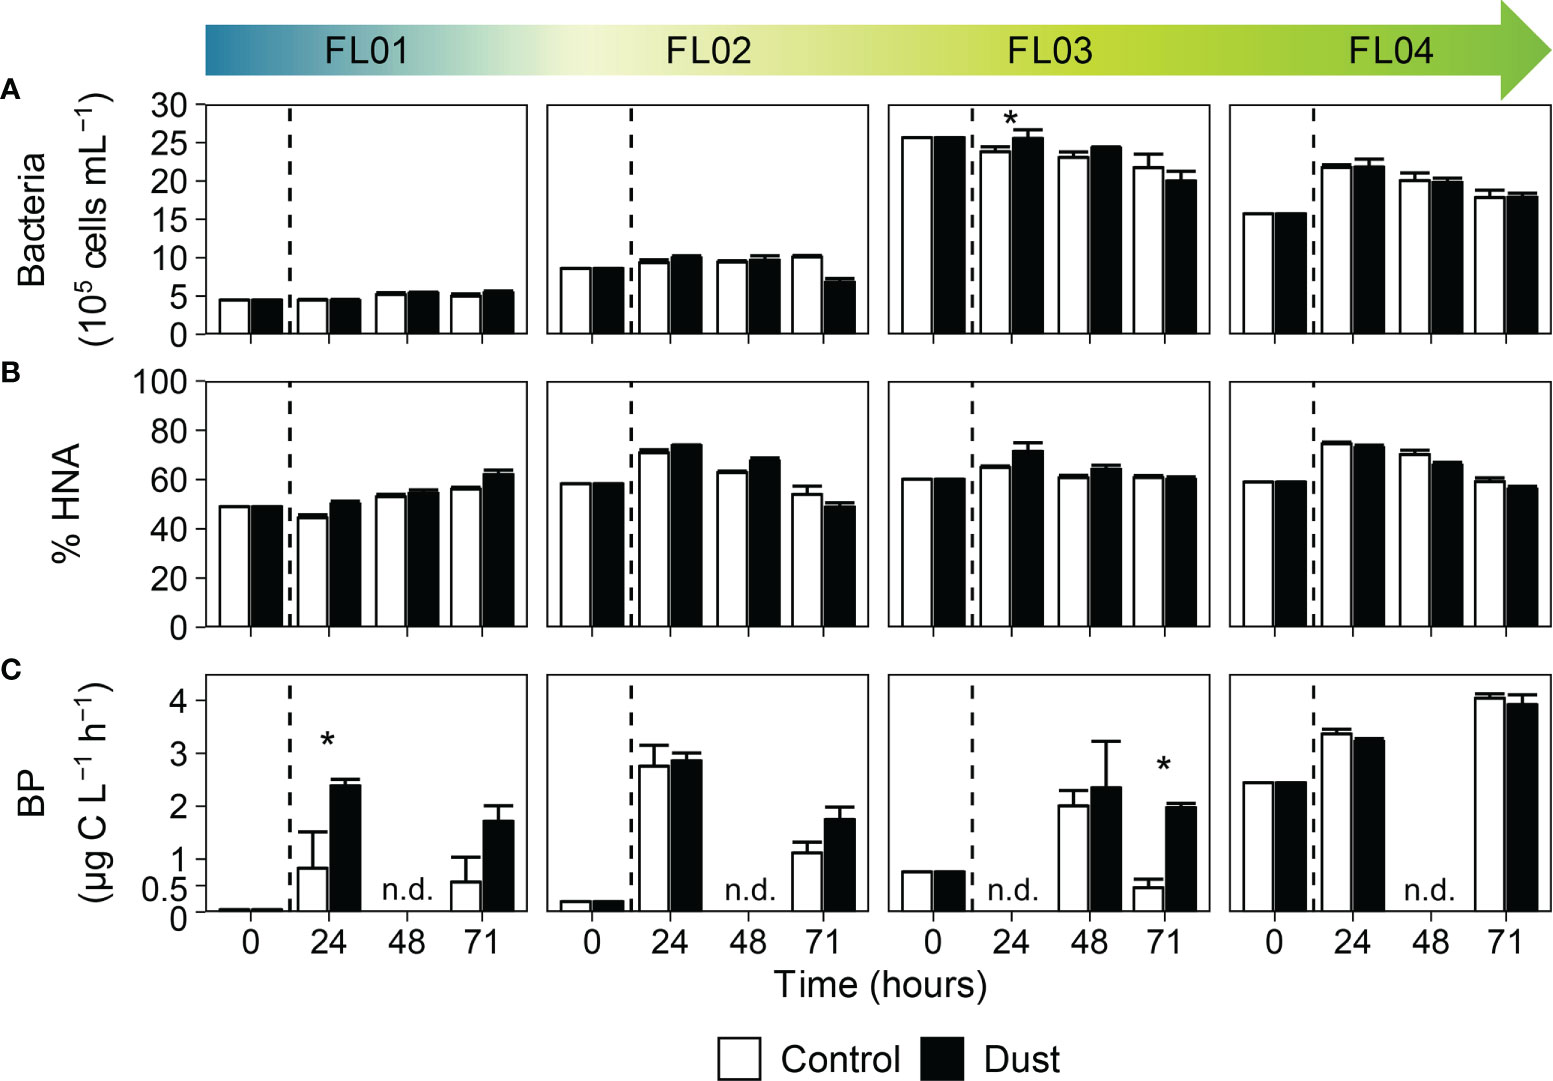
Figure 4 Time evolution of (A) bacterial abundance (cells mL-1), (B) percentage of HNA bacteria, and (C) production (µg C L-1 h-1) over the incubation time. in the control (white bars) and dust-treated microcosms (black bars). The vertical line indicates the dust addition time. Each data point represents the average and standard deviation of three replicated microcosms. The asterisk denotes where the value of dust triplicates was significantly greater than control (p < 0.05, Wilcoxon test). The abbreviation n.d. (no-data) indicate the absence of data at that time of the experimental incubation. Note that different scales were used.
Pair-wise comparisons among all dust-treated microcosms (Supplementary Table 2) showed that the highest differences in bacterial abundance and production were found between the experiments FL01 and FL03, as compared to the differences between FL02 and FL04.
Microbial community structure and diversity
Eukaryotic 18S samples counted for a total of 422,390 reads by 1,026 ASVs, in which 73 class-level taxa and 216 family-level taxa was determined. Meanwhile, prokaryotic 16S samples contained 446,856 reads by 1,275 ASVs, and comprised 36 class-level and 132 family-level taxa.
Two major clusters were distinguished in both eukaryotic and prokaryotic taxonomic composition according to experiment location (Figure 5). The microbial composition of the oligotrophic FL01 experiment clearly differed from those most eutrophic (FL02, FL03 and FL04). In turn, the FL03 and FL04 experiments clustered together and were distant from the FL02 experiment. NMDS plots confirmed not only the clear separation between experiments’ microbial composition but also between treatments regardless of the incubation time (Supplementary Figures 4, 5). The dissimilarities between control and dust-treated microcosms three days after the enrichment were smaller as eutrophic conditions increased. Almost 60% of the eukaryotic community variance recorded at the end of the experimental period was explained by the experiment physicochemical characteristics (df = 3, r2 = 0.594; F = 14.68, p < 0.001, PERMANOVA test), followed by the differences in treatment (6%; df = 1, r2 = 0.061; F = 4.5, p < 0.01, PERMANOVA). Prokaryotic test results also revealed the variable “experiment” as the main community structuring parameter rather than “treatment”, explaining 61.5% and 8.8% of the variance (Experiment: df = 3, r2 = 0.615; F = 11.3, p < 0.001; Treatment: df = 1, r2 = 0.088; F = 4.81, p < 0.001, PERMANOVA), respectively. In addition, the interaction between “treatment” and “experiment” variables played a key role, as defined 15% of the eukaryotic variance (df = 3, r2 = 0.15; F = 3.84, p < 0.001, PERMANOVA) and a marginal 6% of the prokaryotic differences (df = 2, r2 = 0.06; F = 1.68, p < 0.1, PERMANOVA).
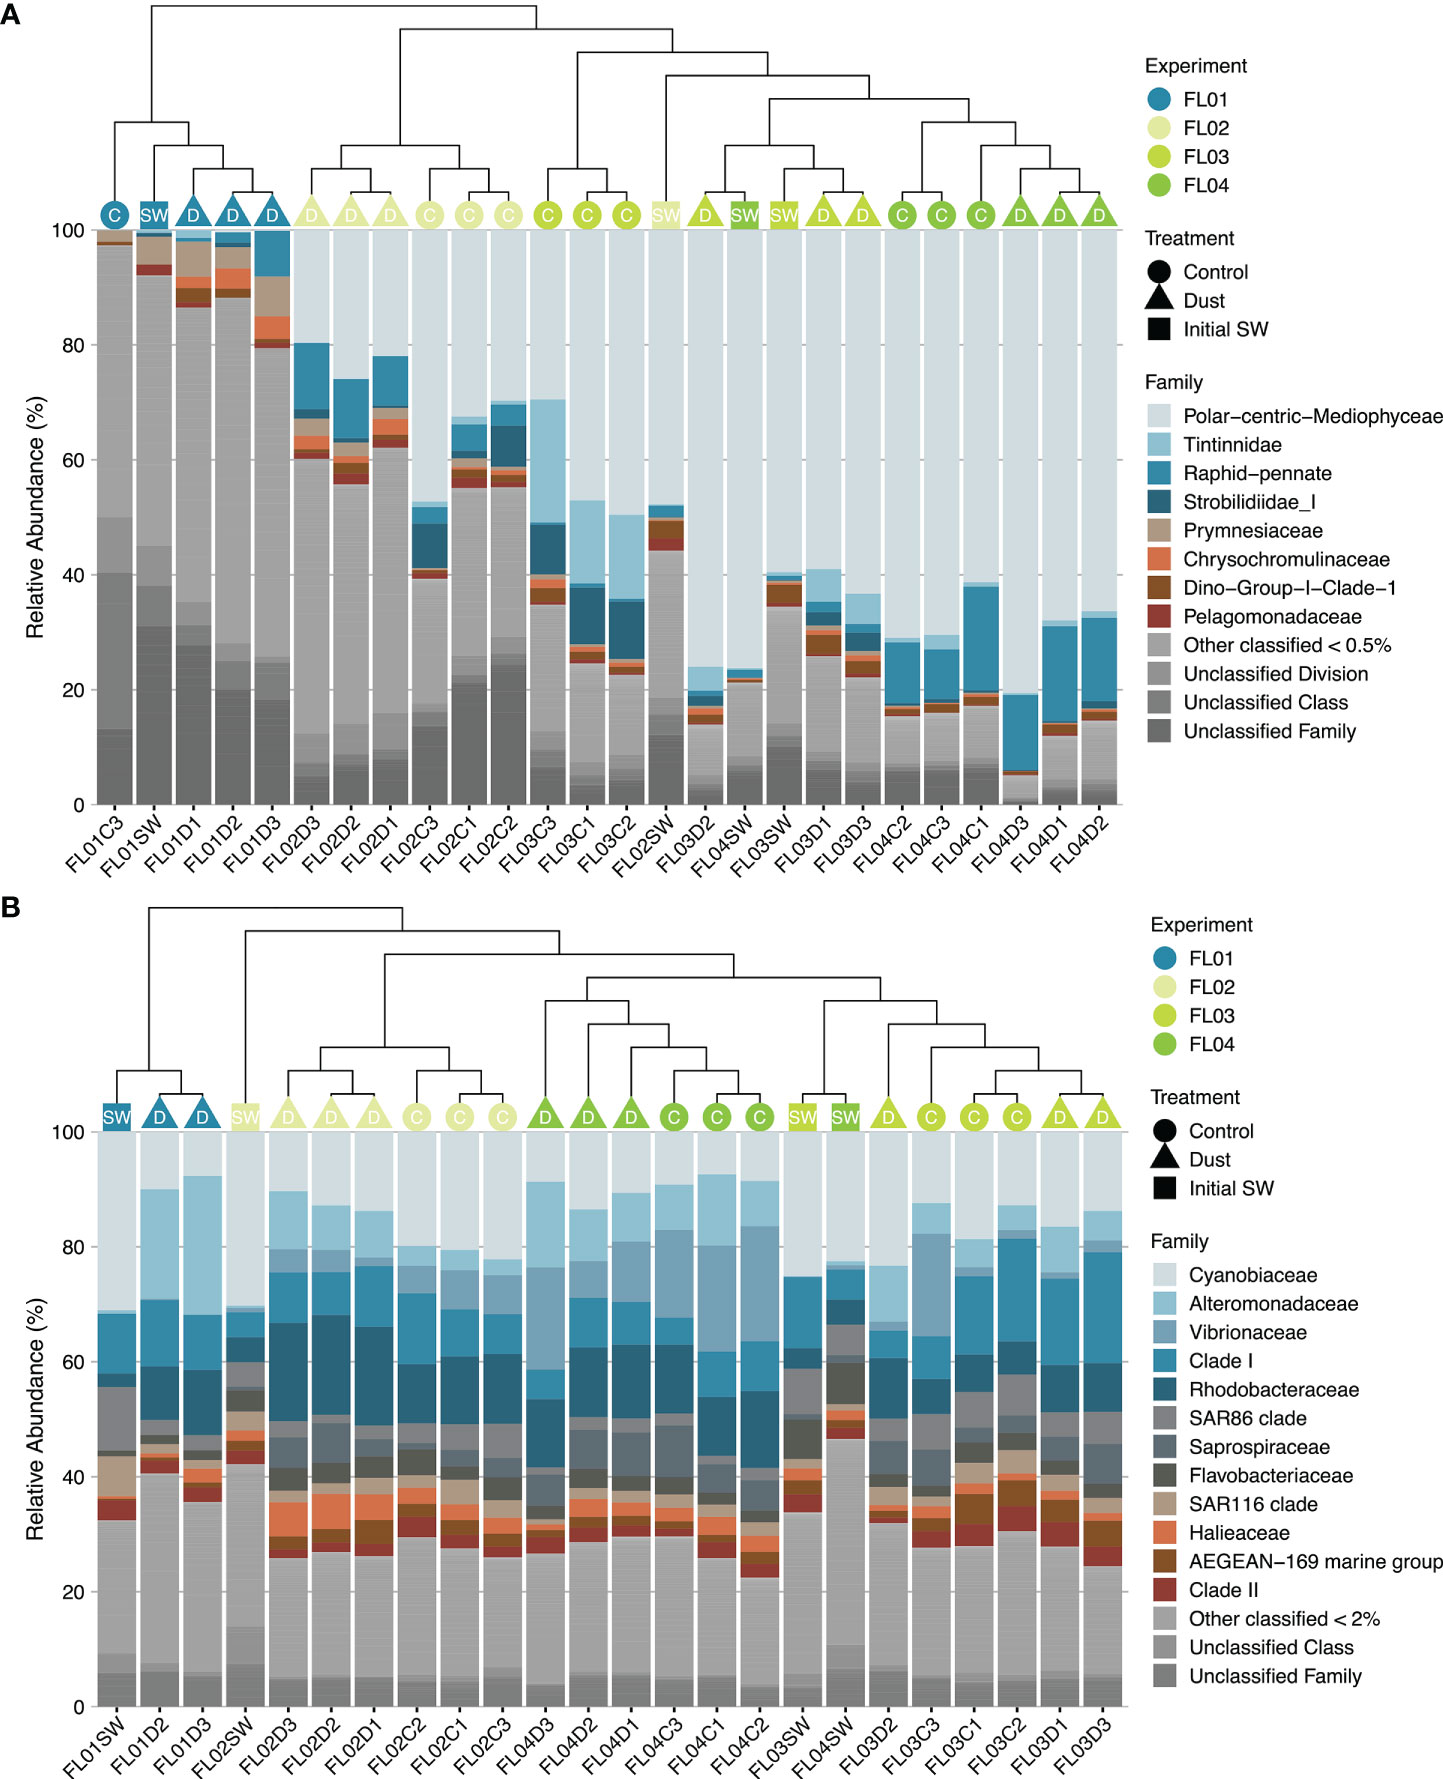
Figure 5 Hierarchical clustering and relative abundance of family-classified (A) eukaryotes and (B) prokaryotes. Groups are ordered by decreasing median relative abundances. Histograms colours were assigned for all phyla detected with a relative abundance ≥ 0.5% and/or ≥ 2%. Data represent the initial time (SW) of the incubations, and control (C) and dust-treated (D) triplicate microcosms at the end of the experiments.
The relative abundance of each taxonomic group also displayed a distinct distribution between experiments and dust-treated microcosms (Figure 5). The natural eukaryotic communities under eutrophic conditions were dominated by Bacillariophyta (diatoms), ranging from 51% to 78% of relative abundance (Supplementary Figure 6A). The family Polar-centric-Mediophyceae accounted for more than 50% of diatom abundances and showed little changes in response to dust addition (Figure 5A). As opposed to the control microcosms (Supplementary Table 3), the indicator species analysis revealed a significant association of the Raphid-pennate diatom’s family with the overall dust-treated microcosms (p = 0.01, stat = 0.79) (Supplementary Table 4), reaching no more than 15% at the end of all incubations. Other eukaryotic groups, such as Dinophyceae and Syndiniales (dinoflagellates), and Prymnesiophyceae (haptophytes), showed higher relative abundances (37%, 10% and 8% respectively) under natural oligotrophic conditions. While dinoflagellates consistently decreased regardless of the treatment and experiment, several members of marine stramenopiles, haptophytes and ciliates thrived upon dust addition under oligotrophic conditions. Particularly, Chrysochromulina rotalis (p = 0.02, stat = 0.80) and Labyrinthulomycetes sp. (p = 0.03, stat = 0.82) species were significantly related to the dust treatment, accounting for less than 1% of eukaryotic relative abundances. On the other hand, natural prokaryotic communities were almost similar at class-level among the four experiments (Supplementary Figure 6B). Alpha- and gamma-Proteobacteria showed the highest relative abundances (>30%), followed by Cyanobacteria (>20%) and Bacteroidia (<15%). Changes in the bacterial community structure among experiments or following dust addition were observed at family-level (Figure 5B). The Cyanobiaceae family was responsible for most of the natural cyanobacterial populations, in which Synechococcus relative abundance was higher under eutrophic conditions (~22-27%) and Prochlorococcus genus under the oligotrophic one (~30%). Overall, the former cyanobacterial group increased towards dust addition, while the latter decreased. However, the most striking responses were found in Alteromonadaceae family of Gammaproteobacteria, since several members of this family significantly increased in dust-treated microcosms (p < 0.05, stat > 0.75; Supplementary Table 4). The indicator species analysis also indicated several families of Alphaproteobacteria, such as Hyphomonadaceae, Sphingomonadaceae and Rhodobacteraceae, as organisms significantly related to dust (p < 0.05, stat > 0.75). Particularly, Alteromonas and Hyphomonas genera were always present after dust addition, with relative abundances ranging from 6% to 20% and 0.4% to 14%, respectively.
The association between microbial richness (Chao 1 index) and local productivity in natural samples displayed a hump-shaped relationship and peaked at intermediate productivity levels (Figure 6A). The diversity (Shannon index) of eukaryotes declined with increasing productivity, and that of prokaryotes was similar albeit highest between eutrophic conditions (Figure 6B). The relationship between alpha diversity and productivity showed little change throughout the experimental incubations Figures 6C, D; Supplementary Figure 7). No responses to dust addition were observed in prokaryotic alpha diversity when compared to the controls (ΔChao1 and ΔShannon). In this context, dust specially benefited eukaryotic alpha diversity under oligotrophic conditions, and strongly stimulated BP over PPTOC. Yet, in the dust-treated microcosms, greater microbial richness was observed with increasing eutrophic conditions, as opposed to the diversity estimates (Supplementary Figure 7). Therefore, dust inputs unevenly altered microbial alpha diversity among experiments (p < 0.001, One-way ANOVA; Supplementary Figure 7). The greatest variations in the response of microbial alpha diversity were found between the oligotrophic experiment and the most eutrophic. Two-way ANOVA results underlined that microbial richness and diversity were primarily modulated by the starting conditions of the incubations (p < 0.005, Two-way ANOVA; Supplementary Table 5). Nonetheless, the interaction between dust addition and each experiment singularity had a significant impact on the diversity of eukaryotes (p < 0.05, Two-way ANOVA).
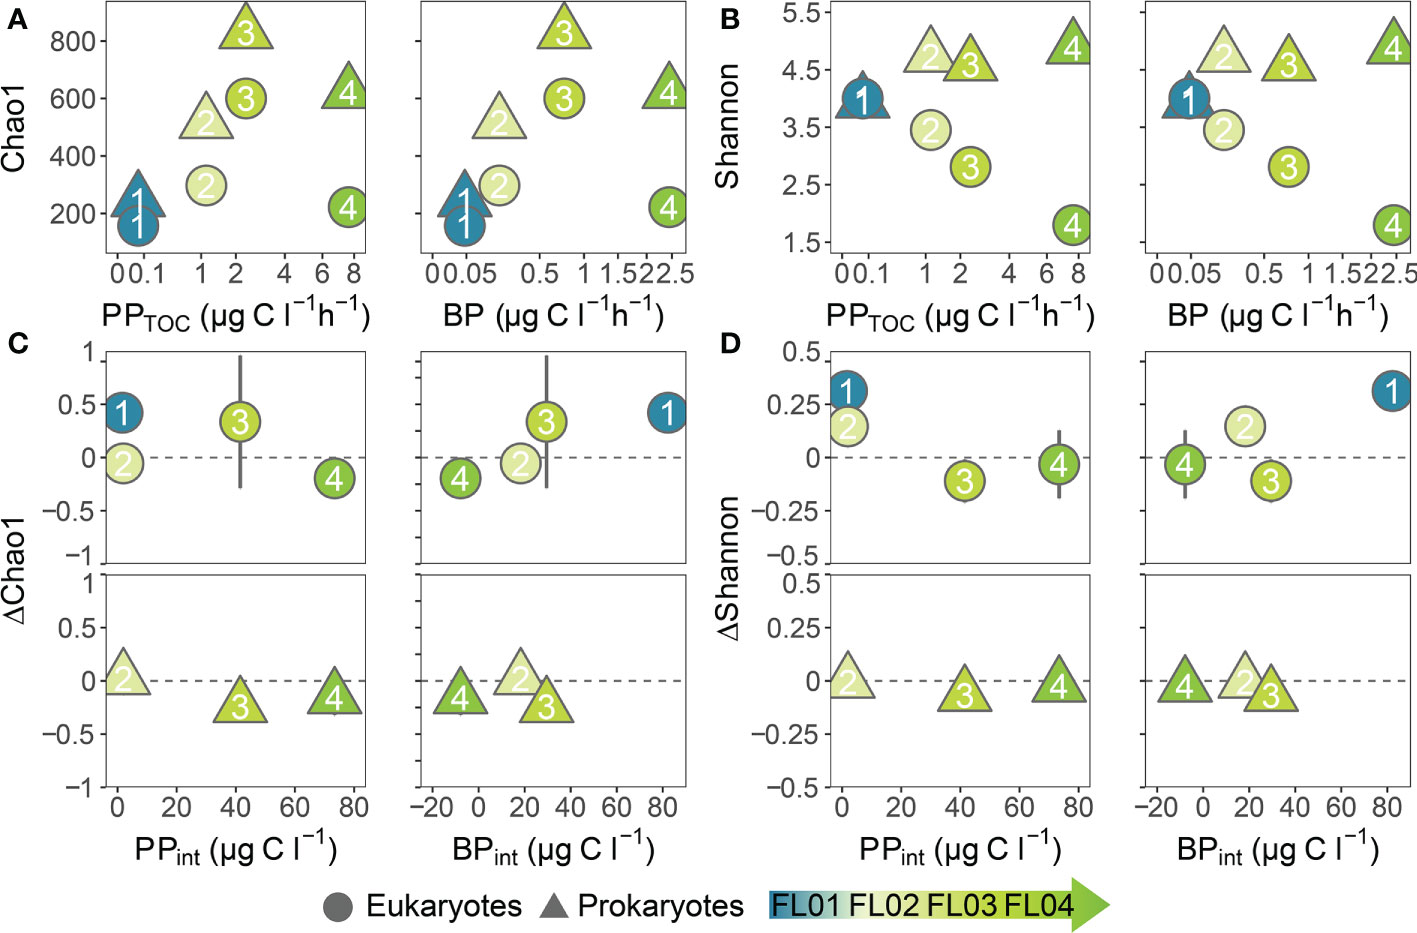
Figure 6 (A) Estimated richness (Chao 1) and (B) diversity (Shannon) versus primary production (PPTOC; µg C L-1 h-1) and bacterial production (BP; µg C L-1 h-1) at the beginning of the incubations. Difference between control and dust-treated microcosms in (C) richness and (D) diversity estimates at the end of the experiments against the hourly-integrated primary and bacterial production rates (µg C L-1). Each point colour represents an experiment whereas the shape indicates the eukaryotes (circle) and prokaryotes (triangle) datasets. Note that different scales were used.
Discussion
Metabolic rates
Microbial metabolic rates showed greater changes in response to dust addition than total microbial cell abundances. The uncoupling between cell abundances and metabolic processes was most evident in oligotrophic waters, which was consistent with earlier findings during nutrient (Martínez-García et al., 2010) and dust bioassays (Marañón et al., 2010) along latitudinal transects in the central Atlantic Ocean.
Marañón et al. (2010) presented evidence that the predominant type of metabolic response following dust deposition in the central Atlantic Ocean depended on the ecosystem’s degree of oligotrophy and was modulated by the competition for nutrients between microbial communities. The authors observed that primary production response to dust tended to decrease with increasing oligotrophy, whereas the response of bacterial production showed the opposite pattern. Our results agree with their observations in terms of a greater stimulation of bacterial production as oligotrophy increases but differ on the response of phytoplankton metabolism based on the initial environmental conditions. Primary production rates in our experiments showed a lag phase as short as 2 days under moderate and low levels of nutrient concentrations, which was consistent with observations in other oligotrophic areas worldwide (Gazeau et al., 2021; Maki et al., 2021). We assumed that changes in primary production were mediated by a stimulation in the relative contribution of larger phytoplankton cells and picoeukaryotic and picocyanobacterial communities to total abundance and production, as well as by the interactions across microbial communities. Dust bioassays conducted on the Mediterranean Sea underlined the importance of the composition and metabolic state of the initial microbial community on the potential positive effect of dust deposition on microbial metabolism (Dinasquet et al., 2021; Gazeau et al., 2021). While it is true that intense dust deposition induced a favorable effect on the overall autotrophic productivity in our experiments, bacterial production response to dust treatment was sharper than that of primary production. Integrated PPTOC rates in dust-treated microcosms increased between 2% to 28% above the controls, while the ones of BP ranged from ≤31% in the eutrophic experiments to 190% in the oligotrophic experiment. Given the current trend of increased dust deposition (Jickells et al., 2005) and weakening of the Mauritanian-Senegalese upwelling system under climate change (Sylla et al., 2019), future dust deposition in the region may result in a more heterotrophic system and the decrease in carbon sequestration.
Several nutrient bioassays revealed that autotrophic productivity over the Atlantic Ocean was primarily limited by nitrogen concentration over short timescales (Mills et al., 2004; Davey et al., 2008; Mills et al., 2008; Moore et al., 2008), while heterotrophic productivity was likewise limited by available phosphate and carbon substrates (Mills et al., 2008; Martínez-García et al., 2010). Because Saharan dust deposition provides simultaneous additions of nutrients, such as nitrate, phosphate, iron and organic carbon (Guieu et al., 2002; Pulido-Villena et al., 2008; this study), one might speculate that the plausible metabolic response would be dependent on the C:N and C:P ratios of dust inputs in the Atlantic Ocean. In this context, integrated PPPOC rates in our experiments converted to P (using a 6.6 C:P molar ratio; Martiny et al., 2014) showed that phosphate addition through dust (+0.1 µmol L-1) exceeded phytoplankton P requirements in the oligotrophic incubation (~0.004 µmol P L-1) and barely covered those under eutrophic conditions (~0.1 µmol P L-1, on average). These estimations suggest that the decrease in phosphate seawater concentration right after dust addition was primarily driven by heterotrophic bacteria, particularly under low nutrient concentrations. Nutrient input in the context of an intense dust deposition event would therefore not be sufficient to sustain both the fast response of heterotrophic bacteria and the delayed one of primary producers, which lends support to previous findings in the Mediterranean Sea (Gazeau et al., 2021). Earlier studies found that the apparent success of these bacteria was also related to sources of organic carbon derived from dust deposition (Pulido-Villena et al., 2008). Their smaller cells showing larger surface-to-volume ratios, among other mechanisms, help bacteria access nutrients more efficiently under low nutrient concentrations (Young, 2006). The extent to which phytoplankton was benefited from our pulse of dust deposition was hence influenced by the competition for nutrients between microbial communities.
Cell abundances, structure, and composition of microbial communities
Dust enrichment favored the presence of certain planktonic groups over others, even though phytoplankton and bacteria total abundances barely changed compared to controls. This result correlates favorably with previous observations in the Atlantic Ocean (Marañón et al., 2010; Chien et al., 2016).
The release of nutrients through dust enhanced larger phytoplankton cells, associated with either the abundance of diatoms under eutrophic conditions or dinoflagellates in oligotrophic conditions. While the relative abundance of Dinophyceae and Syndiniales (dinoflagellates) decreased throughout the experiments, Bacillariophyta (diatoms) benefited from the dust input. Previous bioassay studies had already underlined the role of diatoms as the main contributors in total phytoplankton biomass (and primary production) following dust deposition, even under oligotrophic conditions where diatoms initially had minor populations (Duarte et al., 2006; Maki et al., 2021). The diatom community in our experiments was dominated by the family Polar-centric-Mediophyceae, who commonly describes phytoplankton functional assemblages (Medlin and Kaczmarska, 2004). However, it was the Raphid-pennate family who took advantage from the dust addition, with a consistent increase of almost 15% of relative abundance throughout the incubations. Although the two families are closely related, Raphid-pennate differs in its high motility and ability to glide over surfaces and through sediment (Adl et al., 2019). The large proportion of soluble nitrate in aerosols in this region (López-García et al., 2021; this study) might have supported the growth of these microphytoplankton organisms, especially under low nutrient environments. The apparent utilization of nitrate by diatoms could explain the observed decline in nitrate seawater concentrations, which was faster with increasing eutrophic conditions. Previous findings in the literature showed that members of the Raphid-pennate family could display a widespread symbiosis with marine diazotroph organisms under persistent nitrate depletion (Schvarcz et al., 2022). Shifts in dissolved silicate concentrations in our dust-treated microcosms could be related to this diatom assemblage, but also to other identified siliceous protists (such as radiolarians and silicoflagellates) and potentially Synechococcus cyanobacteria (Baines et al., 2012). Certain bacteria could also accelerate silica dissolution in seawater by enzymatically degrading diatom organic matter, like Flavobacteriaceae, Alteromonadaceae and Vibrionaceae groups (Bidle and Azam, 2001). Therewithal, our approach evidenced that intense dust deposition could not only sustain the proliferation of diatoms (consistent with previous findings, e.g., Maki et al. (2021)) but could also regulate their community structure and composition no matter the initial trophic conditions.
Other members of marine stramenopiles also thrived in our dust-treated microcosms, including heterotrophic protists and several MAST lineages comprising heterotrophic nanoflagellates (such as MAST-1 and -7) (Massana et al., 2004; Massana et al., 2006). This would imply that total bacteria and/or picophytoplankton abundances in our experiments may be limited by grazing pressure. Nonetheless, our results suggest that changes in total picophytoplankton abundance were driven primarily by picocyanobacterial responses. Synechococcus cell abundance increased over the experimental time, being especially significant after 2-3 days, whereas Prochlorococcus decreased. Hill et al. (2010) presented evidence that the metabolic activity of Prochlorococcus strains in the tropical northeast Atlantic Ocean was inhibited in the presence of either natural dust or dust-leachate additions. This cyanobacterial genus did not respond strongly to neither nutrient or dust amendments in the oligotrophic ocean off Barbados (Chien et al., 2016), yet the authors identified that the length of time some Prochlorococcus strains stayed in stationary phase was a function of the N:P ratio. Their study suggests that the high atmospheric deposition rates and high N:P ratios sustain P limitation in low-nutrient low-chlorophyll areas and favor phytoplankton with low P requirements and efficient P acquisition mechanisms, such as Prochlorococcus. The inability of Prochlorococcus to assimilate nitrate is in fact an important factor underlying its distribution (Martiny et al., 2009), which could explain the low abundance of these cyanobacteria in our study region. Since the oligotrophic waters off the Mauritanian-Senegalese region were not only depleted in P but more severely in N, it seems unlikely that Prochlorococcus would benefit from elevated dust-leached nutrient concentrations considering that these high quantities of nutrients and dust may be toxic to this microorganism (Paytan et al., 2009). The lack of many regulatory proteins for nutrient uptake in Prochlorococcus (Martiny et al., 2009) may also prevent this population to outcompete more abundant picocyanobacterial organisms in the area, like Synechococcus. In a time-series study in the western Atlantic, Borchardt et al. (2020) observed an increase in picoeukaryote cellular abundance preceded by a picocyanobacterial peak upon highly processed dust deposition. In contrast, Marañón et al. (2010) reported the concurrent decrease of both cyanobacteria populations following dust deposition in the central North Atlantic while picoeukaryotes abundance increased. Our results confirm those of earlier nutrient bioassays conducted in the tropical North Atlantic Ocean (Davey et al., 2008; Moore et al., 2008), where not only both picocyanobacterial populations but also picoeukaryotes increased after combined N and P or N and Fe additions.
Furthermore, smaller cells reached higher responses to dust addition under low levels of nutrient concentrations. Experiments conducted in the Mediterranean Sea highlighted haptophytes in the response of active picoeukaryotes to the addition of Saharan dust or European aerosols (Wu et al., 2018). In line with this observation, the relative abundance of Haptophyta (mostly Prymnesiophyceae) increased throughout our dust-treated microcosms (<12% of relative abundance), where the species Chrysochromulina rotalis was found to be indicative of dust treatment (<0.5% in dust-treated microcosms). Interestingly, the Chrysochromulina genus has been previously identified as one of the most abundant grazers of Prochlorococcus cyanobacteria in the upper euphotic zone (Li et al., 2022). However, since their abundance was markedly low in our treated microcosms (<3%), their potential effect on Prochlorococcus population would be minimal. Likewise, the protist Labyrinthulomycetes, who plays an important role in mineralization of marine plankton detritus (Raghukumar, 2002), was found associated with our dust-treated microcosms (<1%).
Total heterotrophic bacteria cell abundances showed minor changes upon dust addition despite the high variability in bacterial community structure. The Alteromonadaceae family, which comprises a widespread marine bacteria (López-Pérez and Rodriguez-Valera, 2014), benefited the most from the addition of dust in all our experiments albeit especially under oligotrophic conditions. In particular, the presence of the Alteromonas genus in our dust-treated microcosms was significant, with increases ranging from 6 to 20% of relative abundance at the end of the experiments. Ecologically, Alteromonas are typical r strategists that bloom under conditions of sudden increase in the availability of resources (Allers et al., 2007; López-Pérez and Rodriguez-Valera, 2014) hence the likely release of organic matter (and phosphate) from our dust pulse may have triggered its growth. This reproduces previous observations in which Alteromonadaceae abundance increased induced by additions of organic matter through aerosol inputs under oligotrophic and nutrient-sufficient seawater conditions (Dinasquet et al., 2021; Maki et al., 2021). This fast responding strategy upon dust inputs had been also observed on the Vibrio genus (Westrich et al., 2018), in contrast to our results as Vibrio increased regardless of the dust treatment (~10% and ~4% in control and dust-treated microcosms, respectively). Denitrifying bacteria such as Hyphomonas were also distinguished at the end of our dust microcosms and especially in the oligotrophic experiment. Another aspect that could have promoted some of these copiotrophic taxa was the release of organic matter by phytoplankton. Previous literature indeed suggests that at least the family of marine Rhodobacteraceae was associated with blooms of diatoms (Grossart et al., 2005), which would explain its presence in our oligotrophic and more notably in eutrophic experiments.
Alpha diversity of the investigated microbial communities was primarily determined by the unique initial characteristics of each experiment (intrinsic local productivity and nutrient availability). Initially, seawater samples exhibited a hump-shaped relationship between productivity and species richness. However, the underlying mechanisms of this widely accepted relationship remain unclear (Mittelbach et al., 2001; Horner-Devine et al., 2003). Earlier studies proposed that increasing productivity may amplify the importance of competition and predation on microbial community composition (Bohannan and Lenski, 2000; Vallina et al., 2014). The strongest competitors were favored at low levels of productivity, while those more resistant to predation thrived at higher productivity levels. Eukaryotic diversity estimates in natural surface seawaters were lower as eutrophic conditions increased, which was explained by the relative increase of sequences related to diatoms. The diversity of prokaryotes was similar albeit highest under natural eutrophic conditions as observed when comparing coastal against open sea diversity. Dust addition in our experiments showed little effect on the above-mentioned alpha diversity patterns and displayed the most significant variations between the oligotrophic experiment versus the most eutrophic one. Despite the trophic gradient was one of the main factors sustaining microbial alpha diversity across the Mauritanian-Senegalese region, intense dust deposition exerted a significant influence on the diversity of eukaryotes on a local scale.
Conclusions
This study provides a detailed description of the complex response of marine microbial communities to intense dust deposition along a trophic gradient in the coastal transition zone of the subtropical northeast Atlantic. We show that certain groups of organisms thrived better than others in response to dust addition according to their nutrient requirements. Our dust-treated microcosms were typically characterized by Raphid-pennate diatoms, and by copiotrophic bacteria like Hyphomonas (alphaproteobacteria) and Alteromonas (gammaproteobacteria). However, smaller phytoplankton cells showed larger responses to dust addition as initial nutrient concentrations declined. Picoeukaryote cellular abundance increased, followed by a subsequent peak in Synechococcus cell abundance along with a decrease in Prochlorococcus. The dissimilarities between picocyanobacteria populations were related to the N and P co-limitation identified in the region of study. Likewise, intense dust deposition emerges as a key determinant of microbial diversity only when the singularity of the environment (i.e., nutrient bioavailability and productivity conditions) is considered. Dust treatments increased microbial alpha diversity under low nutrient concentrations, as well as promoted bacterial production over primary production. These findings suggest that increasing dust deposition events and weakening of the Mauritanian-Senegalese upwelling system under climate change may result in greater stimulation of bacterial metabolism rather than enhancing primary production, leading to a more heterotrophic system and reducing its potential to function as an atmospheric carbon sink.
Data availability statement
The datasets presented in this study can be found in online repositories. The names of the repository/repositories and accession number(s) can be found below: https://www.ncbi.nlm.nih.gov/, PRJNA862364.
Author contributions
JA, MG-C and MM designed the experiments. JA, MG-C, NH-H, IB and MG-L performed the on-board experiments. CP-B, MG-C, NH-H, IB, MG-L and JMA performed the laboratory analyses and CP-B the statistical analyses. MG-C provided the atmospheric dust and CP-B and MG-C performed its characterization. JA was chief scientist of the FLUXES-I oceanographic campaign. CP-B and JA wrote the manuscript. All authors contributed to the article and approved the submitted version.
Funding
This research was funded by the Spanish National Plan for I+D projects FLUXES (CTM2015-69392-C3-1-R) and e-IMPACT (PID2019-109084RB-C2). Additional support was provided through the “Observatorio Canario de HABs (OC-HABS)” funded by the Gobierno de Canarias, and from projects TRIATLAS (AMD-817578-5) from the European Union’s Horizon 2020, and FONIAC 2019 (Fundación Caja Canarias and Fundación Bancaria La Caixa). CP-B (PRE2018-083800) and MG-L (FPU17-01435) are supported by the Ministerio de Ciencia, Innovación y Universidades, Gobierno de España. JA also acknowledges support from the United States National Science Foundation grant OCE-1840868 to the Scientific Committee on Oceanic Research (SCOR, United States) WG 155.
Acknowledgments
We thank all scientists that participated in Fluxes-I oceanographic cruise and were involved in the dust experiments. We also thank A. Marrero for providing the CTD data, P. López-García for nutrient analyses, and M. Espino and A. González for some phytoplankton analyses.
Conflict of interest
The authors declare that the research was conducted in the absence of any commercial or financial relationships that could be construed as a potential conflict of interest.
Publisher’s note
All claims expressed in this article are solely those of the authors and do not necessarily represent those of their affiliated organizations, or those of the publisher, the editors and the reviewers. Any product that may be evaluated in this article, or claim that may be made by its manufacturer, is not guaranteed or endorsed by the publisher.
Supplementary material
The Supplementary Material for this article can be found online at: https://www.frontiersin.org/articles/10.3389/fmars.2022.999729/full#supplementary-material
References
Adl S. M., Bass D., Lane C. E., Lukeš J., Schoch C. L., Smirnov A., et al. (2019). Revisions to the classification, nomenclature, and diversity of eukaryotes. J. Eukaryot Microbiol. 66, 4–119. doi: 10.1111/jeu.12691
Allers E., Gómez-Consarnau L., Pinhassi J., Gasol J. M., Šimek K., Pernthaler J. (2007). Response of alteromonadaceae and rhodobacteriaceae to glucose and phosphorus manipulation in marine mesocosms. Environ. Microbiol. 9, 2417–2429. doi: 10.1111/j.1462-2920.2007.01360.x
Amaral-Zettler L. A., McCliment E. A., Ducklow H. W., Huse S. M. (2009).A method for studying protistan diversity using massively parallel sequencing of V9 hypervariable regions of small-subunit ribosomal RNA genes. PLoS One 4, e6372. doi: 10.1371/journal.pone.0006372
Apprill A., McNally S., Parsons R., Weber L. (2015). Minor revision to V4 region SSU rRNA 806R gene primer greatly increases detection of SAR11 bacterioplankton. Aquat. Microb. Ecol. 75, 129–137. doi: 10.3354/ame01753
Baines S. B., Twining B. S., Brzezinski M. A., Krause J. W., Vogt S., Assael D., et al. (2012). Significant silicon accumulation by marine picocyanobacteria. Nat. Geosci. 5, 886–891. doi: 10.1038/ngeo1641
Bidle K. D., Azam F. (2001). Bacterial control of silicon regeneration from diatom detritus: Significance of bacterial ectohydrolases and species identity. Limnol. Oceanogr. 46, 1606–1623. doi: 10.4319/lo.2001.46.7.1606
Blain S., Guieu C., Claustre H., Leblanc K., Moutin T., Quèguiner B., et al. (2004). Availability of iron and major nutrients for phytoplankton in the northeast Atlantic ocean. Limnol. Oceanogr. 49, 2095–2104. doi: 10.4319/lo.2004.49.6.2095
Bohannan B. J. M., Lenski R. E. (2000). The relative importance of competition and predation varies with productivity in a model community. Am. Nat. 156, 329–340. doi: 10.1086/303393
Bonnet S., Guieu C., Chiaverini J., Ras J., Stock A. (2005). Effect of atmospheric nutrients on the autotrophic communities in a low nutrient, low chlorophyll system. Limnol. Oceanogr. 50, 1810–1819. doi: 10.4319/lo.2005.50.6.1810
Borchardt T., Fisher K. V., Ebling A. M., Westrich J. R., Xian P., Holmes C. D., et al. (2020). Saharan Dust deposition initiates successional patterns among marine microbes in the Western Atlantic. Limnol. Oceanogr. 65, 191–203. doi: 10.1002/lno.11291
Callahan B. J., McMurdie P. J., Rosen M. J., Han A. W., Johnson A. J. A., Holmes S. P. (2016). DADA2: High-resolution sample inference from illumina amplicon data. Nat. Methods 13, 581–583. doi: 10.1038/nmeth.3869
Chien C.-T., Mackey K. R. M., Dutkiewicz S., Mahowald N. M., Prospero J. M., Paytan A. (2016). Effects of African dust deposition on phytoplankton in the western tropical Atlantic ocean off Barbados: Dust deposition and phytoplankton growth. Global Biogeochem. Cycles 30, 716–734. doi: 10.1002/2015GB005334
Davey M., Tarran G. A., Mills M. M., Ridame C., Geider R. J., LaRoche J. (2008). Nutrient limitation of picophytoplankton photosynthesis and growth in the tropical north Atlantic. Limnol. Oceanogr. 53, 1722–1733. doi: 10.4319/lo.2008.53.5.1722
De Cáceres M., Legendre P. (2009). Associations between species and groups of sites: indices and statistical inference. Ecology 90, 3566–3574. doi: 10.1890/08-1823.1
Dinasquet J., Bigeard E., Gazeau F., Azam F., Guieu C., Marañón E., et al. (2021). Impact of dust addition on the microbial food web under present and future conditions of pH and temperature. Biogeosci. Discuss. 19, 1–48. doi: 10.5194/bg-2021-143
Dinno A. (2017). Conover.test: Conover-iman test of multiple comparisons using rank sums. R software package. Available at: https://https://alexisdinno.com/stata/convertest.html.
Duarte C. M., Dachs J., Llabrés M., Alonso-Laita P., Gasol J. M., Tovar-Sánchez A., et al. (2006). Aerosol inputs enhance new production in the subtropical northeast Atlantic: Aerosol inputs and new production. J. Geophys. Res. 111, G04006. doi: 10.1029/2005JG000140
Gazeau F., Van Wambeke F., Marañón E., Pérez-Lorenzo M., Alliouane S., Stolpe C., et al. (2021). Impact of dust addition on the metabolism of Mediterranean plankton communities and carbon export under present and future conditions of pH and temperature. Biogeosciences 18, 5423–5446. doi: 10.5194/bg-18-5423-2021
Gelado-Caballero M. D., López-García P., Prieto S., Patey M. D., Collado C., Hérnández-Brito J. J. (2012). Long-term aerosol measurements in gran canaria, canary islands: Particle concentration, sources and elemental composition. J. Geophys. Res. 117, D03304. doi: 10.1029/2011JD016646
Grossart H.-P., Levold F., Allgaier M., Simon M., Brinkhoff T. (2005). Marine diatom species harbour distinct bacterial communities. Environ. Microbiol. 7, 860–873. doi: 10.1111/j.1462-2920.2005.00759.x
Guieu C., Loÿe-Pilot M.-D., Ridame C., Thomas C. (2002). Chemical characterization of the Saharan dust end-member: Some biogeochemical implications for the western Mediterranean Sea. J. Geophys. Res. 107, ACH 5–1–ACH 5–11. doi: 10.1029/2001JD000582
Guieu C., Ridame C., Pulido-Villena E., Bressac M., Desboeufs K., Dulac F. (2014). Impact of dust deposition on carbon budget: a tentative assessment from a mesocosm approach. Biogeosciences 11, 5621–5635. doi: 10.5194/bg-11-5621-2014
Guillou L., Bachar D., Audic S., Bass D., Berney C., Bittner L., et al. (2013). The protist ribosomal reference database (PR2): a catalog of unicellular eukaryote small sub-unit rRNA sequences with curated taxonomy. Nucleic Acids Res. 41, D597–D604. doi: 10.1093/nar/gks1160
Hale M. S., Li W. K. W., Rivkin R. B. (2017). Meridional patterns of inorganic nutrient limitation and co-limitation of bacterial growth in the Atlantic ocean. Prog. Oceanogr. 158, 90–98. doi: 10.1016/j.pocean.2016.11.007
Herut B., Rahav E., Tsagaraki T. M., Giannakourou A., Tsiola A., Psarra S., et al. (2016). The potential impact of Saharan dust and polluted aerosols on microbial populations in the East Mediterranean Sea, an overview of a mesocosm experimental approach. Front. Mar. Sci. 3. doi: 10.3389/fmars.2016.00226
Herut B., Zohary T., Krom M. D., Mantoura R. F. C., Pitta P., Psarra S., et al. (2005). Response of East Mediterranean surface water to Saharan dust: On-board microcosm experiment and field observations. Deep Sea Res. Part II Top. Stud. Oceanogr. 52, 3024–3040. doi: 10.1016/j.dsr2.2005.09.003
Hill P. G., Zubkov M. V., Purdie D. A. (2010). Differential responses of Prochlorococcus and SAR11-dominated bacterioplankton groups to atmospheric dust inputs in the tropical northeast Atlantic ocean. FEMS Microbiol. Lett. 306, 82–89. doi: 10.1111/j.1574-6968.2010.01940.x
Holm-Hansen O., Lorenzen C. J., Holmes R. W., Strickland J. D. H. (1965). Fluorometric determination of chlorophyll. J. Cons. perm. Int. Explor. Mer 30, 3–15. doi: 10.1093/icesjms/30.1.3
Horner-Devine M. C., Leibold M. A., Smith V. H., Bohannan B. J. M. (2003). Bacterial diversity patterns along a gradient of primary productivity: Bacterial diversity and primary productivity. Ecol. Lett. 6, 613–622. doi: 10.1046/j.1461-0248.2003.00472.x
Jickells T. D., An Z. S., Andersen K. K., Baker A. R., Bergametti C., Brooks N., et al. (2005). Global iron connections between desert dust, ocean biogeochemistry, and climate. Science 308, 67–71. doi: 10.1126/science.1105959
Jickells T. D., Baker A. R., Chance R. (2016). Atmospheric transport of trace elements and nutrients to the oceans. Phil. Trans. R. Soc A 374, 20150286. doi: 10.1098/rsta.2015.0286
Joint I., Henriksen P., Fonnes G., Bourne D., Thingstad T., Riemann B. (2002). Competition for inorganic nutrients between phytoplankton and bacterioplankton in nutrient manipulated mesocosms. Aquat. Microb. Ecol. 29, 145–159. doi: 10.3354/ame029145
Kassambara A. (2020). Ggpubr: “ggplot2” based publication ready plots. R package version 0.4.0. Availble at: https://CRAN.R-Project.org/package=ggpubr.
Kassambara A. (2021). Rstatix: Pipe-friendly framework for basic statistical tests. R package version 0.7.0. Available at https://CRAN.R-Project.org/package=rstatix.
Kirchman D., Ducklow H. (1993). Estimating conversion factors for the Thymidine and Leucine methods for measuring bacterial production in Handb. Methods Aquat. Microb. Ecol. (Boca Raton, FL: Lewis Publishers), 513–517.
Langlois R. J., Mills M. M., Ridame C., Croot P., LaRoche J. (2012). Diazotrophic bacteria respond to Saharan dust additions. Mar. Ecol. Prog. Ser. 470, 1–14. doi: 10.3354/meps10109
Lekunberri I., Lefort T., Romero E., Vázquez-Domínguez E., Romera-Castillo C., Marrasé C., et al. (2010). Effects of a dust deposition event on coastal marine microbial abundance and activity, bacterial community structure and ecosystem function. J. Plankton Res. 32, 381–396. doi: 10.1093/plankt/fbp137
Li Q., Edwards K. F., Schvarcz C. R., Steward G. F. (2022). Broad phylogenetic and functional diversity among mixotrophic consumers of prochlorococcus. ISME J. 16, 1557–1569. doi: 10.1038/s41396-022-01204-z
López-García P., Gelado-Caballero M. D., Patey M. D., Hernández-Brito J. J. (2021). Atmospheric fluxes of soluble nutrients and fe: More than three years of wet and dry deposition measurements at gran canaria (Canary islands). Atmos. Environ. 246, 118090. doi: 10.1016/j.atmosenv.2020.118090
López-García P., Gelado-Caballero M. D., Santana-Castellano D., Suárez de Tangil M., Collado-Sánchez C., Hernández-Brito J. J. (2013). A three-year time-series of dust deposition flux measurements in gran canaria, Spain: A comparison of wet and dry surface deposition samplers. Atmos. Environ. 79, 689–694. doi: 10.1016/j.atmosenv.2013.07.044
López-Pérez M., Rodriguez-Valera F. (2014). “The family alteromonadaceae,” in The prokaryotes: Gammaproteobacteria. Eds. Rosenberg E., DeLong E. F., Lory S., Stackebrandt E., Thompson F. (Berlin, Heidelberg: Springer), 69–92. doi: 10.1007/978-3-642-38922-1_233
Maki T., Lee K. C., Pointing S. B., Watanabe K., Aoki K., Archer S. D. J., et al. (2021). Desert and anthropogenic mixing dust deposition influences microbial communities in surface waters of the western pacific ocean. Sci. Total Environ. 791, 148026. doi: 10.1016/j.scitotenv.2021.148026
Marañón E., Fernández A., Mouriño-Carballido B., Martínez-García S., Teira E., Cermeño P., et al. (2010). Degree of oligotrophy controls the response of microbial plankton to Saharan dust. Limnol. Oceanogr. 55, 2339–2352. doi: 10.4319/lo.2010.55.6.2339
Martin M. (2011). Cutadapt removes adapter sequences from high-throughput sequencing reads. EMBnet.journal 17, 10–12. doi: 10.14806/ej.17.1.200
Martínez-García S., Fernández E., Calvo-Díaz A., Marañín E., Morán X. A. G., Teira E. (2010). Response of heterotrophic and autotrophic microbial plankton to inorganic and organic inputs along a latitudinal transect in the Atlantic ocean. Biogeosciences 7, 1701–1713. doi: 10.5194/bg-7-1701-2010
Martiny A. C., Kathuria S., Berube P. M. (2009). Widespread metabolic potential for nitrite and nitrate assimilation among prochlorococcus ecotypes. PNAS 106, 10787–10792. doi: 10.1073/pnas.0902532106
Martiny A. C., Vrugt J. A., Lomas M. W. (2014). Concentrations and ratios of particulate organic carbon, nitrogen, and phosphorus in the global ocean. Sci. Data 1, 140048. doi: 10.1038/sdata.2014.48
Massana R., Castresana J., Balagué V., Guillou L., Romari K., Groisillier A., et al. (2004). Phylogenetic and ecological analysis of novel marine stramenopiles. Appl. Environ. Microbiol. 70, 3528–3534. doi: 10.1128/AEM.70.6.3528-3534.2004
Massana R., Terrado R., Forn I., Lovejoy C., Pedrós-Alió C. (2006). Distribution and abundance of uncultured heterotrophic flagellates in the world oceans. Environ. Microbiol. 8, 1515–1522. doi: 10.1111/j.1462-2920.2006.01042.x
McMurdie P. J., Holmes S. (2013). Phyloseq: An r package for reproducible interactive analysis and graphics of microbiome census data. PloS One 8, e61217. doi: 10.1371/journal.pone.0061217
Medlin L. K., Kaczmarska I. (2004). Evolution of the diatoms: V. morphological and cytological support for the major clades and a taxonomic revision. Phycologia 43, 245–270. doi: 10.2216/i0031-8884-43-3-245.1
Mills M. M., Moore C. M., Langlois R., Milne A., Achterberg E., Nachtigall K., et al. (2008). Nitrogen and phosphorus co-limitation of bacterial productivity and growth in the oligotrophic subtropical north Atlantic. Limnol. Oceanogr. 53, 824–834. doi: 10.4319/lo.2008.53.2.0824
Mills M. M., Ridame C., Davey M., La Roche J., Geider R. J. (2004). Iron and phosphorus co-limit nitrogen fixation in the eastern tropical north Atlantic. Nature 429, 292–294. doi: 10.1038/nature02550
Mittelbach G. G., Steiner C. F., Scheiner S. M., Gross K. L., Reynolds H. L., Waide R. B., et al. (2001). What is the observed relationship between species richness and productivity? Ecology 82, 2381–2396. doi: 10.1890/0012-9658(2001)082[2381:WITORB]2.0.CO;2
Moore C. M., Mills M. M., Langlois R., Milne A., Achterberg E. P., La Roche J., et al. (2008). Relative influence of nitrogen and phosphorous availability on phytoplankton physiology and productivity in the oligotrophic sub-tropical North Atlantic Ocean. Limnol. Oceanogr. 53, 291–305. doi: 10.4319/lo.2008.53.1.0291
Nowald N., Iversen M. H., Fischer G., Ratmeyer V., Wefer G. (2015). Time series of in-situ particle properties and sediment trap fluxes in the coastal upwelling filament off cape blanc, Mauritania. Prog. Oceanogr. 137, 1–11. doi: 10.1016/j.pocean.2014.12.015
Oksanen J., Blanchet F. G., Friendly M., Kindt R., Legendre P., McGlinn D., et al. (2019). Vegan: Community ecology package. Availble at: https://CRAN.R-project.org/package=vegan.
Parada A. E., Needham D. M., Fuhrman J. A. (2016). Every base matters: assessing small subunit rRNA primers for marine microbiomes with mock communities, time series and global field samples. Environ. Microbiol. 18, 1403–1414. doi: 10.1111/1462-2920.13023
Paytan A., Mackey K. R. M., Chen Y., Lima I. D., Doney S. C., Mahowald N., et al. (2009). Toxicity of atmospheric aerosols on marine phytoplankton. PNAS 106, 4601–4605. doi: 10.1073/pnas.0811486106
Pitta P., Kanakidou M., Mihalopoulos N., Christodoulaki S., Dimitriou P. D., Frangoulis C., et al. (2017). Saharan Dust deposition effects on the microbial food web in the Eastern Mediterranean: A study based on a mesocosm experiment. Front. Mar. Sci. 4. doi: 10.3389/fmars.2017.00117
Prospero J. M., Lamb P. J. (2003). African Droughts and dust transport to the Caribbean: Climate change implications. Science 302, 1024–1027. doi: 10.1126/science.1089915
Pulido-Villena E., Baudoux A. C., Obernosterer I., Landa M., Caparros J., Catala P., et al. (2014). Microbial food web dynamics in response to a Saharan dust event: Results from a mesocosm study in the oligotrophic Mediterranean Sea. Biogeosciences 11, 5607–5619. doi: 10.5194/bg-11-5607-2014
Pulido-Villena E., Wagener T., Guieu C. (2008). Bacterial response to dust pulses in the western Mediterranean: Implications for carbon cycling in the oligotropic ocean. Global Biogeochem. Cycles 22, 1–12. doi: 10.1029/2007GB003091
Raghukumar S. (2002). Ecology of the marine protists, the labyrinthulomycetes (Thraustochytrids and labyrinthulids). Eur. J. Protistol. 38, 127–145. doi: 10.1078/0932-4739-00832
Rahav E., Belkin N., Paytan A., Herut B. (2018). Phytoplankton and bacterial response to desert dust deposition in the coastal waters of the southeastern Mediterranean Sea: A four-year In situ survey. Atmosphere 9, 305. doi: 10.3390/atmos9080305
R Core Team (2021). R: A language and environment for statistical computing (Vienna, Austria: R Foundation for Statistical Computing).
Ridame C., Le Moal M., Guieu C., Ternon E., Biegala I. C., L’Helguen S., et al. (2011). Nutrient control of N2 fixation in the oligotrophic Mediterranean Sea and the impact of Saharan dust events. Biogeosciences 8, 2773–2783. doi: 10.5194/bg-8-2773-2011
Sambrook J., Russell D. W. (2001). Molecular cloning: A laboratory manual 3rd ed. (Cold Spring Harbor Laboratory Press).
Schvarcz C. R., Wilson S. T., Caffin M., Stancheva R., Li Q., Turk-Kubo K. A., et al. (2022). Overlooked and widespread pennate diatom-diazotroph symbioses in the sea. Nat. Commun. 13, 799. doi: 10.1038/s41467-022-28065-6
Simon M., Azam F. (1989). Protein content and protein synthesis rates of planktonic marine bacteria. Mar. Ecol. Prog. Ser. 51, 201–213. doi: 10.3354/meps051201
Smith D. C., Azam F. (1992). A simple, economical method for measuring bacterial protein synthesis rates in seawater using 3H-leucine 1. Mar. Microbial. Food Webs 6, 107–114.
Stoeck T., Bass D., Nebel M., Christen R., Jones M. D. M., Breiner H.-W., et al. (2010). Multiple marker parallel tag environmental DNA sequencing reveals a highly complex eukaryotic community in marine anoxic water. Mol. Ecol. 19, 21–31. doi: 10.1111/j.1365-294X.2009.04480.x
Suzuki R., Terada Y., Shimodaira H. (2019). Pvclust: Hierarchical clustering with p-values via multiscale bootstrap resampling. Availble at: https://CRAN.R-project.org/package=pvclust.
Sylla A., Mignot J., Capet X., Gaye A. T. (2019). Weakening of the senegalo–Mauritanian upwelling system under climate change. Clim. Dyn. 53, 4447–4473. doi: 10.1007/s00382-019-04797-y
Thompson L. R., Sanders J. G., McDonald D., Amir A., Ladau J., Locey K. J., et al. (2017). A communal catalogue reveals earth’s multiscale microbial diversity. Nature 551, 457–463. doi: 10.1038/nature24621
Torres-Padrón M. E., Gelado-Caballero M. D., Collado-Sánchez C., Siruela-Matos V. F., Cardona-Castellano P. J., Hernández-Brito J. J. (2002). Variability of dust inputs to the CANIGO zone. Deep Sea res. part II top. Stud. Oceanogr. 49, 3455–3464. doi: 10.1016/S0967-0645(02)00091-7
Tsiola A., Tsagaraki T. M., Giannakourou A., Nikolioudakis N., Yücel N., Herut B., et al. (2017). Bacterial growth and mortality after deposition of Saharan dust and mixed aerosols in the Eastern Mediterranean Sea: A mesocosm experiment. Front. Mar. Sci. 3. doi: 10.3389/fmars.2016.00281
Utermöhl H. (1958). Methods of collecting plankton for various purposes are discussed. SIL Commun. 1953-1996 9, 1–38. doi: 10.1080/05384680.1958.11904091
Vallina S. M., Follows M. J., Dutkiewicz S., Montoya J. M., Cermeno P., Loreau M. (2014). Global relationship between phytoplankton diversity and productivity in the ocean. Nat. Commun. 5, 4299. doi: 10.1038/ncomms5299
Westrich J. R., Griffin D. W., Westphal D. L., Lipp E. K. (2018). Vibrio population dynamics in mid-Atlantic surface waters during Saharan dust events. Front. Mar. Sci. 5. doi: 10.3389/fmars.2018.00012
Wickham H., Averick M., Bryan J., Chang W., McGowan L., François R., et al. (2019). Welcome to the tidyverse. JOSS 4, 1686. doi: 10.21105/joss.01686
Wu W., Guo C., Pitta P., Liu H. (2018). Response of active picoeukaryotes to the deposition of Saharan dust and European aerosols in the eastern Mediterranean Sea. Aquat. Microb. Ecol. 82, 31–42. doi: 10.3354/ame01881
Young K. D. (2006). The selective value of bacterial shape. Microbiol. Mol. Biol. Rev. 70, 660–703. doi: 10.1128/MMBR.00001-06
Keywords: dust bioassay, primary production, bacterial production, plankton community, molecular diversity, eastern North Atlantic, Mauritanian-Senegalese upwelling
Citation: Pérez-Barrancos C, Gelado-Caballero MD, Hernández-Hernández N, Baños I, Gómez-Letona M, Montero MF, Arrieta JM and Arístegui J (2022) Uneven response of microbial communities to intense dust deposition across the coastal transition zone off Mauritania. Front. Mar. Sci. 9:999729. doi: 10.3389/fmars.2022.999729
Received: 21 July 2022; Accepted: 18 October 2022;
Published: 02 November 2022.
Edited by:
Linn Hoffmann, University of Otago, New ZealandReviewed by:
Teruya Maki, Kindai University, JapanJulie Dinasquet, University of California, San Diego, United States
Copyright © 2022 Pérez-Barrancos, Gelado-Caballero, Hernández-Hernández, Baños, Gómez-Letona, Montero, Arrieta and Arístegui. This is an open-access article distributed under the terms of the Creative Commons Attribution License (CC BY). The use, distribution or reproduction in other forums is permitted, provided the original author(s) and the copyright owner(s) are credited and that the original publication in this journal is cited, in accordance with accepted academic practice. No use, distribution or reproduction is permitted which does not comply with these terms.
*Correspondence: Clàudia Pérez-Barrancos, Y2xhdWRpYS5wZXJlekBpZW8uY3NpYy5lcw==; Javier Arístegui, amF2aWVyLmFyaXN0ZWd1aUB1bHBnYy5lcw==