 Yu Guo1
 Liying Peng
 Guicheng Zhang
 Jun Sun
- 1Research Centre for Indian Ocean Ecosystem, Tianjin University of Science and Technology, Tianjin, China
- 2Institute for Advanced Marine Research, China University of Geosciences, Guangzhou, China
- 3State Key Laboratory of Biogeology and Environmental Geology, China University of Geosciences (Wuhan), Wuhan, China
Dimethyl sulfide (DMS) is one of the most important volatile biogenic sulfur compounds and plays a significant role in global climate change. Studying the seasonal variations and the environmental factors that affect the concentration of DMS would aid in understanding the biogeochemical cycle of sulfur compounds. Using benzene-assisted photoionization positive ion mobility spectrometry (BAPI-PIMS), the seasonal distribution and the key impact factors of DMS and dimethylsulfoniopropionate (DMSP) in the Bohai Sea and North Yellow Sea were investigated in the summer and autumn of 2019. The concentrations of DMS and its precursors, DMSPp and DMSPd, in the surface seawater were 0.11–23.90, 0.67–41.38, and 0.03–12.28 nmol/L, respectively, in summer, and 0.10–20.79, 0.39–13.51, and 0.18–20.58 nmol/L, respectively, in autumn. The air-to-sea exchange flux of DMS was 43.05 ± 44.52 and 34.06 ± 63.38 μmol/(m·d), respectively, in summer and autumn. The results demonstrated that the temperature was the most dominant environmental factor, and the abundance of dinoflagellates was the most dominant biological factor that affected the distribution of DMS and DMSP in summer. The abundance of diatoms was the most dominant biological factor, and the levels of PO43-, NO2-, NO3-, and SiO32- were the dominant environmental factors that affected the distribution of DMS and DMSP in autumn. These results of this study would be of great significance in understanding the biochemical cycle of DMS in BS and NYS.
1 Introduction
Dimethyl sulfide (DMS) is one of the most important volatile biogenic sulfur compounds in seawater and plays a crucial role in the formation of marine aerosols (Lomans et al., 2002; Yang et al., 2015b). DMS is rapidly oxidized to sulfur dioxide, methanesulfonic acid, and non-sea salt sulfate aerosols in the atmosphere. These sulfurous oxides participate in the formation of cloud condensation nuclei (CCN), which enhances the reflection coefficient of clouds and decrease solar radiation reaching the surface of the earth (Charlson et al., 1987). However, the theory regarding the role of DMS remains controversial. Quinn and Bates (2011) indicated that non-DMS organic compounds, sea salt, and CO2 are also the sources of marine aerosols, and observed that there was no correlation between the concentration of DMS and CCN. Using the Community Earth System Model (CESM) for investigating phytoplankton-DMS-climate feedback relationships, the study by Wang et al. (2018a) indicated a weak positive phytoplankton-DMS-climate feedback at the global scale. DMS can be eliminated by photochemical reactions, microbial oxidation, air-to-sea exchange, etc. (Liu et al., 2015). Therefore, investigating the distribution and variations in the concentration of DMS and its regulatory factors would improve the understanding of the interactions between biogeochemical cycles of sulfides from marine sources and global climate change.
DMSP is the precursor of DMS, and exists in two forms, namely DMSPp and DMSPd. DMSP can be modulated by the DSYB gene, which controls the ammonia transformation pathway in phytoplankton (Curson et al., 2018). DMSP has important physiological functions in phytoplankton, including the regulation of osmotic pressure, antioxidant effects, and reduction of ultraviolet (UV) damage (Darroch et al., 2015; Yang et al., 2015a). DMSP can be degraded via two main pathways. In the first pathway, DMSP is demethylated by bacteria and phytoplankton, which do not produce DMS; however, DMS is produced to cleave DMSP by DMSP-lyase (Zhang et al., 2014; Zhang et al., 2019). The yield of DMSP depends on the species of phytoplankton. Generally, Chrysophyceae and dinoflagellates produce higher quantities of DMSP in comparison to diatoms (Jarníková et al., 2018). The release of DMSPd depends on zooplankton feed, cell senescence, and viral attacks (Wu et al., 2018). Kiene and Linn (2000) thought that DMSP is also used for bacterial protein synthesis. Hence, DMS and DMSP are vital bond between marine phytoplankton and atmospheric sulfur circulation.
The yield of DMS is higher in the continental shelf area than in the open ocean (Michaud et al., 2007). The Bohai Sea (BS) and North Yellow Sea (NYS) are marginal seas in the northwest Pacific Ocean, which are affected by fresh water inputs and anthropogenic activities, which introduce a wealth of nutrients and pollutants (Yang et al., 2014). Moreover, the region exists a lot of water masses including the Yellow Sea Cold Water Mass (YSCWM) and the Yellow Sea Warm Current (YSWC), among others (Fu et al., 2021). These complex environmental factors are responsible for variations in the distribution of DMS in this region. Presently, there are numerous studies on DMS in the nearshore waters of this ocean (Omori et al., 2017; Smith et al., 2018; Webb et al., 2019). For instance, ; Yang et al. (2014; 2015b) used a gas chromatograph equipped with a flame photometric detector (GC-FPD) for studying the distribution of DMS and DMSP and determining the main factors that influence their production in BS and Yellow Sea at different times of the year. The results indicated that the concentrations of DMS and DMSPp are obviously correlated with the levels of chlorophyll a (Chl-a), and especially nanophytoplankton (5–20 um) biomass (Yang et al., 2014; Yang et al., 2015b). However, studies by Zhai et al. (2018) and Bepari et al. (2020) demonstrated that there is no distinct correlation between the concentration of DMS, DMSPt and levels of Chl-a in the South China Sea and the west coast of India, respectively. Using the same method, Jian et al. (2019) surveyed the concentration and distribution of DMS, DMSPt in the Changjiang River Estuary and the coastal East China Sea, and demonstrated that an increase in the proportion of dinoflagellates was accompanied by an increase in the concentration of DMSP. Speeckaert et al. (2019) demonstrated that Skeletonema costatum, Phaeocystis globosa, and Heterocapsa triquetra can produce DMSP under laboratory conditions, and revealed that the production of DMSP increases with changing salinity. Although the concentration and distribution of DMS have been investigated in numerous seas, the main factors, in particular, the biological factors, which influence the generation and distribution of DMS need to be explored in further detail in the BS and NYS.
To date, various methods, including gas chromatography (GC), mass spectrometry (MS), chemiluminescence, and other approaches have been employed for detecting DMS and its precursor, DMSP (Nagahata et al., 2013; Omori et al., 2017; Jian et al., 2019). In our previous study, a portable benzene-assisted photoionization positive ion mobility spectrometry (BAPI-PIMS) system was developed for the rapid detection of DMS and DMSP in marine waters (Peng et al., 2020). In this study, we used the BAPI-PIMS platform to determine the content of DMS and its precursor, and subsequently investigated the seasonal variations in their distribution and interactions with the environmental and biological factors in BS and NYS. The results will be of great significance in elucidating the seasonal succession of DMS and determining the factors that are responsible for altering its distribution in BS and NYS.
2 Materials and methods
2.1 Sampling
BS is a semi-enclosed marginal sea in the northwest Pacific Ocean, and is surrounded by the Shandong Peninsula, Liaodong Peninsula, Hebei Province, and the city of Tianjin (Yang et al., 2015a). The samples of seawater containing DMS were collected aboard the “Bei Dou” research vessel from July to August (summer) and in October (autumn) in 2019. The locations of the sampling stations are depicted in Figure 1. A total of 28 sampling stations were selected for sample collection in summer and autumn. The information pertaining to temperature and salinity was obtained from a Seabird CTD sensor. The samples of surface water were collected in 5-L Niskin bottles mounted on the CTD sensor.
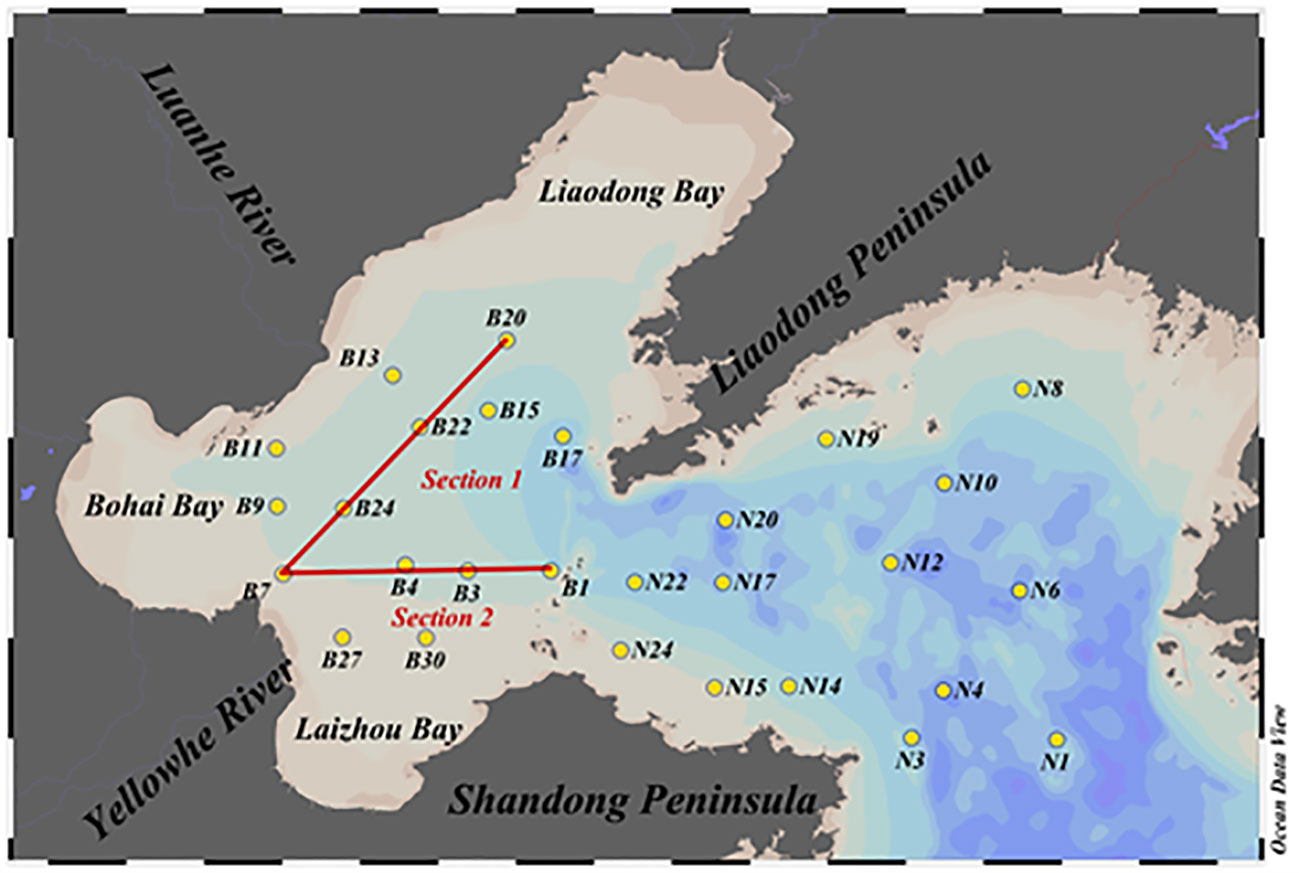
Figure 1 Location of the sampling stations in BS and NYS in summer and autumn.
All the samples were gathered using silicone tubes with pre-treated H2SO4, such that one side was attached to the CTD and the other side was inserted into the bottom of a 40-ml brown bottle. When the seawater had flown into half of the volume of the bottle, the silicone tube was slowly removed and the bottle was wrapped and sealed with a tight parafilm film. The seawater samples for DMSPd and DMSPp were obtained through gravity filtration (Zhai et al., 2018). First, 50 ml of seawater was filtered by gravitational pressure through the pores of Whatman GF/F glass microfiber filters with pore diameters of 0.7 μm. The filtered liquid was then collected in 25 ml centrifuge tubes containing 100 μl of 50% H2SO4 (Zhai et al., 2018). All the samples were stored in the dark at 4°C. In order to determine the levels of Chl-a and nutrients, 150 ml of seawater was filtered through Whatman GF/F glass microfiber filters with a diameter of 25 mm, and frozen at -20°C until analysis (Guo et al., 2016). All the samples were tested immediately following their transportation to the laboratory.
2.2 Analytical procedures
The contents of DMS and DMSP in the samples of seawater were detected by BAPI-PIMS (Peng et al., 2020). Briefly, 5 ml of sample was unidirectionally injected into the glass bubbling chamber by a syringe and stripped with purified gas flown at a rate of 100 ml/min for transforming DMS to the gas phase. The DMS gas was then transported to the separating column and introduced into the BAPI-PIMS system. The drift time and ion peak intensity of DMS in the spectrum were used for qualitative and quantitative analysis, respectively. Following sample detection, the bubble chamber was washed before testing the next sample. The detection limit was 0.081 nmol/L. The samples of seawater containing DMSPp and DMSPd were treated with 400 μl of 10 mol/L KOH solution and stored in the dark at 4°C for 24 h (Yang et al., 2016). Following the complete transformation of DMSP into DMS, the concentrations of DMSPp and DMSPd were indirectly determined by analyzing the concentration of DMS, and their difference was measured as the content of DMSPp. Chl-a was extracted in the dark with 90% acetone for 24 h at -20 °C, and the content of Chl-a was measured with a Turner-Designs TrilogyTM laboratory fluorometer (Welschmeyer, 1994). The contents of nutrients, including nitrates, nitrites, ammonium ions, phosphates, and silicates, were analyzed using a nutrient autoanalyzer (Fu et al., 2021).
2.3 Calculation of air-to-sea flux
The air-to-sea exchange flux of DMS was estimated using the stagnant film model and relevant empirical formula, provided hereafter (Liss and Merlivat 1986; Nightingale et al., 2000).
Where F and k represent the air-to-sea flux and rate constant of the air-to-sea transfer of DMS, respectively; and cg represent the concentrations of trace gases in the surface seawater and marine atmosphere, respectively. The was ignored as the concentration of DMS was higher in the seawater than in the atmosphere. H represents Henry’s constant, U represents the wind speed, is the Schmidt constant, and t represents the temperature of seawater.
2.4 Statistical analyses
All the statistical analyses were performed using SPSS, version 20.0 (SPSS Institute Inc., IBM, Armonk, NY). The data pertaining to the concentrations of DMSP and DMS were obtained from the laboratory tests.
3 Results
3.1 Environmental factors
The temperature and salinity showed obvious variations during the changing seasons. In summer, BS had high temperature and low salinity, while the NYS had low temperature and high salinity. In autumn, the low salinity appeared in the same place those in summer and low temperature and high salinity area appeared in the NYS (Fu et al., 2021). Owing to admixture with the diluted waters from the Yellow River, the salinity was significantly lower in regions outside the Yellow River Estuary (Gu et al., 2022).
The different types and ratios of nutrients have an obvious effect on the structure of the phytoplankton communities, which in turn influence the production of DMS and DMSP (Yang et al., 2015b). The concentrations of dissolved inorganic nitrogen (DIN), dissolved inorganic phosphate (DIP), and silicate were 1.14–5.76, 0.02–0.25, and 0.78–9.25 μmol/L, respectively, in summer, and 1.36–13.32, 0.07–0.52, and 1.28–7.01 μmol/L, respectively, in autumn (Fu et al., 2021). The concentrations of nutrients were high in BS, in both summer and autumn. The coastal current and pollution due to anthropogenic activities increases the abundance of nutrients in the sea. This can result in the eutrophication of water, which can alter the abundance of phytoplankton species, and thereby affect the distribution of DMS and DMSP (Yang et al., 2014). The DIN/DIP ratios ranged from 9.12 to 233.83 in summer with an average of 57.33 ± 53.23, and ranged from 6.82 to 56.89 in autumn with an average of 18.97 ± 13.04. The DIN/DIP ratios were high in the Yellow River Estuary and the east coast of the Shandong peninsula in summer. In autumn, the DIN/DIP ratios were high in the Yellow River Estuary and BS Strait. The DIN/DIP ratios were lower in the north of the BS and the central NYS.
3.2 Horizontal and vertical distribution of DMS
3.2.1 Horizontal distribution
As depicted in Figure 2 and Table 1, the concentrations of DMS in the surface water of BS and NYS ranged from 0.05 to 23.90 nmol/L in summer, with an average of 7.78 nmol/L. However, the concentrations of DMS at stations B15 (0.054 nmol/L), B17 (0.072 nmol/L), N6 (0.054 nmol/L), and N19 (0.055 nmol/L) were lower than the detection limit in summer (Peng et al., 2020). The distribution of DMS decreased from the west to the east. We found that the average concentration of DMS detected in this study in summer was slightly higher than that reported by Yan et al., Yang et al., Zhai et al., and Jian et al. (Yang et al., 2015b; Yan et al., 2018; Zhai et al., 2018; Jian et al., 2019). The difference might be attributed to the different sampling regions and the physiological and metabolic processes of the organisms during transportation from the research vessel to the laboratory, which took approximately 2 weeks. In autumn, the concentrations of DMS in the surface water of BS and NYS ranged from 0.10 to 20.79 nmol/L, with an average of 4.24 nmol/L. The distribution of DMS increased from the west to the east. The average concentration of DMS detected in this study was nearly similar to that reported by Yang et al. (2014) (3.92 nmol/L). As our study was conducted in October, the average concentration of DMS in autumn was higher than that reported by Yang et al. (2015a) (2.15 nmol/L) and Liu et al. (2015) (1.48 nmol/L). The concentration of DMS was high in the eastern region of the NYS, with the highest concentration being at N6.
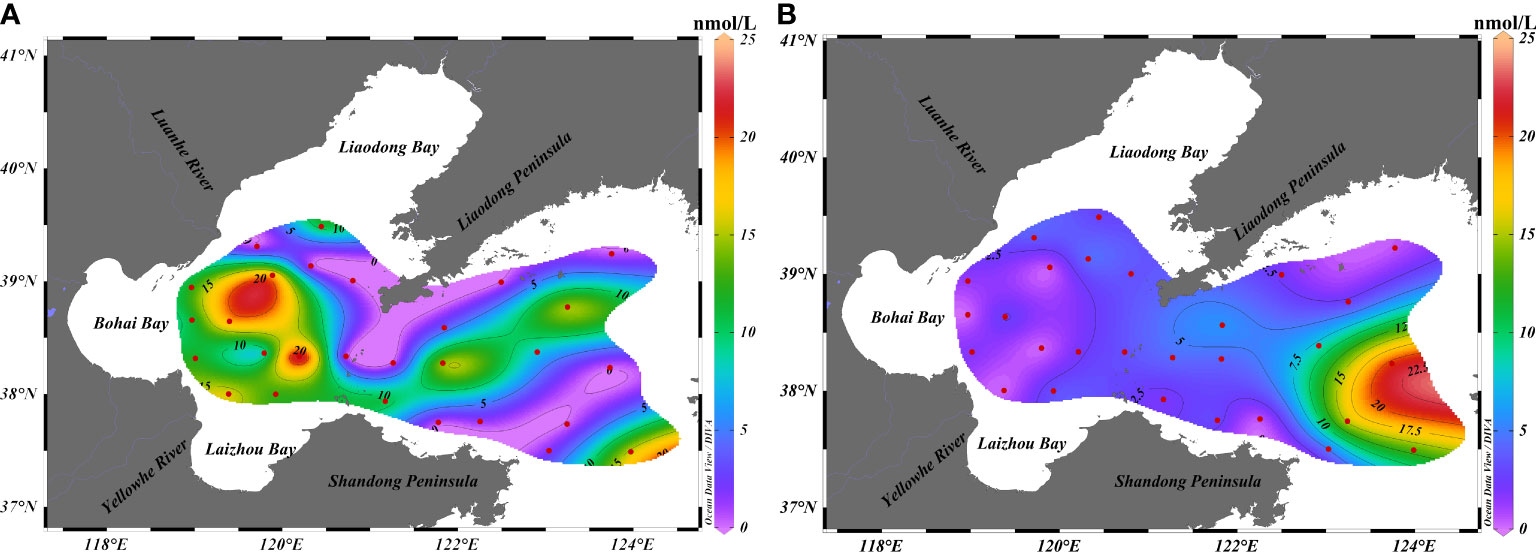
Figure 2 Horizontal distribution of DMS in the surface waters of BS and NYS in summer and autumn. Horizontal distribution of DMS in (A) summer and (B) autumn.
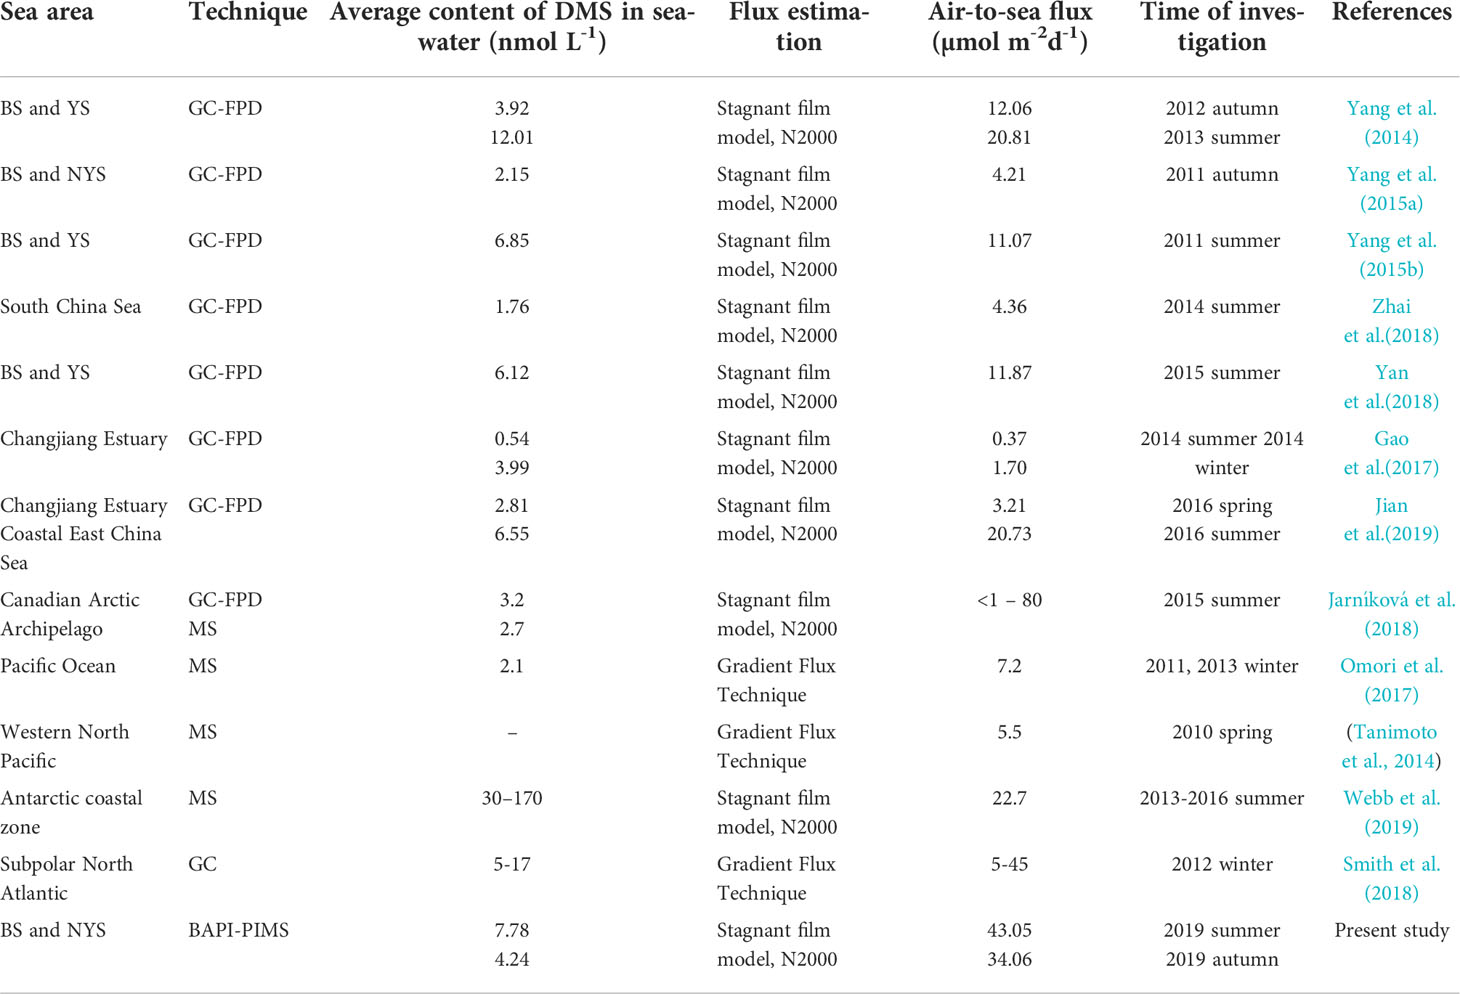
Table 1 Air-to-sea flux of DMS and corresponding models reported in recent studies.
3.2.2 Vertical distribution
Section 1 extended from the Yellow River Estuary to the Liaodong Bay, while section 2 stretched from the Yellow River Estuary area to the Bohai Strait. As depicted in Figure 3, the concentration of DMS was high in the surface seawater at section 1, and gradually decreased with depth in summer, especially in the central region. The concentration of DMS was extremely low in the central-southern region of BS (38° N–39°N) where the water was deeper than 15 m; however, the concentration of DMS slightly increased near the bottom in the northern region of section 1. In section 2, the concentration of DMS in the surface seawater was highest near 120.2°E and the vertical distribution and concentration of DMS gradually decreased with depth. However, the vertical distribution showed an opposite trend at the mouth of the Yellow River and the Bohai Strait.
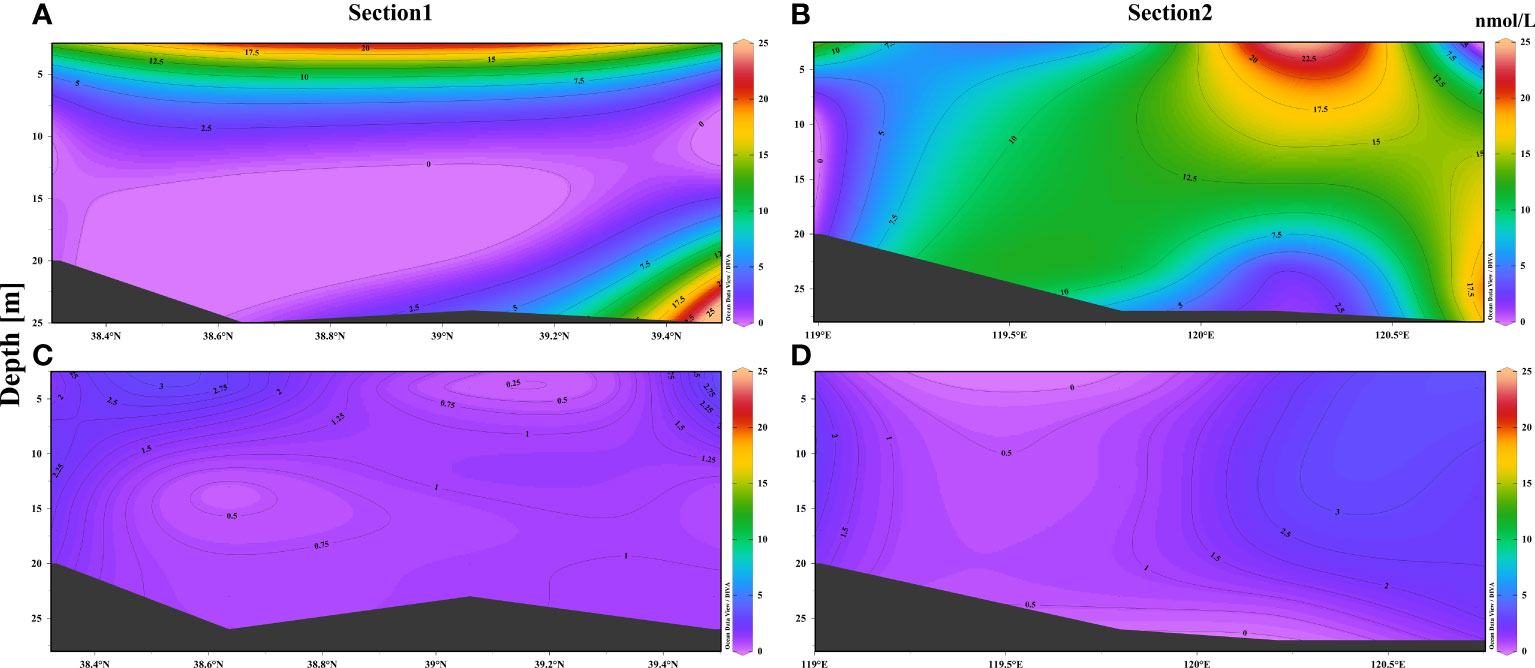
Figure 3 Vertical distribution of DMS in the waters of BS (sections 1 and 2) in summer and autumn. Vertical distribution of DMS in (A) and (B) summer, and (C) and (D) autumn.
The concentration of DMS in the seawater at sections 1 and 2 showed regional variations to a certain extent in autumn. For instance, the concentration of DMS was high at both ends of the water column at section 1and then decreased with depth. However, the concentration of DMS in the water column in the central region exhibited an opposite trend at different depths. The concentration of DMS was high at both ends of the water column of section 2, and decreased slightly with depth, while the concentration of DMS was low in the water columns in the central and western regions (119° E–120°E).
There was a relatively strong seawater density thermocline in the area of section 1 with water depth ≥15 m. This effectively prevented the penetration of dissolved oxygen from the surface waters to the bottom layers, resulting in the formation of an area of low oxygen (Zhao et al., 2017; Wei et al., 2019). The low concentration of DMS in this region could, therefore, be attributed to the hypoxic environment, as sufficient oxygen is necessary for the production of phytoplankton and the generation of DMS via the decomposition of DMSP by heterotrophic microorganisms in the bottom layers (Zubkov et al., 2001; Wu et al., 2018). Wu et al. (2018) observed a correlation between the concentration of DMS and O2 in their study on the Yangtze River Estuary, which also verified the above speculation to a certain extent. Additionally, the concentration of DMS was low in the surface waters at the mouth of the Yellow River in section 2, which might be attributed to the dilution with freshwater (Yang et al., 2015b). The concentration of DMS was high in the bottom layers of the Bohai Strait owing to the increase in the total abundance of phytoplankton in the bottom (Fu et al., 2021). The relatively low-light intensity and biomass in autumn reduced the content of DMS in the surface waters at sections 1 and 2, compared to that in summer. However, as the dissolved oxygen content in section 1 was gradually increasing in the region with depth ≥ 15 m, the concentration of DMS was slightly higher in this region in autumn than in summer.
3.3 Horizontal and vertical distribution of DMSP
3.3.1 Horizontal distribution
The concentrations of DMSPp and DMSPd were 0.67–41.38 and 0.03–12.28 nmol/L, respectively, in summer, with an average of 10.97 ± 11.21 nmol/L and 3.31 ± 3.21 nmol/L, respectively. The concentration of DMSPp detected in this study was different from those reported by Yan et al. (2018) and Yang et al. (2014), which could be attributed to the slight changes in the phytoplankton communities during the different study periods. As depicted in Figure 4, the distribution of DMSPp decreased from the west to the east, and the concentration of DMSPp was highest at the central region of BS and the Bohai Strait, which was related to the entry of pollutants and exchange of sea water between the BS and the Yellow Sea. Additionally, Deng and Zhao (2020) research thought that tidal mixing caused the temperature and salinity changes in the Bohai Strait, and the southern part of the Liaodong Peninsula, which increased the production of DMSP by phytoplankton for counteracting the changes in osmotic pressure. The change in the concentration of DMSPd was more obvious compared to that of DMSPp. The concentration of DMSPd reached a maximum of 12.28 nmol/L at station B3. The distribution of DMSPd was nearly similar to that of DMSPp, which was more highly concentrated in the central region of BS and decreased from the west to the east.
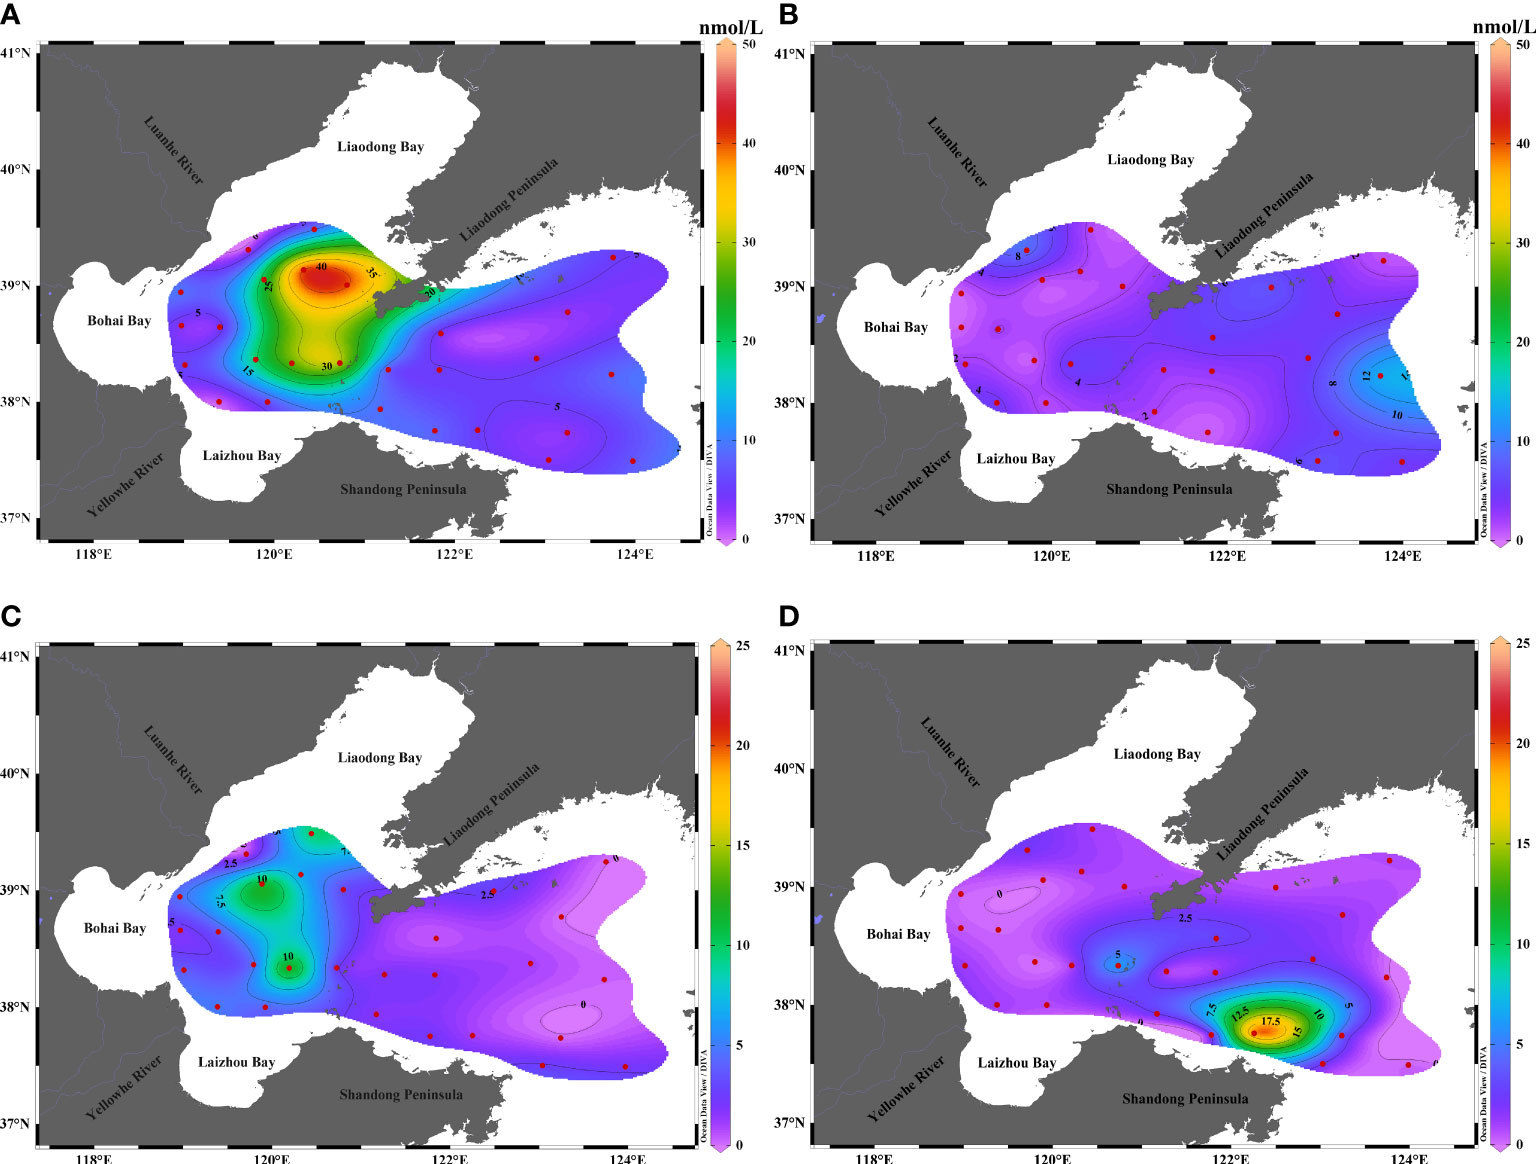
Figure 4 Horizontal distribution of DMSPp and DMSPd in the surface waters of BS and NYS in summer and autumn. Distribution of DMSPp in (A) summer and (B) autumn. Distribution of DMSPd in (C) summer and (D) autumn.
The concentration of DMSPp and DMSPd oscillated from 0.39 to 13.51 nmol/L and 0.18 to 20.58 nmol/L, respectively, in autumn, with an average of 3.61 ± 3.02 and 2.04 ± 3.80 nmol/L, respectively. The concentration of DMSPp was high in the eastern region of the NYS, and highest at station N6. The distribution of DMSPp increased from BS to the NYS. The concentration of DMSPd was highest in the north coast of Shandong Peninsula, which could be attributed to the high abundance of bacterial communities in the northern sea area of Shandong Peninsula. This indicated that bacteria can rupture the cells of phytoplankton to produce DMSPd (Yang et al., 2015a).
3.3.2 Vertical distribution
The concentrations of DMSPp and DMSPd in section 1 roughly decreased with the increase in water depth in summer. As depicted in Figure 5, there was an obvious decline in the concentrations of DMSPp at station B22, which was located at the central region of BS. The reduction in the concentration of DMSPd was nearly similar to that of DMSPp, which gradually decreased from the surface to the bottom layers. The concentration of DMSPp and DMSPd at section 2 was roughly similar to that at section 1. In autumn, the concentration of DMSPp slightly increased in the bottom layers at station B20, which was located near the mouth of the Liaodong Bay. The concentration of DMSPd first increased and then decreased from the surface to the bottom at section 1. The concentration of DMSPp at station B4 was low owing to its location at the mouth of the Yellow River, while the concentrations of DMSPp at stations B1 and B3 were higher than that at section 2. The concentration of DMSPp was high at station B1 as it was located closer to the Bohai Strait and was greatly affected by the total abundance of phytoplankton. There were variations in the vertical concentration of DMSPd, which tended to decrease with increasing water depth but increased slightly at the bottom.
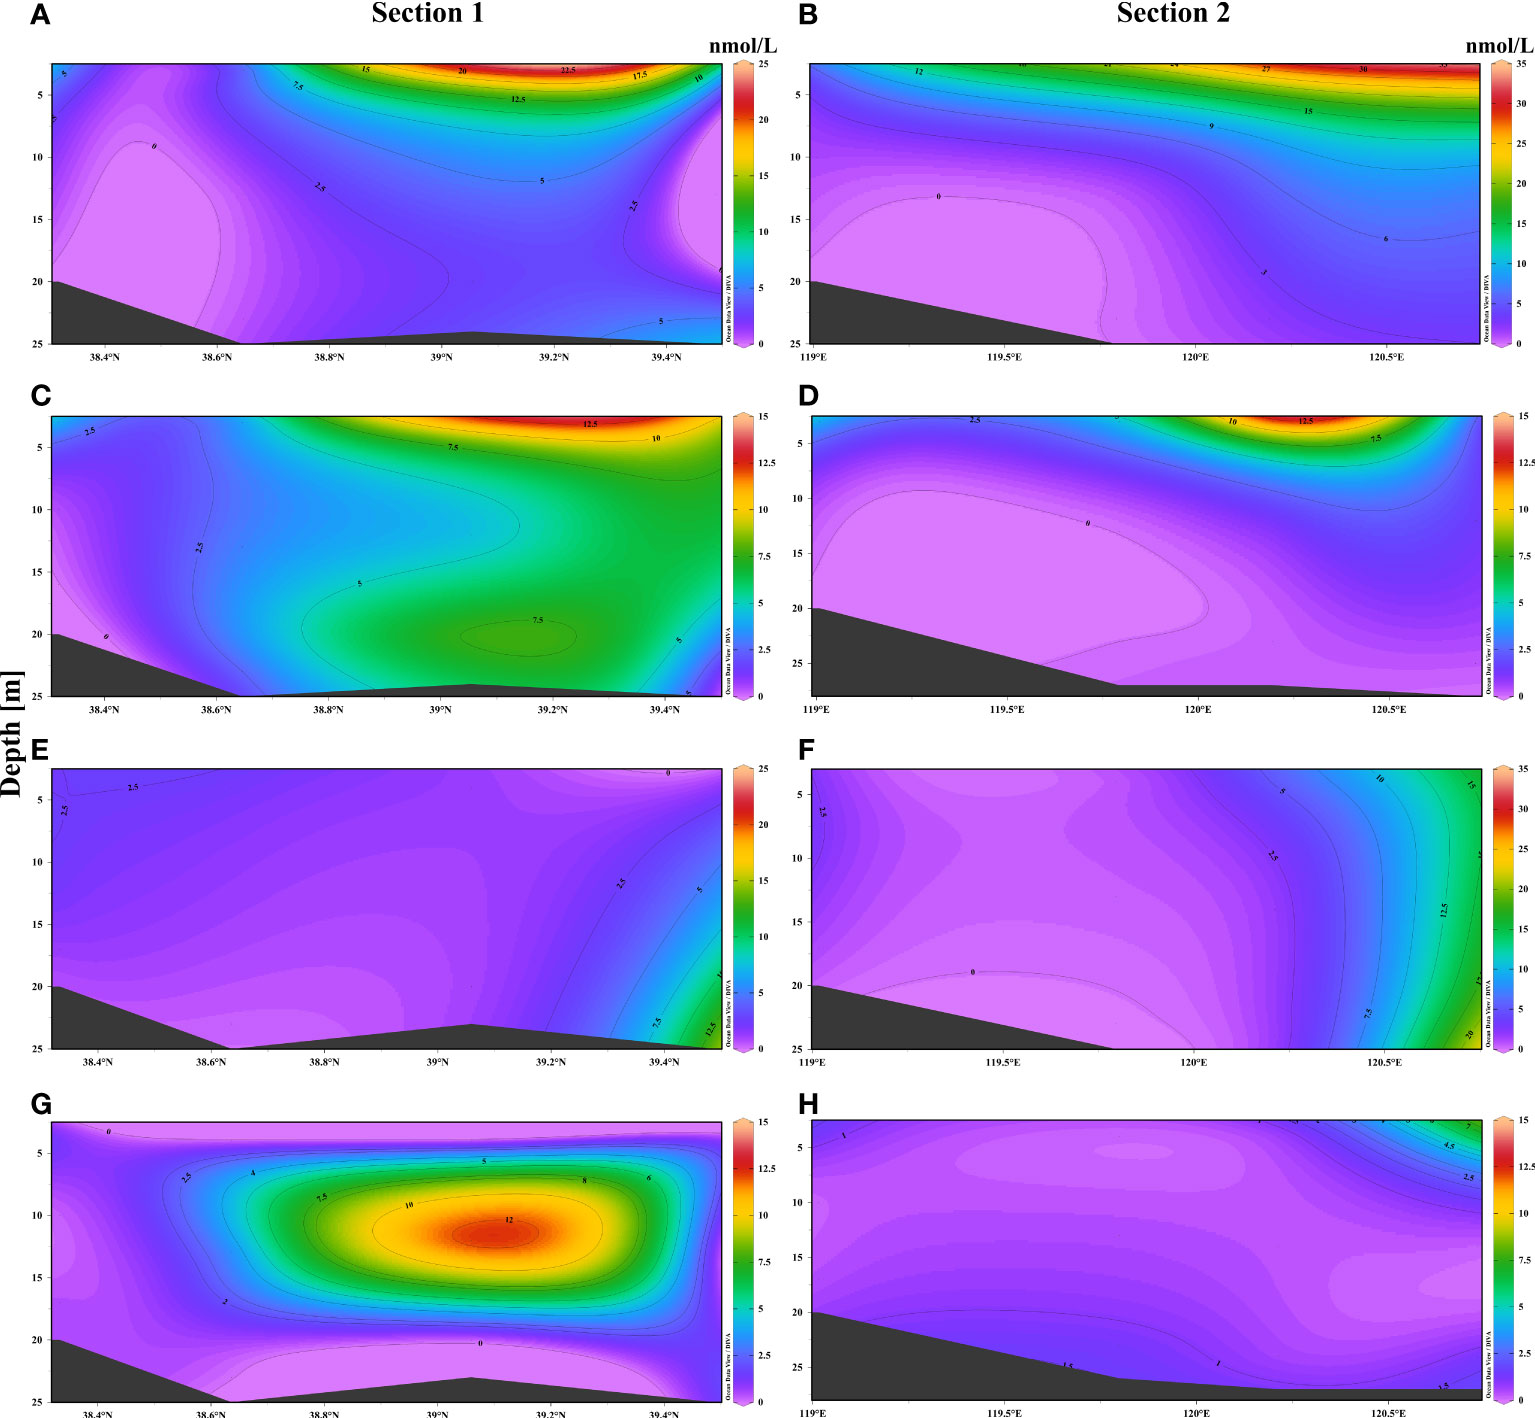
Figure 5 Vertical distribution of DMSPp and DMSPd in the waters of BS (sections 1 and 2) in summer and autumn. Distribution of DMSPp in (A) and (B) summer. Distribution of DMSPd in (C) and (D) summer. Distribution of DMSPp in (E) and (F) autumn. Distribution of DMSPd in (G) and (H) autumn.
The variations in the vertical distribution of DMSPp and DMSPd in the different seasons were attributed to the species of phytoplankton, biomass, and nutrients. The increasing water temperature and solar radiation in summer induces the rapid growth of phytoplankton under conditions of appropriate light and heat. However, phytoplankton are limited by light and temperature availability, which reduces the primary productivity in the middle and bottom layers, resulting in the lower production of DMSP in these layers than in the surface (Gao et al., 2017). Additionally, the rise in temperature alters the structure of phytoplankton communities, resulting in diatom blooms which lead to low-phosphate and high-nitrate concentrations (Fu et al., 2021). The abundance of dinoflagellates increases under such conditions, which results in the production of higher quantities of DMSP. Moreover, high-water temperature, marked vertical stratification, and the decomposition of organic matter led to severe hypoxia, which is detrimental for the growth of phytoplankton in the bottom layer (Zhai et al., 2012; Zhang et al., 2016). Fu et al. (2021) suggested that the abundance of phytoplankton gradually declines in autumn owing to the gradual fall in water temperature. Additionally, the abundance of dinoflagellates also declines during autumn despite the increase in the concentration of nutrients due to turbulence and decomposition of organic matter (Fu et al., 2021). The abundance of diatoms increased sharply during autumn, becoming the dominant species during this period, which in turn reduces the production of DMSP. Additionally, the structure of bacterial communities can undergo alterations under the influence of temperature, which can also affect the transformation of DMSPp to DMSPd (Gao et al., 2017).
3.4 Seasonal variations
As depicted in Figure 6, the concentration of DMS and the two forms of its precursor molecule gradually decreased from summer to autumn. The concentrations of DMS, DMSPp, and DMSPd in summer were 2.33, 3.04, and 1.62 folds higher, respectively, than those in autumn. The findings were consistent with the results of a previous study which reported that the concentration of DMS is high in the middle and high latitudes in summer (Zhang et al., 2019). In summer, the concentrations of DMS, DMSPp, and DMSPd were high in BS; however, their concentrations were high in the NYS in autumn. The differences might be related to the shift in the structure of the phytoplankton community from diatoms-dinoflagellates to diatoms-dinoflagellates-chrysophyceae (Fu et al., 2021). Additionally, owing to the influence of the Yellow Sea Warm Current, the temperature of the seawater in the NYS is higher than that in the other regions (Yuan et al., 2014). Therefore, the biomass of phytoplankton and biological activities are higher in the NYS, which results in the increased concentration of dissolved DMSPd in this region (Zhang et al., 2019).
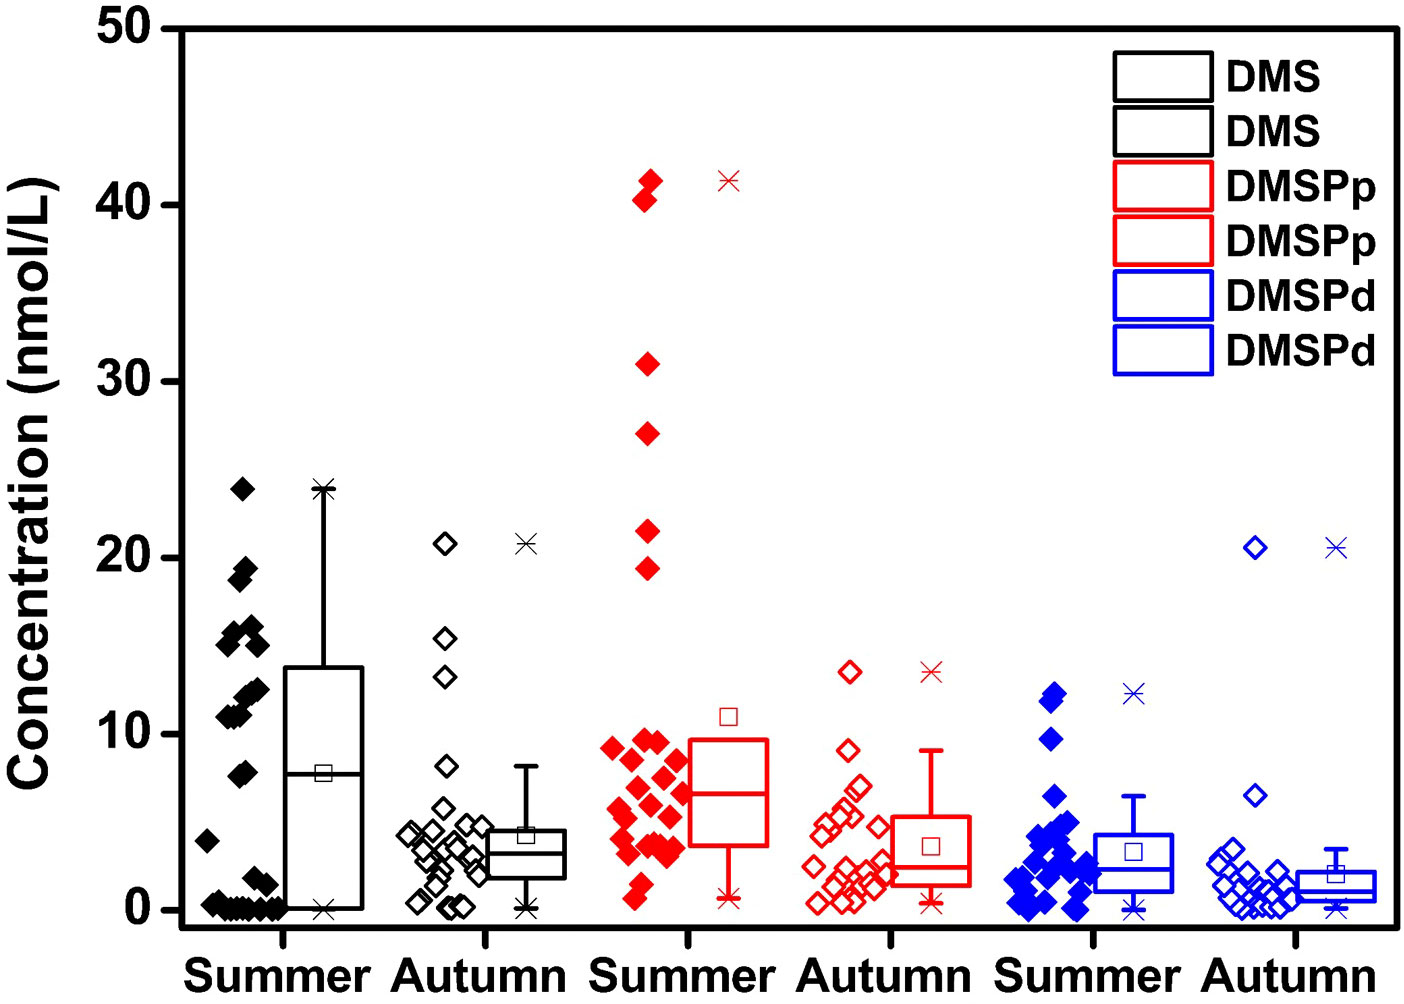
Figure 6 Seasonal characteristics of the concentrations of DMS, DMSPp, and DMSPd in the surface waters of BS and NYS in summer and autumn.
3.5 Air-to-sea fluxes
The air-to-sea fluxes ranged from 0.20 to 146.99 μmol/(m·d) in summer with an average of 43.05 ± 44.52 μmol/(m·d), and ranged from 0.23 to 284.02 μmol/(m·d) in autumn with an average of 34.06 ± 63.38 μmol/(m·d), as depicted in Figure 7. The wind speed varied from 2.41 to 7.38 m/s and 1.2 to 9.2 m/s, in summer and autumn, respectively, with an average of 4.59 ± 1.30 and 4.86 ± 2.02 m/s, respectively. High air-to-sea fluxes were primarily observed in the central region of BS in summer; however, the highest value of 146.99 μmol/(m·d) was observed at station N1, which was attributed to the higher concentration of DMS (15.74 nmol/L) and a wind speed of 5.85 m/s. The lowest air-to-sea fluxes were observed at station N6, owing to the lowest concentration of DMS (0.054 nmol/L) and lower wind speed (3.50 m/s) in this region. In autumn, high air-to-sea fluxes were observed at the east of the NYS and the highest values were observed at station N4 (284.02 μmol/(m·d)), while the lowest values were observed at station B27. The air-to-sea fluxes were 1.26 folds higher in summer than in autumn; however, the wind speed was 1.06 folds higher in autumn than in summer. Owing to the higher DMS content and wind speed, the ratio of air-to-sea fluxes was high in BS in summer, and in the NYS in autumn.
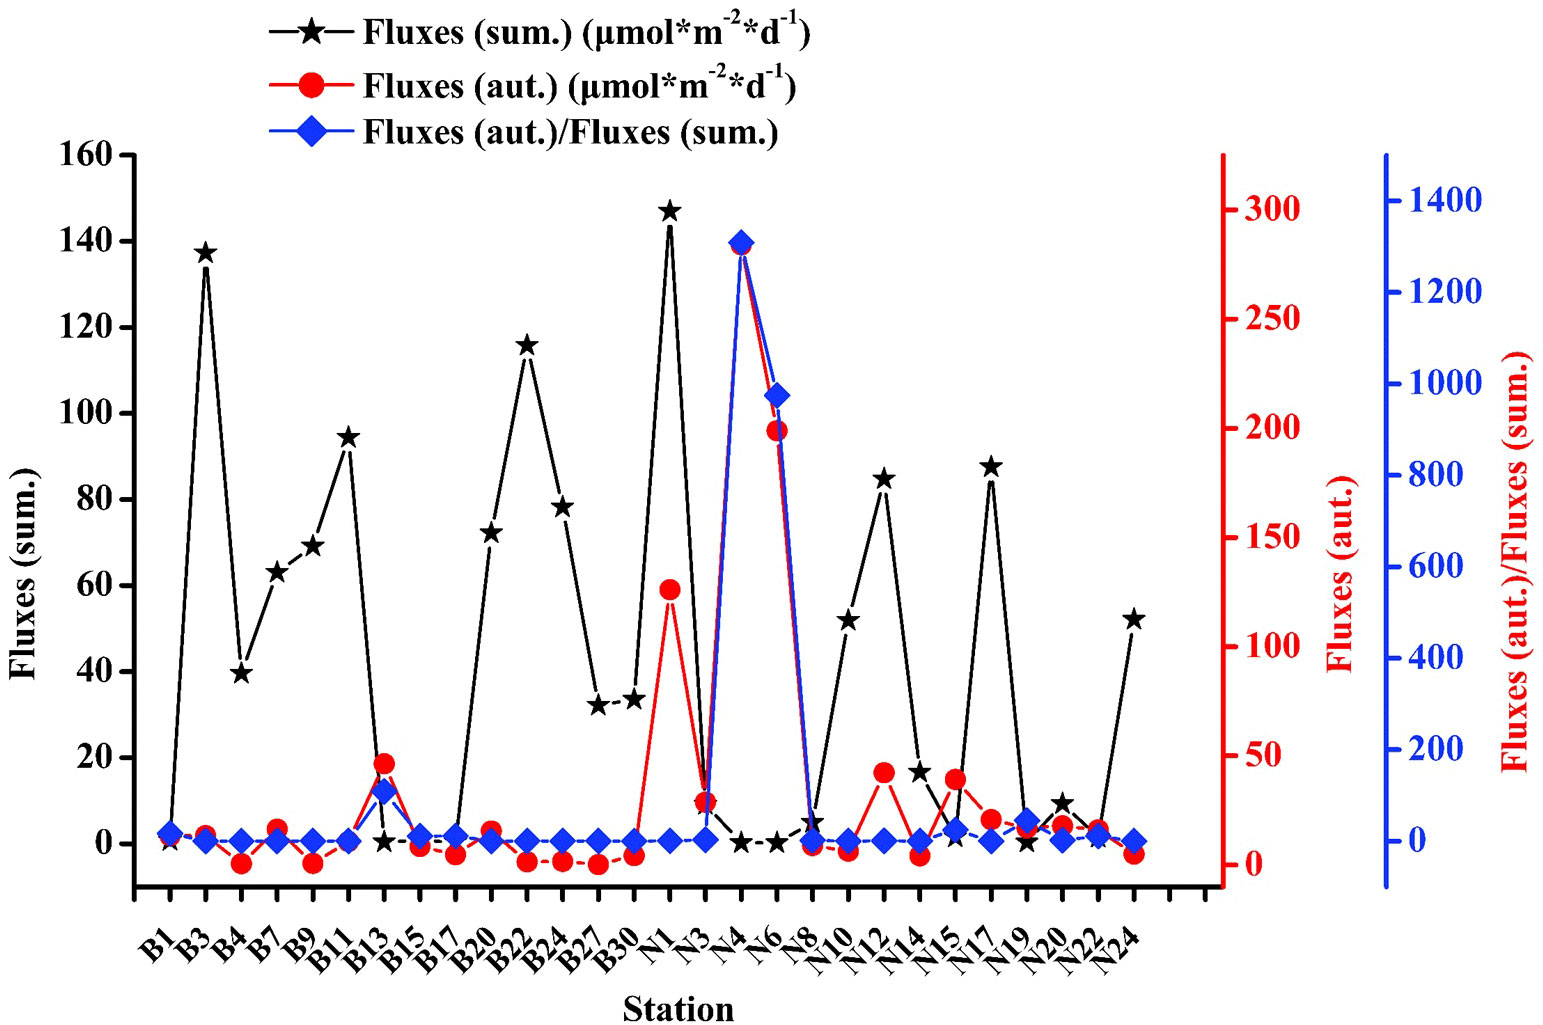
Figure 7 Air-to-sea flux curves and the ratio of DMS concentrations in BS and NYS in summer and autumn.
Based on the formulae used for calculating the air-to-sea fluxes, we observed that the air-to-sea flux was influenced by temperature, wind speed, and the concentration of DMS. The originPro2021 software was used to prepare a 3D scatter plot using these data, for analyzing the correlation between the air-to-sea flux and the concentration of DMS, temperature, and wind speed. As depicted in Figure 8, the air-to-sea flux roughly increased with increasing DMS concentration, temperature, and wind speed. The rising temperature in summer promotes the production of DMS, which increases the air-to-sea fluxes. Lower temperatures reduce the production of DMS in autumn. Owing to the higher wind speed in autumn, the maximum fluxes were observed in autumn despite the lower concentration of DMS and temperature. The solubility of DMS reduced with increasing temperature, which induced the diffusion of DMS into the atmosphere. The higher wind speed increased the velocity of gases at the sea surface and promoted the exchange of DMS into the atmosphere.
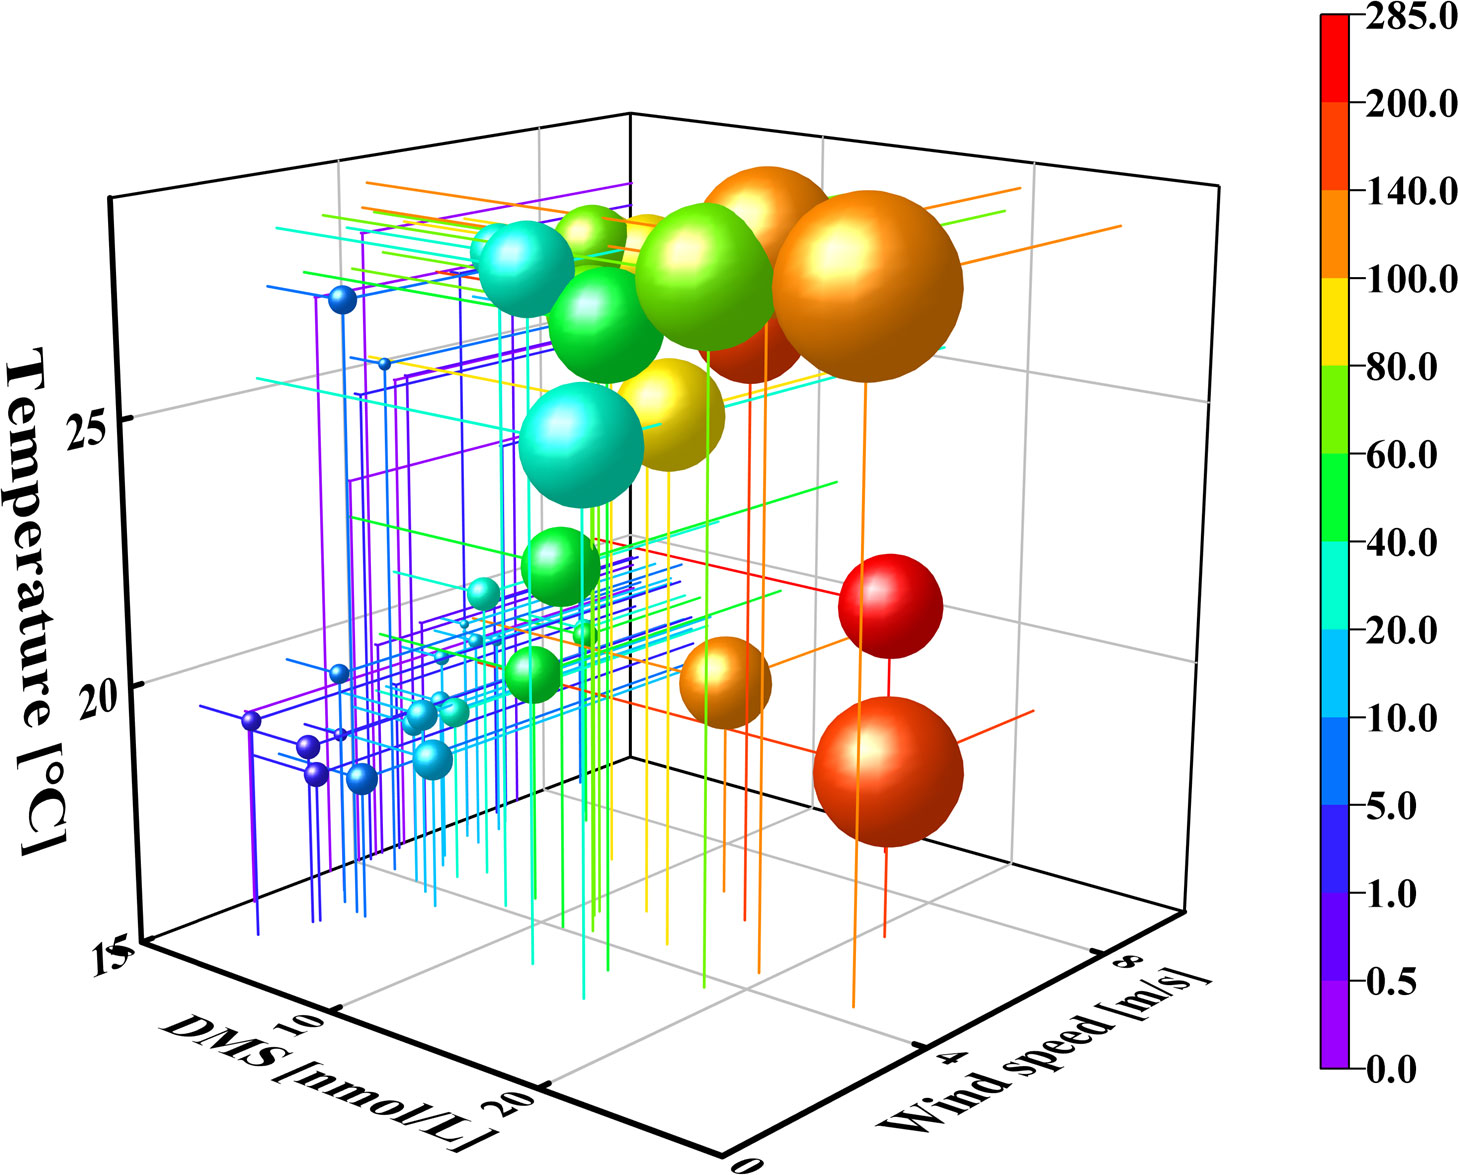
Figure 8 Space diagram of DMS concentration–wind speed (WS)–temperature (T)–air-to-sea flux in the surface waters of BS and NYS in summer and autumn. The sizes and colors of the balls represent the concentrations of DMS and air-to-sea fluxes, respectively. The color of the balls represent the flux concentrations.
4 Discussion
4.1 Environmental factors
Temperature is one of the most important environmental factors that govern the metabolism of phytoplankton and bacteria. Temperature can alter the oxidative stress of phytoplankton and accelerate the release of DMSP (Gao et al., 2017). Salinity is also an important environmental factor that regulates the growth and production of marine phytoplankton, which in turn causes seasonal variations in the concentration and distribution of DMS (Speeckaert et al., 2019). The results of correlation analyses between the concentrations of DMS and DMSP and the environmental factors in the surface waters of BS and NYS in summer and autumn are provided in Table 2. The concentration of DMS was positively correlated with the temperature in summer; however, there was no significant correlation between the concentrations of DMS, DMSPp, and DMSPd, and the temperature in autumn. The findings indicated that high temperatures in summer might affect the production and distribution of DMS by affecting the composition of marine phytoplankton communities (Boyd et al., 2013). The rising temperature promoted the growth and reproduction of dinoflagellates, which produced high quantities of DMS in our study region (Fu et al., 2021). However, the reduction in the temperature of seawater in autumn weakened its influence on the production and distribution of DMS, which were significantly reduced in autumn. As the temperature is an important factor in the metabolism of enzymes in zooplankton and bacteria, the activities of zooplankton and micro-organisms increased with an increase in the temperature of seawater. Previous studies have reported that zooplankton feed can promote the generation of DMS (Yang et al., 2015a; Zhang et al., 2019). Additionally, it has been demonstrated that phytoplankton are highly sensitive to changes in temperature (Zhai et al., 2018). Increased oxidative stress in phytoplankton accelerates the release of DMSP during increasing or decreasing temperature (Jarníková et al., 2018; Zhai et al., 2018), and phytoplankton release DMSP for resisting environmental changes. Therefore, the changes in temperature during the changing seasons could lead to significant seasonal differences in the concentration and distribution of DMS, DMSPp, and DMSPd.
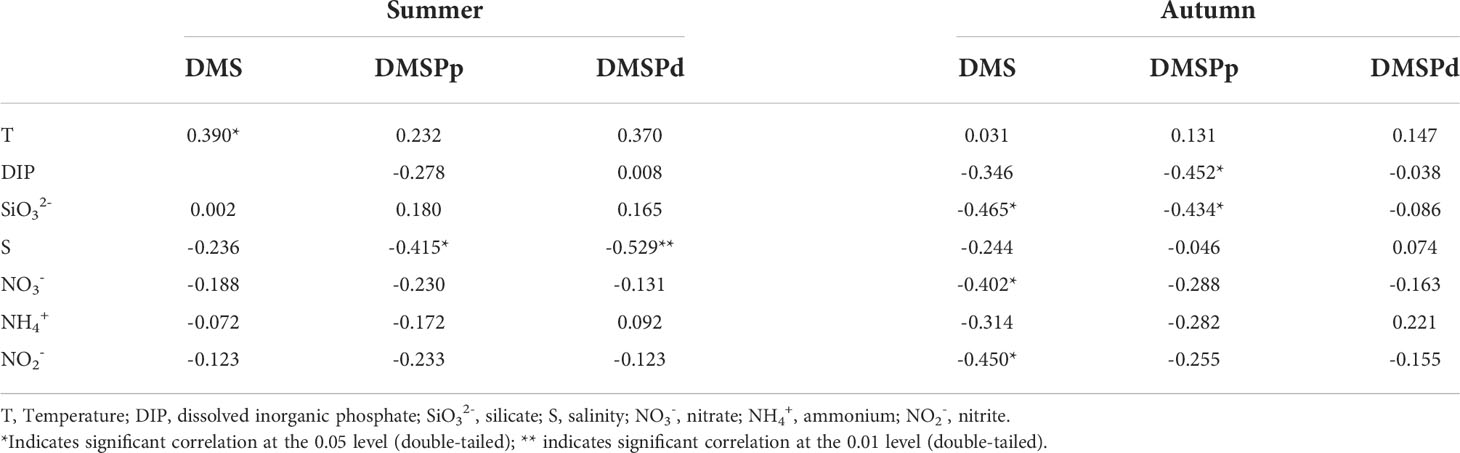
Table 2 Correlations among the concentrations of DMS and DMSP and the environment factors in the surface waters of BS and NYS in summer and autumn.
In summer, the concentration of DMSPp was significantly negative correlated with the salinity, whereas the concentration of DMSPd showed a high significant negative correlation with the salinity; however, there was no significant correlation between the concentrations of DMS, DMSPp, and DMSPd and salinity in autumn. In summer, the concentrations of DMSPp and DMSPd were high in regions with low salinity in BS and also in the high salinity regions in the NYS, which indicated that alterations in the levels of salinity might promote the production of DMSP and DMS in phytoplankton (Liu et al., 2015; Gao et al., 2017). This could be attributed to the fact that DMSP regulates the cytotoxicity, organ damage, reduction in cell volume, destruction of enzymatic activity, antioxidant activity, and changes in cellular osmotic pressure balance in the cells of phytoplankton caused by alterations in salinity (Speeckaert et al., 2019).
The results of correlation analysis in Table 2 indicate that there was no significant correlation between the concentration of DMS, DMSPp, and DMSPd and the nutrient levels in summer. The concentration of DMS was negatively correlated with the levels of SiO32-, NO3-, and NO2-, whereas the concentration of DMSPp was negatively correlated with the levels of DIP and SiO32- in autumn. The findings indicated that the distribution of nutrients in summer had little effect on the production and distribution of DMS, whereas the distribution of nutrients in autumn was an important factor in regulating the distribution of DMS. Additionally, the levels of DIP, NO3-, NO2-, and SiO32- were higher in autumn than in summer. Wei et al. (2020) and Yang et al. (2015b) opined that a high concentration of phosphorus and SiO32- promoted the growth of diatoms. Yang et al. (2011) studies demonstrated that high concentrations of DMSPp were correlated with lower concentrations of nitrogen; however, in this study, we observed that the concentration of DMS was negatively correlated with the levels of NO3- and NO2-, which could be attributed to the fact that DMS acts as an N-containing osmolyte. For instance, alterations in the concentrations and proportions of nutrients might affect the structure of phytoplankton communities. We observed that the concentration of nutrients and DMSPp was high in the Yellow River Estuary especially in the fall season; however, the concentration of DMS was low owing to dilution of freshwater. Yang et al. (2015b) studies have demonstrated that differences in the rate of uptake of nutrients by different phytoplankton, for instance, diatoms utilize DIP more easily, whereas the reverse is observed in dinoflagellates.
4.2 Effects of biological factors
An increase in the biomass of phytoplankton induces the production of higher quantities of DMS and DMSP, and the biomass plays an important role in the spatial and seasonal distribution of DMS and DMSP (Speeckaert et al., 2018; Wang et al., 2018b). As depicted in Figure 9, the concentration ranges of Chl-a in the surface water of BS and NYS in summer and autumn were 0.23–17.13 (3.47 ± 4.09) and 0.87–4.02 (1.64 ± 0.80) μg/L, respectively, and the concentration of Chl-a in summer was 2.1 folds higher than that in autumn. The concentration of Chl-a was highest in the western coastal area of BS in summer and decreased from the west to the east, whereas the concentration of Chl-a was highest near the coast of the Shandong Peninsula in autumn. Owing to the influence of Chl-a, the distribution of DMS and DMSP in the NYS differed between summer and autumn. In summer, the concentrations of DMS and DMSP were highest in the surface water owing to the high photosynthetic rate of phytoplankton, which promoted the release of DMS and DMSP in BS in summer (Yang et al., 2015b). The concentration of DMS, DMSP, and Chl-a was low in the central region of the NYS, which could be attributed to the strong Cold Water Mass that lowered the nutrient supply in the surface water and subsequently reduced the production of Chl-a and DMS (Yang et al., 2015b). However, the concentration of DMS and DMSPp was high in the central region of the NYS in autumn, which was accompanied by high concentrations of Chl-a. This could be attributed to the vertical mixing of the Cold Water Mass in the NYS, which resulted in the transport of nutrients in the bottom layers to the surface, thereby promoting the growth of phytoplankton and the generation of DMS-related substances in autumn (Yang et al., 2015a).
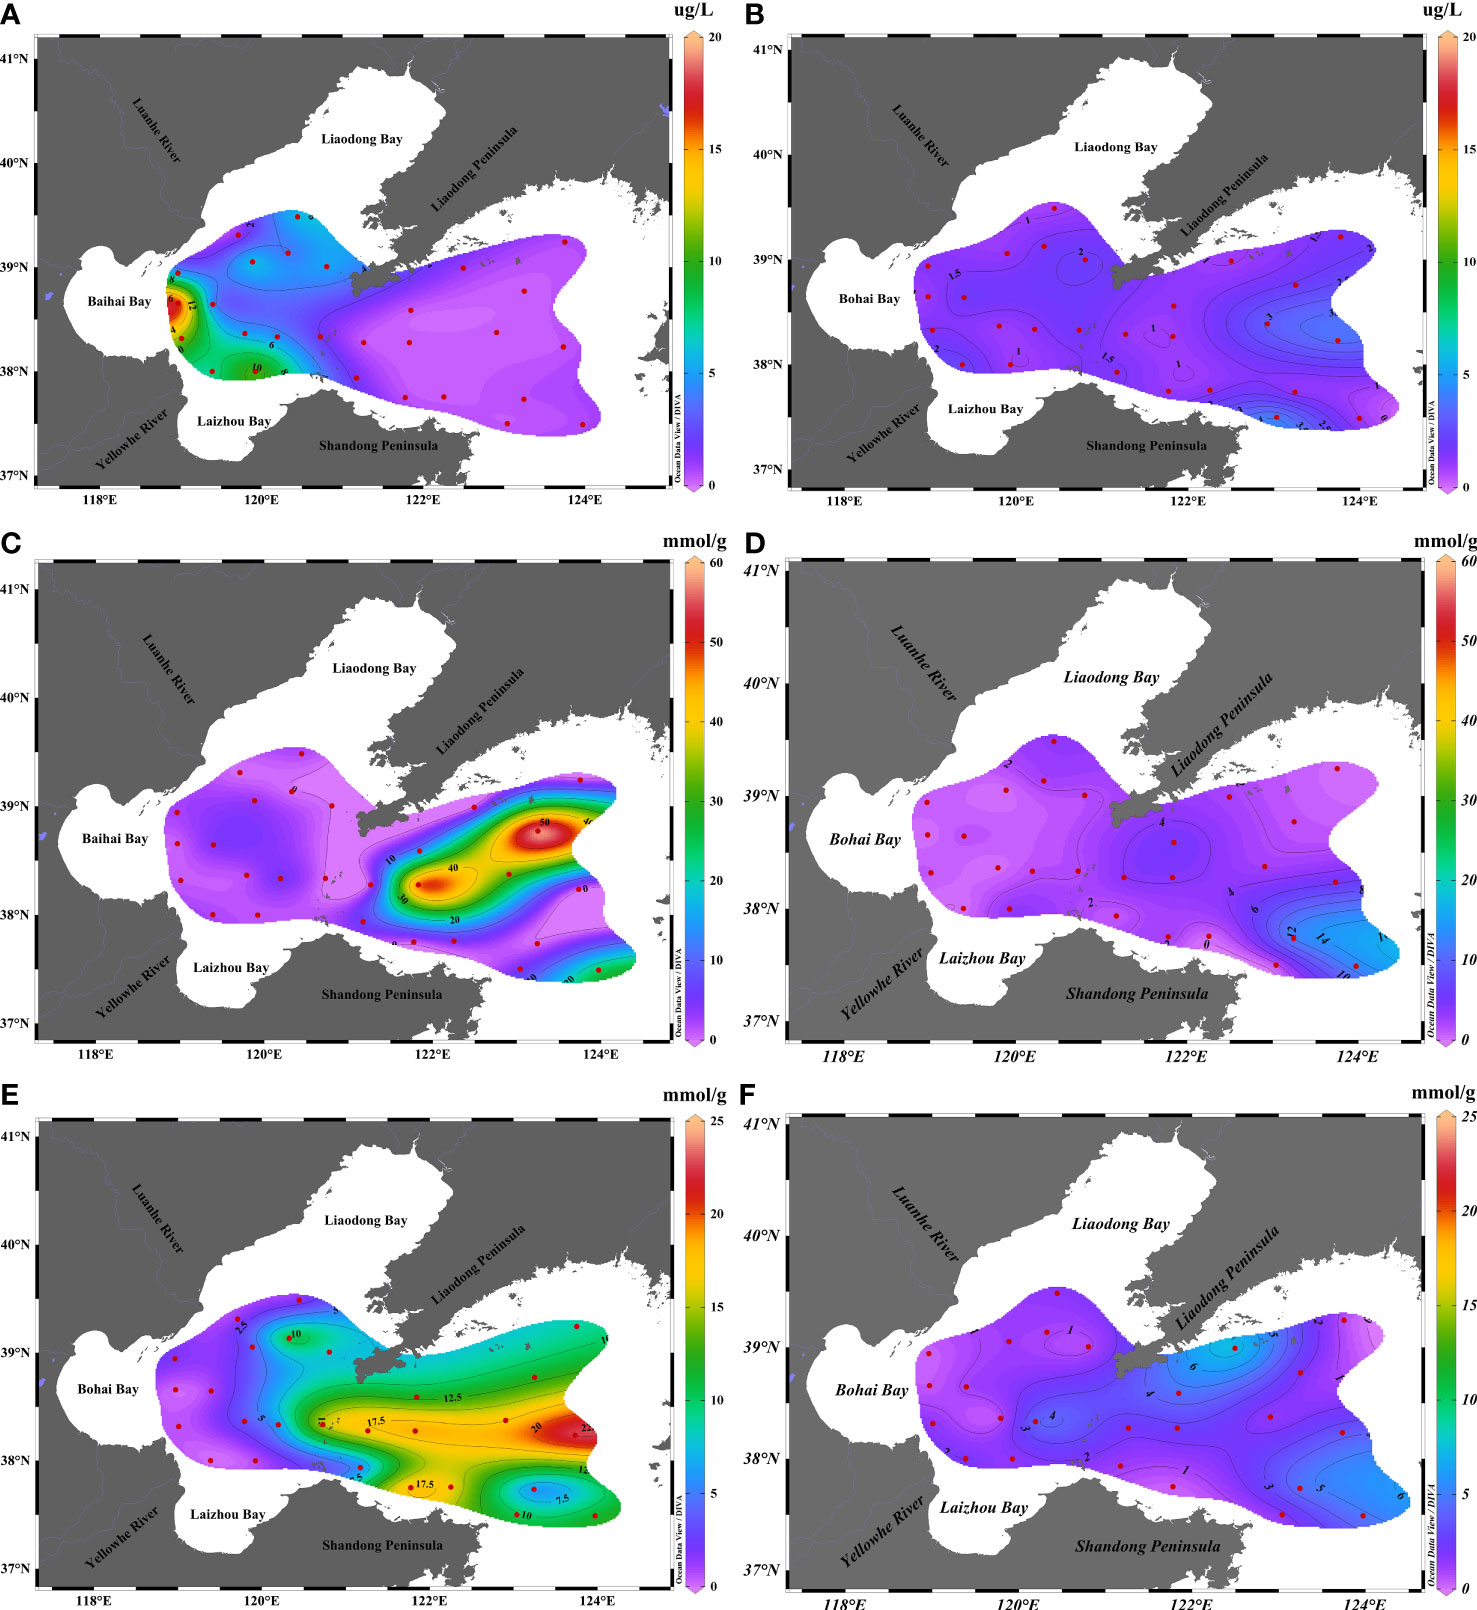
Figure 9 Concentration of Chl-a and ratios of DMS/Chl-a and DMSPp/Chl-a in the surface waters of BS and NYS in summer and autumn. Chl-a concentration in (A) summer and (B) autumn. DMS/Chl-a ratio in (C) summer and (D) autumn. DMSPp/Chl-a ratio in (E) summer and (F) autumn.
The concentration of Chl-a can be used for characterizing the biomass of phytoplankton (Yang et al., 2015a). There were obvious differences in the spatial distribution characteristics of phytoplankton community structures during seasonal changes, which were responsible for the differences in DMS production (Boyce et al., 2010; Wang et al., 2018a). In this study, the DMS/Chl-a and DMSPp/Chl-a ratios were used to evaluate the production ability of DMS by algae and determine the distribution of algae that yield high quantities of DMSP in summer and autumn (Turner et al., 1995). As depicted in Figure 9, the ratios of DMS/Chl-a and DMSPp/Chl-a in the surface water were 0.01–58.37 (7.83 ± 14.70) and 0.09–22.73 (8.53 ± 6.75) mmol/g, respectively, in summer, and 0.08–12.96 (2.79 ± 3.15) and 0.33–7.42 (2.16 ± 1.72) mmol/g, respectively, in autumn. The DMS/Chl-a and DMSPp/Chl-a ratios were 2.81 and 3.95 folds higher, respectively, in summer than in autumn. The DMS/Chl-a and DMSPp/Chl-a ratios were high in the central and southern waters of the NYS and were nearly similar to the concentrations of DMS and DMSP. This indicated that phytoplankton with high DMS productivity and high DMSP yield accounted for a high proportion of the phytoplankton population in the central and southern waters of the NYS in summer. The DMS/Chl-a and DMSPp/Chl-a ratios were high in the eastern waters of the NYS and Liaodong Peninsula in autumn. The DMSPp/Chl-a ratio was highest in the east coast of the Liaodong Peninsula, indicating that the region contains phytoplankton that yield high quantities of DMSPp (Fu et al., 2021).
The results of phytoplankton analyses demonstrated that the structure of the phytoplankton community in BS and the NYS was dominated by Chrysophyceae, dinoflagellates, and diatoms in summer, whereas diatoms were the dominant phytoplankton in autumn (Fu et al., 2021). The structure of the phytoplankton community is one of the most important biological factors that induce seasonal variations in the distribution of DMS. The results of correlation analysis between the concentrations of DMS and DMSP in the surface and the biological factors in BS and NYS in summer are depicted in Table 3. The results demonstrated that the concentrations of DMS and DMSPd were positively correlated with the levels of Chl-a. The concentrations of DMS were significantly positively correlated with the levels of DMSPd but not with those of DMSPp. The concentration of DMSPd was positively correlated with that of DMSPp. This results were similar to those obtained by Yan et al. (2018) and could be attributed to the high biomass of phytoplankton, which results in the higher yield of DMSP (Yan et al., 2018). These factors significantly increased the concentration of DMS in summer; however, Yan et al. (2018) opined that the consumption of DMSPd can promote the production of DMSPp to a certain extent. Additionally, the results of correlation analysis demonstrated that the concentration of DMSPp was significantly positively correlated with the abundance of dinoflagellates, due to the fact that dinoflagellates are one of the highest producers of DMSP and accounted for 10% of the total biomass of phytoplankton (Zhang et al., 2017; Fu et al., 2021). The abundance of Chrysophyceae was only high at stations B7, B9, B11, B24, and B27 in BS in summer; therefore, correlation analysis between the concentrations of DMS, DMSPp, and DMSPd, and the abundance of Chrysophyceae was not performed in this study. The concentrations of DMS were high at stations B7, B9, B11, B24, and B27, being 12.07, 11.07, 12.31, 18.71, and 16.09 nmol/L, respectively; however, the concentrations of DMSPp were lower, being 5.95, 3.62, 9.66, 3.76, and 0.67 nmol/L, respectively, and the concentrations of DMSPd were also lower, being 4.02, 1.83, 4.77, 3.67, and 4.97 nmol/L, respectively. The low concentrations of DMSPp and DMSPd could be related to the conversion of DMSP to DMS and other oxidation products (Zhai et al., 2018).
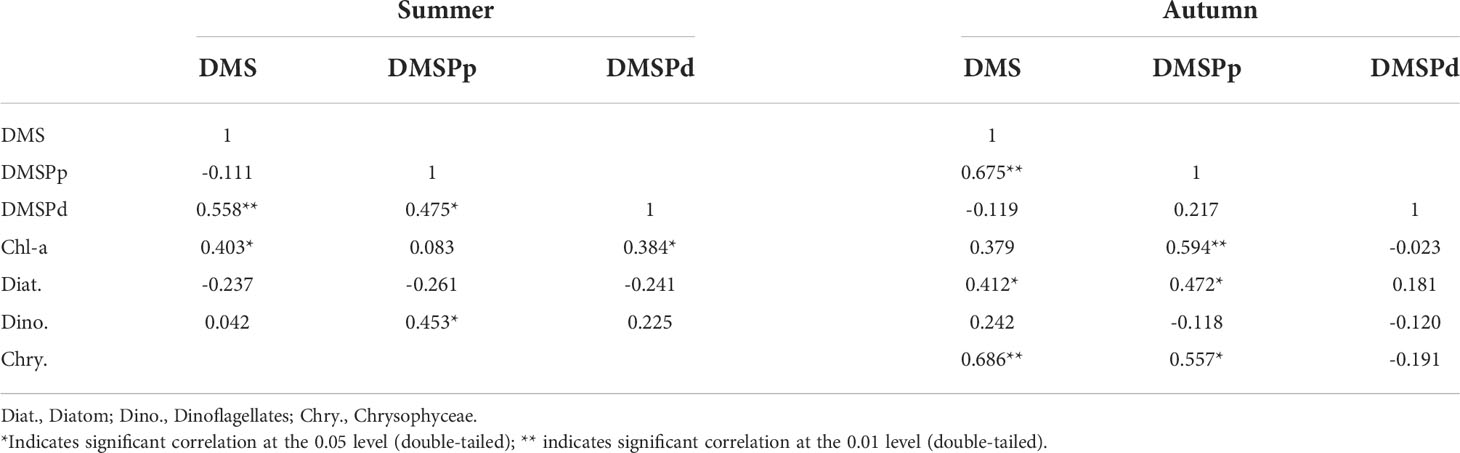
Table 3 Correlation between the concentration of DMS and DMSP and the biological factors in the surface waters of BS and NYS in summer and autumn.
The results of correlation analysis between the concentrations of DMS and DMSP and the biological factors in BS and NYS in autumn are depicted in Table 3. The concentrations of both Chl-a and DMS were significantly positively correlated with the concentration of DMSPp, which was generally similar to the results obtained by Yang et al. (2015a). However, there was no significant correlation between the concentrations of DMS and DMSPd, which could be attributed to the low-surface temperature of seawater that inhibited the conversion of DMSPd to DMS (Zhai et al., 2018). Additionally, the concentrations of DMS and DMSPp were significantly positively correlated with the abundance of diatoms and Chrysophyceae in autumn. These findings were consistent with the results of phytoplankton survey, which revealed that diatoms and Chrysophyceae accounted for 95% and 3%, respectively, of the total phytoplankton abundance (Fu et al., 2021). Although diatoms yield low quantities of DMS, they can also produce considerable quantities of DMS when their abundance is as high as the dominant algae in BS and NYS (Gao et al., 2017). Chrysophyceae produces high yields of DMS and DMSP, and an increased abundance of Chrysophyceae would increase the production of DMS and DMSP (Speeckaert et al., 2019). Overall, the results demonstrated that DMS and its precursors had different spatial distribution features resulting from alterations in the structure of phytoplankton community from summer to autumn.
4.3 Dominant factors affecting the distribution of DMS and DMSP
In order to explore the dominant factors that affect the distribution of DMS and DMSP, we employed the Canonical Correspondence Analysis (CCA) method for investigating the relationship between the concentration of DMS and DMSP and the environmental factors (temperature, salinity, DIN, and concentrations of phosphate and silicate) and biological factors (abundance of diatoms, dinoflagellates, and Chrysophyta in the 15 most dominant species) in summer and autumn, as depicted in Figure 10. In summer, the temperature and salinity were associated with the distribution of DMS, and the abundance of Chrysophyceae was the most important biological factor that affected the distribution of DMS. The distribution of DMSPd was influenced by the temperature, while that of DMSPp was affected by the abundance of dinoflagellate. The temperature and abundance of dinoflagellates were the most dominant environmental and biological factors, respectively, which affected the distribution of DMS and DMSP in summer. However, Yang et al. (2015b) showed that the distribution and concentration of DMS and DMSP are primarily affected by the abundance of diatoms. The differences in the results could be attributed to the increased abundance of dinoflagellates, despite the fact that diatoms were the dominant species (Fu et al., 2021). We observed that diatoms were the dominant species in autumn and was the main regulatory factor that affected the distribution of DMS and DMSP. Our study also revealed that the levels of PO43-, SiO32-, and DIN were related to the distribution of DMSPd. Therefore, the abundance of diatoms and the levels of PO43-, SiO32-, and DIN were the dominant environmental and biological factors that affected the distribution of DMS and DMSP in autumn. These findings were similar to the previous study, which reported that the abundance of diatoms and nutrient levels affected the distribution of DMS and DMSP in autumn (Yang et al., 2014; Yang et al., 2015a).
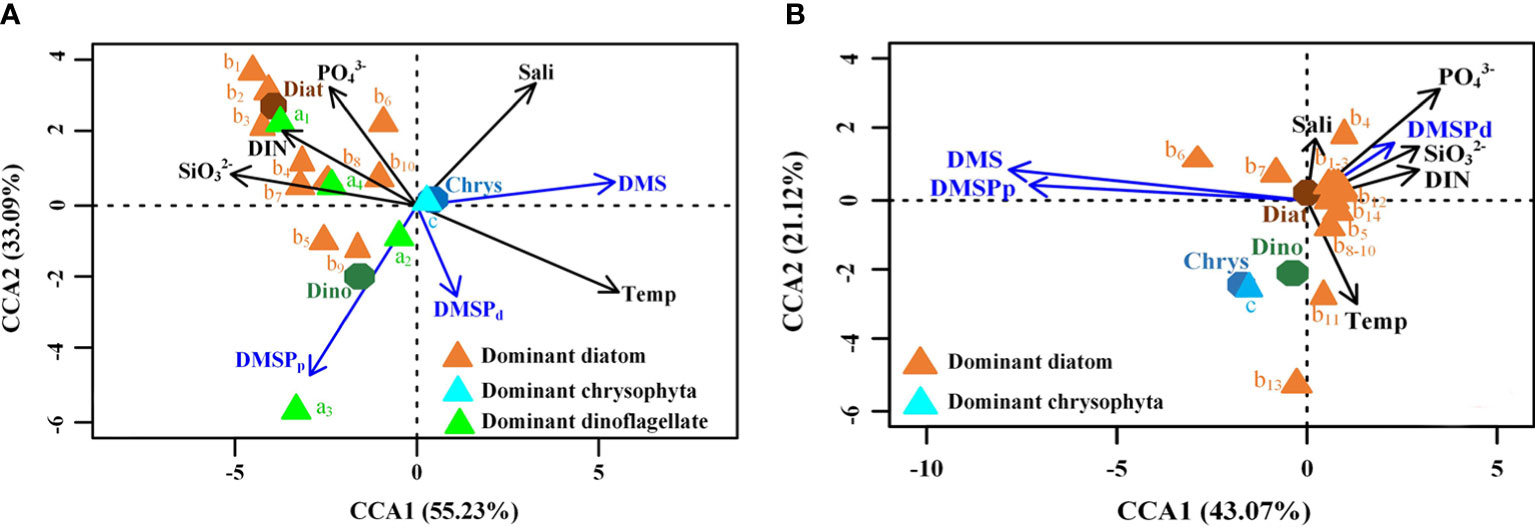
Figure 10 Ordination diagram obtained with CCA shows the correlation between phytoplankton species and environmental factors with the concentration of DMS and DMSP. A, B, and C represent dinoflagellates, diatoms, and Chrysophyceae, respectively, in (A) summer and (B) autumn.
Based on the dominant factors that affected the distribution of DMS, a schematic was prepared for providing a better understanding of the seasonal cycles in the concentrations of DMS (Figure 11). The rising temperatures not only upregulated the primary production of phytoplankton and altered the structure of the phytoplankton community, but also led to the unequal distribution of nutrients. This resulted in seawater stratification (SS), which promoted the reproduction of dinoflagellates in the study area in summer. The dominant diatoms and dinoflagellates enhanced the generation of DMS. The disappearance of SS and the decomposition of organic matter with the onset of autumn increased the nutrient concentration, which promoted the reproduction of diatoms. This resulted in the dominance of diatoms in certain regions, which resulted in a gradual decrease in the concentration of DMS in these areas. Taken together, the findings demonstrated that seasonal changes alter the structure of phytoplankton communities, which further drives the seasonal cycle of DMS.
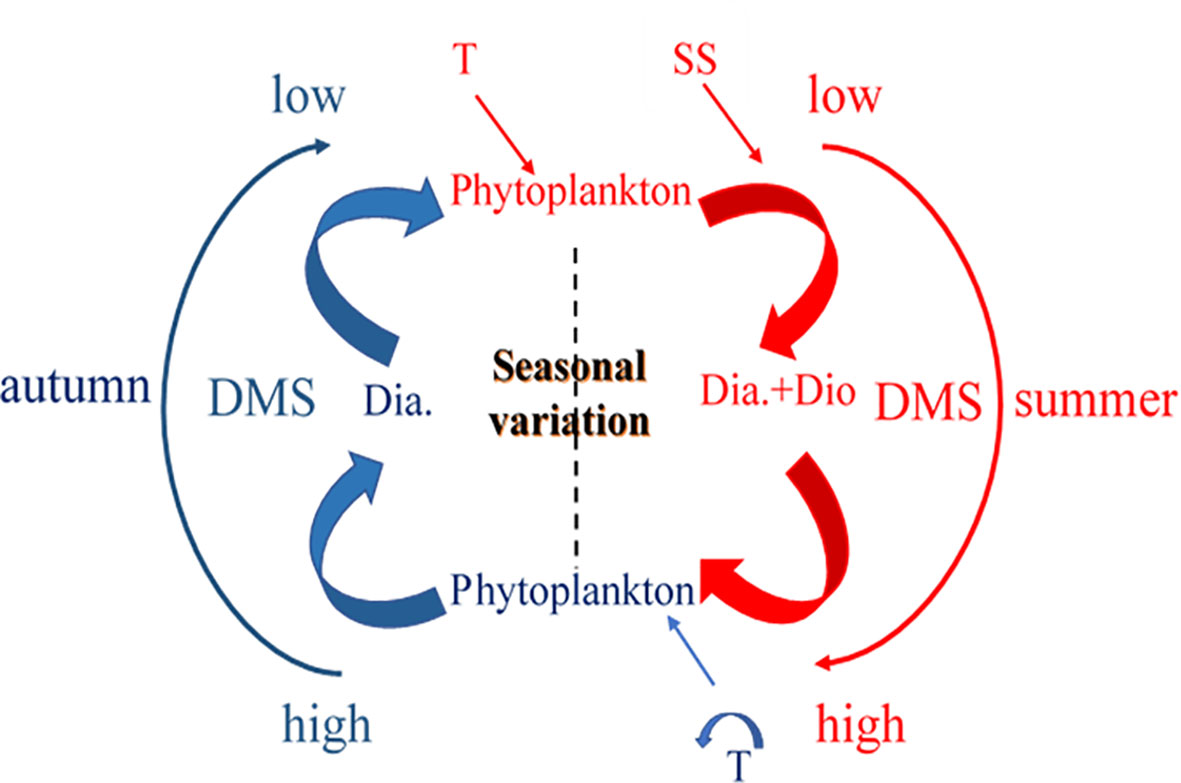
Figure 11 Schematic depicting the seasonal cycles in the concentrations of DMS in BS and NYS.
Data availability statement
The original contributions presented in the study are included in the article/Supplementary Material. Further inquiries can be directed to the corresponding authors.
Author contributions
LP and JS designed this study. ZL, TG, and DL performed the experiments. YG performed the experiments and analysis and wrote the manuscript and prepared the tables and figures. All authors edited the manuscript. All authors contributed to the article and approved the submitted version.
Funding
This study was supported by the National Key Research and Development Program of China (grant number: 2019YFC1407800), the National Natural Science Foundation of China (grant numbers: 41876134 and 41676112), the State Key Laboratory of Biogeology and Environmental Geology, China University of Geosciences (grant numbers: GKZ21Y645 and GKZ22Y656), the Scientific Research Project of Tianjin Municipal Education Commission (2017KJ013), and the Changjiang Scholar Program of Chinese Ministry of Education (grant number: T2014253) to JS.
Acknowledgments
The data and samples were collected onboard R/V “Beidou” implementing the open research cruise NORC2019-01, supported by NSFC Shiptime Sharing Project (project number: 41849901). The authors also express their gratitude to Prof. Weidong Zhai of Shandong University for supplying the data collected by the CTD sensor.
Conflict of interest
The authors declare that the research was conducted in the absence of any commercial or financial relationships that could be construed as a potential conflict of interest.
Publisher’s note
All claims expressed in this article are solely those of the authors and do not necessarily represent those of their affiliated organizations, or those of the publisher, the editors and the reviewers. Any product that may be evaluated in this article, or claim that may be made by its manufacturer, is not guaranteed or endorsed by the publisher.
Supplementary material
The Supplementary Material for this article can be found online at: https://www.frontiersin.org/articles/10.3389/fmars.2022.999350/full#supplementary-material
References
Bepari K. F., Shenoy D. M., Rao A. C., Kurian S., Gauns M. U., Naik B. R., et al. (2020). Dynamics of dimethylsulphide and associated compounds in the coastal waters of goa, west coast of India. J. Mar. Systems 207, 103228. doi: 10.1016/j.jmarsys.2019.103228
Boyce D. G., Lewis M. R., Worm B. (2010). Global phytoplankton decline over the past century. Nature. 466 (7306), 591–596. doi: 10.1038/nature09268
Boyd P. W., Rynearson T. A., Armstrong E. A., Fu F., Hayashi K., Hu Z., et al. (2013). Marine phytoplankton temperature versus growth responses from polar to tropical waters–outcome of a scientific community-wide study. PloS One 8 (5), e63091. doi: 10.1371/journal.pone.0063091
Charlson R. J., Lovelock J. E., Andreae M. O., Warren S. G. (1987). Oceanic phytoplankton, atmospheric sulphur, cloud albedo and climate. Nature. 326 (6114), 655–661. doi: 10.1038/326655a0
Curson A. R., Williams B. T., Pinchbeck B. J., Sims L. P., Martínez A. B., Rivera P. P. L., et al. (2018). DSYB catalyses the key step of dimethylsulfoniopropionate biosynthesis in many phytoplankton. Nat. Microbiol. 3 (4), 430–439. doi: 10.1038/s41564-018-0119-5
Darroch L. J., Lavoie M., Levasseur M., Laurion I., Sunda W. G., Michaud S., et al. (2015). Effect of short-term light-and UV-stress on DMSP, DMS, and DMSP lyase activity in emiliania huxleyi. Aquat. Microbial. Ecology 74 (2), 173–185. doi: 10.3354/ame01735
Deng Z., Zhao Y. (2020). Impact of tidal mixing on water mass properties and circulation in the bohai Sea: a typhoon case. J. Mar. Systems 206, 103338.1–103338.16. doi: 10.1016/j.jmarsys.2020.103338
Fu X., Sun J., Wei Y., Liu Z., Xin Y., Guo Y., et al. (2021). Seasonal shift of a phytoplankton (> 5 µm) community in bohai Sea and the adjacent yellow Sea. Diversity. 13 (2), 65. doi: 10.3390/d13020065
Gao N., Yang G.-P., Zhang H.-H., Liu L. (2017). Temporal and spatial variations of three dimethylated sulfur compounds in the changjiang estuary and its adjacent area during summer and winter. Environ. Chem. 14 (3), 160–177. doi: 10.1071/en16158
Gu T., Jia D., Wang Z., Guo Y., Xin Y., Guo C., et al. (2022). Regional distribution and environmental regulation mechanism of nitrous oxide in the bohai Sea and north yellow Sea: A preliminary study. Sci. Total Environ. 818, 151718. doi: 10.1016/j.scitotenv.2021.151718
Guo S., Sun J., Zhao Q., Feng Y., Huang D., Liu S. (2016). Sinking rates of phytoplankton in the changjiang (Yangtze river) estuary: A comparative study between prorocentrum dentatum and skeletonema dorhnii bloom. J. Mar. Systems 154, 5–14. doi: 10.1016/j.jmarsys.2015.07.003
Jarníková T., Dacey J., Lizotte M., Levasseur M., Tortell P. (2018). The distribution of methylated sulfur compounds, DMS and DMSP, in Canadian subarctic and Arctic marine waters during summer 2015. Biogeosciences. 15 (8), 2449–2465. doi: 10.5194/bg-15-2449-2018
Jian S., Zhang H.-H., Yang G.-P., Li G.-L. (2019). Variation of biogenic dimethylated sulfur compounds in the changjiang river estuary and the coastal East China Sea during spring and summer. J. Mar. Systems 199, 103222. doi: 10.1016/j.jmarsys.2019.103222
Kiene R. P., Linn L. J. (2000). Distribution and turnover of dissolved DMSP and its relationship with bacterial production and dimethylsulfide in the gulf of Mexico. Limnology Oceanography. 45 (4), 849–861. doi: 10.4319/lo.2000.45.4
Liu Y., Liu C.-Y., Yang G.-P., Zhang H.-H., Zhang S.-h. (2015). Biogeochemistry of dimethylsulfoniopropionate, dimethylsulfide and acrylic acid in the yellow Sea and the bohai Sea during autumn. Environ. Chem. 13 (1), 127–139. doi: 10.1071/en15025
Lomans B., van der Drift C., Pol A., Op den Camp H. (2002). Microbial cycling of volatile organic sulfur compounds. Cell. Mol. Life Sci. CMLS. 59 (4), 575–588. doi: 10.1007/s00018-002-8450-6
Michaud S., Levasseur M., Cantin G. (2007). Seasonal variations in dimethylsulfoniopropionate and dimethylsulfide concentrations in relation to the plankton community in the st. Lawrence estuary. Estuarine Coast. Shelf Science 71 (3-4), 741–750. doi: 10.1016/j.ecss.2006.09.020
Nagahata T., Kajiwara H., Ohira S.-I., Toda K. (2013). Simple field device for measurement of dimethyl sulfide and dimethylsulfoniopropionate in natural waters, based on vapor generation and chemiluminescence detection. Analytical Chem. 85 (9), 4461–4467. doi: 10.1021/ac303803w
Nightingale P. D., Malin G., Law C. S., Watson A. J., Liss P. S., Liddicoat M. I., et al. (2000). In situ evaluation of air-sea gas exchange parameterizations using novel conservative and volatile tracers. Global Biogeochemical Cycles 14 (1), 373–387. doi: 10.1029/1999gb900091
Omori Y., Tanimoto H., Inomata S., Ikeda K., Iwata T., Kameyama S., et al. (2017). Sea-To-air flux of dimethyl sulfide in the south and north pacific ocean as measured by proton transfer reaction-mass spectrometry coupled with the gradient flux technique. J. Geophysical Research: Atmospheres 122 (13), 7216–7231. doi: 10.1002/2017jd026527
Peng L., Guo Y., Gu T., Li H., Jian S., Jia D., et al. (2020). Benzene-assisted photoionization positive ion mobility spectrometry coupled with a time-resolved introduction for field detecting dimethyl sulfide in seawater. Analytical Methods 12 (43), 5168–5176. doi: 10.1039/d0ay01242d
Quinn P. K., Bates T. S. (2011). The case against climate regulation via oceanic phytoplankton sulphur emissions. Nature 480 (7375), 51–56. doi: 10.1038/nature10580
Smith M. J., Walker C. F., Bell T. G., Harvey M. J., Saltzman E. S., Law C. S. (2018). Gradient flux measurements of sea–air DMS transfer during the surface ocean aerosol production (SOAP) experiment. Atmospheric Chem. Physics. 18 (8), 5861–5877. doi: 10.5194/acp-18-5861-2018
Speeckaert G., Borges A. V., Champenois W., Royer C., Gypens N. (2018). Annual cycle of dimethylsulfoniopropionate (DMSP) and dimethylsulfoxide (DMSO) related to phytoplankton succession in the southern north Sea. Sci. Total Environ. 622, 362–372. doi: 10.1016/j.scitotenv.2017.11.359
Speeckaert G., Borges A. V., Gypens N. (2019). Salinity and growth effects on dimethylsulfoniopropionate (DMSP) and dimethylsulfoxide (DMSO) cell quotas of skeletonema costatum, phaeocystis globosa and heterocapsa triquetra. Estuarine Coast. Shelf Science 26, 106275.1–106275.10. doi: 10.1016/j.ecss.2019.106275
Tanimoto H., Kameyama S., Iwata T., Inomata S., Omori. Y. (2014). Measurement of air-sea exchange of dimethyl sulfide and acetone by PTR-MS coupled with gradient flux technique. Environ. Sci. Technology 48 (1), 526–533.
Turner S., Nightingale P., Broadgate W., Liss P. (1995). The distribution of dimethyl sulphide and dimethylsulphoniopropionate in Antarctic waters and sea ice. Deep Sea Res. Part II: Topical Stud. Oceanography 42 (4-5), 1059–1080. doi: 10.1016/0967-0645(95)00066-y
Wang S., Maltrud M. E., Burrows S. M., Elliott S.M., Cameron‐Smith P. (2018b). Impacts of shifts in phytoplankton community on clouds and climate via the sulfur cycle. Global Biogeochemical Cycles. 32 (6), 1005–1026. doi: 10.1029/2017gb005862
Wang S., Maltrud M., Elliott S., Cameron-Smith P., Jonko A. (2018a). Influence of dimethyl sulfide on the carbon cycle and biological production. Biogeochemistry. 138 (1), 49–68. doi: 10.1007/s10533-018-0430-5
Webb A., Van Leeuwe M., Os D.D., Meredith M., Venables H. J, Stefels J. (2019). Extreme spikes in DMS flux double estimates of biogenic sulfur export from the Antarctic coastal zone to the atmosphere. Sci. Rep. 9 (1), 1–11. doi: 10.1038/s41598-019-38714-4
Wei Y., Sun J., Zhang G., Wang X., Wang F. (2020). Environmental factors controlling the dynamics of phytoplankton communities during spring and fall seasons in the southern sunda shelf. Environ. Sci. Pollut. Res. 27 (18), 23222–23233. doi: 10.1007/s11356-020-08927-6
Wei Q., Wang B., Yao Q., Xue L., Sun J., Xin M., et al. (2019). Spatiotemporal variations in the summer hypoxia in the bohai Sea (China) and controlling mechanisms. Mar. Pollut. Bulletin. 138, 125–134. doi: 10.1016/j.marpolbul.2018.11.041
Welschmeyer N. A. (1994). Fluorometric analysis of chlorophyll a in the presence of chlorophyll b and pheopigments. Limnology Oceanography. 39 (8), 1985–1992. doi: 10.2307/2838404
Wu X., Tan T., Liu C., Li T., Liu X., Yang G. (2018). Distributions and relationships of CO2, O2, and dimethylsulfide in the changjiang (Yangtze) estuary and its adjacent waters in summer. J. Ocean Univ. China. 17 (2), 320–334. doi: 10.1007/s11802-018-3541-7
Yang G., Li C., Sun J. (2011). Influence of salinity and nitrogen content on production of dimethylsulfoniopropionate (DMSP) and dimethylsulfide (DMS) by skeletonema costatum. Chin. J. Oceanology Limnology 29 (2), 378–386. doi: 10.1007/s00343-011-0087-6
Yang G. P., Song Y. Z., Zhang H. H., Cao X., Yang G. (2014). Seasonal variation and biogeochemical cycling of dimethylsulfide (DMS) and dimethylsulfoniopropionate (DMSP) in the y ellow s ea and b ohai s ea. J. Geophysical Research: Oceans 119 (12), 8897–8915. doi: 10.1002/2014JC010373
Yang J., Yang G., Zhang H., Zhang S. (2015b). Spatial distribution of dimethylsulfide and dimethylsulfoniopropionate in the yellow Sea and bohai Sea during summer. Chin. J. Oceanology Limnology 33 (4), 1020–1038. doi: 10.1007/s00343-015-4188-5
Yang J., Yang G., Zhang H., Zhang S. (2016). Temporal variations of dimethylsulfide and dimethylsulfoniopropionate in the southern yellow Sea in spring and autumn. Acta Oceanologica Sinica. 35 (2), 76–87. doi: 10.1007/s13131-015-0780-y
Yang G.-P., Zhang S.-H., Zhang H.-H., Yang J., Liu C.-Y. (2015a). Distribution of biogenic sulfur in the bohai Sea and northern yellow Sea and its contribution to atmospheric sulfate aerosol in the late fall. Mar. Chem. 169, 23–32. doi: 10.1016/j.marchem.2
Yan S., Na J., Zhang H., Cao X., Yang G. (2018). Study on concentrations distributions of dimethylated sulfur compounds and their transformation rates in the yellow Sea and the bohai Sea. HaiyangXuebao. 40 (10), 84–95. doi: 10.3969/j.issn.0253-4193.2018.10.009
Yuan M., Sun J., Zhai W. (2014). Phytoplankton community in bohai Sea and the north yellow Sea in autumn 2012. J. Tianjin Univ. Sci. Technology. 29, 56–64. doi: 10.13364/j.issn.1672-6510.2014.06.012
Zhai X., Zhang H.-H., Yang G.-P., Li J.-L., Yuan D. (2018). Distribution and sea-air fluxes of biogenic gases and relationships with phytoplankton and nutrients in the central basin of the south China Sea during summer. Mar. Chem. 200, 33–44. doi: 10.1016/j.marchem.2018.01.009
Zhai W., Zhao H., Zheng N., Xu Y. (2012). Coastal acidification in summer bottom oxygen-depleted waters in northwestern-northern bohai Sea from June to august in 2011. Chin. Sci. Bulletin 57 (9), 1062–1068. doi: 10.1007/s11434-011-4949-2
Zhang X.-H., Liu J., Liu J., Yang G., Xue C.-X., Curson A. R., et al. (2019). Biogenic production of DMSP and its degradation to DMS–their roles in the global sulfur cycle. Sci. China Life Sci. 62 (10), 1296–1319. doi: 10.1007/s11427-018-9524-y
Zhang S.-H., Sun J., Liu J.-L., Wang N., Zhang H.-H., Zhang X.-H., et al. (2017). Spatial distributions of dimethyl sulfur compounds, DMSP-lyase activity, and phytoplankton community in the East China Sea during fall. Biogeochemistry 133 (1), 59–72. doi: 10.1007/s10533-017-0308-y
Zhang H., YanFang L., Cheng T., Tao Z., Jing Y., Kai G. (2016). Spatial characteristics and formation mechanisms of bottom hypoxia zone in the bohai Sea during summer (in Chinese). Chin. Sci. Bulletin 61 (14), 1612–1620. doi: 10.1360/N972015-00915
Zhang S.-H., Yang G.-P., Zhang H.-H., Yang J. (2014). Spatial variation of biogenic sulfur in the south yellow Sea and the East China Sea during summer and its contribution to atmospheric sulfate aerosol. Sci. Total Environ. 488, 157–167. doi: 10.1016/j.scitotenv.2014.04.074
Zhao H.-D., Kao S.-J., Zhai W.-D., Zang K.-P., Zheng N., Xu X.-M., et al. (2017). Effects of stratification, organic matter remineralization and bathymetry on summertime oxygen distribution in the bohai Sea, China. Continental Shelf Res. 134, 15–25. doi: 10.1016/j.csr.2016.12.004
Zubkov M. V., Fuchs B. M., Archer S. D., Kiene R. P., Amann R., Burkill P. H., et al. (2001). Linking the composition of bacterioplankton to rapid turnover of dissolved dimethylsulphoniopropionate in an algal bloom in the north Sea. Environ. Microbiol. 3 (5), 304–311. doi: 10.1046/j.1462-2920.2001.00196.x
Keywords: dimethyl sulfide, the Bohai Sea and North Yellow Sea, BAPI-PIMS, the key impact factors, seasonal variations
Citation: Guo Y, Peng L, Liu Z, Fu X, Zhang G, Gu T, Li D and Sun J (2022) Study on the seasonal variations of dimethyl sulfide, its precursors and their impact factors in the Bohai Sea and North Yellow Sea. Front. Mar. Sci. 9:999350. doi: 10.3389/fmars.2022.999350
Received: 20 July 2022; Accepted: 22 August 2022;
Published: 15 September 2022.
Edited by:
Jie Xu, University of Macau, ChinaCopyright © 2022 Guo, Peng, Liu, Fu, Zhang, Gu, Li and Sun. This is an open-access article distributed under the terms of the Creative Commons Attribution License (CC BY). The use, distribution or reproduction in other forums is permitted, provided the original author(s) and the copyright owner(s) are credited and that the original publication in this journal is cited, in accordance with accepted academic practice. No use, distribution or reproduction is permitted which does not comply with these terms.
*Correspondence: Jun Sun, cGh5dG9wbGFua3RvbkAxNjMuY29t; Liying Peng, MjAwNjI5NDA0N3BlbmdAMTYzLmNvbQ==